A Potential Progenitor for the Type Ic Supernova 2017ein
Abstract
We report the first detection of a credible progenitor system for a Type Ic supernova (SN Ic), SN 2017ein. We present spectra and photometry of the SN, finding it to be similar to carbon-rich, low-luminosity SNe Ic. Using a post-explosion Keck adaptive optics image, we precisely determine the position of SN 2017ein in pre-explosion HST images, finding a single source coincident with the SN position. This source is marginally extended, and is consistent with being a stellar cluster. However, under the assumption that the emission of this source is dominated by a single point source, we perform point-spread function photometry, and correcting for line-of-sight reddening, we find it to have mag and = mag. This source is bluer than the main sequence and brighter than almost all Wolf-Rayet stars, however it is similar to some WC+O- and B-star binary systems. Under the assumption that the source is dominated by a single star, we find that it had an initial mass of . We also examined binary star models to look for systems that match the overall photometry of the pre-explosion source and found that the best-fitting model is a + close binary system in which the star is stripped and explodes as a lower mass star. Late-time photometry after the SN has faded will be necessary to cleanly separate the progenitor star emission from the additional coincident emission.
keywords:
stars: evolution — supernovae: general — supernovae: individual (SN 2017ein)1 INTRODUCTION
In the past three decades, there have been over detections of pre-explosion counterparts to core-collapse supernovae (SNe; for a review, see Smartt, 2009). Most of these counterparts are red supergiant (RSG) progenitor stars of Type II-P SNe (SNe with a “plateau” in their light curves consistent with recombination emission from an extended hydrogen envelope), which agrees with predictions from star formation and stellar evolution that suggest low-mass RSG progenitors stars should be relatively common.
There are, however, mixed results in finding the progenitor systems of other SN sub-types, with identified progenitor systems for some SNe IIn (SNe with narrow lines of hydrogen in their spectra, e.g., SNe 2005gl and 2009ip; Gal-Yam et al., 2007; Smith et al., 2010) and SNe IIb (SNe with transient hydrogen lines in their spectra, with progenitor star detections for SNe 1993J, 2008ax, 2011dh, 2013df, and 2016gkg; Aldering et al., 1994; Woosley et al., 1994; Crockett et al., 2008; Maund et al., 2011; Van Dyk et al., 2014; Dessart et al., 2011, 2015; Kilpatrick et al., 2017). The progenitor stars of SNe Ib/c (which have no hydrogen in their spectra, or helium in the case of SNe Ic) have been comparatively elusive and only one credible pre-explosion counterpart has been identified so far in the literature (the SN Ib iPTF13bvn; Cao et al., 2013).
In part, the paucity of pre-explosion SN counterparts for SNe Ib/c is because they only make up 20% of transients discovered in volume-limited surveys (e.g., LOSS; Li et al., 2000, 2011; Smith et al., 2011; Shivvers et al., 2017), and the incidence of SNe with deep, high-resolution pre-explosion imaging is even smaller. However, as more nearby SNe are discovered, especially those with pre-explosion Hubble Space Telescope (HST) imaging, the growing sample of upper limits on SN Ic progenitor systems in particular has placed strong constraints on predictions from stellar evolution and SN explosion models (with deep limits on counterparts for SNe 2002ap, 2004gt, and 2007gr; Gal-Yam et al., 2005; Crockett et al., 2007, 2008; Maund & Ramirez-Ruiz, 2016). This evidence suggests that some non-RSG SN progenitor stars are either intrinsically less luminous than RSGs or heavily obscured by dust in the HST optical bands typically available for pre-explosion imaging. These stars may highly-stripped by stellar winds, and although they may be comparable in luminosity to RSGs, their SEDs peak predominantly in the ultraviolet (and outside of optical or infrared bands in which pre-explosion imaging is typically available; for a review of SN Ib/c progenitor studies see Eldridge et al., 2013). Dust obscuration is a distinct possibility for high-mass SN progenitor stars, as some high-mass RSGs are observed to have optically thick circumstellar dust (e.g., SN 2012aw; Kochanek et al., 2012). In addition, high-mass SN progenitor stars ought to explode promptly, perhaps close to the dusty environments where they form (see, e.g., analysis of SN environments in Kuncarayakti et al., 2013; Galbany et al., 2016, 2017).
Because SNe Ic are the explosions of massive stars without significant hydrogen or helium in their outer layers, their progenitor star must be significantly stripped by stellar winds or a companion star. Highly-stripped Wolf-Rayet (WR) stars are therefore good candidates for SN Ic progenitor stars (Yoon et al., 2010; Yoon et al., 2012; Yoon, 2017). WR stars undergo radiatively-driven mass loss at rates exceeding (although exact mass-loss rates are highly uncertain; Maeder & Meynet, 1987; Hamann et al., 1995; Smith, 2014), and so observational and theoretical evidence suggest that some pre-SN WR stars ought to be hydrogen- and helium-deficient (Podsiadlowski et al., 2002; Woosley et al., 1993; Steiner & Oliveira, 2005).
However, radiatively-driven winds are highly metallicity-dependent and WR stars tend to form in high-metallicity environments; indeed, the Small Magellanic Cloud exhibits a decreased WR-to-O-star ratio relative to Solar neightborhood (Hainich et al., 2015). Predicted mass-loss rates for WR stars at Solar metallicities indicate that single WR stars may have high pre-SN masses (Meynet & Maeder, 2005) and very few of these stars are predicted to be helium-poor (e.g., Yoon, 2015a). This finding is in tension with predictions that they are SN Ic progenitor stars given SN Ic rates and their typical ejecta masses (Drout et al., 2011; Taddia et al., 2015). One alternative is that, if WR stars are a likely channel for producing SNe Ic, most SN progenitor systems are interacting binaries in which a WR star has been stripped by a companion. This hypothesis is supported by the fact that many late-type WR stars are observed to be in close binaries with O-type stars (e.g., WR 104; Tuthill et al., 1999) as well as the fact that the overall binary fraction for Milky Way WR stars is 40% (van der Hucht, 2001). If SNe Ic mostly come from low-mass WR stars in close binaries or in dusty environments, this would explain their non-detection in optical pre-explosion imaging to date, and so examples with deep detection limits can be used to verify or rule out this possibility.
In this paper we discuss the SN Ic 2017ein discovered in NGC 3938 on 2017 May 25 by Arbour (2017). Deep imaging starting 2 days before discovery and continuing for 2 weeks afterward indicated that SN 2017ein rose quickly after discovery (Im et al., 2017), which suggests that it was discovered very soon after explosion.
Here we report photometry, spectroscopy, and high-resolution adaptive optics imaging of SN 2017ein. We demonstrate that SN 2017ein is most consistent with carbon-rich SNe Ic, although the source exhibits strong Na i D lines at the redshift of NGC 3938 and is significantly reddened. We use relative astrometry between our high-resolution and pre-explosion imaging, we find a single, luminous, blue source consistent with being the progenitor system of SN 2017ein, although that source appears extended and may be a blend of multiple point sources. By comparing this source to Galactic supergiants and evolutionary tracks, we investigate channels that could produce the SN 2017ein progenitor system.
While we were preparing this manuscript, Van Dyk et al. (2018) published another analysis of SN 2017ein and its pre-explosion imaging. The authors came to similar conclusions about the nature of SN 2017ein and its photometric and spectroscopic similarity to carbon-rich SNe Ic. They identified the same source in pre-explosion imaging as the potential progenitor system of SN 2017ein and concluded the SN likely had a very massive () progenitor star.
2 OBSERVATIONS
2.1 Archival Data
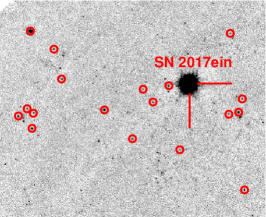
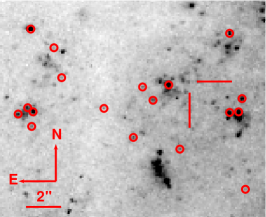
We obtained archival imaging of NGC 3938 from the HST MAST Archive111https://hla.stsci.edu/hla_faq.html from 11 December 2007 (Cycle 15, Proposal 10877, PI Li). The HST data were obtained with WFPC2 and consisted of two frames each of and totaling s and s, respectively. We obtained the individual c0m frames, which had been calibrated with the latest reference files, including corrections for bias, dark current, flat-fielding, and bad-pixel masking. The images were combined using the DrizzlePac222http://drizzlepac.stsci.edu/ software package, which performs cosmic ray rejection, and final image combination using the Drizzle algorithm. The final drizzled images had a pixel scale of , which is consistent with the native pixel scale of the WF2 array where SN 2017ein landed. Using these final drizzled images as a reference, we used dolphot on the individual WFPC2/c0m frames with parameters optimised for the WF arrays on HST/WFPC2. These parameters were typically those recommended for dolphot WFPC2 analysis333http://americano.dolphinsim.com/dolphot, but with local measurements of the sky background and slightly larger aperture radius444i.e., and . This method is more accurate for faint sources in crowded fields and where non-uniform background emission can contaminate the PSFs for individual sources, as may be the case for SN 2017ein. Our combined HST image is shown in Figure 1.
2.2 Adaptive Optics Imaging
We observed SN 2017ein in band in imaging mode with the OH-Suppressing Infrared Imaging Spectrograph (OSIRIS; Larkin et al., 2006) on the Keck-I 10-m telescope in conjunction with the laser guide star adaptive optics (LGSAO) system on 6 June 2017. These data consisted of 2 individual frames each with 10 co-adds of for an effective exposure time of per frame or total. The individual frames were corrected for pixel-to-pixel variations using a flat-field frame that was created from observations of a uniformly illuminated flat-field screen in the same instrumental setup and filter. We modeled and subtracted the sky background emission in each pixel by taking the median pixel value in a box centered on that pixel and with a width of 63 pixels (roughly 6% the image size or 1.3″). We masked the individual frames in order to remove bad pixels, cosmic rays, and other image artifacts.
Images taken with OSIRIS have known geometric distortions. Therefore, we calculated a distortion correction from observations of the globular cluster M92 observed on 2013 February 13 in band. These data were reduced using the procedure outlined above, including corrections for flat-fielding using dome flats taken on the same night and in the same configuration. We identified 65 stars common to the Gaia DR1 catalog555http://gea.esac.esa.int/archive/ and 20 frames of OSIRIS imaging, 15 of which were observed with a position angle (PA) = 0∘ and 5 of which were observed with PA = 45∘. We fit a fifth-order polynomial to the differences and coordinate values resulting from a generalized fit of the OSIRIS imaging to the Gaia DR1 coordinates. From this fit, we calculated a distortion correction for the OSIRIS imager666https://ziggy.ucolick.org/ckilpatrick/osiris.html. The standard deviation of the residual offsets of the common sources in the M92 frames was and .
Using these geometric distortion corrections, we resampled the SN 2017ein frames to a corrected grid. Finally, we aligned the individual frames using an offset calculated from the position of the SN and combined them. In Figure 1, we show the final OSIRIS imaging along with a reference HST/WFPC2 image of NGC 3938.
2.3 Photometry
We observed SN 2017ein with SINISTRO imaging on the 1-m McDonald Observatory Node on the Las Cumbres Global Telescope Network (LCOGTN) from 27 May 2017 to 11 July 2017. These data were reduced using the Obsevatory Reduction and Acquisition Control Data Reduction pipeline (ORAC-DR; Jenness et al., 2015) using estimates of the instrumental bias, dark current, and sky flats obtained on the same night and in the same instrumental configuration. We performed PSF photometry on the final, calibrated frames using sextractor with a PSF constructed empirically from isolated stars in each frame. Using instrumental magnitudes from our PSF-fit photometry, we calibrated our measurements with measurements of standard stars from the Pan-STARRS1 (PS1) object catalog (Chambers et al., 2016; Flewelling et al., 2016).
In addition, we observed SN 2017ein with imaging using the Direct CCD on the Nickel 1-m Telescope at Lick Observatory, California. These data were reduced using the photpipe image reduction and photometry package. photpipe is a well-tested and robust pipeline used in several large-scale, optical surveys (e.g., PS1 and SuperMACHO; Rest et al., 2005, 2014). We used photpipe to perform bias-subtraction and flat-fielding then registered the individual images. Finally, we constructed a PSF for each image with DoPhot (Schechter et al., 1993) using isolated stars in the field and then measured instrumental magnitudes for all point sources in the image. The instrumental magnitudes were calibrated using magnitudes from stars in the PS1 object catalog with transformations from Jester et al. (2005).
We also obtained 8 epochs of Swift Ultraviolet/Optical Telescope (UVOT) imaging of SN 2017ein from the Swift data archive777https://swift.gsfc.nasa.gov/archive/. The HST images demonstrate that SN 2017ein is close to several clusters and so the structure of the background near the SN is complex. Therefore, we performed PSF photometry on the UVOT imaging using sextractor with instrumental PSF derived from isolated stars in each UVOT image. For images in which we detected SN 2017ein, we derived magnitudes using zero points from the most recent UVOT calibrations888https://heasarc.gsfc.nasa.gov/docs/heasarc/caldb/.

Swift/UVOT
MJD
57900.51
18.177(130)
—
16.922(069)
57915.46
—
16.472(028)
15.305(069)
57923.03
—
17.056(031)
15.846(036)
57927.82
18.552(152)
17.457(039)
16.137(040)
57933.99
18.972(259)
17.768(082)
16.670(050)
57937.84
19.113(299)
—
16.759(057)
57945.28
—
—
16.897(058)
57949.87
—
18.215(172)
17.109(066)
57955.39
—
—
17.252(256)
Nickel
| MJD | ||||
|---|---|---|---|---|
| 57901.30 | 17.281(014) | 16.613(010) | 16.609(010) | 16.488(011) |
| 57902.22 | 17.094(013) | 16.491(009) | 16.317(007) | 16.371(010) |
| 57907.25 | 15.956(008) | 15.425(008) | 15.506(009) | 15.352(009) |
| 57909.26 | 15.826(011) | 15.237(008) | 15.303(008) | 15.118(009) |
| 57930.23 | 17.552(028) | 16.295(018) | 15.873(010) | 15.401(010) |
| 57934.24 | 17.826(038) | 16.709(020) | 15.992(015) | 15.569(013) |
| 57955.20 | 18.375(079) | 17.169(150) | 16.651(011) | — |
| 57957.20 | 18.396(076) | 17.216(145) | 16.702(021) | — |
LCOGT
| MJD | ||
|---|---|---|
| 57900.22 | — | 16.903(018) |
| 57901.12 | 16.763(030) | 16.620(024) |
| 57902.12 | 16.542(024) | 16.351(022) |
| 57914.14 | 15.488(027) | 15.192(016) |
| 57915.15 | 15.508(017) | 15.201(009) |
| 57926.19 | 16.070(024) | 15.558(010) |
| 57935.16 | 16.804(042) | 15.987(020) |
| 57937.12 | 16.915(082) | 16.319(034) |
| 57946.14 | — | 16.580(028) |
2.4 Spectroscopy
We observed SN 2017ein over multiple epochs (Table 2) with the Kast double spectrograph on the 3-m Shane telescope at Lick Observatory, California. The 2.0″ slit was used and the 452/3306 grism on the blue side and 300/7500 grating on the red side in conjunction with the d57 dichroic for an approximate effective spectral range of 3400–11000 Å and a spectral resolution of in each epoch. In each epoch, we aligned the slit to the parallactic angle to minimise the effects of atmospheric dispersion (Filippenko, 1982). We performed standard reductions, including bias-subtraction and flat-fielding, on the two-dimensional (2D) spectra using pyraf. We extracted the one-dimensional (1D) spectra on the blue and red sides using the pyraf task apall. Wavelength calibration was performed on these 1D spectra images using calibration-lamp exposures taken in the same instrumental setup and configuration. We derived a sensitivity function and performed flux calibration using a standard star spectrum obtained on the same night and in the same setup as our SN 2017ein spectra. Finally, we combined the calibrated 1D spectra using a 100 Å overlap region between the red and blue side spectra. We de-reddened each spectrum by mag to account for Milky Way reddening and removed the recession velocity of NGC 3938 ( km s-1). The final Kast spectra are presented in Figure 3.
| MJD | Phase | Telescope/ | Range | Grism/ | Exposure | |
|---|---|---|---|---|---|---|
| Instrument | Grating | |||||
| (Å) | (s) | |||||
| 57902.38 | 7 | Keck/LRIS | 3120–10200 | 700 | B600/R400 | 600 |
| 57906.18 | 4 | Shane/Kast | 3400–10800 | 400 | B300/R452 | 1200 |
| 57926.28 | 16 | Shane/Kast | 3400–11000 | 400 | B300/R452 | 1200 |
| 57929.24 | 19 | Keck/ESI | 4051–10116 | 6000 | Echellette | 300 |
| 57934.17 | 24 | Mayall/KOSMOS | 4160–10000 | 700 | B2K/R2K | 900/900 |
| 57937.23 | 27 | Shane/Kast | 3400–10800 | 400 | B300/R452 | 1200 |
| 57956.21 | 46 | Shane/Kast | 3400–10959 | 400 | B300/R452 | 1200 |
| 57961.17 | 51 | Mayall/KOSMOS | 4180–10000 | 700 | B2K/R2K | 900/900 |
We also observed SN 2017ein with the Low Resolution Imaging Spectrograph (LRIS) on the Keck-I telescope on 2017 May 29. We used the 600/4000 grism on the blue side and 400/8500 grating on the red side in conjunction with the D560 dichroic and the 1.0″ long slit, which provides a spectral resolution of . SN 2017ein was observed at the parallactic angle at an airmass of 1.47. The LRIS spectrum was reduced using standard techniques and our own IDL routines (as described in Foley et al., 2003). We used a spectrum of the spectrophotometric standard HZ 44 on the blue side and BD+174708 on the red side to flux-calibrate our data and remove telluric lines from the final spectrum. This spectra are shown in Figure 3.
In addition, we observed SN 2017ein on 2017 June 30 and July 27 with KOSMOS on the KPNO 4-m telescope on Kitt Peak, Arizona. We used the 4-pixel (1.2″) red slit in a blue setup with the B2K Volume Phase Holographic (VPH) grism (3800–6600 Å) and a red setup with the R2K VPH grism (5800–9400 Å). In this setup, the spectral resolution is on both sides. In the blue and red setups, we used the GG395 and OG530 order-blocking filters, respectively. In both epochs, we integrated for 900 s in the blue and red setups and aligned the slit with the parallactic angle to minimise atmospheric dispersion. We performed similar reductions to the spectra described above, and the final spectra are shown Figure 3.
Finally, we observed SN 2017ein with the Echellette Spectrograph and Imager (ESI) on the Keck-II telescope on 2017 June 24. We used the 0.5″ slit with ESI and the seeing was around 0.5–0.6″ during observations. We observed in the echellette mode, with a spectral resolution of . These observations were reduced using the ESIRedux IDL package (Prochaska et al., 2003)999https://www2.keck.hawaii.edu/inst/esi/ESIRedux, including bias-subtraction, flat-fielding, and aperture extraction of each order using a boxcar aperture. ESIRedux automatically applies heliocentric and barycentric corrections to the extracted spectra, and so the final spectrum is given in vacuum wavelength. We calibrated each order using a wavelength solution derived from a ArXeHg lamp spectrum observed in the same instrumental configuration. We calculated a sensitivity function for each order using a spectrum of BD+28 4211 observed on the same night and at a similar airmass to the SN 2017ein spectrum. After flux calibrating each order, we combined the individual orders by taking the inverse-variance weighted average of the overlap region between the orders. The final spectrum is shown in Figure 3.
3 RESULTS AND DISCUSSION
3.1 Light Curves of SN 2017ein
In Figure 2, we show our full light curves of SN 2017ein along with comparisons to light curves of SN 2007gr (Bianco et al., 2014) transformed using equations in Jester et al. (2005) to . The light curves are all shown in the AB magnitude system and Milky Way extinction has been removed. The comparison SN 2007gr light curves are shifted to match SN 2017ein.
Based on our comparison to SN 2007gr, we determine that SN 2017ein peaked around with an apparent -band magnitude of mag. Removing Milky Way extinction and at the distance of NGC 3938, this value corresponds to a peak -band absolute magnitude of 16.00.2 mag. Without a significant level of host extinction, this luminosity implies a relatively faint SN Ic, which typically peak from to mag (Drout et al., 2011; Bianco et al., 2014). Even if SN 2017ein was near the bottom of the SN Ic luminosity function derived in Drout et al. (2011) and identical to SN 2007gr (e.g., with mag), its host extinction would be at least mag. With this host extinction, SN 2017ein had a peak -band luminosity dimmer than of SNe Ic, which have a median -band peak luminosity of mag (Figure 4). For example, the spectroscopically normal SN Ic 2011bm peaked at around mag (Valenti et al., 2012) whereas the SN Ic 2004aw peaked at around mag and is closer to the median for SN Ic in terms of -band magnitude (Taubenberger et al., 2006). Although there is a wide range of diversity in SNe Ic, SN 2017ein and SN 2007gr appear to be at the bottom of the -band luminosity distribution.

We also compared the host and Milky Way extinction-corrected color curve of SN 2007gr to the Milky Way extinction-corrected color curve of SN 2017ein. The difference in colors is mag on average, although there is some evidence that the evolution in color for SN 2017ein and SN 2007gr is different. If we take this difference to be the value of due to extinction in NGC 3938 and assume that the dust is Milky Way-like (i.e, with ), we find that the total host extinction is mag. However, this host extinction estimate is subject to significant uncertainties, not least the assumption that the overall SN 2017ein light curve is SN 2007gr-like and the total-to-selective extinction ratio . If we assume a high value of then mag. In other respects, the evolution of the SN 2017ein light curves is typical for SNe Ic. We measure a in band of mag, which is nominally smaller but still in agreement with most other SNe Ic including SN 2007gr (e.g., Drout et al., 2011; Bianco et al., 2014).
3.2 Spectra of SN 2017ein
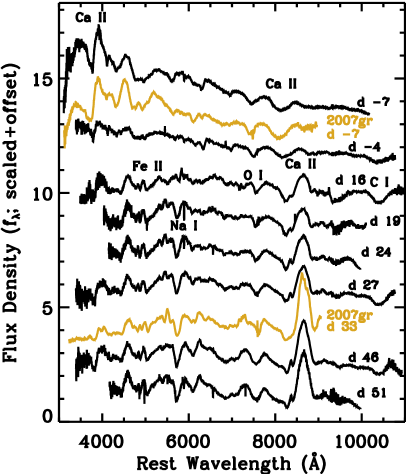
In Figure 3, we compare our spectra of SN 2017ein to spectra of the SN Ic 2007gr (in gold, from Valenti et al., 2008). The comparison spectra have been de-reddened and their recession velocities have been removed according to the extinction and redshift information in Valenti et al. (2008). For each spectrum, we indicate the epoch relative to the epoch of -band maximum light. We have also de-reddened SN 2017ein by mag to account for host reddening.
At early times, it is evident that the continuum of SN 2017ein is similar to that of SN 2007gr given our choice for reddening in NGC 3938, which again indicates that SN 2017ein has a significant amount of exintction from its host galaxy. Beyond this trend, there is clear overlap between SN 2007gr and SN 2017ein in the level of calcium and, especially, C ii 7235 absorption at early times (Figure 5). These features fade over time, consistent with a decrease in temperature in the SN photosphere as it expands. However, the similarity in the strength of this feature between SN 2007gr and SN 2017ein is noteable, especially as this carbon feature is usually weak or absent in other well-studied SNe Ic (see discussion in Valenti et al., 2008). We also note the presence of C i around Å in our day 17 and 27 spectra with a weaker feature in the day 4 spectrum. This evolution is consistent with a decrease in temperature in the SN 2017ein photosphere as the carbon becomes neutral. Beyond these features, SN 2017ein exhibits prominent emission lines of Fe and Ca in its post-maximum spectra. These features are also consistent with SN 2007gr and other SNe Ic as the SN photosphere reveals the inner layers of ejecta.
In Figure 5, we compare our spectrum of SN 2017ein from one week before -band maximum to those of SN 2011bm (which is a spectroscopically “normal” SN Ic; Valenti et al., 2012) and SN 2007gr (Valenti et al., 2008). These spectra have been de-reddened and their host velocities have been removed, and we de-reddened SN 2017ein by our preferred value of mag (discussed below in Section 3.3) such that the continuum matches the comparison spectra. We note the similarity between SN 2007gr and SN 2017ein at this stage, especially in the presence of C ii absorption, which is blueshifted in SN 2017ein to a velocity of 12,000 km s-1. We identify C ii 4267, 6580, and 7235 Å as well as a possible detection of C ii 3920 Å, although this latter feature is blended with Ca H&K. Valenti et al. (2008) noted the presence of these features in SN 2007gr, and it is clear from Figure 5 that C ii is relatively strong in SN 2007gr at a similar epoch as SN 2017ein. At the same time, it is clear that the SN Ic 2011bm exhibits little or no evidence for strong carbon absorption, and so SN 2017ein may be relatively carbon-rich or else viewed at an angle such that carbon absorption was seen.
Does the presence of these carbon features reflect a high intrinsic carbon abundance or is it simply an effect of the ionisation state in the ejecta? Mazzali et al. (2010) suggest that the presence of strong carbon features in SN 2007gr reflect a high intrinsic carbon-to-oxygen ratio in the ejecta. However, carbon was still ionised at this epoch indicating that the ejecta were still hot. Therefore, at one week before maximum light, we are only seeing through the outermost layers of ejecta as most of the SN is still optically thick to electron scattering. Late-time nebular spectra will be critical for evaluating the intrinsic carbon abundance in SN 2017ein and determining whether the similarity to SN 2007gr reflects an intrinsically high carbon abundance.

3.3 Na I D Equivalent Width and an Estimate of the Host Extinction
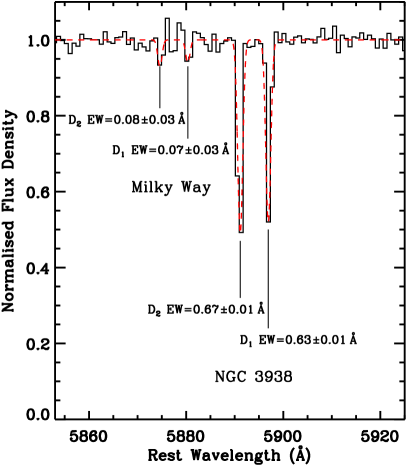
In addition to the unusual continuum shape, there is evidence of significant reddening in our spectra in the strong Na i D features redshifted to the velocity of NGC 3938. These lines are well-resolved in our Keck/ESI spectrum (Figure 6), where we estimate the equivalent width (EW) of the features at the velocity of NGC 3938 to be EW Na i D Å and Na i D Å, for a combined EW of DD Å. Following the relation for Milky Way-like dust in Poznanski et al. (2012), we find mag. We also measure the Na I D EW from Milky Way lines in the ESI spectrum, which is consistent with the reddening value from Schlafly & Finkbeiner (2011).
The NGC 3938 reddening value is significantly larger (at ) than the value derived by comparing the SN 2017ein and SN 2007gr color curves. It is possible that this discrepancy reflects an intrinsic difference between the SN 2017ein and SN 2007gr light curves, and so our comparison between these objects is flawed. In this case, Na I D provides a more reliable estimate of the total host extinction to SN 2017ein, although converting the value of to an in-band extinction involves further assumptions about the host extinction properties.
Variation in dust properties in SN host galaxies is a major uncertainty, and some examples are known to have dust unlike the Milky Way (e.g., SN 2014J in M82; Gao et al., 2015). For a reasonable range of total-to-selective extinction ratios (e.g., ), the reddening we derive from Na I D could imply a host extinction to SN 2017ein from – mag.
SN 2017ein is similar to the relatively low-luminosity SN Ic 2007gr, and although the intrinsic - and -band magnitudes and color curves of these objects may be discrepant (at the mag level), the -band host extinction to SN 2017ein implied by this comparison is mag. This extinction value implies assuming mag from Na i D. We adopt this value for the “preferred” extinction to the SN 2017ein progenitor system in our subsequent analysis, although there are still large uncertainties on this estimate. could be mag larger than this value for , but this value would be inconsistent with our fits to the SN 2007gr -band light curve and color curves, which are both consistent with lower values close to mag. Therefore, while we use this value throughout the rest of the paper, the total systematic uncertainty on the host extinction is large. Reasonable estimates on the value of range from roughly mag (implying ) to mag ().
All extinction estimates from the SN neglect the possibility of circumstellar dust that affected the progenitor observables but was destroyed by the SN. We do not see evidence for excess emission in the early-time light curve or spectroscopy of SN 2017ein that would be consistent with interaction between the SN shock and a significant mass of dust (as in SNe IIn, e.g., Fox et al., 2011; Kilpatrick et al., 2018). Considering that SN 2017ein may have been discovered very soon after explosion (as suggested by Im et al., 2017), we predict that we would have observed excess emission from a large mass of dust, and so we find the presence of such dust to be unlikely.
3.4 Relative Astrometry Between the Adaptive Optics and HST Imaging
We performed relative astrometry between the OSIRIS image and composite HST image using the 18 common sources circled in both frames (Figure 1). The positions derived for these 18 sources were determined using dolphot in the HST frame and sextractor in the OSIRIS frame. We performed image registration on the LGSAO image using the IRAF tasks ccmap and ccsetwcs. We used default parameters for ccmap, which fit pixel coordinates from the stars identified in our LGSAO imaging to a tangent plane projection of the right ascensions and declinations of the same stars in the HST image. We used a general geometric fit, which included terms for linear shift, rotation, and the relative pixel scale between the images.
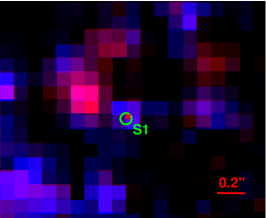
We estimated the astrometric uncertainty of our best-fitting geometric projection by randomly sampling half of the common sources and calculating a geometric solution then calculating the average offset between the remaining common sources in this projection. On average, we found and . Within the combined uncertainties (totaling ″ and ″) of the relative astrometry, the position of SN 2017ein in our LGSAO image, and the geometric distortion correction, we find a single source at the location of SN 2017ein in the reference HST image, which we call S1 (Figure 1). S1 is located at , and is detected in the combined HST frame with for an astrometric precision of . This is also the same source that Van Dyk et al. (2018) identify as the counterpart to SN 2017ein. As we demonstrate in Figure 1, S1 is offset from the position of SN 2017ein as determined from our LGSAO image by ″, or approximately 0.75. In the HST image, we do not detect any other sources within a ″ (8.6) radius of the position of SN 2017ein. Therefore, we consider S1 to be the only viable candidate as the counterpart to SN 2017ein.
We estimate the probability of a chance coincidence in the HST image by noting that there are a total of sources (including extended sources) with within a 10″ radius of SN 2017ein in the HST image from Figure 1. Therefore, the fraction of the total solid angle within 10″ of SN 2017ein that is within 3 of a detected source is approximately . This value represents the probability that the detected point source is a chance coincidence. Therefore, although it is unlikely that the identified point source is a chance coincidence, there some probability that this is the case. Follow-up imaging will be critical in order to confirm or rule out this possibility.
3.5 Photometry and Classification of the Pre-Explosion Counterpart
3.5.1 HST Photometry and the PSF of the Pre-Explosion Counterpart
From our photometric analysis of S1, we obtained Vega magnitudes mag and mag. These values are nominally fainter than those found in Van Dyk et al. (2018), who report mag and mag. These differences originate from the different dolphot parameters used in fitting101010Van Dyk et al. (2018) use FitSky=3 and img_RAper=8., which we adjusted to fit for the complex local background around S1.
Photometry from the combined imaging suggests that the object at the position of SN 2017ein has sharpness and roundness , which is generally consistent with a single point source. However, the PSF of the source in both and is somewhat extended and eccentric, with PSF eccentricities and , respectively. The source may be partially contaminated by emission from a nearby cluster (it has dolphot crowding parameter ; see Figure 1), hence our use of a local background estimate in performing photometry (Section 2.1), although it is possible that this background emission somewhat affects the PSF parameter estimates.
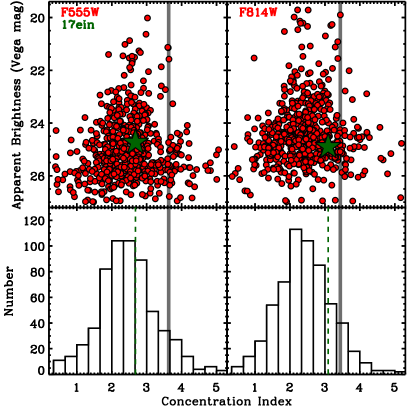
We further investigated the possibility that S1 is an extended source by measuring a “concentration index” (Figure 7). Following analysis in Chandar et al. (2010) for HST/WFC3 photometry, we calculated the difference in magnitudes for a circular aperture with radius pixels and an aperture with radius pixels centered on the PSF-fit coordinates and using the same local background estimate from dolphot. We restricted our analysis to sources within 10″ of SN 2017ein, and so all of the sources we investigated landed on the same WF2 array as SN 2017ein.
We found a concentration index of 2.677 in and 3.094 in . Larger concentration indices imply that most of the emission of the source is spread out at large separations from the center of the PSF. Chandar et al. (2010) define a threshold concentration index for distinguishing between stars and clusters by examining candidate objects that are thought to be stars or clusters and finding the maximum and minimum concentration indices of these distributions. These thresholds cleanly separate sources detected using WFC3 into distributions of stars and clusters (see, e.g., Figure 4 in Chandar et al., 2010). We estimate a similar threshold by examining the concentration index below which we find 95% of objects with mag, which are more likely to be clusters. This value is 3.63 for and 3.44 for . In both cases, the SN 2017ein candidate lies within the distribution and could reasonably be considered to be a single, unresolved point source. However, in , the source is much closer to the limit we have defined, which is relatively crude compared to the analysis in Chandar et al. (2010).
If S1 is a cluster, then it is extremely young. The (roughly ) color corrected for Milky Way extinction and assuming no host extinction is mag, which is consistent with a Myr cluster (Bruzual & Charlot, 2003; Peacock et al., 2013). With added host extinction, the source would be even bluer and younger, implying that any star that exploded from the population in this cluster had an initial mass for a single star (as derived from MIST evolutionary tracks; Choi et al., 2016).
If S1 is a marginally unresolved cluster, then only the most extreme and massive single star populations could explain the colors for this source. At Myr these sources would have mag or an unabsorbed magnitude of mag at the distance of NGC 3938. Unless the host extinction is mag to SN 2017ein, it is unlikely that S1 is such a star. We find that the most likely scenario is a luminous, blue source corresponding to a single star or multiple star system with a surrounding population of less luminous sources. These other sources are likely unresolved stars still on the main sequence. This scenario agrees with the magnitudes, colors, and concentration for S1.
If the full dolphot photometry for S1 is partly contaminated by a surrounding population of stars, we can remove some of this light using forced photometry. We used the instrumental PSFs for HST/WFPC2 in and to fit photometry to S1 and found that the central source was marginally fainter without the extended emission: the PSF-fit source, which we call PSF1 had brightnesses and . If a single object dominates the emission from this source and is the pre-explosion counterpart to SN 2017ein, then these magnitudes represent its total emission. Otherwise, if one or more unresolved sources contributes significantly to the emission within the PSF, then these magnitudes are only upper limits on the pre-explosion emission from the SN 2017ein progenitor star.
3.5.2 Classification of the Pre-Explosion Counterpart
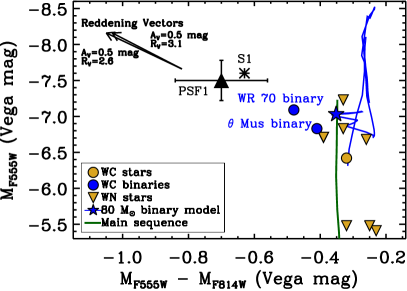
We corrected the HST photometry of PSF1 for interstellar exinction using the extinction law in Cardelli et al. (1989) with and and host extinction using mag with (implying mag) as discussed in Section 3.3. Assuming , PSF1 had luminosities mag (roughly band) and mag (roughly band). We plot these values in Figure 8 along with the corresponding values for S1. Clearly the added light from extended emission does not make a significant difference to the final photometry of PSF1 relative to the uncertainties.
The extinction-corrected - color is mag (with systematic uncertainties represented by variations in reddening; Figure 8). This color is blueward of the main sequence and implies a much hotter star than the vast majority of stars. For example, the bluest color for a star in the Hipparcos and Tycho2 catalogue is , although this estimate is subject to significant selection bias due to Galactic dust. At the very least, this color implies a spectral energy distribution that peaks far blueward of band and a source with a very hot photosphere. Some late-type WN stars (also WNL; Wolf-Rayet stars with low-ionization state nitrogen lines in their spectra; Hamann et al., 2006; Sander et al., 2012; Crowther, 2007a) are luminous enough to match the properties of PSF1 with mag, but typically only have colors as blue as mag.
If we assume the source with mag and color mag is dominated by a single star, then by comparison to MIST models (Paxton et al., 2011; Paxton et al., 2013, 2015; Dotter, 2016; Choi et al., 2016)111111http://waps.cfa.harvard.edu/MIST/, we find that the best-fitting bolometric correction for such a star is mag. The best-fitting luminosity for a single star at the metallicity of NGC 3938 (; Kudritzki et al., 2015) is approximately , implying an initial mass of .
The evolutionary pathway such a high-mass star would take to end as a highly-stripped SN Ic progenitor is less certain. It has been hypothesized that WC stars (WR stars with strong carbon emission lines in their spectra; Crowther, 2007a) are likely candidates for SNe Ic (Dessart et al., 2010; Yoon et al., 2012; Dessart et al., 2012; Yoon, 2015b; Dessart et al., 2015). The Galactic population of WC stars generally have absolute magnitudes to mag with colors bluer than WNL stars (Crowther, 2007b; van der Hucht, 2001). Most SN Ic progenitor star models propose that the final mass ought to be very low in order to explain the observed abundances of SNe Ic, with at the most (Meynet & Maeder, 2003; Yoon, 2015b).
We examined Galactic WR stars with detailed photometry, extinction, and distance estimates (from the VIIth catalogue of Galactic WR stars; van der Hucht, 2001) to determine whether any known stars are luminous and blue enough to match PSF1. We restricted our sample to stars without detected companions so we could examine the intrinsic colors and luminosities of WR stars. None of the stars in our sample had colors and luminosities that matched PSF1, and only a few WN stars had luminosities or colors that approached PSF1 (examples with the most luminous magnitudes and bluest colors are shown in Figure 8).
However, roughly 40% of Galactic WR stars are in binaries, often where the WR star itself does not dominate the overall spectral energy distribution. There are some examples of WR stars in binaries with O- or B-type supergiants that could agree with the luminosity and colors of PSF1. All known examples in the VIIth catalogue of Galactic WR stars with mag and mag are late-type WC stars with O- or B-type supergiant companion stars. For example, the WC9 star WR 70 (also HD 137603; Williams & van der Hucht, 2000) is in a binary with a B0I supergiant with intrinsic mag and mag while the W6+O binary Mus has mag and mag (Moffat & Seggewiss, 1977; Stupar et al., 2010). Both of these stars could match the observed colors and luminosity of PSF1 if we decreased the amount of reddening closer to the lower limit of the range allowed by spectroscopy and photometry of SN 2017ein ( mag).
If PSF1 is dominated by light from a star other than the progenitor star of SN 2017ein, it could simply be in the same cluster as SN 2017ein. The precision of our astrometry indicates that there could be as much as a ″ offset between SN 2017ein and the transient source we identified in pre-explosion imaging, corresponding to 3 pc at the distance to NGC 3938. If the star were pc away from the SN 2017ein progenitor star, it would be unassociated with the progenitor system. On the other hand, if PSF1 is dominated by the progenitor system of SN 2017ein and the actual progenitor star is the less luminous component of a binary system, then the two components should be coeval and the luminosity and color of the more luminous source can be used to constrain the properties of the other component.
Therefore, we analyzed all Binary Population and Stellar Synthesis (BPASS2.1; Eldridge et al., 2017) models to look for binary star models that terminate with a total luminosity mag and color mag. We restricted our search to models with the metallicity of NGC 3938, but otherwise searched the entire range of models with primary initial mass –, initial mass ratio –, and initial log period (days) –, consisting of 12,664 models. There were two such models in the overall sample that terminated within the selected parameter space, both with primary mass . These two models, which we will call Models 1 and 2, have initial mass ratios and and log periods and , respectively. Models 1 and 2 end with the secondary star comprising of the overall -band luminosity, although in both cases this star is somewhat redder ( to mag) than the overall system. The final mass of the primary star in Model 1 (wider/smaller initial mass ratio) is while in Model 2 (closer/larger initial mass ratio) the primary terminates with .
If the host reddening to SN 2017ein was relatively low ( mag), then the color and luminosity of PSF1 could agree with Model 1 (shown in blue in Figure 8). In addition, Model 1 terminates with effectively no hydrogen and only of helium. The total helium mass fraction in the star is quite low (), and even for a relatively low total ejecta mass, the helium mass fraction in the ejecta would be consistent with predictions for SN Ic progenitor stars (which suggest that a mass fraction is sufficient to hide helium lines Dessart et al., 2011; Yoon, 2015a).
The luminosity and color of Model 1 are somewhat similar to WC+O star binaries, where the primary has undergone significant stripping and/or radiative mass loss and ends up as a relatively low mass star. The fact that the primary star in this model has a somewhat high mass for a WC star (which typically range from –; for a review see Crowther, 2007b) could be explained by the WR mass-loss prescription or a slightly higher metallicity at the location of SN 2017ein in NGC 3938. Alternatively, this type of binary could simply be a rare system with a high-mass WC star that explodes promptly. Ultimately, the full implications for the initial metallicity, mass-loss prescription, and binary parameters of this system are complex, and additional modeling is needed to explore WC star binaries as potential SN Ic progenitor stars.
4 The Nature of SN 2017ein and Its Progenitor System
We find a luminous, blue source (S1) at the progenitor site of SN 2017ein. The environment around S1 is consistent with the environments of SNe Ic as a whole; these SNe preferentially explode in regions of high star formation rates (Galbany et al., 2014, 2016), which strongly suggest a high mass (25 ) progenitor star that evolves and explodes close to the region where it formed. However, the diversity of SNe Ic as a whole, and in particular their progenitor systems, is still poorly understood. It is possible that SN 2017ein is atypical for SNe Ic, implying an unusual progenitor system.
From our analysis of the pre-explosion photometry, S1 appears marginally extended, and may be consistent with a massive star cluster. Indeed, it has been found that many stripped-envelope SNe are discovered in or near such clusters (Fremling et al., 2016; Maund, 2018). The fact that S1 is more extended in the redder band suggests that the surrounding population of unresolved sources come from stars with lower mass than the star or stars dominating S1. If we assume that S1 is dominated by emission from a single star, then it has a best-fitting mass of . This mass range is consistent with the findings of Van Dyk et al. (2018), who report the source is consistent with a star with an initial mass of – at the most for binary star models, or in the range of 47– for single star models.
SN 2017ein could have exploded from a star in a multiple system where the primary does not dominate the overall spectral energy distribution. Late-type WC stars often occur in systems with O- or B-type supergiant companion stars, such as the WC9+B binary WR 70 or the WC6+O star binary Mus (Figure 8). Many of these systems lack detailed orbital parameters, and so it is difficult to place strong constraints on the nature of the WC star itself. WR 70 is a relatively high-mass WC star (Nugis & Lamers, 2002, ) and, as an late-type WC star, likely has an intrinsically high carbon abundance (Smith & Willis, 1982). The overall luminosity is dominated by the B-type supergiant companion star, and so the total luminosity of this particular system is a poor indicator of the mass of the WC star. Comparison to binary star models suggests it may be possible to obtain such a system with a + system, although the mass of the final component is somewhat large. However, this system is left with of helium, which agrees with progenitor model predictions for SNe Ic (Dessart et al., 2011; Yoon, 2015a). If the SN 2017ein progenitor star evolved in a similar system with the luminosity and colors observed from PSF1, then it could still be relatively low mass, although the exact mass of the progenitor system and its overall abundances are still highly uncertainty.
From the light curve and spectra of SN 2017ein, we infer that this source is most similar to carbon-rich, low-luminosity SNe Ic such as SN 2007gr as opposed to other SNe Ic such as SN 2011bm. This finding underscores the fact that the SN 2017ein progenitor star must have been hydrogen- and helium-deficient, but could also be relatively carbon-rich. Mazzali et al. (2010) and Valenti et al. (2008) noted that the presence of strong carbon features at early times in SN 2007gr was consistent with an intrinsically high carbon-to-oxygen ratio in the progenitor star.
Our preferred maximum -band absolute magnitude, assuming a host extinction of mag, suggests that SN 2017ein peaked at mag. This value is at the lower end of the luminosity function for SNe Ic as a whole (Drout et al., 2011), and is consistent with a relatively low mass of 56Ni (), also similar to SN 2007gr. Mazzali et al. (2010) point out that such a low 56Ni mass implies the explosion of a relatively low-mass CO core; in the case of SN 2007gr, this core likely resulted from a star with a main-sequence mass of and a relatively low terminal mass (see also Kim et al., 2015). Yoon et al. (2010) suggest that these systems result from stars with a relatively low initial mass () in order to explain the lack of helium and range of nickel masses.
This is in conflict with the + binary model that provided the best match to the parameters of PSF1, where the star terminated at . It is possible that this is a result of systematic uncertainties in the models themselves. Only 2 out of 12,664 BPASS models approached the properties of PSF1, whose extreme color and magnitude imply a massive, O- or B-type star. Stars in this region of color-magnitude diagrams are not usually expected to explode, and so the lack of models that terminate here may reflect a physical limitation as much as systematic uncertainties in model parameters. On the other hand, Yoon (2015a) point out that in binary progenitor models for SNe Ib/c, the terminal mass of the primary star is quite sensitive to the choice of metallicity, mass-loss, and mass-transfer prescriptions. It is theoretically plausible that extreme mass transfer could produce a low terminal mass from a star (see, e.g., Figure 10 in Yoon, 2015a). However, such a scenario must be verified with late-time imaging to look for variations in the color and magnitude of the pre-explosion source.
5 Conclusions
We present pre-explosion imaging and high-resolution imaging, photometry, and spectroscopy of the SN Ic 2017ein. We find:
-
1.
Spectra and light curves of SN 2017ein are remarkably similar to carbon-rich, low-luminosity SNe Ic such as SN 2007gr and unlike SNe Ic such as 2011bm. At the same time, matching the continuum and peak -band luminosity of SN 2017ein to SN 2007gr requires roughly mag of host extinction. We also detect strong Na i D absorption at the approximate redshift of NGC 3938. These spectral characteristics suggest that the progenitor system contained very little hydrogen or helium, but also that it may have had an intrinsically high carbon abundance in its outer layers, as has been suggested for some WC stars.
-
2.
The location of SN 2017ein as determined from high-resolution laser guide star adaptive optics imaging is consistent with a single source in pre-explosion HST/WFPC2 imaging. The source is marginally extended in the HST/WFPC2 images and there may be non-uniform background emission at this location.
-
3.
Accounting for the extended source and host extinction, photometry from the pre-explosion is consistent with single stars with masses up to , but with a preferred mass of . However, most of these stars, which include O- and B-type supergiants and WN stars, are hydrogen-rich, and so are unlikely SN Ic progenitor stars.
-
4.
Comparison to highly-stripped WR star binaries indicates that the only systems that match the colors and luminosity of PSF1 are WC+O and B star binaries. We find that a + BPASS model can explain some of the parameters of SN 2017ein and the pre-explosion counterpart and produces a star whose terminal state is roughly consistent with predictions of SN Ic progenitor stars. Additional modeling is needed to explore the full ramifications of this evolutionary pathway and the precise terminal state of such a system.
-
5.
Nebular spectroscopy of SN 2017ein will be critical for measuring the true carbon abundance in the ejecta. Late-time imaging of the site of SN 2017ein will also be important for measuring the extent to which the SN 2017ein progenitor star contributed to emission from the pre-explosion source.
ACKNOWLEDGMENTS
We thank Raj Chowdhury and Bella Nguyen for help with Nickel observations. We also thank David Coulter, César Rojas-Bravo, and Matthew Siebert for help with Shane and Mayall observations.
The UCSC group is supported in part by NSF grant AST–1518052, the Gordon & Betty Moore Foundation, the Heising-Simons Foundation, and by fellowships from the Alfred P. Sloan Foundation and the David and Lucile Packard Foundation to R.J.F.
Some of the data presented herein were obtained at the W. M. Keck Observatory, which is operated as a scientific partnership among the California Institute of Technology, the University of California, and NASA. The observatory was made possible by the generous financial support of the W. M. Keck Foundation. We wish to recognise and acknowledge the cultural significance that the summit of Mauna Kea has within the indigenous Hawaiian community. We are most fortunate to have the opportunity to conduct observations from this mountain.
Some of the data in this publication were calibrated using object catalogs from the Pan-STARRS1 Surveys. The Pan-STARRS1 Surveys (PS1) and the PS1 public science archive have been made possible through contributions by the Institute for Astronomy, the University of Hawaii, the Pan-STARRS Project Office, the Max-Planck Society and its participating institutes, the Max Planck Institute for Astronomy, Heidelberg and the Max Planck Institute for Extraterrestrial Physics, Garching, The Johns Hopkins University, Durham University, the University of Edinburgh, the Queen’s University Belfast, the Harvard-Smithsonian Center for Astrophysics, the Las Cumbres Observatory Global Telescope Network Incorporated, the National Central University of Taiwan, the Space Telescope Science Institute, the National Aeronautics and Space Administration under Grant No. NNX08AR22G issued through the Planetary Science Division of the NASA Science Mission Directorate, the National Science Foundation Grant No. AST-1238877, the University of Maryland, Eotvos Lorand University (ELTE), the Los Alamos National Laboratory, and the Gordon and Betty Moore Foundation.
The Hubble Space Telescope (HST) is operated by NASA/ESA. The HST data used in this manuscript come from programme GO-10877 (PI Li). Some of our analysis is based on data obtained from the HST archive operated by STScI.
We acknowledge the use of public data from the Swift data archive.
Some of the data presented in this manuscript come from the Kitt Peak National Observatory (KPNO) 4-m telescope through programme 2017A-0306 (PI Foley). KPNO is operated by the Association of Universities for Research in Astronomy, Inc. (AURA) under cooperative agreement with the National Science Foundation.
The Nickel and Shane telescopes are operated by the University of California and Lick Observatories. Some of the data presented in this manuscript come from UCO/Lick programmes 2017Q2-N007, 2017Q3-N005 (PI Kilpatrick) and 2017A-S011, 2017B-S018 (PI Foley).
This work makes use of observations performed by the Las Cumbres Global Telescope Network through programme 2017AB-012 (PI Kilpatrick).
Facilities: Keck (ESI/LRIS/OSIRIS), LCOGTN (SINISTRO), Mayall (KOSMOS), Nickel (Direct), Shane (Kast), Swift (UVOT)
References
- Aldering et al. (1994) Aldering G., Humphreys R. M., Richmond M., 1994, AJ, 107, 662
- Arbour (2017) Arbour R., 2017, Transient Name Server Discovery Report, 588
- Bianco et al. (2014) Bianco F. B., et al., 2014, ApJS, 213, 19
- Bruzual & Charlot (2003) Bruzual G., Charlot S., 2003, MNRAS, 344, 1000
- Cao et al. (2013) Cao Y., et al., 2013, ApJ, 775, L7
- Cardelli et al. (1989) Cardelli J. A., Clayton G. C., Mathis J. S., 1989, ApJ, 345, 245
- Chambers et al. (2016) Chambers K. C., et al., 2016, preprint, (arXiv:1612.05560)
- Chandar et al. (2010) Chandar R., et al., 2010, ApJ, 719, 966
- Choi et al. (2016) Choi J., Dotter A., Conroy C., Cantiello M., Paxton B., Johnson B. D., 2016, ApJ, 823, 102
- Crockett et al. (2007) Crockett R. M., et al., 2007, MNRAS, 381, 835
- Crockett et al. (2008) Crockett R. M., et al., 2008, MNRAS, 391, L5
- Crowther (2007a) Crowther P. A., 2007a, ARA&A, 45, 177
- Crowther (2007b) Crowther P. A., 2007b, ARA&A, 45, 177
- Dessart et al. (2010) Dessart L., Livne E., Waldman R., 2010, MNRAS, 405, 2113
- Dessart et al. (2011) Dessart L., Hillier D. J., Livne E., Yoon S.-C., Woosley S., Waldman R., Langer N., 2011, MNRAS, 414, 2985
- Dessart et al. (2012) Dessart L., Hillier D. J., Li C., Woosley S., 2012, MNRAS, 424, 2139
- Dessart et al. (2015) Dessart L., Hillier D. J., Woosley S., Livne E., Waldman R., Yoon S.-C., Langer N., 2015, MNRAS, 453, 2189
- Dotter (2016) Dotter A., 2016, ApJS, 222, 8
- Drout et al. (2011) Drout M. R., et al., 2011, ApJ, 741, 97
- Eldridge et al. (2013) Eldridge J. J., Fraser M., Smartt S. J., Maund J. R., Crockett R. M., 2013, MNRAS, 436, 774
- Eldridge et al. (2017) Eldridge J. J., Stanway E. R., Xiao L., McClelland L. A. S., Taylor G., Ng M., Greis S. M. L., Bray J. C., 2017, Publ. Astron. Soc. Australia, 34, e058
- Filippenko (1982) Filippenko A. V., 1982, PASP, 94, 715
- Flewelling et al. (2016) Flewelling H. A., et al., 2016, preprint, (arXiv:1612.05243)
- Foley et al. (2003) Foley R. J., et al., 2003, PASP, 115, 1220
- Fox et al. (2011) Fox O. D., et al., 2011, ApJ, 741, 7
- Fremling et al. (2016) Fremling C., et al., 2016, A&A, 593, A68
- Gal-Yam et al. (2005) Gal-Yam A., et al., 2005, ApJ, 630, L29
- Gal-Yam et al. (2007) Gal-Yam A., et al., 2007, ApJ, 656, 372
- Galbany et al. (2014) Galbany L., et al., 2014, A&A, 572, A38
- Galbany et al. (2016) Galbany L., et al., 2016, MNRAS, 455, 4087
- Galbany et al. (2017) Galbany L., et al., 2017, MNRAS, 468, 628
- Gao et al. (2015) Gao J., Jiang B. W., Li A., Li J., Wang X., 2015, ApJ, 807, L26
- Hainich et al. (2015) Hainich R., Pasemann D., Todt H., Shenar T., Sander A., Hamann W.-R., 2015, A&A, 581, A21
- Hamann et al. (1995) Hamann W.-R., Koesterke L., Wessolowski U., 1995, A&A, 299, 151
- Hamann et al. (2006) Hamann W.-R., Gräfener G., Liermann A., 2006, A&A, 457, 1015
- Im et al. (2017) Im M., et al., 2017, The Astronomer’s Telegram, 10481
- Jenness et al. (2015) Jenness T., Currie M. J., Tilanus R. P. J., Cavanagh B., Berry D. S., Leech J., Rizzi L., 2015, MNRAS, 453, 73
- Jester et al. (2005) Jester S., et al., 2005, AJ, 130, 873
- Kilpatrick et al. (2017) Kilpatrick C. D., et al., 2017, MNRAS, 465, 4650
- Kilpatrick et al. (2018) Kilpatrick C. D., et al., 2018, MNRAS, 473, 4805
- Kim et al. (2015) Kim H.-J., Yoon S.-C., Koo B.-C., 2015, ApJ, 809, 131
- Kochanek et al. (2012) Kochanek C. S., Khan R., Dai X., 2012, ApJ, 759, 20
- Kudritzki et al. (2015) Kudritzki R.-P., Ho I.-T., Schruba A., Burkert A., Zahid H. J., Bresolin F., Dima G. I., 2015, MNRAS, 450, 342
- Kuncarayakti et al. (2013) Kuncarayakti H., et al., 2013, AJ, 146, 30
- Larkin et al. (2006) Larkin J., et al., 2006, in Society of Photo-Optical Instrumentation Engineers (SPIE) Conference Series. p. 62691A, doi:10.1117/12.672061
- Li et al. (2000) Li W. D., et al., 2000, in Holt S. S., Zhang W. W., eds, American Institute of Physics Conference Series Vol. 522, American Institute of Physics Conference Series. pp 103–106 (arXiv:astro-ph/9912336), doi:10.1063/1.1291702
- Li et al. (2011) Li W., et al., 2011, MNRAS, 412, 1441
- Maeder & Meynet (1987) Maeder A., Meynet G., 1987, A&A, 182, 243
- Maund (2018) Maund J. R., 2018, MNRAS, 476, 2629
- Maund & Ramirez-Ruiz (2016) Maund J. R., Ramirez-Ruiz E., 2016, MNRAS, 456, 3175
- Maund et al. (2011) Maund J. R., et al., 2011, ApJ, 739, L37
- Mazzali et al. (2010) Mazzali P. A., Maurer I., Valenti S., Kotak R., Hunter D., 2010, MNRAS, 408, 87
- Meynet & Maeder (2003) Meynet G., Maeder A., 2003, A&A, 404, 975
- Meynet & Maeder (2005) Meynet G., Maeder A., 2005, A&A, 429, 581
- Moffat & Seggewiss (1977) Moffat A. F. J., Seggewiss W., 1977, A&A, 54, 607
- Nugis & Lamers (2002) Nugis T., Lamers H. J. G. L. M., 2002, A&A, 389, 162
- Paxton et al. (2011) Paxton B., Bildsten L., Dotter A., Herwig F., Lesaffre P., Timmes F., 2011, ApJS, 192, 3
- Paxton et al. (2013) Paxton B., et al., 2013, ApJS, 208, 4
- Paxton et al. (2015) Paxton B., et al., 2015, ApJS, 220, 15
- Peacock et al. (2013) Peacock M. B., Zepf S. E., Finzell T., 2013, ApJ, 769, 126
- Podsiadlowski et al. (2002) Podsiadlowski P., Rappaport S., Pfahl E. D., 2002, ApJ, 565, 1107
- Poznanski et al. (2012) Poznanski D., Prochaska J. X., Bloom J. S., 2012, MNRAS, 426, 1465
- Prochaska et al. (2003) Prochaska J. X., Gawiser E., Wolfe A. M., Cooke J., Gelino D., 2003, ApJS, 147, 227
- Rest et al. (2005) Rest A., et al., 2005, ApJ, 634, 1103
- Rest et al. (2014) Rest A., et al., 2014, ApJ, 795, 44
- Sander et al. (2012) Sander A., Hamann W.-R., Todt H., 2012, A&A, 540, A144
- Schechter et al. (1993) Schechter P. L., Mateo M., Saha A., 1993, PASP, 105, 1342
- Schlafly & Finkbeiner (2011) Schlafly E. F., Finkbeiner D. P., 2011, ApJ, 737, 103
- Shivvers et al. (2017) Shivvers I., et al., 2017, PASP, 129, 054201
- Smartt (2009) Smartt S. J., 2009, ARA&A, 47, 63
- Smith (2014) Smith N., 2014, ARA&A, 52, 487
- Smith & Willis (1982) Smith L. J., Willis A. J., 1982, MNRAS, 201, 451
- Smith et al. (2010) Smith N., et al., 2010, AJ, 139, 1451
- Smith et al. (2011) Smith N., Li W., Silverman J. M., Ganeshalingam M., Filippenko A. V., 2011, MNRAS, 415, 773
- Steiner & Oliveira (2005) Steiner J. E., Oliveira A., 2005, ArXiv Astrophysics e-prints,
- Stupar et al. (2010) Stupar M., Parker Q. A., Filipović M. D., 2010, MNRAS, 401, 1760
- Taddia et al. (2015) Taddia F., et al., 2015, A&A, 574, A60
- Taubenberger et al. (2006) Taubenberger S., et al., 2006, MNRAS, 371, 1459
- Tully et al. (2009) Tully R. B., Rizzi L., Shaya E. J., Courtois H. M., Makarov D. I., Jacobs B. A., 2009, AJ, 138, 323
- Tuthill et al. (1999) Tuthill P. G., Monnier J. D., Danchi W. C., 1999, Nature, 398, 487
- Valenti et al. (2008) Valenti S., et al., 2008, ApJ, 673, L155
- Valenti et al. (2012) Valenti S., et al., 2012, ApJ, 749, L28
- Van Dyk et al. (2014) Van Dyk S. D., et al., 2014, AJ, 147, 37
- Van Dyk et al. (2018) Van Dyk S. D., et al., 2018, preprint, (arXiv:1803.01050)
- Williams & van der Hucht (2000) Williams P. M., van der Hucht K. A., 2000, MNRAS, 314, 23
- Woosley et al. (1993) Woosley S. E., Langer N., Weaver T. A., 1993, ApJ, 411, 823
- Woosley et al. (1994) Woosley S. E., Eastman R. G., Weaver T. A., Pinto P. A., 1994, ApJ, 429, 300
- Yoon (2015a) Yoon S.-C., 2015a, Publ. Astron. Soc. Australia, 32, e015
- Yoon (2015b) Yoon S.-C., 2015b, Publ. Astron. Soc. Australia, 32, e015
- Yoon (2017) Yoon S.-C., 2017, MNRAS, 470, 3970
- Yoon et al. (2010) Yoon S.-C., Woosley S. E., Langer N., 2010, ApJ, 725, 940
- Yoon et al. (2012) Yoon S.-C., Gräfener G., Vink J. S., Kozyreva A., Izzard R. G., 2012, A&A, 544, L11
- van der Hucht (2001) van der Hucht K. A., 2001, New Astron. Rev., 45, 135