Characterizing Co-located Datacenter Workloads:
An Alibaba Case Study
Abstract.
Warehouse-scale cloud datacenters co-locate workloads with different and often complementary characteristics for improved resource utilization. To better understand the challenges in managing such intricate, heterogeneous workloads while providing quality-assured resource orchestration and user experience, we analyze Alibaba’s co-located workload trace, the first publicly available dataset with precise information about the category of each job. Two types of workload—long-running, user-facing, containerized production jobs, and transient, highly dynamic, non-containerized, and non-production batch jobs—are running on a shared cluster of 1313 machines. Our multifaceted analysis reveals insights that we believe are useful for system designers and IT practitioners working on cluster management systems.
1. Introduction
While modern datacenter management systems play a central role in delivering quality-assured cloud computing services, warehouse-scale datacenter infrastructure often comes with a tremendously huge cost of low resource utilization. Google’s production cluster trace analysis reports that the overall utilization are between 20–40% (google_dc, ) most of the time. Another study (ec2_dasc11, ) observes that a fraction of Amazon servers hosting EC2 virtual machines (VMs) show an average CPU utilization of over one week.
To improve resource utilization and thereby reduce costs, leading cloud infrastructure operators such as Google and Alibaba co-locate transient batch jobs with long-running, latency-sensitive, user-facing jobs (container_mgmt_acmqueue16, ; borg_eurosys15, ) on the same cluster. Workload co-location resembles hypervisor-based server consolidation (xen_sosp03, ) but at massive datacenter scale. At its core, the driving force is what is called a Datacenter Operating System (dcos_hotcloud11, ), managing job scheduling, resource allocation, and so on. As one example, Google’s Borg (borg_eurosys15, ) adopts the workload co-location technique by leveraging resource isolation provided by Linux containers (lxc, ).
Workload co-location has become a common practice (container_mgmt_acmqueue16, ; borg_eurosys15, ) and there have been studies focusing on enabling more efficient co-location based cluster management (paragon_asplos13, ; quasar_asplos14, ; slo_socc17, ; bubbleup_micro11, ; omega_eurosys13, ; cpi2_eurosys13, ). To better facilitate the understanding of interactions among the co-located workloads and their real-world operational demands Alibaba recently released a cluster usage and co-located workload dataset (alitrace, ), which was collected from Alibaba’s production cluster in a 24-hour period.
We perform a characterization case study targeting Alibaba’s co-located long-running and batch job workloads across several dimensions. We analyze the resource request and reservation patterns, resource usage, workload dynamicity, straggler issues, interaction and interference of co-located workloads, among other aspects. While confirming old issues still surprisingly persist (e.g., the straggler issues for batch workloads) that have long been observed in other work (dolly_nsdi13, ; late_osdi08, ), we make several unique insightful findings. Some of them may be specific to the Alibaba infrastructure, but we believe the generality is critical and applicable to designers, administrators, and users of co-located resource management systems. Our key findings are summarized as follows:
Overbooking, over-provisioning, and over-commitment. Overbooking happens at long-running container deployment phase but just sparsely, only for few jobs that may not have strict overbooking requirements (e.g., CPU core sharing). Over-provisioning mainly happens for long-running containerized jobs for accommodating potential load spikes; but most time long-running jobs are CPU-inactive, leaving co-located batch jobs ample opportunity space for elastic resource over-commitment for improved cluster resource utilization. Long-running jobs are more memory-demanding, hence yielding an overall cluster memory utilization higher than that of CPU.
Notoriously persistent old issues. Old issues such as poorly predicted resource usage and stragglers for batch job workloads still persist at Alibaba’s datacenters. Accurate resource usage estimation for batch jobs is not an urgently demanding mission since non-production batch jobs can always over-commit resources that are reserved but not utilized by long-running production jobs. On the other hand, straggler issues still exist and demand fixings at either administrator or developer side.
Co-location implications. High resource sharing means intricate resource contentions at different levels of the software stack, and potentially high performance interference. Our analysis also reveals evidences implying that Alibaba’s workload-specific schedulers for long-running and batch jobs may not be as cohesively coordinated as they should, stressing the need for a more integrated, co-location-optimized solution.
2. Background and Related Work
Cluster trace studies. In 2011, Google open-sourced the first publicly available cluster trace data (google_trace, ) spanning several clusters. Reiss et al. (google_trace_socc12, ) study the heterogeneity and dynamicity properties of the Google workloads. Other works (google_cluster12, ; google_icac12, ; google_icppw12, ) focus their studies on different aspects of the Google trace. Alibaba, the largest cloud service provider in China, released their cluster trace (alitrace, ) in late 2017. Different from the Google trace, the Alibaba trace contains information about the two co-located container and batch job workloads, facilitating better understanding of their interactions and interferences. Lu et al. (alitrace_bigdata17, ) perform characterization of the Alibaba trace to reveal basic workload statistics. Our study is focused on providing a unique and microscopic view about how the co-located workloads interact and impact each other.
Cluster management systems. A series of state-of-the-art cluster management systems (CMSs) support co-located long-running and batch services. Monolithic CMSs such as Borg (borg_eurosys15, )111 Technically, Borg partitions the whole cluster into cells and assigns a replicated scheduler for each cell that provides a certain set of services, e.g., batch services. (and its open-sourced implementation Kubernetes (kubernetes, )) and Quasar (quasar_asplos14, ) use a centralized resource scheduler for performing resource allocation and management. Two-level CMSs such as Mesos (mesos_nsdi11, ) adopts a hierarchical structure where a Level-0 resource manager is used to jointly coordinate multiple Level-1 application-specific schedulers. Other CMSs achieve low-latency scheduling by using approaches such as shared-state parallel schedulers (omega_eurosys13, ).
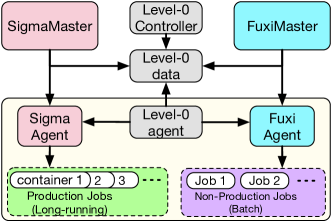
Alibaba’s CMS and co-located workloads. Alibaba’s CMS resembles the architecture of a two-level CMS, as shown in Figure 1. The logical architecture consists of three component: (1) a global Level-0 controller. (2) a Sigma (alibaba_sigma, ) scheduler that manages the long-running workload, and (3) a Fuxi (fuxi_vldb14, ) scheduler that manages the batch workloads. Sigma is responsible for scheduling online service containers (pouch, ) for the production jobs. These online services are user-facing, and typically require low latency and high performance. Sigma has been used for large-scale container deployment purposes by Alibaba for several years. It has also been used during the Alibaba Double 11 Global Shopping Festival. We analyze the long-running workloads in Section 4. Fuxi, on the other hand, manages non-containerized non-production batch jobs. Fuxi is used for vast amounts of data processing and complex large-scale computing type applications. Fuxi employs data-driven multi-level pipelined parallel computing framework, which is compatible with MapReduce (mapreduce_osdi04, ), Map-Reduce-Merge (mrm_sigmod07, ), and other batch programming modes. We study the batch workloads in Section 5. The Level-0 mechanism coordinates and manages both types of workloads (Sigma and Fuxi) for coordinated global operations. Particularly the Level-0 controller performs four important functionalities. (1) manages colocation clusters, (2) performs resource matching between each scheduling tenant, (3) strategies for everyday use and use during large-scale promotions, and (4) performs exception detection and processing. Different types of workloads were running on separate clusters before 2015, since when Alibaba has been making effort to co-locate them on shared clusters. In Section 6 we analyze Alibaba’s workload co-location and its implication.
Alibaba cluster trace. The Alibaba cluster trace captures detailed statistics for the co-located workloads of long-running and batch jobs over a course of 24 hours. The trace consists of three parts: (1) statistics of the studied homogeneous cluster of 1313 machines, including each machine’s hardware configuration222 Over machines have the same hardware composition (64-core CPU, normalized memory capacity , and normalized disk capacity , except a few with slightly different memory capacity). , and the runtime CPU, Memory, Disk resource usage for a duration of 12 hours (the half of the 24-hour period); (2) long-running job workloads, including a trace of all container deployment requests and actions, and a resource usage trace for 12 hours; (3) co-located batch job333 Each job is a directed acyclic graph (DAG), having one or more tasks; each task has multiple instances; all instances within a task execute the same binary; instance is the smallest scheduling unit of a batch job scheduler. workloads, including a trace of all batch job requests and actions, and a trace of per-instance resource usage over 24 hours. Unlike the Google trace (google_trace_socc12, ) that lacks precise information about exact purpose of individual jobs, the Alibaba trace well compensates this by tracing the two different workloads separately, thus offering researchers visibility of real-world operational demands of co-located workloads.
3. Overall Cluster Usage
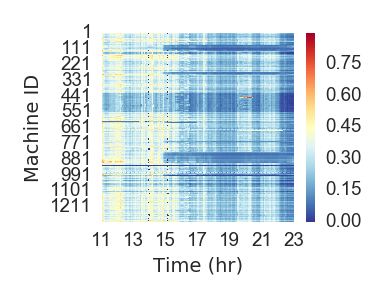
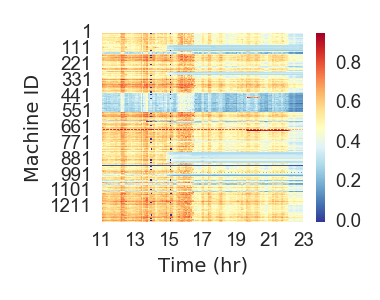
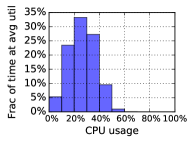
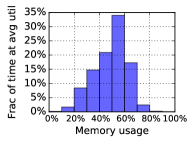
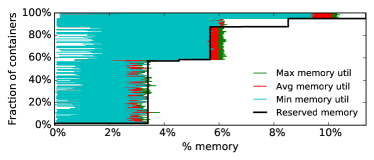
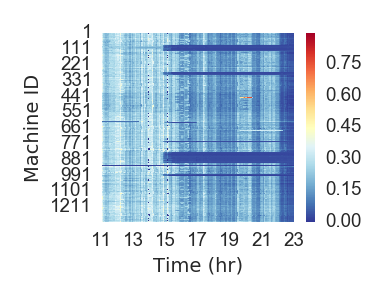
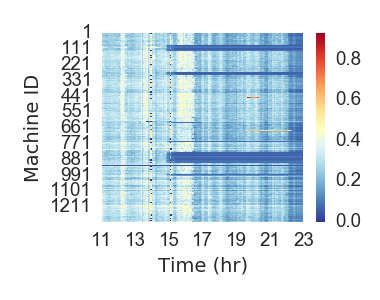
We start with the overall cluster usage to understand the aggregated workload characteristics. Figure 2 shows the per-machine resource usage temporal pattern across the 12-hour duration. Cluster CPU utilization (Figure 2(a)) is at medium level (–) for the first 4 hours but decreases during the rest time, while memory utilization (Figure 2(b)) is above in majority of the time. This can also be reflected from Figure 3, which shows the average usage distribution. The cluster spends over of its time running between – CPU usage (Figure 3(a)). Average memory usage (Figure 3(b)) is relatively higher and in over of the time the machines have a memory usage above . Google trace analysis (google_trace_socc12, ) reports that the CPU and memory usage were capped at and , respectively. In contrast, at Alibaba, memory tends to be more precious with over half of the capacity consumed for over half of the time.
4. Long-Running Job Workloads
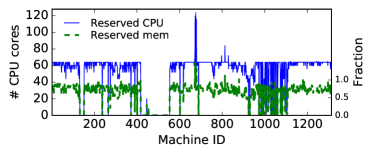
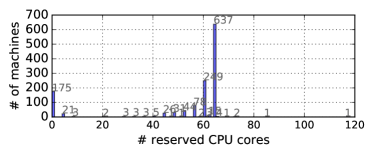
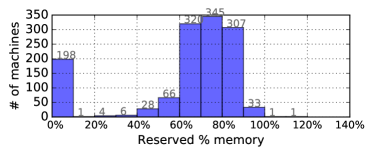
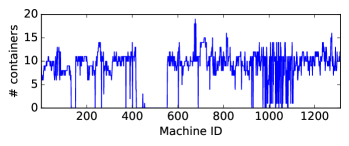
Resource reservation. We first calculate the per-machine resource amount requested and reserved by containerized long-running jobs from the container request trace (container_event.csv). Figure 4 show that, except for a few servers with overbooked CPUs (spikes in machine 671–679, and semi-spikes in machine 797–829), the machine-level CPU allocation are consistently capped at 64–the maximum number of CPU cores of one machine. Figure 5 and Figure 6 plot the same trend: for both CPU and memory allocation, overbooking is rare but does exist; about half of the machines (637) get all 64 cores reserved for containerized long-running applications; – of memory on machines are reserved for containers. Deep troughs in Figure 4 are due to zero container deployment on the machines. In fact, container management systems such as Sigma (alibaba_sigma, ) need to consider a lot of other constraints when performing scheduling for long-running containers, including affinity and anti-affinity constraints (e.g., co-locating applications that belong to the same services for reducing network cost, or co-locating applications with complementary runtime behaviors), application priorities, whether or not the co-located applications tolerate resource overbooking of the same host machine (medea_eurosys18, ). A side effect of such multi-constraint multi-objective optimization is that the number of containers is unevenly distributed across the cluster as shown in Figure 7.
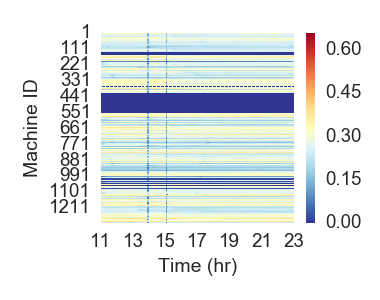
Resource usage. The container workload trace (container_usage.csv) samples the resource usage of each container every 5 minutes. We aggregate all the container-level resource usage statistics by the machine ID based on mapping recorded in the container_event.csv file and plot the resource usage heat map shown in Figure 8. The dominating pattern is the horizontal stripes across the 12-hour tracing period444 The wide dark blue stripe showing no container activity is due to that Alibaba intentionally leave a portion of machines as buffer area which, if the long-running applications (containers) are of low load, are solely designated for running batch jobs. When online service are experiencing high load, batch jobs running in buffer area can be evicted and resources can be preempted by the containers (alibaba_sigma, ). . Each stripe corresponds to one machine holding multiple containers, clearly reflecting the long-running nature555 Container re-scheduling and migration is not fully supported in Sigma yet. of containerized applications. Another observation we make is that, even though Sigma tries to balance out the amount of reserved resources (as one constraint of the scheduling heuristic), the actual CPU and memory usage by container workloads are imbalanced across all machines.
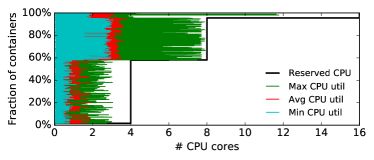
Resource Over-provisioning and Usage Dynamicity. To better understand the observed resource usage imbalance, we compare the reserved CPU and memory capacity with the actual usage, as shown in Figure 9. We make the following observations: (1) CPU resources are over-provisioned by all containers (Figure 9(a)), while memory resources are over-committed by a large majority of containers (Figure 9(b)). (2) The CPU and memory request patterns are clearly visible—CPU requests have 4 distinguishable patterns while memory requests have 6. (3) of containers are inactive in terms of CPU usage, having less than average CPU utilization with the maximum percentile capped at ; average resource usage correlates to temporal stability—the more resource consumed on average, the higher the temporal variation tends to be—this is especially true for CPU; memory usage dynamicity is not as high as that of CPU. (4) Most containers have a higher average memory usage above , which is as expected since containers need a minimum amount of memory to keep online services functional. This is, in fact, consistent with the well-studied behaviors of web-scale distributed storage workloads (docker_fast18, ; mbal_eurosys15, ; memshare_atc17, ; mos_pdsw15, ; mos_hpdc16, ).
Insights. Based on the observations, we infer the following. (1) A majority of the long-running containerized interactive services stay inactive (at least during the 12-hour trace period); this finding is consistent with other interactive workload studies (memcached_sigmetrics12, ; memcache_nsdi13, )666 E.g., Facebook’s largest Memcached pool ETC deploys hundreds of Memcached servers but only absorbs an incredibly low average of 50K queries per second (memcached_sigmetrics12, ). , implying a demand for elastic interactive service systems. (2) Long-running services are relatively more memory-hungry; ample CPU resources reserved through resource over-provisioning are needed to provide performance guarantee (stringent latency and throughput requirement); this is especially true for in-memory computing whose first-priority resources are essentially memory777 Being consistent with the observations made in the Memcached workload study (memcached_sigmetrics12, ), companies like Facebook use a large Memcached pool driven by the huge demand for large memory capacity. . (3) It is possible to make accurate resource usage prediction based on the temporal usage dynamicity profiling (rc_sosp17, ), especially for memory which has a relatively stable usage pattern (see Figure 9(b)); the prediction can be used for more informed resource management decision making such as container re-scheduling/migration.
5. Batch Job Workloads
Resource usage. The batch job workloads exhibit different resource patterns compared to that of containerized long-running job workloads. We calculate the batch job workload resource usage shown in Figure 10 by subtracting the usage of containers (Figure 8) from the overall usage (Figure 2) of the cluster. We confirmed the accuracy of the results by comparing it against the sum of all batch task instances’ runtime usage values under a certain timestamp. The vertical stripes (batch job waves) in Figure 10 is due to the dynamic nature of batch job workloads—task instances are transient and most of them finish in seconds. We can also observe that, within a single wave, the CPU and memory resource usage are roughly balanced across the cluster (later quantitatively demonstrated in Section 6), except for some regions with no batch jobs scheduled (i.e., the horizontal, dark blue stripes). This is because: (1) Fuxi is not constrained by data locality thanks to compute and storage disaggregated infrastructure at Alibaba (for batch jobs all data are stored and accessed remotely (alistore, )), hence task instances can be scheduled anywhere there is enough resource888 Batch job trace has no disk statistics capturing intermediate data storage usage. ; (2) Fuxi adopts an incremental scheduling heuristic that incrementally fulfills the resource demands at per-machine level (fuxi_vldb14, ).
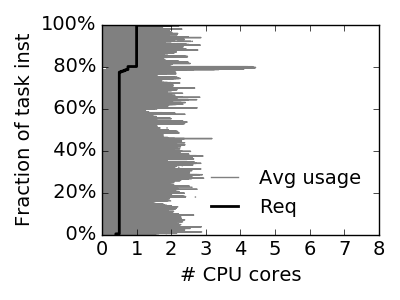
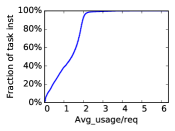
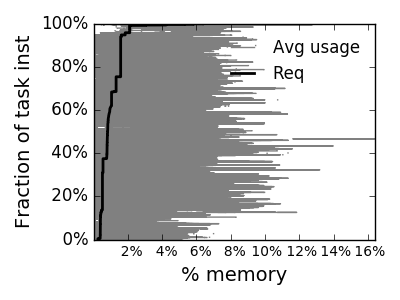
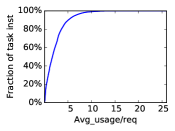
Figure 11 depicts the CDFs of requested CPU amount vs. runtime CPU usage. The over-commitment trend is clearly shown in Figure 11(a) and Figure 11(c). Quantitatively, task instances use CPU cores more than requested (Figure 11(b)), while more than task instances have an overcommitment ratio ( ratio) from 1–5 (Figure 11(d)). This is understandable, as a large number of short-task-dominated, transient batch jobs can elastically over-commit resources that are originally reserved by the over-provisioned long-running jobs.
Task scheduling. The trace files batch_task.csv and batch_instance.csv contain the detailed batch job profile information including job composition (how many tasks per job and how many instances per task), spacial (how task instances are mapped to the machines) and temporal information (how long each task instance runs), and average/max resource usage (though not complete). By combining the spacial/temporal and job composition information, we can easily infer the DAG structure of a specific batch job.
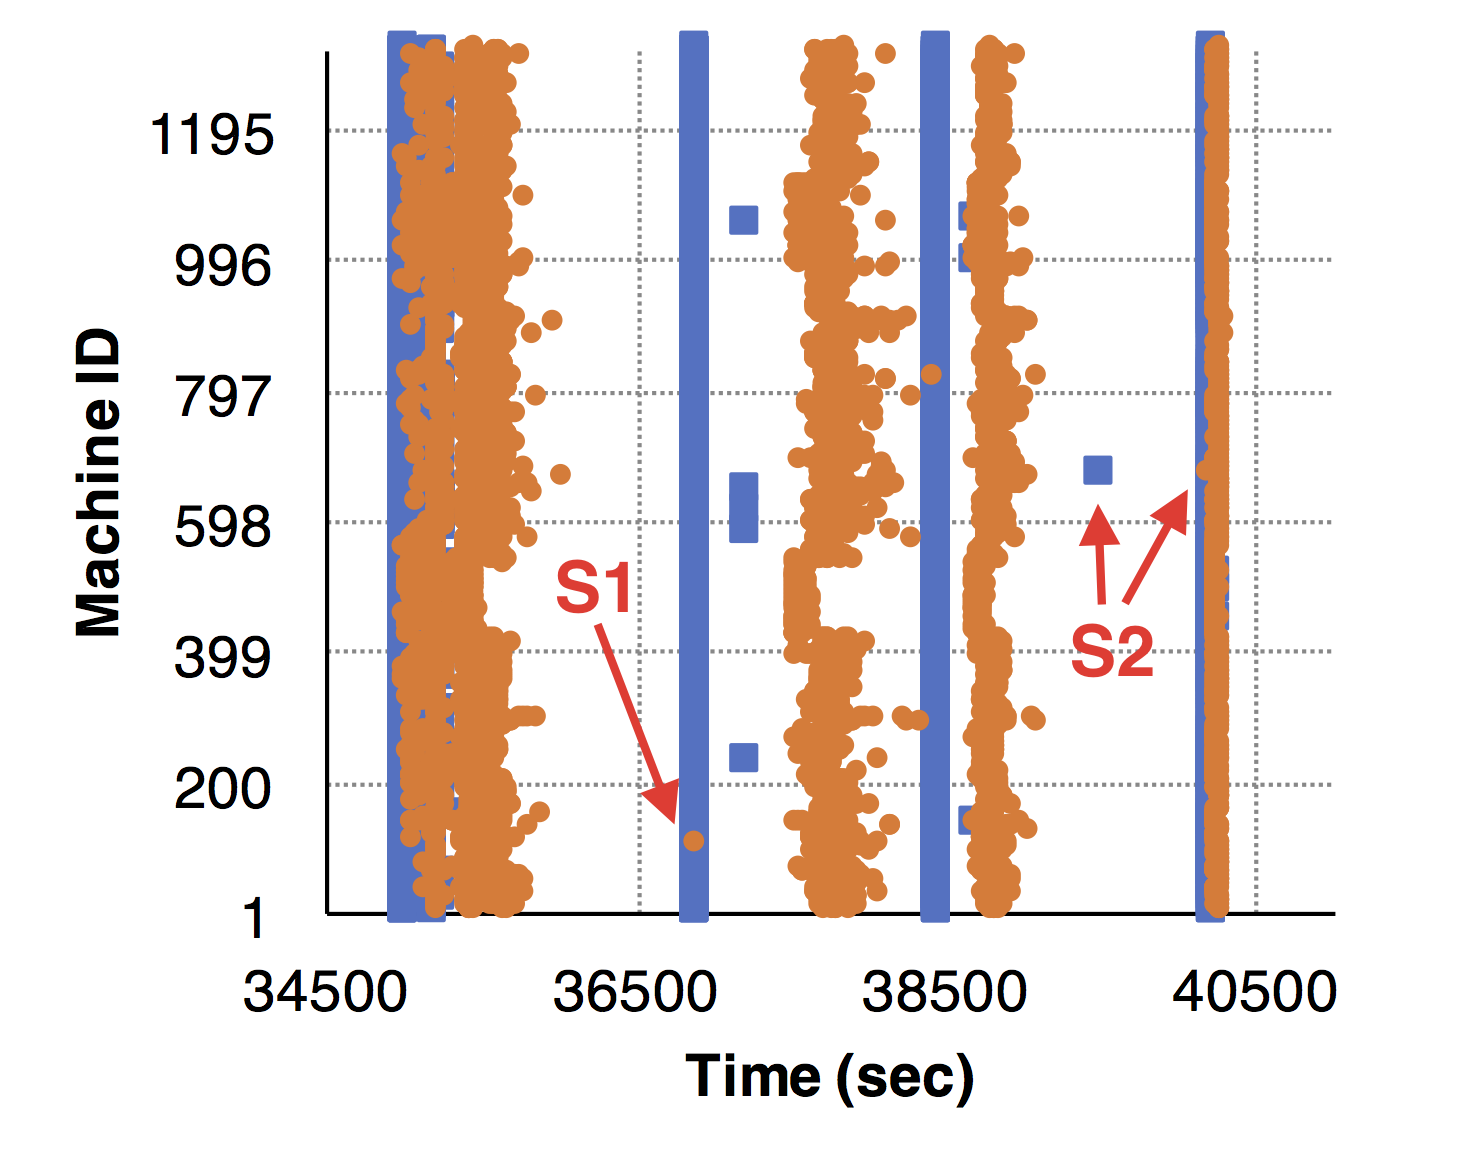
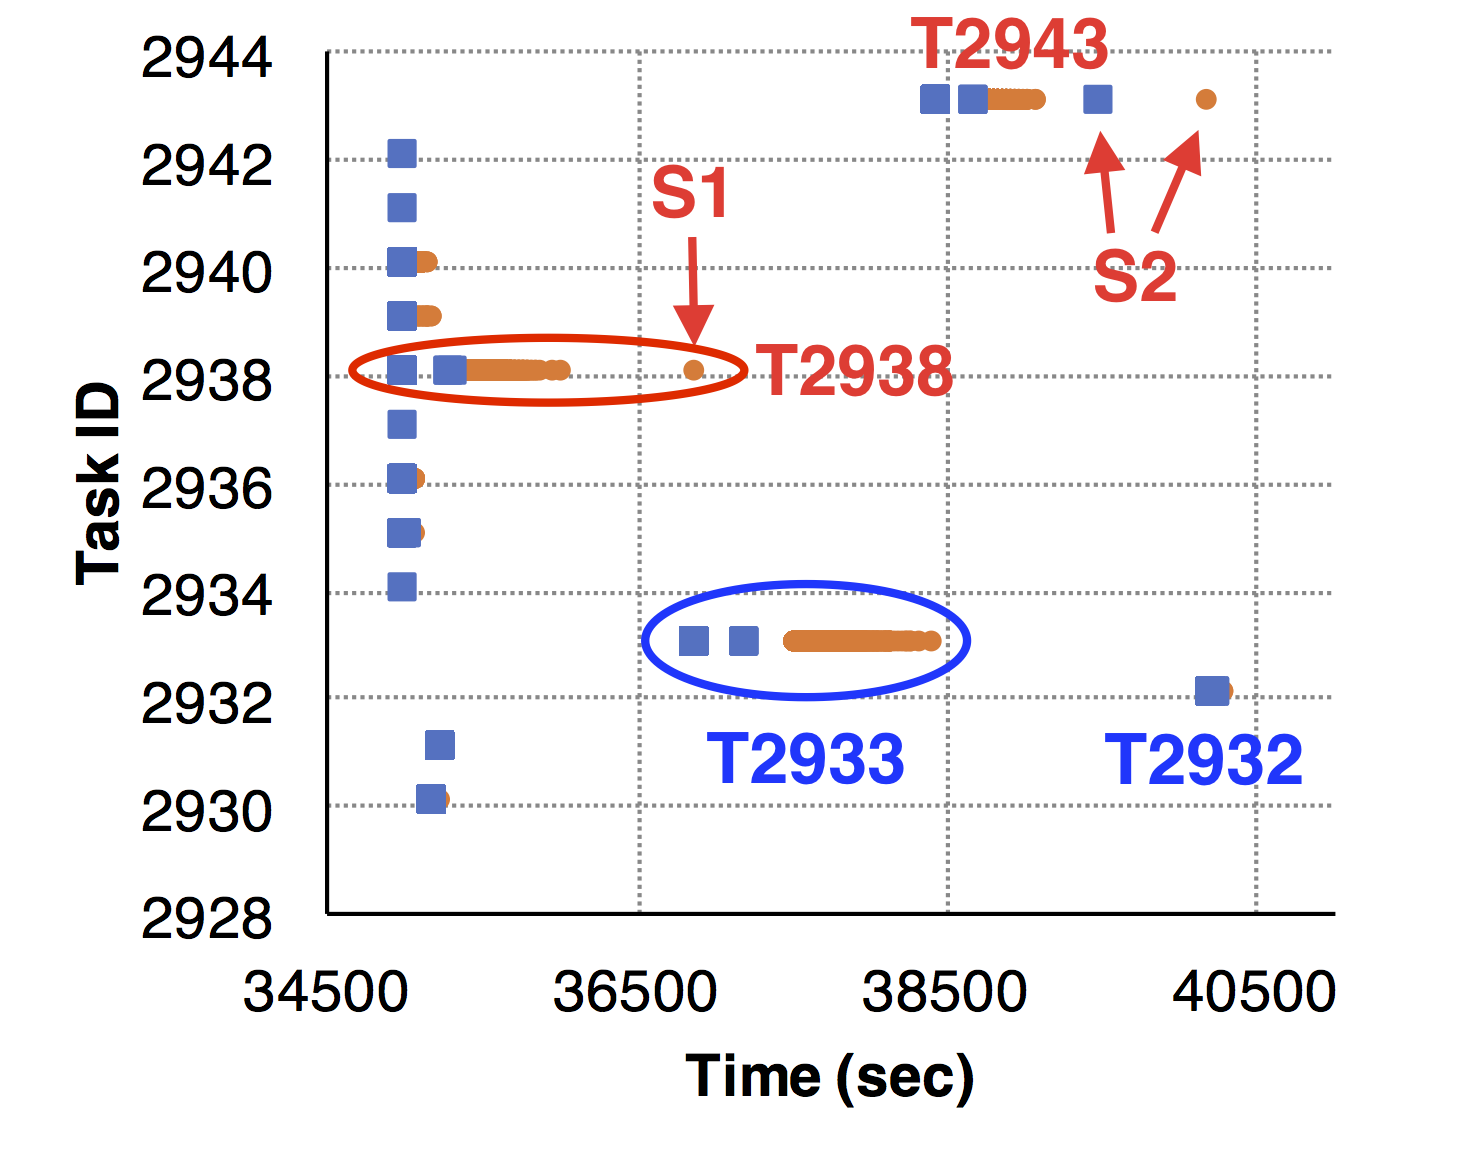
One question we want to answer is whether the well-studied issue (dolly_nsdi13, ; late_osdi08, ) still persists in Alibaba’s datacenters–The answer is surprisingly yes. To illustrate the impact of stragglers on job performance, Figure 12 visualizes Job 556’s execution. We can easily spot two stragglers. S1, which has a starting timestamp same as the rest other instances of the same task T2938 but an end timestamp way behind the rest, results in delayed scheduling and execution of T2933 (the wave in Figure 12(a)). S2, belonging to T2943, has a lagged starting timestamp greater than that of the rest; a direct result is the delayed execution of T2932 (the wave in Figure 12(a)). To distinguish between these two typical cases, we call the S1 kind of task instances as stragglers, and the S2 kind of tasks instances starvers.
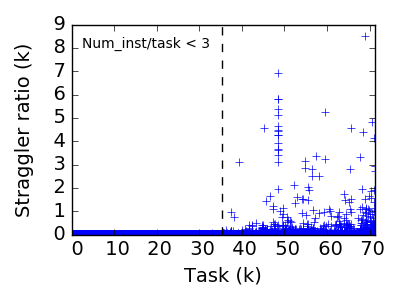
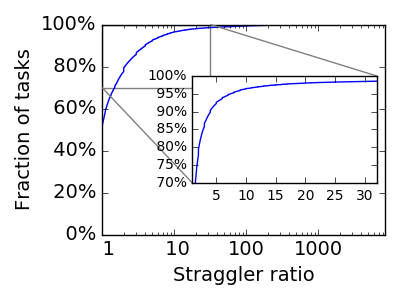
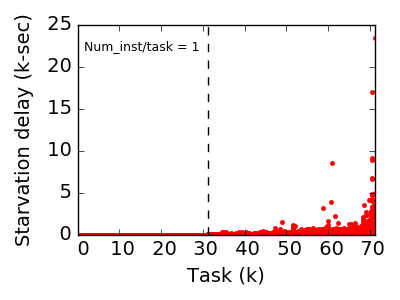
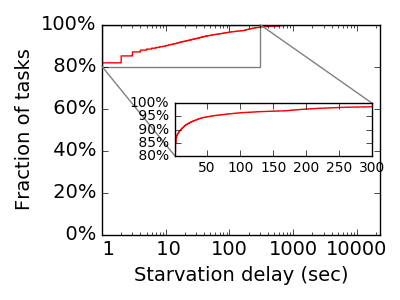
We then scan the execution profiles of all tasks included in the trace. We iterate through all tasks and calculate the straggler ratios (defined as the ratio of the maximum and minimum instance makespan of the corresponding tasks) and starvation delays (defined as the difference between the largest and the smallest instance starting timestamp of the corresponding tasks). Figure 13(a) and Figure 13(c) depict the straggler and starver distribution, respectively. As the task size (i.e., number of instances per task) increases, the straggler ratio and starvation delay increases accordingly. As shown in Figure 13(b), around tasks have a straggler ratio of 1, because half of them have 1 or 2 instances. tasks have a straggler ratio greater than , with the highest as . Figure 13(d) shows that tasks have a starvation delay longer than 100 seconds, with the longest as 23379 seconds.
We further investigate the reasons by looking into the detailed task traces. Straggler patterns included in the trace and possible causes are classified as follows. (1) Some straggler is significantly slower than the rest, which seems a common case due to either misconfiguration (e.g., disabling speculative execution (spec, )) or severely imbalanced load (e.g., a task instance getting more work to do than the rest). (2) Some task instances have long execution time and hence suffer a higher chance of getting failed; failed instances get re-scheduled (caught in the trace) and as a result suffer long starvation delay. (3) A straggler is spotted and interrupted999 Fuxi’s speculative execution technique where Fuxi interrupts long-tail instance and launches backup instance (fuxi_vldb14, ). at a very late time (one extreme example in the trace: few hours after of task instances of have finished the execution, while most of other task instances finish in seconds) by Fuxi; as a result, Fuxi launches a speculative backup instance, which may finish quick or take very long time to finish; either way, this scenario results in a false positive long starvation delay, or much worse–an extremely large straggler ratio. (4) Some task instance is interrupted and gets indefinitely starved (possibly due to low priority) while waiting for re-scheduling, resulting in surprisingly long starvation delay.
Insights. Based on the observations, we infer the following. (1) Workloads of transient batch jobs with many short-lived tasks exhibit resource patterns perfectly complementing that of over-provisioned, long-running, mostly CPU-inactive, containerized applications; those free resources not yet consumed by the long-running applications have to be efficiently utilized by batch jobs; essentially, this is key to improve the overall cluster utilization; furthermore, users do not quite care about accurately estimating the actual resource usage of the to-be-submitted batch jobs101010 Our hypothesis got confirmed by Alibaba engineers. ; (2) The notoriously persisting straggler issues might be eliminated by enforcing/adding more comprehensive configuration settings at the administrator/developer side or via more careful data partitioning planning at the user side. For example, for interrupted task instances that are suffering from starvation (Fuxi failed to re-schedule them in time), some priority-based scheme (e.g., MLFQ-liked scheduling heuristic (mlfq, )) may help. Users also take responsibilities. Users should carefully plan on data partitioning to avoid imbalanced input assignments.
6. Workload Co-location
Resource usage
Recall that Figure 8 shows machine region in the cluster
with no container deployment (the dark blue horizontal stripe). We
are particularly interested in how Fuxi (fuxi_vldb14, ) allocates
resources in such Batch only machine region. We thus
partition the cluster into a Batch only region where
only batch jobs are running, and a Co-located region
where both long-running and batch jobs are sharing the resources.
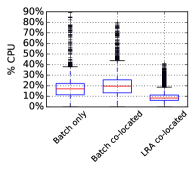
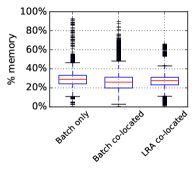
Figure 14 depicts the CPU and memory resource usage
distribution as a function of workload type and partitioned machine
region.
We observe that in Batch only region the average
resource utilization is almost the same as that of batch jobs in
Co-located region.
This implies that: (1) Batch only region’s resource
utilization is significantly lower than that of the co-located
region; and (2) Fuxi–the batch scheduler–does not take into account
the resource usage heterogeneity caused by co-located long-running
job workloads.
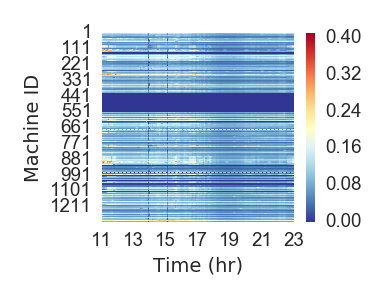
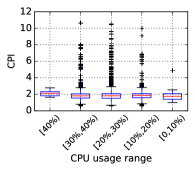
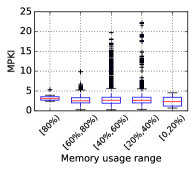
Performance metrics The container trace records the runtime performance metrics including mean/maximum CPI (cycles per instruction) and MPKI (memory accesses per kilo-instructions). To study the container co-location impact on performance, we break down the CPU and memory resource usage into ranges and partition the cluster based on that. Figure 15 plots the maximum CPI and MPKI distributions at different resource usage ranges at per machine level. Statistically, both CPI and MPKI (the major percentiles e.g. medium) reaches the highest at highest resource utilization: + for CPU usage, and + for memory usage. Outliers at other usage ranges do exist and account for only a negligible set of data points. Note that the resource usage here accounts for both containerized long-running applications and non-containerized batch job workloads. This also implies that co-location tends to introduce performance interference when resource contention (i.e., resource usage) increases.
Insights
Based on the observations, we infer the following.
Fuxi makes seemingly independent scheduling decisions by assuming
a homogeneous resource pool, regardless of the co-existence of the
long-running container deployment; however, the heterogeneity caused
by Sigma should be hinted via the global Level-0
controller (alibaba_sigma, ) to Fuxi for more efficient resource
scheduling. For example, a smart global controller would be able to
detect low resource utilization and take action by accommodating more
batch jobs at Batch only region.
Multiple workload-specific resource schedulers demand a better
global controller design that cohesively manages complex co-located
workloads—this may be directly applicable to Alibaba’s two-level
CMS architecture; we argue, however, that the generality of the
insights is critical for system designers and IT practitioners
working on CMSs as well.
7. Conclusion, Discussion Points, and Future Work
Aiming at improving the overall resource utilization, workload co-location results in exponentially increased complexity for warehouse-scale datacenter resource management. Analysis of the Alibaba cluster trace reveals such challenges, for which new resource scheduling approach that has a deeper sense of co-location will likely be necessary. We believe that our findings will lead to hot discussion on the following points of interest. (1) How to improve current global coordinator design so as to seamlessly incorporates the diversified but complementary workload behaviors of co-located workloads for more efficient resource management? (2) What machine learning (ML) algorithms are most suitable and how much training data is needed for accurately predicting the resource dynamicity and footprint of container workloads or even the highly dynamic batch workloads with interferences (rc_sosp17, )? (3) Potential issues introduced to designers of CMSs when co-locating more than 2 types of workloads with diversified dynamicity and resource usage patterns. A particular point of interest is co-locating and managing large-scale ML workloads (tensorflow_osdi16, ; proteus_eurosys17, ; slaq_socc17, ) with intensive use of heterogeneous accelerators (geeps_eurosys16, ; tetrisched_eurosys16, ). In the future, we would like to investigate and explore the above directions as well.
Acknowledgments
We thank Dr. Haiyang Ding from Alibaba for his valuable feedback on an early version of this manuscript. This work was sponsored by GMU.
References
- (1) Alibaba production cluster data. https://github.com/alibaba/clusterdata.
- (2) Alibaba Vendor BoF. https://www.usenix.org/conference/fast18/bofs#alibaba.
- (3) Google cluster workload traces. https://github.com/google/cluster-data.
- (4) Hadoop Tutorial: Fault Tolerance. https://developer.yahoo.com/hadoop/tutorial/module4.html.
- (5) Kubernetes: Production-Grade Container Orchestration. https://kubernetes.io/.
- (6) Linux Containers. https://linuxcontainers.org/.
- (7) Maximizing CPU Resource Utilization on Alibaba’s Servers. https://102.alibaba.com/detail/?id=61.
- (8) Pouch - An Efficient Enterprise-class Rich Container Engine. https://github.com/alibaba/pouch.
- (9) The Datacenter as a Computer: An Introduction to the Design of Warehouse-Scale Machines, Second edition. https://doi.org/10.2200/S00516ED2V01Y201306CAC024.
- (10) Abadi, M., Barham, P., Chen, J., Chen, Z., Davis, A., Dean, J., Devin, M., Ghemawat, S., Irving, G., Isard, M., Kudlur, M., Levenberg, J., Monga, R., Moore, S., Murray, D. G., Steiner, B., Tucker, P., Vasudevan, V., Warden, P., Wicke, M., Yu, Y., and Zheng, X. Tensorflow: A system for large-scale machine learning. In 12th USENIX Symposium on Operating Systems Design and Implementation (OSDI 16) (Savannah, GA, 2016), USENIX Association, pp. 265–283.
- (11) Ananthanarayanan, G., Ghodsi, A., Shenker, S., and Stoica, I. Effective straggler mitigation: Attack of the clones. In Presented as part of the 10th USENIX Symposium on Networked Systems Design and Implementation (NSDI 13) (Lombard, IL, 2013), USENIX, pp. 185–198.
- (12) Anwar, A., Cheng, Y., Gupta, A., and Butt, A. R. Taming the cloud object storage with mos. In Proceedings of the 10th Parallel Data Storage Workshop (New York, NY, USA, 2015), PDSW ’15, ACM, pp. 7–12.
- (13) Anwar, A., Cheng, Y., Gupta, A., and Butt, A. R. Mos: Workload-aware elasticity for cloud object stores. In Proceedings of the 25th ACM International Symposium on High-Performance Parallel and Distributed Computing (New York, NY, USA, 2016), HPDC ’16, ACM, pp. 177–188.
- (14) Anwar, A., Mohamed, M., Tarasov, V., Littley, M., Rupprecht, L., Cheng, Y., Zhao, N., Skourtis, D., Warke, A. S., Ludwig, H., Hildebrand, D., and Butt, A. R. Improving docker registry design based on production workload analysis. In 16th USENIX Conference on File and Storage Technologies (FAST 18) (Oakland, CA, 2018), USENIX Association, pp. 265–278.
- (15) Atikoglu, B., Xu, Y., Frachtenberg, E., Jiang, S., and Paleczny, M. Workload analysis of a large-scale key-value store. In Proceedings of the 12th ACM SIGMETRICS/PERFORMANCE Joint International Conference on Measurement and Modeling of Computer Systems (New York, NY, USA, 2012), SIGMETRICS ’12, ACM, pp. 53–64.
- (16) Barham, P., Dragovic, B., Fraser, K., Hand, S., Harris, T., Ho, A., Neugebauer, R., Pratt, I., and Warfield, A. Xen and the art of virtualization. In Proceedings of the Nineteenth ACM Symposium on Operating Systems Principles (New York, NY, USA, 2003), SOSP ’03, ACM, pp. 164–177.
- (17) Burns, B., Grant, B., Oppenheimer, D., Brewer, E., and Wilkes, J. Borg, omega, and kubernetes. Queue 14, 1 (Jan. 2016), 10:70–10:93.
- (18) Cheng, Y., Gupta, A., and Butt, A. R. An in-memory object caching framework with adaptive load balancing. In Proceedings of the Tenth European Conference on Computer Systems (New York, NY, USA, 2015), EuroSys ’15, ACM, pp. 4:1–4:16.
- (19) Cidon, A., Rushton, D., Rumble, S. M., and Stutsman, R. Memshare: a dynamic multi-tenant key-value cache. In 2017 USENIX Annual Technical Conference (USENIX ATC 17) (Santa Clara, CA, 2017), USENIX Association, pp. 321–334.
- (20) Corbató, F. J., Merwin-Daggett, M., and Daley, R. C. An experimental time-sharing system. In Proceedings of the May 1-3, 1962, Spring Joint Computer Conference (New York, NY, USA, 1962), AIEE-IRE ’62 (Spring), ACM, pp. 335–344.
- (21) Cortez, E., Bonde, A., Muzio, A., Russinovich, M., Fontoura, M., and Bianchini, R. Resource central: Understanding and predicting workloads for improved resource management in large cloud platforms. In ACM SOSP ’17 (2017).
- (22) Cui, H., Zhang, H., Ganger, G. R., Gibbons, P. B., and Xing, E. P. Geeps: Scalable deep learning on distributed gpus with a gpu-specialized parameter server. In Proceedings of the Eleventh European Conference on Computer Systems (New York, NY, USA, 2016), EuroSys ’16, ACM, pp. 4:1–4:16.
- (23) Dean, J., and Ghemawat, S. Mapreduce: Simplified data processing on large clusters. In Proceedings of the 6th Conference on Symposium on Opearting Systems Design & Implementation - Volume 6 (Berkeley, CA, USA, 2004), OSDI’04, USENIX Association, pp. 10–10.
- (24) Delimitrou, C., and Kozyrakis, C. Paragon: Qos-aware scheduling for heterogeneous datacenters. In Proceedings of the Eighteenth International Conference on Architectural Support for Programming Languages and Operating Systems (New York, NY, USA, 2013), ASPLOS ’13, ACM, pp. 77–88.
- (25) Delimitrou, C., and Kozyrakis, C. Quasar: Resource-efficient and qos-aware cluster management. In Proceedings of the 19th International Conference on Architectural Support for Programming Languages and Operating Systems (New York, NY, USA, 2014), ASPLOS ’14, ACM, pp. 127–144.
- (26) Di, S., Kondo, D., and Cirne, W. Characterization and comparison of cloud versus grid workloads. In 2012 IEEE International Conference on Cluster Computing (Sept 2012), pp. 230–238.
- (27) Garefalakis, P., Karanasos, K., Pietzuch, P., Suresh, A., and Rao, S. Medea: Scheduling of long running applications in shared production clusters. In ACM EuroSys ’18 (2018).
- (28) Harlap, A., Tumanov, A., Chung, A., Ganger, G. R., and Gibbons, P. B. Proteus: Agile ml elasticity through tiered reliability in dynamic resource markets. In Proceedings of the Twelfth European Conference on Computer Systems (New York, NY, USA, 2017), EuroSys ’17, ACM, pp. 589–604.
- (29) Hindman, B., Konwinski, A., Zaharia, M., Ghodsi, A., Joseph, A. D., Katz, R., Shenker, S., and Stoica, I. Mesos: A platform for fine-grained resource sharing in the data center. In Proceedings of the 8th USENIX Conference on Networked Systems Design and Implementation (Berkeley, CA, USA, 2011), NSDI’11, USENIX Association, pp. 295–308.
- (30) Janus, P., and Rzadca, K. Slo-aware colocation of data center tasks based on instantaneous processor requirements. In Proceedings of the 2017 Symposium on Cloud Computing (New York, NY, USA, 2017), SoCC ’17, ACM, pp. 256–268.
- (31) Liu, H. A measurement study of server utilization in public clouds. In 2011 IEEE Ninth International Conference on Dependable, Autonomic and Secure Computing (Dec 2011), pp. 435–442.
- (32) Liu, Z., and Cho, S. Characterizing machines and workloads on a google cluster. In 2012 41st International Conference on Parallel Processing Workshops (Sept 2012), pp. 397–403.
- (33) Lu, C., Ye, K., Xu, G., Xu, C. Z., and Bai, T. Imbalance in the cloud: An analysis on alibaba cluster trace. In 2017 IEEE International Conference on Big Data (Big Data) (Dec 2017), pp. 2884–2892.
- (34) Mars, J., Tang, L., Hundt, R., Skadron, K., and Soffa, M. L. Bubble-up: Increasing utilization in modern warehouse scale computers via sensible co-locations. In Proceedings of the 44th Annual IEEE/ACM International Symposium on Microarchitecture (New York, NY, USA, 2011), MICRO-44, ACM, pp. 248–259.
- (35) Nishtala, R., Fugal, H., Grimm, S., Kwiatkowski, M., Lee, H., Li, H. C., McElroy, R., Paleczny, M., Peek, D., Saab, P., Stafford, D., Tung, T., and Venkataramani, V. Scaling memcache at facebook. In Presented as part of the 10th USENIX Symposium on Networked Systems Design and Implementation (NSDI 13) (Lombard, IL, 2013), USENIX, pp. 385–398.
- (36) Reiss, C., Tumanov, A., Ganger, G. R., Katz, R. H., and Kozuch, M. A. Heterogeneity and dynamicity of clouds at scale: Google trace analysis. In Proceedings of the Third ACM Symposium on Cloud Computing (New York, NY, USA, 2012), SoCC ’12, ACM, pp. 7:1–7:13.
- (37) Schwarzkopf, M., Konwinski, A., Abd-El-Malek, M., and Wilkes, J. Omega: Flexible, scalable schedulers for large compute clusters. In Proceedings of the 8th ACM European Conference on Computer Systems (New York, NY, USA, 2013), EuroSys ’13, ACM, pp. 351–364.
- (38) Tumanov, A., Zhu, T., Park, J. W., Kozuch, M. A., Harchol-Balter, M., and Ganger, G. R. Tetrisched: Global rescheduling with adaptive plan-ahead in dynamic heterogeneous clusters. In Proceedings of the Eleventh European Conference on Computer Systems (New York, NY, USA, 2016), EuroSys ’16, ACM, pp. 35:1–35:16.
- (39) Verma, A., Pedrosa, L., Korupolu, M., Oppenheimer, D., Tune, E., and Wilkes, J. Large-scale cluster management at google with borg. In Proceedings of the Tenth European Conference on Computer Systems (New York, NY, USA, 2015), EuroSys ’15, ACM, pp. 18:1–18:17.
- (40) Yang, H.-c., Dasdan, A., Hsiao, R.-L., and Parker, D. S. Map-reduce-merge: Simplified relational data processing on large clusters. In Proceedings of the 2007 ACM SIGMOD International Conference on Management of Data (New York, NY, USA, 2007), SIGMOD ’07, ACM, pp. 1029–1040.
- (41) Zaharia, M., Hindman, B., Konwinski, A., Ghodsi, A., Joesph, A. D., Katz, R., Shenker, S., and Stoica, I. The datacenter needs an operating system. In Proceedings of the 3rd USENIX Conference on Hot Topics in Cloud Computing (Berkeley, CA, USA, 2011), HotCloud’11, USENIX Association, pp. 17–17.
- (42) Zaharia, M., Konwinski, A., Joseph, A. D., Katz, R., and Stoica, I. Improving mapreduce performance in heterogeneous environments. In Proceedings of the 8th USENIX Conference on Operating Systems Design and Implementation (Berkeley, CA, USA, 2008), OSDI’08, USENIX Association, pp. 29–42.
- (43) Zhang, H., Stafman, L., Or, A., and Freedman, M. J. Slaq: Quality-driven scheduling for distributed machine learning. In Proceedings of the 2017 Symposium on Cloud Computing (New York, NY, USA, 2017), SoCC ’17, ACM, pp. 390–404.
- (44) Zhang, Q., Zhani, M. F., Zhang, S., Zhu, Q., Boutaba, R., and Hellerstein, J. L. Dynamic energy-aware capacity provisioning for cloud computing environments. In Proceedings of the 9th International Conference on Autonomic Computing (New York, NY, USA, 2012), ICAC ’12, ACM, pp. 145–154.
- (45) Zhang, X., Tune, E., Hagmann, R., Jnagal, R., Gokhale, V., and Wilkes, J. Cpi2: Cpu performance isolation for shared compute clusters. In Proceedings of the 8th ACM European Conference on Computer Systems (New York, NY, USA, 2013), EuroSys ’13, ACM, pp. 379–391.
- (46) Zhang, Z., Li, C., Tao, Y., Yang, R., Tang, H., and Xu, J. Fuxi: A fault-tolerant resource management and job scheduling system at internet scale. Proc. VLDB Endow. 7, 13 (Aug. 2014), 1393–1404.