Chandra X-ray Observatory and Hubble Space Telescope observations of the intermediate-age cluster GLIMPSEC01
Abstract
We report the results of Hubble Space Telescope (HST) and Chandra X-ray Observatory (CXO) observations of the GLIMPSE-C01 (hereafter GC01) star cluster. Color-magnitude and color-color diagrams suggest a cluster age of Gyrs up to Gyrs (dependent on GC01’s metallicity), a distance of 3.3-3.5 kpc, and strong differential reddening with . After performing astrometric corrections, we find that nine of the 15 X-ray sources have at least one NIR counterpart within the 2 CXO positional error circles. However, given the very high density of NIR sources in the cluster, most of these counterparts are likely due to chance coincidence. We jointly analyze the X-ray and NIR properties to assess the likelihood of true associations. Based primarily on their X-ray properties, we identify an LMXB candidate (source X2), a CV candidate (source X1), and an AB candidate (source X9). Source X11 is detected during an X-ray flaring episode with a flare luminosity ( erg s-1) and has a quiescent luminosity erg s-1, in 0.5–8 keV at the distance of GC01, suggesting that the source is either an AB or CV. We also discuss the limits on an intermediate mass black hole at the center of GC01 and the challenges of X-ray source classification imposed by the limitations of the existing data and instrumentation along with future prospects in the James Webb Space Telescope era.
1 Introduction
Thousands of star clusters exist within the Milky Way Galaxy and galactic halo (Scholz et al., 2015). Typically these clusters are classified either as old globular clusters (GCs), which have high concentrations of stars, or open clusters, which are less dense. Open clusters, typically found in the galactic disk, have masses on the order of 103 M⊙, near-solar metallicities, and ages ranging between 1 Myr and 1 Gyr, although several old open clusters have also been discovered (e.g., NGC 6791, NGC 188; Kharchenko et al. 2005). Among these are the Young Massive Clusters (YMCs), which are sometimes considered to be a class on their own, with masses and ages up to a few hundred Myrs (Portegies Zwart et al., 2010). Low-metallicity GCs are mostly found in the Galactic halo (although higher metallicity GCs exist in the disk) with masses – M⊙ and ages of Gyrs (see e.g., Fig 9 in Dotter et al. 2010).
The GLIMPSEC01 cluster (GC01, hereafter), which was discovered with Spitzer during the Galactic Legacy Infrared Mid Plane Survey (Kobulnicky et al., 2005), is interesting because it does not fit well into any of these categories. GC01 is located at , , and lies within 10 pc of the Galactic mid-plane. It was originally estimated to have a mass of M⊙, a half-light radius of 36′′, and a distance of 3.1-5.2 kpc (Kobulnicky et al., 2005). This cluster is also highly reddened with , which likely varies across the cluster (Kobulnicky et al. 2005; Ivanov et al. 2005; Davidge et al. 2016).
Since the discovery of GC01, widely varying distance and age estimates have been reported. Both Ivanov et al. (2005) and Davidge et al. (2016) used red clump stars, observed in slightly different filters, to estimate a distance to GC01 of 3.7 and 5.2 kpc, respectively. Davies et al. (2011) used near infrared spectroscopy of 50 stars in the cluster to calculate their velocities and, by assuming that GC01 is moving with the disk, derive a kinematic distance of 5.0 kpc. The measured velocity dispersion of the stars suggests a virial mass of (8104 M⊙ (Davies et al., 2011).
Due to its centrally-concentrated appearance in the NIR images, GC01 strongly resembles GCs. Therefore, it was initially suggested that GC01 is a GC with an age of at least a few Gyr. The diffuse infrared emission coincident with GC01 in both Spitzer IRAC and MIPS images was interpreted in support of a GC passing through the Galactic disk and interacting with the gas and dust in the disk (Kobulnicky et al., 2005). The advanced age and classification as a globular cluster would be consistent with the lack of radio emission (typically seen in younger open clusters), its high central stellar density, and the large number of giant branch stars with no luminous supergiants (Kobulnicky et al., 2005). However, Davies et al. (2011) found that GC01 is more compact than typical GCs of a similar mass and that the mass density is more similar to that of YMCs. Using the K-band mass-to-light ratio Davies et al. (2011) infer an age between 0.3 and 2 Gyr. Models of the Red Giant Branch (RGB) tip brightness in the color-magnitude diagram (CMD) for stars in GC01 also suggests an age between 1-2.5 Gyr (Davidge et al., 2016). Therefore, GC01 could be a rare intermediate age massive cluster (Davies et al., 2011).
The origin of massive GCs is a matter of ongoing debate (Renaud et al., 2017). It has been suggested that at least some massive GCs in the disk could be the outcome of YMCs evolution (Portegies Zwart et al., 2010). However, GCs could have also coalesced out of a primordial gas cloud that later collapsed into the Galactic disc (see e.g. Krauss & Chaboyer 2003). Furthermore, recent simulations show that low-metallicity GCs may represent the cores of satellite galaxies that merged with the Milky Way (Renaud et al., 2017). If the age of GC01 is indeed substantially less than the age of the Galaxy, its metallicity is closer to solar (Leaman et al., 2013), and its X-ray binary population is different from those in GCs, then it may represent a missing evolutionary link between the YMCs and massive GCs. On the other hand, if GC01 has a low metallicity and old age (as suggested by Ivanov et al. 2005 and Kobulnicky et al. 2005, respectively), then it could be similar to the rare GCs that reside in the Milky Way disk outside of the bulge, such as NGC 6544 (Cohen et al., 2014) and Glimpse-C02 (Kurtev et al., 2008).
Studies of X-ray sources located in open and globular clusters are crucial for understanding the evolution, dynamics, and stellar populations of these objects (van den Berg 2013; Pooley 2010, Heinke 2010). Typically, the X-ray populations of globular and aged open clusters consist of cataclysmic variables (CVs), non-accreting111These MPSs can be solitary, in wide binaries, or in binaries with a very low mass companion which is ablated by the pulsar’s wind (i.e., redbacks or blackwidows; for a recent review see Manchester 2017) millisecond radio pulsars (MSPs), neutron star (NS) or black hole (BH) low mass X-ray binaries which can be in quiescence (LMXBs or qLMXBs, respectively), and active binaries (ABs, such as RS CVn and W Uma type systems; van den Berg 2013; Pooley 2010, Heinke 2010). In dense GCs the relative numbers of these objects are expected to be related to the number of dynamical encounters (see Pooley & Hut 2006, Heinke et al. 2006, and references therein). In less-dense clusters the X-ray source population is more likely to be primordial in nature (see e.g., Kong et al. 2006, Lan et al. 2010). As a result, GCs tend to be rich with recycled MSPs, many of which are in binaries (e.g., Bogdanov et al. 2006), while in old ( Gyr) open clusters the observed dominating X-ray source population is ABs (see e.g., Vats & van den Berg 2017). If GC01 is indeed an intermediate age massive cluster, the population of X-ray sources would be essentially unknown. This prompted us to carry out multi-band Hubble Space Telescope (HST) observations to look for counterparts of the X-ray sources seen in the archival Chandra X-ray Observatory (CXO) image of GC01222The initial analysis of the CXO data was reported by Pooley et al. (2007). . Below we report the results of these HST observations together with a re-analysis of the archival CXO data and a discussion of the existing limitations and challenges imposed by the current instrumentation.
We present HST and CXO observations, and the data reduction methods in Section 2. In Section 3 we describe the analysis of the CXO and HST data, including the properties of the X-ray sources, NIR/optical photometry, and the cross-correlation of optical/NIR counterparts with the X-ray source positions. We describe the properties of the cluster in Section 4. The multi-wavelength classification of X-ray sources and the limit on the mass of a possible intermediate mass BH (IMBH) are discussed in Section 5. We discuss the current limitations of this study in Section 6 and summarize the results of our findings in Section 7.
2 Observations and Data Reduction
2.1 HST WFC3/UVIS and WFC3/IR Data
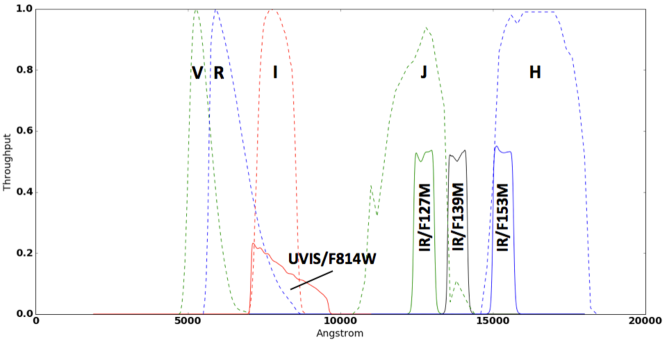
GC01 was observed by HST during a single-orbit visit on 2015 October 5 (GO 14183; see Table 1 for details). The program consisted of imaging observations with the Wide Field Camera 3 (WFC3), using both the Ultraviolet-Visible (UVIS; field of view with a 004 pixel scale) and the Infrared (IR; field of view with a 013 pixel scale) channels. The UVIS F814W (wide ) filter and a set of medium NIR filters (F127M, F139M, and F153M) were used (see Figure 1 for filter throughputs) and the exposure times for each filter are provided in Table 1. The data were downloaded from the Mikulski Archive for Space Telescopes (MAST333http://archive.stsci.edu/). The final images are produced by PyRAF’s task which aligns images from separate exposures and performs geometric distortion corrections.
The CCDs of the UVIS detector have degraded overtime due to their exposure to high energy particles in low-Earth orbit. This degradation causes streaking (i.e., leakage of the charge from a source pixel into adjacent pixels) in the direction of the readout resulting in losses in the charge transfer efficiency (CTE). These losses can lead to errors in the photometry and also affects the image quality. MAST provides UVIS images with the empirically-calculated444See http://www.stsci.edu/hst/wfc3/ins_performance/CTE/ for more details. CTE corrections applied. We used these CTE-corrected UVIS images for the photometric measurements reported below.
The high density of stars in GC01 makes PSF fitting photometry the only robust way to measure the positions and photometric magnitudes of the stars in the cluster. To perform the PSF fitting photometry we used the DOLPHOT555http://americano.dolphinsim.com/dolphot/ package (Dolphin, 2000). DOLPHOT has a number of adjustable parameters, which can influence the photometric measurements. We chose settings similar to those listed in Table 4 of Dalcanton et al. (2012) with the exception of the FitSky parameter value. This parameter fixes how the background is determined for the PSF fit. We adopted FitSky=2 since it is recommended666http://americano.dolphinsim.com/dolphot/dolphot.pdf for crowded fields. We had to apply a number of parameter cuts to the catalog produced by DOLPHOT to remove the spurious sources and those with inaccurate photometry (e.g., saturated and crowded sources). These cuts were chosen differently for different purposes and the specific choices are described below.
| Order | Channel | Filter | Exposure (s) |
|---|---|---|---|
| 1 | IR | F127M | 548 |
| 2 | IR | F139M | 598 |
| 3 | IR | F153M | 598 |
| 4 | UVIS | F814W | 540 |
Note. — All exposures were taken within a single HST orbit in the order specified in the Table.
2.2 CXO ACIS-S3 Data
We have downloaded and reanalyzed the archival CXO observation of GC01. The data were taken on 15 August 2006 (ObsID 6587) with the Advanced CCD Imaging Spectrometer (ACIS). The exposure time was 45.9 ks and GC01 was imaged on the back-illuminated S3 chip. The detector was operated in full-frame mode, which provides a time resolution of 3.24 s, with the ‘very faint’ telemetry format. We restricted the X-ray data analysis to the standard 0.5–8 keV energy range. To extract the properties of X-ray sources we used the CIAO tools777Chandra Interactive Analysis Tools (CIAO) version 4.9 and the ACIS Extract888See http://personal.psu.edu/psb6/ACIS/acis_analysis.html for details. package (Broos et al., 2010, 2012) for our analysis.
The X-ray sources are detected by locating local maxima in the reconstructed CXO image, which is created using the Lucy-Richardson image reconstruction algorithm (Lucy, 1974). The iterative source detection procedure and strategy, which is optimized for finding faint X-ray sources in crowded fields, is outlined in (Broos et al., 2010; Townsley et al., 2018). While determining the source’s position, the location of the source on the chip and its proximity to other sources is taken into account. Source positions for uncrowded, on-axis sources (all sources considered below are close to being on-axis) are determined by calculating the centroid of the events. If there are two or more sources near one another, finding the peak in a local maximum-likelihood image reconstruction is the most accurate way to recover the source positions (Broos et al., 2010). This procedure allowed us to accurately recover the positions of sources X9 and X14, which are located only 06 from each other and were reported as a single source (i.e., X7) in Pooley et al. (2007).
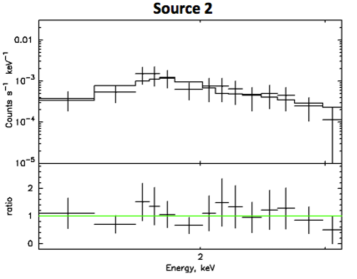
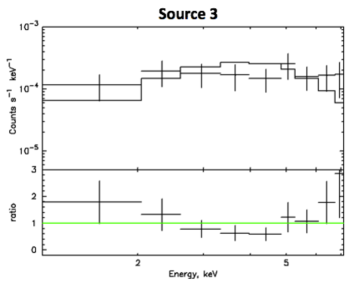
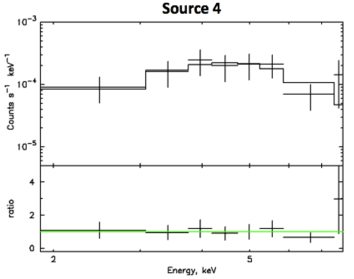
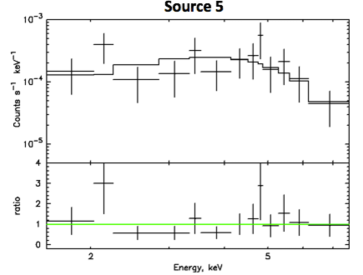
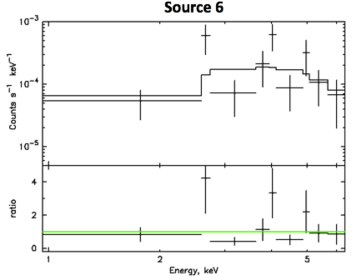
ACIS Extract provides fluxes for all sources, which are calculated by multiplying the median energy of the counts by the number of net counts and dividing by the exposure time and an aperture corrected mean effective area (Broos et al., 2010). For the six sources that have 30 net counts in the 0.5–8.0 keV band, we also extracted the spectra from circular apertures. The spectra were extracted using the CIAO tool specextract with an aperture correction applied to the effective area999See http://http://cxc.harvard.edu/ciao/threads/pointlike/. We then fit an absorbed power-law (PL) model to characterize their spectra. No background subtraction was performed because of its negligible contribution (i.e., of the total source counts for each of the sources in the 0.5-8 keV energy range). Due to the small number of counts in all fits, we fixed the hydrogen absorption column to cm-2, which corresponds to an extinction of 18 (a plausible value for GC01; see Section 4.2) assuming the – relation from Güver & Özel (2009). The X-ray spectra were fit using XSPEC version 12.9.1 (Arnaud, 1996). Throughout the paper, the photoelectric absorption cross-sections of Verner et al. (1996) were used with solar abundances (Anders & Grevesse, 1989) to account for absorption by neutral gas.
2.3 Astrometric Corrections
In order to accurately identify the WFC3/IR and UVIS counterparts to the X-ray sources we corrected the absolute astrometry of both the HST and CXO images. For the HST images we matched stars from the Two Micron All-Sky Survey catalog (2MASS; Skrutskie et al. 2006; Cutri et al. 2012) to stars in the field of view of the WFC3/IR. We chose 2MASS due to the overlap of the 2MASS and WFC3/IR filters. We then selected 24 stars from the F127M image with bright and unblended 2MASS counterparts. All selected stars are located outside the dense cluster core to avoid source confusion. Prior to the correction, a systematic offset of () was present between the 2MASS and WFC3/IR stars. We then calculated the astrometric offset between the sources and applied the coordinate transformation to the drizzled images. A subset of 11 of the original 24 WFC3/IR sources, which had unsaturated counterparts in the WFC3/UVIS images, were then used to align the WFC3/UVIS image to the WFC3/IR image.
For CXO, we found 10 sources in the 0.5–8 keV band ACIS image with 7 net counts that also had 2MASS counterparts and were located outside of the cluster’s core. We used the CIAO tools wcs_match to calculate the astrometric solution and wcs_update to apply the coordinate transformation. An offset of () existed prior to the astrometric correction. After applying the corrections to both CXO and HST, we calculated the root-mean square residuals of the alignments and added them in quadrature. The resulting value is adopted as the uncertainty of the image alignments.
3 Data Analysis
3.1 X-ray Sources
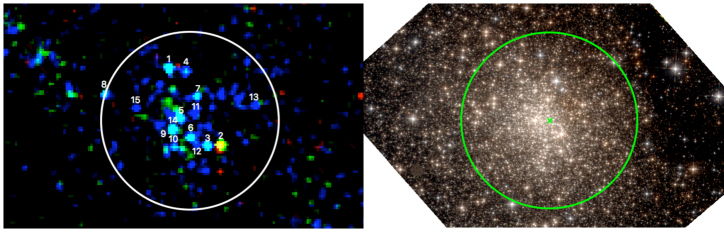
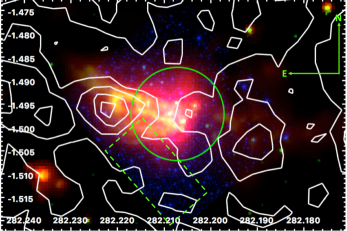
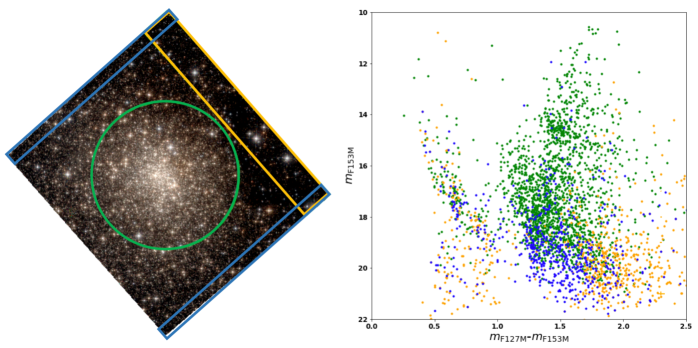
The source detection procedure (see Section 2.2 for details) found 15 X-ray sources with 6 net counts within (see Section 3.2) of the cluster center reported by Kobulnicky et al. (2005). Each sources X-ray properties were extracted using ACIS Extract, which also calculates the p-value () for the source extraction under the no-source null hypothesis (i.e., that all counts in the source aperture are background; Broos et al. 2010). Out of the 15 X-ray sources numbered in Figure 2 (see left panel), source X8 has the largest =7 in the 0.5–8 keV energy band. Therefore, all of these sources are confidently detected. The uncertainties of the X-ray source positions are computed from the statistical errors (from centroiding) and systematic errors from the absolute astrometry of CXO and HST (see Section 2.3) added in quadrature. We consider the 2 combined statistical and systematic positional uncertainties of the X-ray sources when searching for optical/NIR counterparts. The mean 2 positional uncertainty is 028.
For each source, we calculated an unabsorbed X-ray color defined as ), as well as the unabsorbed X-ray luminosity in the 0.58 keV band (see Table 2). The unabsorbed fluxes are calculated using the best-fit photon index () and the adopted above. All fainter sources, that do not pass the number of counts threshold for spectral fitting, have median photon energies keV, suggesting rather hard spectra (see Table 2). Therefore, to calculate the unabsorbed flux and luminosity for these sources we assume , which is the most typical best-fit value obtained for the brighter sources (see Table 2). Previously, Pooley et al. (2007) used a hydrogen absorption column density cm-2 in the absorbed power-law fits to the spectra. This was derived from the relation of Predehl & Schmitt (1995) using an reported by Kobulnicky et al. (2005). For comparison, we have refit our spectra for sources X1-X6 with the the same as Pooley et al. (2007) and found photon indices within 1.5 of the uncertainties of our fits101010Pooley et al. (2007) do not provide the uncertainties for their fits..
Extended emission clearly fills most of the region within the half-light radius (see Figure 2). After removing all confidently detected point sources with net counts, the remaining net count rate within this radius is counts s-1. However, this emission may not be truly diffuse, but rather composed of faint unresolved point sources. The unresolved background emission can be fit by an absorbed power-law model, with a hydrogen absorption column density cm-2 and photon index , corresponding to an observed luminosity of erg s-1 in the 0.5-8 keV band. If, instead, we freeze the hydrogen absorption column density to N cm-2, the photon index becomes .
The faintest source in Table 2 has an absorbed limiting flux of 4 erg cm-2 s-1 in the 0.5–8 keV energy band. This corresponds to an unabsorbed luminosity limit of 8 erg s-1 at a plausible distance of 3.3 kpc (see Section 4.5), assuming an absorbed power-law model with a photon index and hydrogen absorption column N cm-2. Deeper CXO observations are planned to probe the fainter end of the X-ray source population in GC01.
3.2 Optical and NIR Photometry with HST
To select sources with reliable photometry from the DOLPHOT catalog several quality cuts must be made. The most important quality control parameters for the photometric catalog are the signal-to-noise ratio (SNR), the crowding parameter, the sharpness parameter, and a photometric flag. Only sources with “Photometric Flag” (i.e., this ensures that sources near the image edge or those with saturated pixels are removed) in each filter were kept for the photometry. The “crowd” parameter shows how much brighter (in magnitude) a star would be if other nearby stars were not fit simultaneously, while the “sharp” parameter describes how peaked, compared to the PSF, a source is.
GC01 has both substantial crowding, which affects the photometry and a large and variable reddening (see Section 4.2). WFC3/UVIS has a higher spatial resolution than WFC3/IR (004 versus 013 pixel scales, respectively), making it better at resolving blended sources. However, UVIS is not able to detect as many sources as WFC3/IR due to the large reddening. For this reason we ran DOLPHOT twice, first using the drizzled F127M image and then using the drizzled F814W image for source detection. Once source detection is complete, DOLPHOT extracts the photometry from the raw frames in each WFC3 filter. Our analysis below focuses primarily on the photometry extracted using the WFC3/IR F127M image for source finding. This is due to the fact that a number of WFC3/IR counterparts to X-ray sources do not have a WFC3/UVIS counterpart. Below, we will explicitly state when the WFC3/UVIS F814W image has been used for source finding.
For the NIR photometry, in addition to requiring “Photometric Flag”, we removed all sources with SNR, crowd and sharp0.03 in all WFC3/IR images. We chose all sources within r of the cluster center determined by Kobulnicky et al. (2005). The size of the region was chosen to analyze more sources belonging to the cluster, and, at the same time, to avoid the dark patchy areas appearing to the west of the cluster. Below, this region is referred to as the region of interest (ROI). After the cuts to the NIR photometry, 1,964 sources remained within the ROI.
For the UVIS/NIR photometry using the WFC3/UVIS F814W image for source detection, we used the same ROI and IR cuts listed above. However, to retain more sources the cuts were only applied to the F127M image. We also cut all sources with a UVIS SNR , crowd , and sharp 0.1 leaving 777 UVIS/NIR sources.
3.3 Optical and NIR Counterparts to X-ray Sources
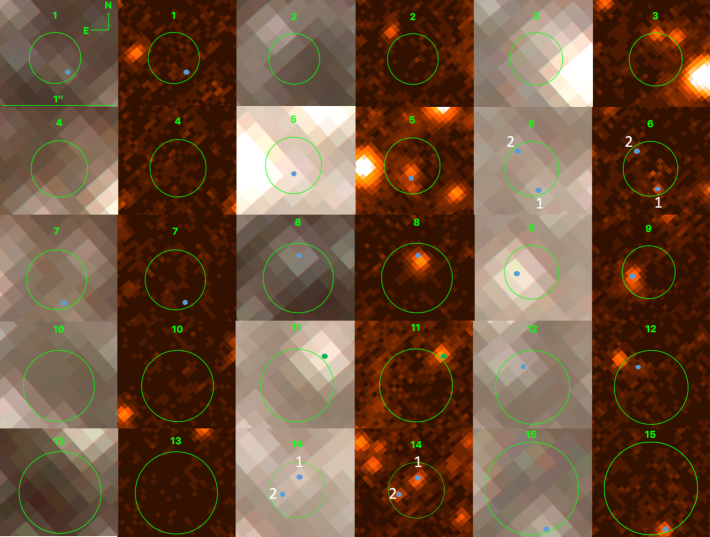
The confidences of the NIR source detections may be significantly impacted by the unaccounted for systematic uncertainties in the background measurements due to the large amount of crowding in this field. Therefore, to ensure that the NIR counterparts to X-ray sources were confidently detected, we required that they have SNR in each of the three WFC3/IR filters. Any source meeting the SNR requirement in all of the F127M, F139M, and F153M images, and located within the 2 error circle of an X-ray source listed in Table 2 is considered to be a potential counterpart to the corresponding X-ray source (see Figure 3 and Table 3). The only exception is made for source X11, because it is highly variable in X-rays and has a SNR30 counterpart just outside of its error circle. Most of the considered X-ray sources are located in the crowded core of GC01, meaning that their NIR counterparts have large crowding values (i.e., ), with the exceptions of X8, X9, and X11. In Table 3, we only provide F814W photometry for the counterparts of NIR sources detected with SNR10 in the F814W image. The lower threshold for the SNR is enabled by the higher resolution and smaller number of sources (i.e., leading to less crowding) in the F814W image.
We find that nine X-ray sources have at least one NIR counterpart, while three of these X-ray sources (X5, X6, X14) have two counterpart candidates within their X-ray error circles (see Figure 3). For these three sources, the potential NIR counterparts are referred to by using a subscript after the X-ray source name (e.g., X61, X62). Since we used the NIR image as the source detection image, the two NIR sources within the X-ray error circle of source X5 were not resolved and were considered a single NIR source (although they are resolved in the F814W image).
| Src | R.A. | Decl. | aaX-ray 2 position error circle radius in arcseconds. | Net Cts | bbObserved 0.5–8 keV flux in units of erg cm-2 s-1. | ccUnabsorbed 0.5–8 keV luminosity in units of erg s-1 at 3.3 kpc. | ddX-ray color defined as . | eeMedian photon energy in the 0.5–8 keV band. | ffBest fit photon index for the absorbed power-law model. | C-stat/d.o.f. | ||
|---|---|---|---|---|---|---|---|---|---|---|---|---|
| X1 | 282.209462 | 1.491307 | 0.23 | 61 | 3.6 | 9.1 | -0.1 | 4.1 | 0.9 | 67.00/58 | 39% | 11% |
| X2 | 282.203688 | 1.499904 | 0.22 | 52 | 1.2 | 340 | 2.1 | 1.8 | 5.6 | 24.44/42 | 40% | 12% |
| X3 | 282.205215 | 1.500029 | 0.23 | 39 | 2.4 | 4.9 | -0.3 | 4.2 | 0.7 | 53.54/39 | 47% | 18% |
| X4 | 282.207574 | 1.491672 | 0.25 | 34 | 2.2 | 3.7 | -0.8 | 4.4 | 0.2 | 34.70/32 | 45% | 13% |
| X5 | 282.208201 | 1.496848 | 0.25 | 31 | 2.0 | 4.4 | -0.3 | 4.2 | 1.2 | 29.97/28 | 65% | 37% |
| X6 | 282.207103 | 1.499042 | 0.24 | 30 | 1.8 | 4.5 | -0.1 | 4.0 | 1.1 | 37.07/25 | 59% | 31% |
| X7 | 282.206333 | 1.494469 | 0.27 | 20 | 1.3 | 2.8 | …ggSources have no counts detected in the soft (0.5-2.0 keV) band. | 4.3 | 1.0hhPhoton index set to 1.0 for sources with 30 counts. | … | 59% | 25% |
| X8 | 282.216777 | 1.494315 | 0.31 | 14 | 0.6 | 1.7 | -0.1 | 3.4 | 1.0hhPhoton index set to 1.0 for sources with 30 counts. | … | 47% | 11% |
| X9 | 282.209069 | 1.498165 | 0.23 | 10 | 0.8 | 3.0 | 0.4 | 2.6 | 1.0hhPhoton index set to 1.0 for sources with 30 counts. | … | 59% | 32% |
| X10 | 282.208920 | 1.500203 | 0.31 | 9 | 0.4 | 0.9 | …ggSources have no counts detected in the soft (0.5-2.0 keV) band. | 3.2 | 1.0hhPhoton index set to 1.0 for sources with 30 counts. | … | 76% | 44% |
| X11 | 282.206564 | 1.496531 | 0.32 | 9 | 0.5iiAverage observed flux and unabsorbed luminosity. During the 200 s flare the source reached a peak flux erg cm-2 s-1 and unabsorbed luminosity erg s-1 in the 0.5–8 keV band, assuming 3.3 kpc (see Section 4.5) | 1.1iiAverage observed flux and unabsorbed luminosity. During the 200 s flare the source reached a peak flux erg cm-2 s-1 and unabsorbed luminosity erg s-1 in the 0.5–8 keV band, assuming 3.3 kpc (see Section 4.5) | -0.3 | 3.8 | 1.0hhPhoton index set to 1.0 for sources with 30 counts. | … | 83% l lfootnotemark: | 51% l lfootnotemark: |
| X12 | 282.206393 | 1.499782 | 0.32 | 8 | 0.4 | 0.9 | …ggSources have no counts detected in the soft (0.5-2.0 keV) band. | 3.4 | 1.0hhPhoton index set to 1.0 for sources with 30 counts. | … | 74% | 38% |
| X13 | 282.199781 | 1.495440 | 0.36 | 7 | 0.4 | 0.8 | …ggSources have no counts detected in the soft (0.5-2.0 keV) band. | 3.8 | 1.0hhPhoton index set to 1.0 for sources with 30 counts. | … | 54% | 12% |
| X14 | 282.208978 | 1.498018 | 0.24 | 7 | 0.8 | 1.7 | …ggSources have no counts detected in the soft (0.5-2.0 keV) band. | 3.1 | 1.0hhPhoton index set to 1.0 for sources with 30 counts. | … | 62% | 35% |
| X15 | 282.213183 | 1.495756 | 0.40 | 6 | 0.4 | 0.8 | …ggSources have no counts detected in the soft (0.5-2.0 keV) band. | 3.8 | 1.0hhPhoton index set to 1.0 for sources with 30 counts. | … | 84% | 42% |
The fact that several X-ray sources have two NIR counterparts is not surprising given the high density of NIR sources in the cluster’s core. We estimate the chance coincidence probabilities of finding one or more NIR sources within the 2 positional error circles of each of the X-ray sources. To accomplish this, we first apply the same cuts to the photometric catalog as for the counterpart matching (i.e., SNR in all WFC3/IR filters). Next, we divide the ROI into seven 6′′-wide concentric annuli because the source density changes as a function of distance from the cluster center. Then, in each annulus, we calculate the source density, , of NIR sources. Finally, we calculate the probability of having one or more NIR sources within randomly placed circles of radii equal to the 2 source positional uncertainties, . We then repeated this exercise using sources that pass both the NIR and UVIS cuts (SNR and SNR, respectively). The chance coincidence probabilities ( and ) for each X-ray source are shown in the last column of Table 2.
Out of the 15 X-ray sources listed in Table 2, 9 are expected to be coincident with NIR sources by chance, while 4 are expected to be coincident with a NIRoptical source by chance. Although the expected number of chance coincident NIR sources is close to the number of X-ray sources with NIR counterparts (9 or 10 if X11 is counted), the number of coincidences between the NIRoptical sources is about two times larger than is expected by random chance. This suggest that at least some of the counterparts are likely to be real111111 Extreme crowding could lead to unaccounted for systematic errors in the Dolphot PSF fitting procedure and some of the faint NIR sources, particularly those in the vicinity of brighter NIR sources, could be spurious leading to an overestimated density of NIR sources and, consequently, an overestimated ..
Deeper X-ray and NIR observations, or spectroscopic observations of the NIR sources coincident with the X-ray sources, can help to establish a physical relationship between the X-ray and NIR/optical sources.
4 Properties of the GLIMPSE-C01 Cluster
In this section we determine the position of the cluster’s center and then use the photometry to produce the color-color diagram, CMDs, and set constraints on GC01’s distance, age, and extinction. All isochrones are adopted from Marigo et al. (2017) and are re-calculated for the three HST WFC3/IR filters and the WFC3/UVIS filter121212See http://stev.oapd.inaf.it/cgi-bin/cmd for details.. Finally, we show that the puzzling ‘looplike structure” reported by Kobulnicky et al. (2005) is comprised of stars unresolved in shallower survey images.
| Source | RA | DEC | aaUVIS magnitude for sources detected with SNR. | bbThe magnitude uncertainties are statistical only and do not include systematic errors due to crowding. | bbThe magnitude uncertainties are statistical only and do not include systematic errors due to crowding. | bbThe magnitude uncertainties are statistical only and do not include systematic errors due to crowding. | bbThe magnitude uncertainties are statistical only and do not include systematic errors due to crowding. | |||
|---|---|---|---|---|---|---|---|---|---|---|
| X1 | 282.209434 | -1.491339 | … | … | 21.184 | 0.032 | 20.383 | 0.022 | 19.556 | 0.016 |
| X5ccThe source is resolved into two individual sources in the higher resolution UVIS image. | 282.208204 | -1.496877 | 24.229 | 0.070 | 17.228 | 0.004 | 16.530 | 0.003 | 15.852 | 0.003 |
| X61 | 282.207082 | -1.499093 | 24.598 | 0.092 | 18.284 | 0.006 | 17.554 | 0.005 | 16.826 | 0.004 |
| X62 | 282.207137 | -1.498999 | … | … | 19.135 | 0.010 | 18.439 | 0.008 | 17.764 | 0.006 |
| X7 | 282.206317 | -1.494525 | … | … | 20.597 | 0.024 | 19.587 | 0.015 | 18.699 | 0.011 |
| X8 | 282.216775 | -1.494257 | 23.998 | 0.059 | 19.242 | 0.010 | 18.649 | 0.008 | 18.035 | 0.006 |
| X9$\dagger$$\dagger$footnotemark: | 282.209104 | -1.498178 | 23.435 | 0.041 | 16.478 | 0.002 | 15.652 | 0.002 | 14.848 | 0.001 |
| X11d,$\dagger$d,$\dagger$footnotemark: | 282.206500 | -1.496457 | 23.314 | 0.039 | 16.486 | 0.002 | 15.646 | 0.002 | 14.832 | 0.001 |
| X12 | 282.206414 | -1.499733 | … | … | 19.477 | 0.013 | 18.792 | 0.011 | 18.141 | 0.009 |
| X141 | 282.208970 | -1.497989 | 24.099 | 0.063 | 18.102 | 0.006 | 17.419 | 0.005 | 16.800 | 0.004 |
| X142 | 282.209016 | -1.498029 | 24.527 | 0.085 | 18.909 | 0.009 | 18.272 | 0.008 | 17.676 | 0.007 |
| X15 | 282.213147 | -1.495857 | 23.809 | 0.052 | 18.078 | 0.005 | 17.387 | 0.004 | 16.687 | 0.003 |
Unlike other sources, this source meets the criteria to be included in the photometric catalog (i.e., SNR4, crowd0.2, and sharp0.03).
Note. — All magnitude are in the VEGAMAG system.
4.1 Cluster Center and Size
We attempted to determine the cluster’s center by fitting ellipses to the isophotal contours (isophotes) of the cluster using the drizzled WRC3/IR F127M filter image. However, the cluster center determination is affected by the dust lanes to the west of the cluster (see Figure 2). Figure 5 shows the contours from the CO High-Resolution Survey (COHRS; Dempsey et al. 2013). We find strong CO emission on distances as close as to the cluster center, prohibiting an accurate determination of the cluster’s center from the HST data. For these reasons we adopt the cluster center provided in Kobulnicky et al. (2005) (i.e., RA(J2000), DEC(J2000)), who relied on Spitzer IRAC images, which are much less affected by reddening.
We did not attempt to calculate the half-light radius of GC01 because the relatively small field of view of the WFC3 detectors prevents an accurate estimation of the background light. The background measurements can have a large impact on the half-light radius estimate. For instance, Kobulnicky et al. (2005) reported a half-light radius of 36′′, while Davies et al. (2011) found a half-light radius of 14′′ and suggested that this difference could come from the estimate of the large amount of background light. In this paper we adopt the half-light radius value of 36′′ reported by Kobulnicky et al. (2005).
4.2 from Color-Color Diagram
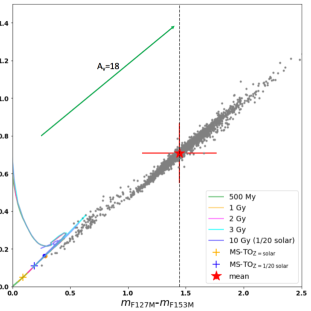
In order to determine the extinction131313We use the extinction parameterization provided in Fitzpatrick (1999). in the direction of GC01 we have plotted the F127M–F153M vs. F139M–F153M color-color diagram (see Figure 6). The red star and the error bar represent the mean and standard deviation of the color-color distribution. The 1 standard deviations are 0.30 for the F127M–F153M and 0.15 for the F139M–F153M colors. To estimate the extinction, we used 500 Myr, 1, 2, and 3 Gyr solar metallicity isochrones, as well as a 10 Gyr low-metallicity (1/20 solar) isochrone with A. The orange cross marks the main-sequence turn-off (MSTO), while the orange point shows where a 2.2 M⊙ sub-giant branch star lies in color-color space for a solar metallicity 1 Gyr isochrone. The blue cross marks the MSTO and the blue point shows where a sub-giant branch 0.9 M⊙ star lies in color-color space for a 10 Gyr low-metallicity (1/20 solar) isochrone. We find that an (shown by the green arrow in Figure 6) provides an adequate representation of the offset between the mean position of the colors of the cluster stars and the sub-giant branch of the isochrones. An corresponds to an A according the relation given by Fitzpatrick (1999). The total range of extinctions across the ROI covering the standard deviation in the color-color distribution corresponds to A–22.
Our analysis indicates a somewhat higher extinction compared to A found by previous studies (Kobulnicky et al. 2005; Ivanov et al. 2005). One possible cause could be the different extinction models used in each study. We use Fitzpatrick (1999), while Kobulnicky et al. (2005) and Ivanov et al. (2005) use Cardelli et al. (1989) and Rieke & Lebofsky (1985), respectively. The latter two models predict larger AJ and AH values (by up to 10%) for a given AV than Fitzpatrick (1999). In addition, the shallower surveys miss the sources with larger extinctions, leading to a bias in the extinction estimate. A CO molecular cloud in front of the cluster (see Figure 5 and Kobulnicky et al. 2005), is likely to be responsible for most of the extinction, including the differential extinction across the cluster. Indeed, the COHRS CO contours and Spitzer MIPS image (see Figure 5) clearly show the non-uniform ISM structure in the direction toward GC01.
4.3 Red Clump Stars
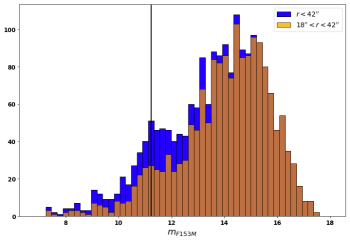
Red clump (RC) stars can be used to obtain an independent estimate of the distance to the cluster. For GC01, a clumping of stars from the red giant branch is seen around the apparent dereddened F153M magnitude of (see Figure 7). In order to determine the distance corresponding to the magnitude at which the RC stellar distribution peaks, we use the dereddened apparent luminosity function of GC01 in the F127M and F153M filters (in Figure 7, for brevity we only show the luminosity function for the F153M filter). These filters were chosen because they are the nearest to the Johnson and bands, where the red clump stars have well established absolute magnitudes (see Girardi 2016 and references therein). Therefore, the conversion from and magnitudes to F127M and F153M magnitudes are the least impacted by the assumptions about the RC stellar spectrum.
To convert between the HST and Johnson filters we approximated the RC stellar spectrum using a PL model () with a spectral index of , consistent with the absolute magnitudes provided in Laney et al. (2012). To ensure there are no broad absorption features in the RC stellar spectra at these wavelengths, we examined the corresponding Castelli & Kurucz stellar atmosphere models (Castelli & Kurucz, 2004). The stellar atmosphere models with solar and low metallicities are well approximated at these wavelengths by the assumed PL model. The absolute141414All stars in the Laney et al. (2012) sample were nearby and showed no signs of extinction effects. and magnitudes of Laney et al. (2012) converted to the F127M and F153M bands are –1.02 and –1.45, respectively151515The magnitudes were converted using the power-law spectral model in pysynphot (Lim et al., 2015)..
In order to measure the distance to GC01, we found the apparent dereddened () magnitude of the RC stellar peak in the F127M and F153M luminosity functions. To ensure that the calculated distances were similar as a function of bin size, two different bin sizes (i.e., 0.1 and 0.2 magnitude per bin) were used. These two bin sizes were chosen to be small enough to capture the RC in the luminosity function, but large enough to have reasonably small statistical fluctuations per bin (see Figure 7). The apparent dereddened magnitudes corresponding to the RC are 11.63–11.50 for the F127M filter, and 11.23–11.11, for the F153 filter. This corresponds to distances of 3.2–3.4 kpc. Reddening affects the distance derived from the RC position in the luminosity function. We repeated the above steps for and and found mean distances of 3.7 and 3.0 kpc, respectively.
We also compared the luminosity functions of GC01 including () and excluding () the cluster core and found an excess of RC sources in the core, suggesting possible mass segregation in GC01. However, the large extinction and crowding can lead to biases. Future observations with JWST can establish this much more confidently.
4.4 Color-Magnitude Diagrams
In order to evaluate the contamination of the GC01 CMD by field stars we have defined a control field. Typically, this is done by imaging a flank field (see e.g., Andersen et al. 2017), however, such an observation does not exist for GC01. Therefore, we chose a region, as far as possible from the cluster center, in the western part of the WFC3 images where the fraction of the cluster’s stars appears to be minimal (orange rectangle in Figure 8). Additional complications arise due to the presence of the dark dust lanes within the western half of the control field region. This dust appears to be in front of the cluster, and therefore, the contamination of the cluster’s CMD by the faint background stars can be underestimated. The stars from this control field appear to be either substantially “bluer” (foreground stars) or substantially “redder” (background stars, and possibly some of the cluster stars affected by larger extinction) than the stars from the cluster region (see Figure 8).
We have also evaluated the contamination by choosing two small slices to the north-east and south-west edges of the cluster as a control field (blue rectangles in Figure 8). In this case, we find substantially more control field stars overlapping with the cluster star region in the CMD plot. However, Davidge et al. (2016) have found that light from GC01 can be detected out to 100′′ from the cluster center, suggesting that a large fraction of these “contaminating stars” are likely to be cluster stars (also see below). Therefore, either of the two choices of the control field introduces its own bias. However, in either case, the contamination of the cluster CMD at magnitudes brighter than =18 is minimal. The crowding of sources in the dense cluster explains why the photometric catalog goes 2-3 magnitudes deeper in the less crowded control fields. The cluster stars lie primarily in the color space spanning -.
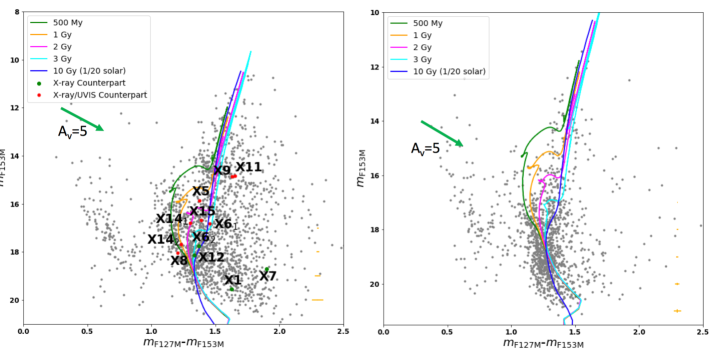
The left panel of Figure 9 shows the vs. - apparent CMD together with 500 Myr, 1, 2, and 3 Gyr isochrones computed for solar metallicity and the 10 Gyr isochrone computed for 1/20 solar metallicity. The isochrones are reddened with an (see Section 4.2) and placed at kpc (see Section 4.3). The grey points are all WFC3/IR sources that pass the photometric cuts described in Section 3.2 and lie within the ROI. The representative photometric errors are shown as vertical and horizontal error bars near the right boundary of each CMD for different magnitudes. Unfortunately, any rigorous fitting of the isochrones will be dominated by systematic uncertainties due to the large differential extinction, photometric crowding, and uncertain contamination from field stars. Therefore, it is difficult to set a constraining age limit on the cluster using the stars from the ROI (see Section 3.2).
In an attempt to obtain a more accurate age constraint, we have carefully chosen a second cluster region (dashed green box in Figure 5) offset from GC01’s center which reduces the effects of crowding and differential reddening. The latter is accomplished by placing the region within the area of relatively uniform 12CO (J) emission. We perform the same cuts on the photometric catalog as listed above (see Section 3.2), leaving 1,354 NIR sources. We then followed the procedures described in Sections 4.2 and 4.3 to estimate the and distance in this new region (i.e., using the color-color diagram and RC stars), and find and kpc, respectively.
The right panel of Figure 9 shows the vs. - apparent CMD for WFC3/IR sources that lie within this alternative cluster region. The plotted isochrones are the same as in the left panel of Figure 9 but are reddened with an and placed at kpc. The representative photometric errors are shown as vertical and horizontal error bars near the right boundary of each CMD for different magnitudes. For solar metallicity, isochrones with ages Gyrs better match the CMD. Ages Gyr are disfavored because these isochrones do not accurately capture the redder points between , and there are a lack of sources extending up to the MSTOs at these ages. However, the 10 Gyr low-metallicity (1/20 solar metallicity) isochrone is also consistent with the data. Therefore, we cannot differentiate between an old ( Gyr) low-metallicity globular cluster, and a younger ( Gyr) solar-metallicity cluster with the current data.
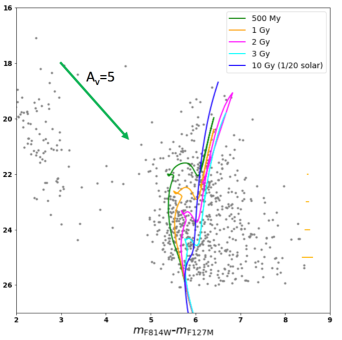
We have also constructed an optical-NIR CMD, for stars in the cluster ROI, using the drizzled WFC3/UVIS image for source finding (see Figure 10). This approach reduces the number of confused (blended) NIR sources at the expense of having significantly less sources in the CMD. This CMD is in some sense the cleanest photometry we can produce (although it still suffers from contamination by field stars), because of the higher spatial resolution and stricter cuts (the sources included in this CMD must pass both the NIR and UVIS cuts described in the last paragraph of Section 3.2). Most of the counterparts to the X-ray sources do not pass the strict photometric cuts and hence do not appear in this CMD. The stretched appearance of the RC in this CMD emphasizes the effect of the differential reddening. Although we show the same isochrones in Figure 10 as we did in Figure 9, we cannot better constrain the age of GC01 from this CMD.
White dwarf (WD) cooling curves could in principle be used to get an independent age estimate of the cluster (see e.g., Richer et al. 1998). To estimate the observed magnitude of WDs in GC01 we used the WD sample provided in Holberg & Bergeron (2006), observed in 2MASS’s , , and bands. The and bands overlap with the WFC3/IR bands used in our observation (see Figure 1). We took the hottest source in the above-mentioned WD sample (T K, d pc, J, H) and placed it at the distance of kpc with A and A (Cardelli et al., 1989). Converting from J and H bands to the F127M and F153M filters, this gives expected apparent magnitudes of and , respectively161616The conversion was done using a flat spectral model (i.e., ( with ).). Therefore, we do not expect to see any WDs belonging to the cluster in the IR/UVIS images, as the observations do not go deep enough.
4.5 Discussion of Distance and Age
The distance estimates using RC stars in the cluster’s center implies a distance of 3.0–3.7 kpc depending on the absorption (). This distance estimate is slightly more constrained for the photometry from the region outside of the cluster’s core where the reddening is more uniform, giving kpc for , respectively. This estimate is at the lower end of previous distance estimates of 3.1–5.2 kpc obtained from the 13CO feature emission and extinction map (Kobulnicky et al., 2005), but is consistent with the 3.8 kpc distance obtained using RC stars (Ivanov et al., 2005). However, these smaller distances still leave open the possibility that the cluster is embedded in the 13CO cloud at 3.1 kpc.
One of the most controversial properties of GC01 is its age. The isochrone matching to the cluster CMD suggests an age of Gyr, assuming a solar metallicity, , and distance of 3.3 kpc. However, the 10 Gyr low metallicity isochrones are also consistent with the data. If GC01 does have a low-metallicity, it would then be more likely to be a a GC passing through the disk of the Galaxy, because low-metallicity GCs are typically found in the Galactic halo and not the Galactic disk (see e.g., Leaman et al. 2013). We find that ages Gyr are inconsistent with the observed NIR CMD. The WFC3/UVIS CMD also disfavors ages Gyr.
Recently, Davidge et al. (2016) have fitted SPITZER IRAC CMDs and found the age to be between 1 and 2.5 Gyr, compatible with our estimate for solar metallicity. Thus, it is possible that GC01 is a 2 Gyr old massive cluster born in the Galactic disk with an age similar to those of the Galactic clusters IC 4651, NGC 752, and M67 (Meibom et al. 2002; Bell 1972; Mooley & Singh 2015) but with a much larger mass. Due to its large mass, it could be an aged YMC, such as Westerlund 1, RSGC 03, or Arches (Portegies Zwart et al., 2010). However, with the data at hand, we cannot rule out that GC01 is an old ( 10 Gyr) low-metallicity globular cluster plunging into the disc (c.f., NGC 6544; Contreras Ramos et al. 2017). Future spectroscopic observations to determine the metallicity of GC01 would allow us to differentiate between these two scenarios. Further, the higher angular resolution and larger field of view of JWST/NIRCam can also help to better constrain the properties of the CMD of GC01.
4.6 Loop-like Structure
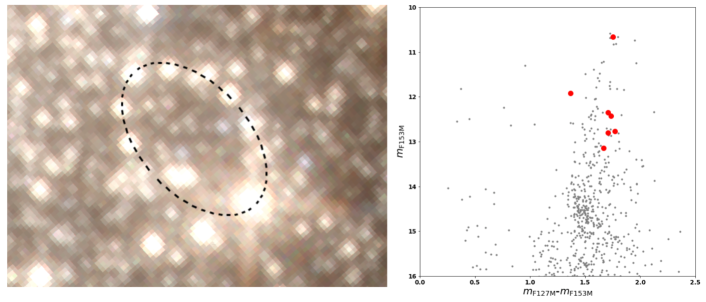
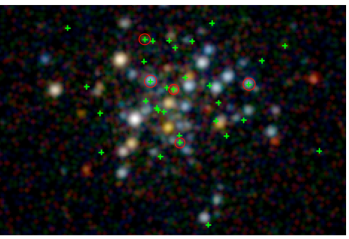
Kobulnicky et al. (2005) reported a loop-like structure seen in the Spitzer IRAC images of GC01 from the GLIMPSE survey. They rule out both dust shells ejected by stars and a supernova remnant due to the size of the feature and lack of radio emission, respectively. They suggest that the structure could either be an old nova shell or planetary nebula (Kobulnicky et al., 2005). However, in the WFC3 images the structure is resolved into several stars of a similar brightness arranged in a peculiar loop-like pattern (see Figure 11), which can be described as an ellipse with a semi-major axis and semi-minor axis , corresponding to physical sizes of 0.04 pc and 0.03 pc, respectively (at a distance of 3.3 kpc). If the structure is a ring seen in projection onto the sky, the inclination angle would be north through east.
Only seven out of stars in the loop-like structure have photometry that satisfies the quality criteria of the photometric catalog. These seven stars are plotted as red points on top of our CMD. They all lie towards the top of the CMD (see Figure 11) and all but one have a - color of 1.7. Given the advanced age of the cluster it is difficult to imagine that the ring-like arrangement of the stars could be maintained since its formation. Most likely the structure is just an accidental arrangement in the projection onto the plane of the sky. Accurate 3D velocity measurements for these stars would provide further information. In addition to spectroscopic radial velocity measurements, future JWST observations would allow one to measure tangential velocity components of the stars if the cluster is as close as 3.3 kpc.
5 X-ray Sources
Here we discuss the most interesting sources individually, based on their X-ray properties, while the remaining X-ray sources are discussed in bulk. We compare them to the X-ray source populations found in both old open and globular clusters. Ten of the 15 X-ray sources labelled in the left panel of Figure 2 have at least one NIR source located within their X-ray positional error circles, while seven have at least one optical/NIR source positionally coincident171717Including the exception of source X11, which has an optical/NIR source just outside of its X-ray positional uncertainty. As mentioned above in Section 3.3, we expect 9 or 4 X-ray sources to have NIR or NIR/optical counterparts due to chance coincidences, respectively. We do not insist that any one particular NIR/optical source is the true counterpart to an X-ray source. Below we rely primarily on the X-ray source properties to understand the nature of the X-ray sources. However, we do speculate on how the NIR sources coincident with the X-ray sources could be interpreted with respect to the X-ray source classification.
The unabsorbed 0.5–8 keV luminosities of the 15 X-ray sources span a range of erg s-1, with a majority having 1–5 erg s-1 (at kpc). These luminosities are higher than those of flaring MS stars181818GC01 is too old to have any pre-main sequence stars or star-forming activity. found in old clusters (see e.g, Giardino et al. 2008), implying that the detected sources can be a combination of ABs, MSPs (isolated or black-widow/redback type), CVs, and quiescent LMXBs, with the possible addition of more exotic source types, such as aged magnetars or an intermediate mass black hole (IMBH) accreting from the ISM (see Section 5.8).
Given that the age of GC01 is Gyr, it could be that this cluster is an intermediate age cluster born in the disc. There are several open clusters with somewhat larger ages that have been observed with CXO. M67 is an open cluster with an age of 4 Gyr at a distance of 850 pc (Sarajedini et al., 1999). This cluster has been observed by both CXO and XMM-Newton and hosts a number of ABs of different types, as well as a CV (van den Berg et al. 2004; Mooley & Singh 2015). NGC 6791 is an older open cluster (8 Gyr) that lies at a comparable distance of 4 kpc and has a mass of 5000-7000 M⊙ (Platais et al. 2011; van den Berg et al. 2013), which is an order of magnitude smaller than the mass of GC01 ( M; Davies et al. 2011). NGC 6791 was observed with CXO and a number of X-ray sources, including ABs, CVs and sub-subgiant (SSG) binaries were detected with unabsorbed 0.3–7 keV luminosities ranging between erg s-1 (van den Berg et al., 2013).
Alternatively, if GC01 is a low-metallicity Gyr old cluster, then it could be a GC passing through the Galactic disk (c.f., NGC 6544; Contreras Ramos et al. 2017). Many GCs have been observed with CXO, such as 47 Tucanae (Bhattacharya et al., 2017), Centauri (Haggard et al., 2009), Terzan 5 (Heinke et al., 2003) and M80 (Heinke et al., 2003). In comparison to old open clusters, GCs host more MSPs (see e.g., Bhattacharya et al. 2017) and qLMXBs (Heinke et al. 2003, Gosnell et al. 2012), while having fewer bright (i.e., erg s-1) CVs, ABs, and SSGs per unit mass (van den Berg et al., 2013).
In ABs, the X-rays come from interacting magnetically active stars. The magnetic activity of these stars is enhanced due to a large rotation (i.e., periods on the order of 0.1-10 days van den Berg et al. 2004) maintained by tidal interactions with the companion star (Vats & van den Berg, 2017). These sources typically account for a large fraction of the X-ray source population in old open clusters and often dominate their X-ray luminosity (see e.g., Vats & van den Berg 2017, van den Berg et al. 2004). The population of ABs in old open clusters have typical X-ray luminosities between 10 a few erg cm-2 s-1 (Mooley & Singh, 2015; Pooley & Hut, 2006) and soft spectra with median photon energies keV (Vats & van den Berg, 2017). GCs also contain ABs (typically with erg s-1), however, they have fewer per unit mass than open clusters (van den Berg et al., 2013). This is because the AB population likely scales with the primordial binary fraction, which is reduced in GCs (see Heinke 2010 and references therein). GC01 may harbor many ABs, however, most of them will be too faint to be detected at our limiting luminosity.
Very little is known about the population of MSPs in massive open clusters. All known YMCs are too young to host MSPs spun-up by accretion. On the other hand, most known old open clusters are too scattered and probably do not have enough gravitational pull to retain isolated or even binary MSPs that acquire kicks from a supernova (SN) explosion (Gonzalez et al., 2011).
If GC01 is a GC then it could host MSPs, as GCs are known to be rich with them (e.g., Bogdanov et al. 2006; Prager et al. 2017). Typically, MSPs exhibit a thermal (0.1–0.2 keV) X-ray spectrum, but several also have a hard power-law component () and may show orbital variability on times-scales of a few to tens of hours (see e.g., Bogdanov et al. 2006, 2011a; Linares 2014). However, due to the large absorption towards GC01, we would not detect the lower luminosity ( erg s-1) thermal MSPs in the existing data.
Quiescent LMXBs are another type of relatively faint X-ray sources expected in evolved stellar environments. Heinke et al. (2003) studied qLMXB candidates detected in nine different GCs and found an empirical lower limit of 1032 erg s-1 on their X-ray luminosity. In X-rays, qLMXBs with NSs appear as fairly soft sources, due to the thermal emission from the NS (e.g., Table 2 in Heinke et al. 2003 and Figure 1 in Sonbas et al. 2018). There have also been a number of BH qLMXB candidates with erg s-1 recently discovered in GCs (see e.g., Chomiuk et al. 2013; Miller-Jones et al. 2015; Bahramian et al. 2017) based on their X-ray to radio luminosity ratios. While in quiescence, BH LMXBs often exhibit hard spectra () making them similar to CVs, but a CV nature can be ruled out if a radio counterpart is detected (Bahramian et al., 2017). At fainter luminosities, (Armas Padilla et al., 2014) reported a confirmed BH qLMXB with erg cm-2 s-1 and a PL photon index . Therefore, qLMXBs with BHs may be detectable in the existing CXO observation of GC01, but are difficult to identify without deep X-ray and radio observations.
To better understand the nature of GC01’s X-ray sources, we carried out spectral fitting and evaluated the X-ray properties of the brightest sources. Below we discuss the most interesting sources and the different classes they could belong to. Unfortunately, the HST and X-ray observations of GC01 are too short to search for periodicity associated with binary motion and the X-ray sources have too few counts to search for a spin period, or in many cases, fit the spectra. The orbital period of the system, along with the X-ray luminosity and spectral slope, can help to determine the nature of the source (see e.g., van den Berg et al. 2004) and deeper X-ray, NIR, and radio observations of GC01 should be undertaken.
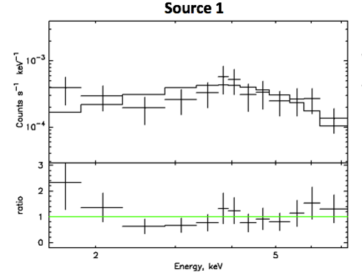
5.1 Source X1
This source has 61 net counts and an observed X-ray flux of erg s-1 cm-2. The spectrum is hard and can be described by an absorbed PL with at a fixed cm-2. The unabsorbed luminosity of X1 is erg s-1 at kpc. The X-ray luminosity and spectral hardness of X1 are consistent with a CV or qLMXB nature of the source. The best-fit is smaller than typical MSP or qLMXB values, but the uncertainties are large. However, for an MSP scenario, the non-thermal luminosity is too large. X1 has an X-ray color, , and luminosity, erg s-1, which are representative of CVs according to Figure 1 of Pooley & Hut (2006), with ABs being less probable because they typically have lower luminosities and softer X-ray spectra.
X1 has only one NIR source within the 2 X-ray position error circle with no UVIS counterpart (see Fig. 3). If the NIR source is the true counterpart to the X-ray source, the X-ray to NIR flux ratio, , is consistent with a CV interpretation (see Figure 13). Unfortunately, X1 has a high crowding value and could be a mix of two or more faint sources, which would decrease the X-ray to NIR flux ratio.
5.2 Source X2
Source X2 is the brightest source detected in GC01 with an observed flux of erg s-1 cm-2 in the 0.5-8 keV band. It was classified as a qLMXB by Pooley et al. (2007). Most of the flux is in the soft band, as evidenced by both its large photon index and X-ray color . The unabsorbed X-ray luminosity is erg s-1 at a distance of 3.3 kpc and cm-2. In GCs, where qLMXBs are most commonly found Heinke et al. (2003), sources with luminosities erg s-1 and soft X-ray spectra are typically qLMXBs (Heinke et al., 2006). For comparison to other qLMXBs, we fit source X2’s X-ray spectrum with a hydrogen-atmosphere neutron star model (with fixed N cm-2, M, km, and kpc). The best-fit temperature is keV with an unabsorbed X-ray luminosity erg s-1. The source’s X-ray color, calculated using the neutron star atmosphere model, is , which is consistent with other known qLMXBs (see Figure 1 in Pooley & Hut 2006).
In open clusters, qLMXBs are quite rare, but one has been found in NGC 6819. This cluster has an age Gyr (Gosnell et al., 2012), mass M⊙, and half-light radius 33 (Kalirai et al., 2001), corresponding to a diameter of 4.4 pc at its distance of 2.3 kpc (Basu et al., 2011). Comparatively, GC01 is more dense than NGC 6819, having a diameter pc (at a 3.3 kpc distance, see Section 4.3) and mass M⊙ (Davies et al., 2011). Therefore, it is plausible that GC01 could host a dynamically formed qLMXB regardless of whether it is a globular or open cluster.
X2 has no NIR/optical counterpart within its X-ray positional error uncertainty. It is common for qLMXBs in globular clusters to have very faint optical counterparts (see Heinke et al. 2003). Deep IR observations with JWST can help to reveal the NS’s companion and place constraints on its mass.
5.3 Sources X5
This source has an X-ray color , unabsorbed X-ray luminosity is erg s-1 at a distance of 3.3 kpc, suggesting a CV nature of the source (however, see Section 5.8). Source X5 appears to be coincident with a single NIR source, which is resolved by UVIS into two sources, one of which falls close to the center of X-ray error circle (see Figure 3). Additionally, the NIR magnitude of the unresolved source has a large crowding value, suggesting that the photometry is not accurately recovered. Deeper images with a higher angular resolution detector, such as JWST’s NIRcam, are necessary to accurately recover the NIR properties of these potential counterparts.
5.4 Source X8
Source X8 has an unabsorbed X-ray luminosity erg s-1, and X-ray color , suggesting a CV or AB nature. This source is also one of the furthest from the cluster center. The coincident NIR (=19.2) and optical source (=24.0) of X8 is blue (4.8) compared to the main locus of cluster stars in the CMD. This suggests that the NIR/optical source may be unrelated to the X-ray source. However, if the optical/NIR sources is the true counterpart, then given its blue color, and distance from the cluster center, X8 could be a foreground star with the X-rays being produced in the stellar corona.
5.5 Source X9
Source X9’s soft X-ray color (0.4) and luminosity ( erg cm-2 s1), suggests that it could be an AB. Additionally, this source is coincident with a NIR source, which is bright (=16.5) with well measured photometry. We note that this NIR source lies on the redder side of the red giant branch, where there is very little contamination from field stars. The large differential reddening can “extend” the red giant branch to this region of the CMD. Alternatively, this region of the CMD can also be populated with SSG or red straggler (RS) type ABs. SSGs and RSs lie on the redder side of the horizontal branch with SSGs being brighter and RSs being fainter than sub-giant branch stars (Geller et al., 2017). Typically, SSG and RS type ABs have X-ray luminosities of erg s-1 due to coronal magnetic activity (Geller et al., 2017), consistent with source X9’s X-ray properties. These types of sources have been found in both open and globular clusters (Geller et al., 2017).
5.6 Source X11
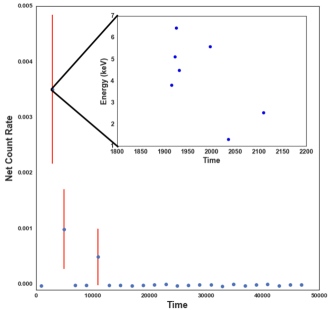
X11, reported as variable by Pooley et al. (2007), was only detected with ACIS during a 200-s flare and subsequent decay over the next 8 ks (see Figure 12). At its peak, the flare reached a luminosity of erg s-1 at a distance of 3.3 kpc. This suggests that X11 could be either an AB or CV, as both have exhibited X-ray flares reaching these luminosities (see e.g., sources W47 and W51 in 47 Tuc Heinke et al. 2005). The fact that the source shows no persistent X-ray emission down to luminosities erg cm-2 s-1, suggests that it is more likely to be an AB type system but several X-ray faint () CVs have recently been identified in 47 Tuc (Rivera Sandoval et al., 2018).
There is no NIR/optical counterpart within the 2 X-ray positional error circle, however, there is a NIR source right on the very edge of the error circle (See Figure 3). This source is bright (=16.5), has reliable photometry, and lies very close to X9’s potential counterpart in the NIR CMD (see Figure 9, left panel). Therefore, this source could be similar to X9 in its nature (SSG/RS type AB), assuming both NIR counterparts are real. However, SSG/RS are not known to show flares with such high luminosities. On the other hand, if the NIR source is not a true counterpart to X11, then the X-ray source could still be an LMXB, AB, or CV with episodic accretion and a faint non-detected companion.
5.7 Remaining Sources
The remaining eight X-ray sources have unabsorbed luminosities of erg s-1 at a distance of 3.3 kpc and X-ray colors between -0.8 and 0.4. Sources with in this luminosity range tend to be CVs, while those with can be a mix of ABs and binary MSPs (Pooley & Hut, 2006).
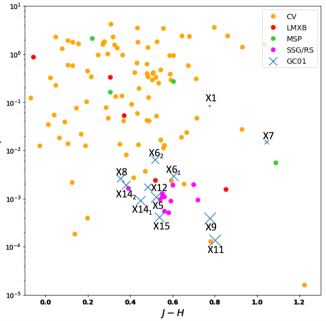
In an attempt to classify these sources we have plotted the distance independent dereddened color versus the X-ray (0.5-7 keV) to band flux191919Both fluxes were corrected for absorption. ratio for the GC01 X-ray sources and candidate NIR counterparts (see Figure 13). We also plotted a number of CVs and LMXBs from the Cataclysmic Variables catalog (Downes et al., 2001) and Low-Mass X-ray binary catalog (Liu et al., 2007), respectively, that have been detected by XMM-Newton (Jansen et al., 2001) and have counterparts in 2MASS (see the Appendix of Hare et al. 2016 for more details). The X-ray fluxes and the and band photometry were retrieved from the 3XMM-DR6 catalog (Rosen et al., 2016) and 2MASS catalog of point sources (Cutri et al., 2003), respectively. Additionally, a sample of one globular and 10 open cluster SSG/RS type stars, which are detected at NIR ( and bands) and X-ray wavelengths, was taken from Table 4 in Geller et al. (2017). We have also used four binary MSPs202020We could not use the large sample of MSPs detected in GCs because they do not appear in 2MASS and do not have NIR magnitudes., that have been detected by 2MASS and in X-rays. We converted the X-ray fluxes of the MSPs into the 0.5-7 keV energy range using the spectral models in the respective papers of each source (Bogdanov et al. 2011b; Zavlin 2006; Bogdanov et al. 2014; Zavlin et al. 2002). The F127M and F153M magnitudes of GC01’s NIR sources were converted to the and bands, respectively. The GC01 sources primarily fall near CVs and SSG/RS type ABs in this plot.
There are large variations in the fraction of MSPs detected in X-rays among GCs. For instance, 47 Tuc hosts 25 radio MSPs, of which 22 () are detected in X-rays (see combined 540 ks CXO ACIS image in Bhattacharya et al. 2017). On the other hand, for Terzan 5 (combined 530 ks CXO ACIS exposure, see Figure 14) there are 36 known radio pulsars (Prager et al., 2017) of which only about 5 (or 14%) appear to be detected in X-rays (see Figure 14). The most likely reason for such a drastic difference is the much larger absorption ( cm-2 and ) towards Terzan 5, which is strongly affecting the detectability of the MSPs, most of which have thermally dominated spectra (see e.g., Bogdanov et al. 2006). Given that GC01 is even more obscured (by a factor of 4) than Terzan 5, it is not surprising that in the existing short CXO exposure we would see few or even no MSPs. Additionally, no MSPs have been detected at radio wavelengths in GC01 so far (S. Ransom, private comm.). Better quality X-ray and radio data for GC01 will allow us to directly compare the population properties of X-ray sources in Terzan 5 and GC01.
5.8 Intermediate mass BH limits
There have been theoretical predictions that intermediate-mass BHs (IMBH) could exist in the centers of GCs (see van der Marel 2004 for a review). Regardless of whether GC01 is an old open or globular cluster, it still has a very large core density and hence, may host an IMBH. If massive main sequence stars in GC01 undergo fast mass segregation, they can develop a Spitzer instability and N-body simulations show that this can lead to a core collapse time of the initial half-mass relaxation time (Gürkan et al., 2004). If the massive stars’ lifetimes are shorter than the core collapse time, the stars can collide and/or merge leading to a runaway collision process and, possibly, the formation of an IMBH (Portegies Zwart & McMillan, 2002; Freitag et al., 2006). Portegies Zwart & McMillan (2002) find that clusters with present day half-mass relaxation times yrs and ages exceeding 25 Myr could contain an IMBH. N-body simulations predict that such an IMBH can have a mass of of the birth mass of the cluster (Portegies Zwart & McMillan, 2002; Gürkan et al., 2004). Davies et al. (2011) estimate that the relaxation time of GC01 is yrs. Further, the current mass of GC01 could be as large as M⊙, implying a birth mass up to an order of magnitude larger than its current mass (Davies et al., 2011). This suggests that a central IMBH could be as massive as M⊙.
If there is an IMBH in GC01 it should accrete from the ISM in the cluster and may produce detectable emission. Emission from isolated stellar mass and IMBHs accreting at very low rates is poorly understood. X-ray observations of BH qLMXBs accreting at low rates show X-ray spectra which can be described as a PL with photon indices (Armas Padilla et al., 2014; Plotkin et al., 2016). Starved supermassive BHs (such as Srg A∗) seem to radiate most of their energy at sub-mm wavelengths (via synchrotron emission) with a possible second less energetic peak in X-rays due to inverse Compton (see Ponti et al. 2017 and references therein).
Since the putative IMBH would be in the cluster center, we consider X-ray sources X9 and X14, (lying 1-2′′ away) as potential IMBH candidates. Source X9 is a likely SSG/RS type system, while source X14 has two potential NIR counterparts with photometry affected by the crowding. Source X5 is also only away from the cluster center, but this source has a rather hard spectrum, making it a less likely IMBH candidate assuming the IMBH X-ray spectra are similar to those of low- qLMXBs. All three sources have –. Comparatively, Sgr A∗ and the quiescent BH binary Swift J1357.2-0933 have X-ray to NIR flux ratios and , respectively. Their X-ray luminosities are a tiny fraction of the Eddington luminosity, (Mossoux et al., 2016; Plotkin et al., 2016). An 800 M⊙ quiescent BH in GC01 with an X-ray luminosity of 10 erg cm-2 s-1 would have an absorbed X-ray flux erg cm-2 s-1 (for , N cm-2), which would be detectable in the CXO observation. Of course, the regimes of accretion in these two low-efficiency systems can still be quite different from that of a putative IMBH in GC01. Deeper X-ray and NIR/IR observations (including NIR spectroscopy) are needed to probe the nature of X14, X9, and X5 to see if one of them could be an IMBH candidate in GC01.
6 Outlook
There are two major obstacles to performing a more informative study of GC01. The first is the strong crowding in the cluster’s core. This can be overcome with JWST’s superior angular resolution, which will produce images with a quality comparable to that of the WFC3/UVIS F814W images. JWST will resolve sources that are too close together (such as the NIR counterpart to X5), provide accurate photometry, and be less affected by the large reddening. The second obstacle is the size of the X-ray error circles and faintness of the X-ray sources. Deeper X-ray observations will allow us to detect more X-ray sources that can be cross-matched directly to HST and JWST sources and can then be used to improve the relative astrometry. This will reduce both the statistical and systematic X-ray positional uncertainties allowing for more credible counterpart matching. Additionally, deeper X-ray observations would also better characterize the source spectra and allow for variability studies. These goals will be achieved in the forthcoming deep CXO observation of GC01. It is important to understand the nature of the NIR and X-ray sources in GC01, as it may be only one of a few massive intermediate age clusters observable in the Galaxy and can provide hints to both its formation and evolution. Finally, it is critical to perform sensitive low-frequency radio observations to look for MSPs that are expected to be numerous if GC01 is an old GC.
7 Summary
Using both HST and CXO we were able to probe the parameters of GC01 and its X-ray source population. In the cluster center, we have detected 1,964 sources in the WFC3/IR F127M, F139M, and F153M images and 777 sources in the WFC3/UVIS F814W image. A color-color diagram suggests a variable extinction . We have also selected a region with less differential reddening () and crowding just outside of the cluster’s core, and have analyzed 1,354 NIR sources in this region. The peak of the red clump star distribution in this alternative cluster region was used to estimate the distance to the cluster, giving 3.5–3.3 kpc for , respectively. The CMDs and stellar isochrones corrected for this extinction and placed at a distance of 3.3 kpc imply an age of Gyrs up to 10 Gyrs for a lower metallicity. Therefore, the HST photometry by itself does not confidently discriminate between an intermediate age massive galactic cluster or an old globular cluster plunging into the disk. The lack of any radio MSPs could suggest that GC01 is not an old GC (such as Terzan 5 or 47 Tuc), although there remains a possibility that their detections are hampered by the large absorption towards GC01.
We have analyzed the 15 brightest X-ray sources located within the central part of GC01. Nine of the X-ray sources have at least one coincident NIR source seen by HST and three have multiple coincident NIR sources. Additionally, seven of the X-ray sources are coincident with at least one optical/NIR source. This suggests that several of the optical/NIR sources are true counterparts of the X-ray sources. However, we cannot confidently determine which sources in particular are true counterparts to the X-ray sources. Source X1 is a likely CV candidate given its X-ray colors and luminosity. One of the sources (X2) is a likely a qLMXB as it has a soft X-ray spectrum () and relatively large unabsorbed X-ray luminosity ( erg s-1). X9 is likely an AB type system with a potential NIR counterpart that has well measured photometry that suggests it is a red giant.
X11 showed an X-ray flare that lasted about 200 s and reached a peak X-ray luminosity of erg s-1 and then decayed back to below the detection limit over 8 ks. This source is likely to be either an AB type system or CV. X11 does not have a NIR/optical counterpart inside of its X-ray positional error circle. However, there is one NIR/optical counterpart, with well measured photometry that lies in the red giant region of the CMD, just on the edge of the X-ray positional error circle and may still be associated with X11.
Acknowledgements: Support for Program number HST-GO-14183.003-A was provided by NASA through a grant from the Space Telescope Science Institute, which is operated by the Association of Universities for Research in Astronomy, Incorporated, under NASA contract NAS5-26555. We are very grateful to Leisa Townsley and Patrick Broos for their help with running ACIS Extract, as well as for insightful discussions on X-ray image analysis. We would like to thank the anonymous referee for their helpful and constructive comments, which improved the paper.
References
- (1)
- Anders & Grevesse (1989) Anders, E., & Grevesse, N. 1989, Geochim. Cosmochim. Acta, 53, 197
- Andersen et al. (2017) Andersen, M., Gennaro, M., Brandner, W., et al. 2017, A&A, 602, A22
- Armas Padilla et al. (2014) Armas Padilla, M., Wijnands, R., Degenaar, N., et al. 2014, MNRAS, 444, 902
- Arnaud (1996) Arnaud, K. A. 1996, Astronomical Data Analysis Software and Systems V, 101, 17
- Basu et al. (2011) Basu, S., Grundahl, F., Stello, D., et al. 2011, ApJ, 729, L10
- Bell (1972) Bell, R. A. 1972, MNRAS, 157, 147
- Bahramian et al. (2017) Bahramian, A., Heinke, C. O., Tudor, V., et al. 2017, MNRAS, 467, 2199
- Bhattacharya et al. (2017) Bhattacharya, S., Heinke, C. O., Chugunov, A. I., et al. 2017, MNRAS, 472, 3706
- Bogdanov et al. (2006) Bogdanov, S., Grindlay, J. E., Heinke, C. O., et al. 2006, ApJ, 646, 1104
- Bogdanov et al. (2011b) Bogdanov, S., Archibald, A. M., Hessels, J. W. T., et al. 2011b, ApJ, 742, 97
- Bogdanov et al. (2011a) Bogdanov, S., van den Berg, M., Servillat, M., et al. 2011a, ApJ, 730, 81
- Bogdanov et al. (2014) Bogdanov, S., Patruno, A., Archibald, A. M., et al. 2014, ApJ, 789, 40
- Broos et al. (2010) Broos, P. S., Townsley, L. K., Feigelson, E. D., et al. 2010, ApJ, 714, 1582
- Broos et al. (2012) Broos, P., Townsley, L., Getman, K., & Bauer, F. 2012, Astrophysics Source Code Library, ascl:1203.001
- Cardelli et al. (1989) Cardelli, J. A., Clayton, G. C., & Mathis, J. S. 1989, ApJ, 345, 245
- Castelli & Kurucz (2004) Castelli, F., & Kurucz, R. L. 2004, arXiv:astro-ph/0405087
- Chomiuk et al. (2013) Chomiuk, L., Strader, J., Maccarone, T. J., et al. 2013, ApJ, 777, 69
- Cohen et al. (2014) Cohen, R. E., Mauro, F., Geisler, D., et al. 2014, AJ, 148, 18
- Contreras Ramos et al. (2017) Contreras Ramos, R., Zoccali, M., Rojas, F., et al. 2017, A&A, 608, A140
- Cutri et al. (2003) Cutri, R. M., Skrutskie, M. F., van Dyk, S., et al. 2003, “The IRSA 2MASS All-Sky Point Source Catalog, NASA/IPAC Infrared Science Archive. http://irsa.ipac.caltech.edu/applications/Gator/
- Cutri et al. (2012) Cutri, R. M., Wright, E. L., Conrow, T., et al. 2012, Explanatory Supplement to the WISE All-Sky Data Release Products
- Davidge et al. (2016) Davidge, T. J., Andersen, D. R., Lardière, O., et al. 2016, AJ, 152, 173
- Davies et al. (2011) Davies, B., Bastian, N., Gieles, M., et al. 2011, MNRAS, 411, 1386
- Dalcanton et al. (2012) Dalcanton, J. J., Williams, B. F., Lang, D., et al. 2012, ApJS, 200, 18
- Dempsey et al. (2013) Dempsey, J. T., Thomas, H. S., & Currie, M. J. 2013, ApJS, 209, 8
- Dolphin (2000) Dolphin, A. E. 2000, PASP, 112, 1383
- Dotter et al. (2010) Dotter, A., Sarajedini, A., Anderson, J., et al. 2010, ApJ, 708, 698
- Downes et al. (2001) Downes, R. A., Webbink, R. F., Shara, M. M., et al. 2001, PASP, 113, 764
- Elsner et al. (2008) Elsner, R. F., Heinke, C. O., Cohn, H. N., et al. 2008, ApJ, 687, 1019-1034
- Engel et al. (2012) Engel, M. C., Heinke, C. O., Sivakoff, G. R., Elshamouty, K. G., & Edmonds, P. D. 2012, ApJ, 747, 119
- Freitag et al. (2006) Freitag, M., Rasio, F. A., & Baumgardt, H. 2006, MNRAS, 368, 121
- Fitzpatrick (1999) Fitzpatrick, E. L. 1999, PASP, 111, 63
- Geller et al. (2017) Geller, A. M., Leiner, E. M., Bellini, A., et al. 2017, ApJ, 840, 66
- Giardino et al. (2008) Giardino, G., Pillitteri, I., Favata, F., & Micela, G. 2008, A&A, 490, 113
- Girardi (2016) Girardi, L. 2016, ARA&A, 54, 95
- Gonzalez et al. (2011) Gonzalez, M. E., Stairs, I. H., Ferdman, R. D., et al. 2011, ApJ, 743, 102
- Gosnell et al. (2012) Gosnell, N. M., Pooley, D., Geller, A. M., et al. 2012, ApJ, 745, 57
- Gürkan et al. (2004) Gürkan, M. A., Freitag, M., & Rasio, F. A. 2004, ApJ, 604, 632
- Güver & Özel (2009) Güver, T., & Özel, F. 2009, MNRAS, 400, 2050
- Haggard et al. (2009) Haggard, D., Cool, A. M., & Davies, M. B. 2009, ApJ, 697, 224
- Hare et al. (2016) Hare, J., Rangelov, B., Sonbas, E., Kargaltsev, O., & Volkov, I. 2016, ApJ, 816, 52
- Heinke et al. (2001) Heinke, C. O., Edmonds, P. D., & Grindlay, J. E. 2001, ApJ, 562, 363
- Heinke et al. (2003) Heinke, C. O., Edmonds, P. D., Grindlay, J. E., et al. 2003, ApJ, 590, 809
- Heinke et al. (2003) Heinke, C. O., Grindlay, J. E., Edmonds, P. D., et al. 2003, ApJ, 598, 516
- Heinke et al. (2003) Heinke, C. O., Grindlay, J. E., Lugger, P. M., et al. 2003, ApJ, 598, 501
- Heinke et al. (2005) Heinke, C. O., Grindlay, J. E., Edmonds, P. D., et al. 2005, ApJ, 625, 796
- Heinke et al. (2006) Heinke, C. O., Wijnands, R., Cohn, H. N., et al. 2006, ApJ, 651, 1098
- Heinke (2010) Heinke, C. O. 2010, American Institute of Physics Conference Series, 1314, 135
- Holberg & Bergeron (2006) Holberg, J. B., & Bergeron, P. 2006, AJ, 132, 1221
- Ivanov et al. (2005) Ivanov, V. D., Kurtev, R., & Borissova, J. 2005, A&A, 442, 195
- Jansen et al. (2001) Jansen, F., Lumb, D., Altieri, B., et al. 2001, A&A, 365, L1
- Kalirai et al. (2001) Kalirai, J. S., Richer, H. B., Fahlman, G. G., et al. 2001, AJ, 122, 266
- Kharchenko et al. (2005) Kharchenko, N. V., Piskunov, A. E., Röser, S., Schilbach, E., & Scholz, R.-D. 2005, A&A, 438, 1163
- Kobulnicky et al. (2005) Kobulnicky, H. A., Monson, A. J., Buckalew, B. A., et al. 2005, AJ, 129, 239
- Kong et al. (2006) Kong, A. K. H., Bassa, C., Pooley, D., et al. 2006, ApJ, 647, 1065
- Krauss & Chaboyer (2003) Krauss, L. M., & Chaboyer, B. 2003, Science, 299, 65
- Kurtev et al. (2008) Kurtev, R., Ivanov, V. D., Borissova, J., & Ortolani, S. 2008, A&A, 489, 583
- Lan et al. (2010) Lan, S.-H., Kong, A. K. H., Verbunt, F., et al. 2010, ApJ, 712, 380
- Laney et al. (2012) Laney, C. D., Joner, M. D., & Pietrzyński, G. 2012, MNRAS, 419, 1637
- Leaman et al. (2013) Leaman, R., VandenBerg, D. A., & Mendel, J. T. 2013, MNRAS, 436, 122
- Lim et al. (2015) Lim, P. L., Diaz, R. I., & Laidler, V. 2015, PySynphot User?s Guide (Baltimore, MD STScI), https://pysynphot.readthedocs.io/en/latest/
- Linares (2014) Linares, M. 2014, ApJ, 795, 72
- Liu et al. (2007) Liu, Q. Z., van Paradijs, J., & van den Heuvel, E. P. J. 2007, A&A, 469, 807
- Lucy (1974) Lucy, L. B. 1974, AJ, 79, 745
- Manchester (2017) Manchester, R. N. 2017, Journal of Astrophysics and Astronomy, 38, 42
- Marigo et al. (2017) Marigo, P., Girardi, L., Bressan, A., et al. 2017, ApJ, 835, 77
- Meibom et al. (2002) Meibom, S., Andersen, J., & Nordström, B. 2002, A&A, 386, 187
- Miller-Jones et al. (2015) Miller-Jones, J. C. A., Strader, J., Heinke, C. O., et al. 2015, MNRAS, 453, 3918
- Mooley & Singh (2015) Mooley, K. P., & Singh, K. P. 2015, MNRAS, 452, 3394
- Mossoux et al. (2016) Mossoux, E., Grosso, N., Bushouse, H., et al. 2016, A&A, 589, A116
- Platais et al. (2011) Platais, I., Cudworth, K. M., Kozhurina-Platais, V., et al. 2011, ApJ, 733, L1
- Plotkin et al. (2016) Plotkin, R. M., Gallo, E., Jonker, P. G., et al. 2016, MNRAS, 456, 2707
- Ponti et al. (2017) Ponti, G., George, E., Scaringi, S., et al. 2017, MNRAS, 468, 2447
- Pooley & Hut (2006) Pooley, D., & Hut, P. 2006, ApJ, 646, L143
- Pooley et al. (2007) Pooley, D., Rappaport, S., Levine, A., Pfahl, E., & Schwab, J. 2007, arXiv:0708.3365
- Pooley (2010) Pooley, D. 2010, Proceedings of the National Academy of Science, 107, 7164
- Portegies Zwart & McMillan (2002) Portegies Zwart, S. F., & McMillan, S. L. W. 2002, ApJ, 576, 899
- Portegies Zwart et al. (2010) Portegies Zwart, S. F., McMillan, S. L. W., & Gieles, M. 2010, ARA&A, 48, 431
- Prager et al. (2017) Prager, B. J., Ransom, S. M., Freire, P. C. C., et al. 2017, ApJ, 845, 148
- Predehl & Schmitt (1995) Predehl, P., & Schmitt, J. H. M. M. 1995, A&A, 293, 889
- Renaud et al. (2017) Renaud, F., Agertz, O., & Gieles, M. 2017, MNRAS, 465, 3622
- Richer et al. (1998) Richer, H. B., Fahlman, G. G., Rosvick, J., & Ibata, R. 1998, ApJ, 504, L91
- Rieke & Lebofsky (1985) Rieke, G. H., & Lebofsky, M. J. 1985, ApJ, 288, 618
- Rivera Sandoval et al. (2018) Rivera Sandoval, L. E., van den Berg, M., Heinke, C. O., et al. 2018, MNRAS, 475, 4841
- Rosen et al. (2016) Rosen, S. R., Webb, N. A., Watson, M. G., et al. 2016, A&A, 590, A1
- Sarajedini et al. (1999) Sarajedini, A., von Hippel, T., Kozhurina-Platais, V., & Demarque, P. 1999, AJ, 118, 2894
- Scholz et al. (2015) Scholz, R.-D., Kharchenko, N. V., Piskunov, A. E., Röser, S., & Schilbach, E. 2015, A&A, 581, A39
- Skrutskie et al. (2006) Skrutskie, M. F., Cutri, R. M., Stiening, R., et al. 2006, AJ, 131, 1163
- Sonbas et al. (2018) Sonbas, E., Dhuga, K. S., & Gogus, E. 2018, arXiv:1801.07107
- Spitzer (1969) Spitzer, L., Jr. 1969, ApJ, 158, L139
- Townsley et al. (2018) Townsley, L. K., Broos, P. S., Garmire, G. P., et al. 2018, arXiv:1802.04902
- van den Berg et al. (2004) van den Berg, M., Tagliaferri, G., Belloni, T., & Verbunt, F. 2004, A&A, 418, 509
- van den Berg (2013) van den Berg, M. 2013, 370 Years of Astronomy in Utrecht, 470, 251
- van den Berg et al. (2013) van den Berg, M., Verbunt, F., Tagliaferri, G., et al. 2013, ApJ, 770, 98
- van der Marel (2004) van der Marel, R. P. 2004, Coevolution of Black Holes and Galaxies, 37
- Vats & van den Berg (2017) Vats, S., & van den Berg, M. 2017, ApJ, 837, 130
- Verner et al. (1996) Verner, D. A., Ferland, G. J., Korista, K. T., & Yakovlev, D. G. 1996, ApJ, 465, 487
- Zavlin et al. (2002) Zavlin, V. E., Pavlov, G. G., Sanwal, D., et al. 2002, ApJ, 569, 894
- Zavlin (2006) Zavlin, V. E. 2006, ApJ, 638, 951