Study of short term enhanced TeV - ray emission from Mrk 421 observed with TACTIC
on December 28, 2014
Abstract
In this work, we report on the detection of enhanced TeV - ray emission from the high synchrotron-peaked blazar Mrk 421 with the TACTIC telescope on the night of December 28, 2014 (MJD 57019). We use data from the TACTIC observations of Mrk 421 for one week during December 25-31, 2014 (MJD 57016-57022) in this study. The TACTIC observation on December 28, 2014 (MJD 57019) alone results in the detection of 8617 - ray like events from Mrk 421 with a statistical significance of 5.17 in a livetime of 2.2 hours above an energy threshold of 0.85 TeV. The high statistics (higher than three Crab Units) of TeV photons enables us to study the very high energy (VHE) - ray emission from the source at shorter timescales. A minimum variability timescale of 0.72 days is obtained for the TeV - ray emission from Mrk 421 during the above flaring activity of the source. The intrinsic VHE spectrum is described by a power law with spectral index of 2.990.38 in the energy range 0.85–8.5 TeV. The integral VHE - ray flux above 0.85 TeV is determined to be (3.680.64)10-11 ph cm-2 s-1 from the TACTIC observations of Mrk 421 on the night of December 28, 2014 (MJD 57019). Near simultaneous measurements by the HAWC observatory give an integral flux of (2.900.40)10-11 ph cm-2 s-1 above 2 TeV from Mrk 421 observations on December 29, 2014 (MJD 57020.33-57020.58). We have also analyzed the contemporaneous data from Fermi-LAT to study the high energy (HE) –ray emission during the high activity state of the source. The HE –ray emission is observed to be increasing after the TeV flaring activity detected with the TACTIC. We also use other near simultaneous archival data available from the Swift-BAT in hard X-rays and from SPOL at Steward Observatory in optical V and R bands to characterize the multi-wavelength emission of Mrk 421 during the high activity state observed at TeV energies. The TeV - ray emission observed on December 28, 2014 (MJD 57019) is found to be more prominant than the emissions in lower energy bands during the same period. The TeV - ray observation of Mrk 421 in high activity state with the TACTIC telescope is also used to understand the physical mechanism for blazar emission under the frame work of the leptonic single zone synchrotron self Compton process.
keywords:
(Galaxies:) BL Lacertae objects:individual:Mrk 421-methods:data analysis-Gamma-rays: general, , , , , , , , , , , , , , , , , , , , ,
1 Introduction
Mrk 421 is a relatively nearby blazar located at a distance of 135 Mpc (redshift z=0.031) in the extragalactic sky [1]. It has been classified as the high synchrotron-peaked (HSP) blazar on the basis of the position of synchrotron peak frequency (Hz) in the spectral energy distribution (SED) of blazars, which is generally characterized by a double hump structure [2]. Mrk 421 is one of the well studied and strongest TeV - ray sources in the northern hemisphere. Motivated with the detection of high energy (HE) - ray emission from Mrk 421 above 100 MeV by EGRET for the first time in 1991 [3], the source was selected as a prime TeV candidate for very high energy (VHE) - ray observation with the ground based Whipple telescope. In March-June 1992, the Whipple telescope discovered the first unambiguous VHE - ray emission from Mrk 421 with a statistical significance of 6 above 0.5 TeV and an integral flux of 30 of the Crab Nebula flux [4]. After Whipple observations, Mrk 421 became the first extragalactic source detected at TeV energies. Since its discovery at TeV energies, Mrk 421 has been observed to exhibit episodes of strong flaring activities over the entire electromagnetic spectrum from TeV - rays to radio energies on several occasions. During 1993-2004, the Whipple telescope detected many dramatic outbursts at TeV energies from Mrk 421 with doubling timescales from hours to less than 15 minutes [5,6] and for the first time spectral hardening of TeV - ray emission during the flare was observed in a blazar [7,8]. The MAGIC telescope observed TeV - ray emission from this source in 2004 [9] followed by first simultaneous observation of X-ray and TeV flares in 2006 [10]. Subsequently, this blazar had been regularly monitored by all the ground based - ray telescopes with the detection of various flaring activities from the source [11,12,13]. Again, a major outburst at all energies was observed from Mrk 421 in February 2010 by various ground and space based instruments. At TeV energies, this flaring activity was detected by VERITAS, HESS, TACTIC, HAGAR and ARGO-YBJ detectors [14,15,16,17,18,19,20]. Apart from the detection of multiple short-term flaring activities from Mrk 421 during the last two decades, many long term multi-wavelength observations of the source are also reported in the literature by various telescopes including TACTIC [21,22,23,24,25,26,27,28,29,30]. An integral baseline flux of 33 of the Crab Nebula flux above 1 TeV has been derived for Mrk 421 using a combination of data collected during 1991-2009 [31].
Blazars are radio-loud active galactic nuclei (AGNs) powered by accretion on to the supermassive black holes in the Universe. They are characterized by the relativistic jets originating from the region close to the central engine and pointed towards the line of sight from the Earth. The relativistic effects like Doppler boosting of the non-thermal radiation emitted from the blazar-jet are more pronounced and the emission is observed to be variable over the entire eletromagnetic spectrum from radio to VHE - rays. Mrk 421 has also been an important blazar to investigate correlations in TeV - ray and X-ray fluxes measured during low and high activity states. A tentative positive and strong correlation between X-ray and TeV - ray fluxes is found during multi-wavelength campaign of several flaring episodes [32,33]. However, VHE - ray flares without any X-ray activity have also been observed [8,34]. Such flaring activities are referred to as orphan TeV flares. A positive correlation in X-ray and TeV - ray emission during quiescent state of Mrk 421 is also reported [35]. The connection between the variations in TeV energy bands and lower energy bands has not been clearly understood for blazars like Mrk 421 and detailed time-dependent emission models are being developed to study the complex correlations among different energy bands [36,37,38].
Because of its proximity and high degree of multi-wavelength variability at different timescales, Mrk 421 has been a good extragalactic TeV source for understanding the physical mechanisms involved in the blazar emission during the quiescent as well as flaring states. The low energy emission from blazars is attributed to the relativistically beamed incoherent synchrotron radiation whereas high energy emission in GeV-TeV regime has not yet been well understood. Different models have been proposed in the literature to explain the - ray emission from blazars in quiescent as well as flaring states. In the leptonic synchrotron self Compton (SSC) model, the high energy - ray photons are produced by the inverse Compton (IC) scattering of the low energy synchrotron photons by the same population of relativistic electrons that emit the synchrotron photons [39,40,41]. In another leptonic model, the target photons for IC enter from outside regions like accretion disk [42], broad-line region and dusty torus [43]. This is referred to as the External Compton (EC) model for - ray emission in blazars. On the other hand, hadronic models have also been proposed in which - ray photons are produced by proton synchrotron emission [44,45] and by the secondary particles of the proton-initiated cascades [46,47].
Motivated by the observation of frequent flaring activities of Mrk 421, we study the sudden increase in the TeV - ray emission on the night of December 28, 2014 (MJD 57019) observed with the TACTIC. In order to characterize the short term enhanced TeV - ray emission from the source, we have used data from TACTIC observations of Mrk 421 collected during December 25-31, 2014 including the high activity state. In Section 2, we describe the observations and data analysis procedures followed in different energy bands for the period December 25-31, 2014 (MJD 57016-57022). The results from the TACTIC observations on the night of December 28, 2014 (MJD 57019) are presented in Section 3. In Section 4, results from broad-band near simultaneous observations during December 25-31, 2014 in multi-wavelength context are reported. Finally, we conclude our study in Section 5. We have adopted CDM cosmology with parameters H0 = 70 km s-1 Mpc-1, = 0.27 and = 0.73 throughout this paper.
2 Observations and data analysis
2.1 TACTIC: VHE - rays
The TeV Atmospheric Cherenkov Telescope with Imaging Camera (TACTIC) is a VHE - ray telescope located at GOALS (Gurushikhar Observatory for AstrophysicaL Sciences) Observatory (24.6∘ N, 72.7∘ E, 1.3 km asl), Mount Abu, India [48]. The telescope deploys a F/1-type tesselated light collector of 9.5 m2 area, with a 349-pixel photomultiplier based imaging camera at its focal plane. The TACTIC telescope has undergone a major upgrade in 2011 to improve its over all performance. With its current hardware configuration the TACTIC telescope can detect a VHE - ray signal above an energy threshold of 0.85 TeV from the Crab Nebula like source at a statistical significance of 5 in 12 hours of observation time. The telescope has an angular resolution of 0.22∘ and an energy resolution of 26 at 1 TeV. The VHE - ray data used in this study was collected from the Mrk 421 direction with the TACTIC telescope during December 25-31, 2014 (MJD 57016-57022). We have applied standard data quality checks (compatibility of the prompt coincidence rate with the expected zenith angle trend, Poisson distribution for the arrival times of the cosmic ray events and steady behaviour of the chance coincidence rates with time) to the raw data collected with TACTIC for obtaining the clean data for further analysis. The application of data quality checks results in a live observation time of 11 hours. In the next step, the clean data are analysed using the analysis procedure developed for the TACTIC telescope. We have followed the standard analysis procedure based on Hillas parameter technique (where each extensive air shower image recorded in the telescope camera is characterized by its moments of various order) [49,50] to separate the - ray like events from the huge background of hadronic events. The energy of - ray like events is estimated using an artificial neural network based methodology developed for the TACTIC telescope [51]. Details of the data analysis procedure used for TACTIC after upgrade can be found in [30,52,53].
2.2 Fermi-LAT: HE - rays
The Large Area Telescope (LAT) on board the Fermi satellite is a pair-conversion HE - ray telescope optimized for exploring the sky in the energy range from 30 MeV to beyond 300 GeV [54]. The Fermi-LAT scans the entire sky approximately every three hours in survey mode with a wide field of view and an unprecedented sensitivity for the detection of HE - ray photons. We have analysed the publically available Pass 8 data111https://fermi.gsfc.nasa.gov/cgi-bin/ssc/LAT/LATDataQuery.cgi for the period December 25-31, 2014 (MJD 57016-57022) using the Fermi ScienceTools software package version v10r0p5. We have followed the standard procedure for the unbinned likelihood analysis of the LAT data in the energy range 100 MeV–300 GeV for a region of interest (ROI) of 10∘ radius centered at the position of Mrk 421. A maximum zenith angle cut of 90∘ is applied for events to reduce contamination from the Earth’s limb where –rays are expected to be produced by interactions of cosmic-rays with the upper atmosphere of the Earth. The instrument response function P8R2SOURCEV6 with the diffuse –ray emission model files glliemvo6.fit and isoP8R2SOURCEV6v06.txt for Galactic and extragalactic components respectively are used in the analysis. All the point sources within 20∘ from Mrk 421 have been included in the model file from the third Fermi –ray source catalog (3FGL) [55]. The significance of HE –ray events from the source under study is estimated using likelihood ratio test statistic (TS) defined in [56]. The spectral parameters of all the sources in the optimized model file are fixed to their catalog values except Mrk 421 for which the spectral parameters of a power law model are left free for generating the daily light curve. We have computed upper limits on the integral flux at 2 confidence level for the light curves with TS 25. For the estimation of spectral flux points in different energy bins, the spectral index of the source is fixed to the value obtained from the best-fit over a given time period for which spectral analysis is performed and the normalization is left free to vary. For the background emission models, the normalization is left free during the calculation of light curves and flux points for the spectra of the source.
2.3 Swift-BAT: Hard X-rays
The Burst Alert Telescope (BAT) on board the Swift satellite is a coded aperture mask telescope operating in the hard X-ray energy range 14-195 keV [57]. The Swift-BAT monitors the whole sky every 1.5 hours while orbiting the Earth. The daily light curves from the sources detected by Swift-BAT are provided online222https://swift.gsfc.nasa.gov/results/transients in the energy range 15-50 keV [58]. We have used the archival data available from Mrk 421 during the period December 25-31, 2014 (MJD 57016-57022) to obtain the daily light curves of the source. The photon flux measurements have been converted into the energy flux values using the appropriate mean energy of the hard X-ray photons in the energy range 15-50 keV.
2.4 SPOL: Optical
The Spectro-POLarimeter (SPOL) at Steward Observatory of the University of Arizona provides optical observations for the LAT-monitored blazars under Fermi multi-wavelength blazar monitoring program [59]. We have used the public archival data333http://james.as.arizona.edu/ psmith/Fermi/DATA/Objects for Mrk 421 observations in R and V bands available during December 25-31, 2014 (MJD 57016-57022). The observed magnitudes in R and V bands have been converted into corresponding energy flux values using appropriate zero magnitude flux points to build the daily optical light curves of the source.
3 Results from TeV observations on December 28, 2014 with TACTIC
3.1 TeV - ray detection
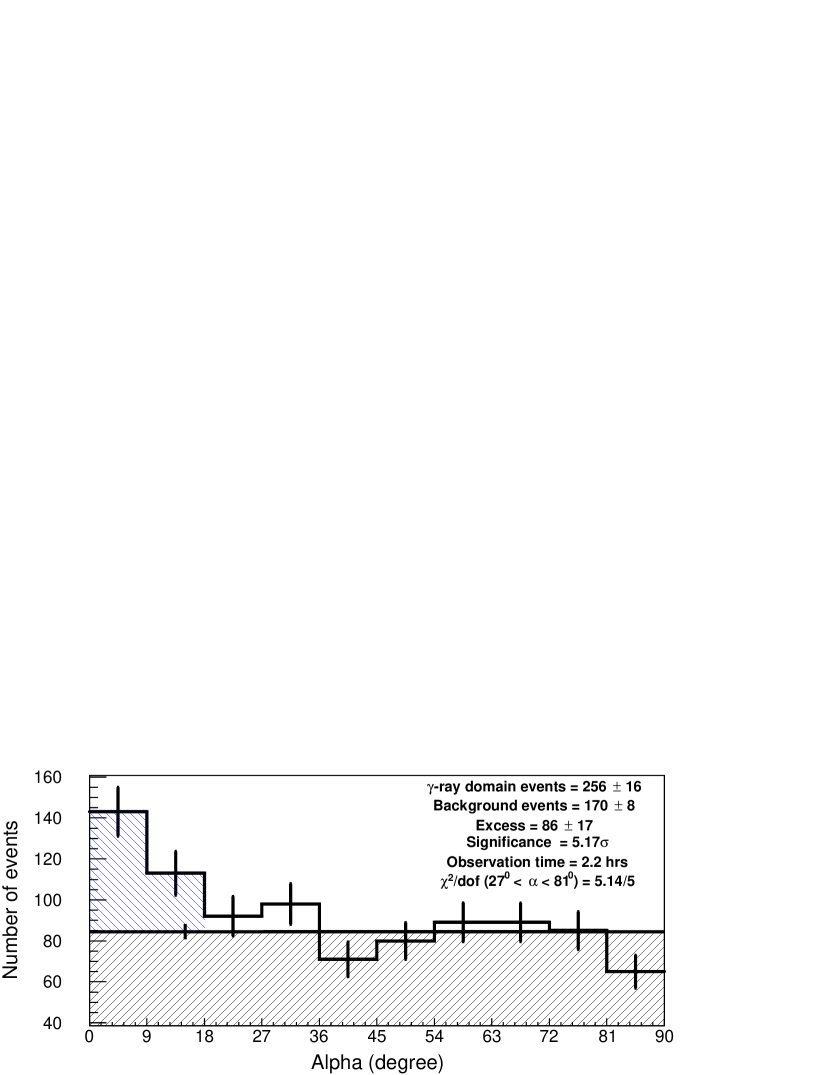
In VHE - ray observations with ground based imaging Cherenkov telescopes, detection of the - ray signal from a source direction is determined from the frequency distribution of - parameter which is defined as the angle between the major axis of the shower image and the line connecting the camera center to the image centeroid. The frequency distribution of - parameter is expected to be flat for the isotropic cosmic-ray hadronic events, whereas it shows a peak at smaller - values ( 18∘) for - ray events coming from a point source. The statistical significance of the detected - ray like events is determined using the methodology proposed by Li and Ma (1983) [60]. The distribution of - parameter for the events detected during the observation of Mrk 421 with the TACTIC on the night of December 28, 2014 (MJD 57019.89583-57019.97917) is shown in Figure 1. The livetime of 2.2 hours from Mrk 421 observation with TACTIC on December 28, 2014 has resulted in the detection of 8617 VHE - ray photons with a statistical significance of 5.17. The time averaged event rate from Mrk 421 during the above period is found to be (398) - rays per hour, which corresponds to 3- times the - ray rate from the Crab Nebula (for TACTIC, Crab Unit corresponds to the detection of TeV photons at an average rate of 14 - rays per hour or an integral flux of 1.12 10-11 ph cm-2 s-1 above 0.85 TeV from the Crab Nebula observations). Therefore, it is evident from the above analysis that the blazar Mrk 421 has undergone a high activity state at TeV energies on December 28, 2014.
3.2 Intra-night TeV light curve
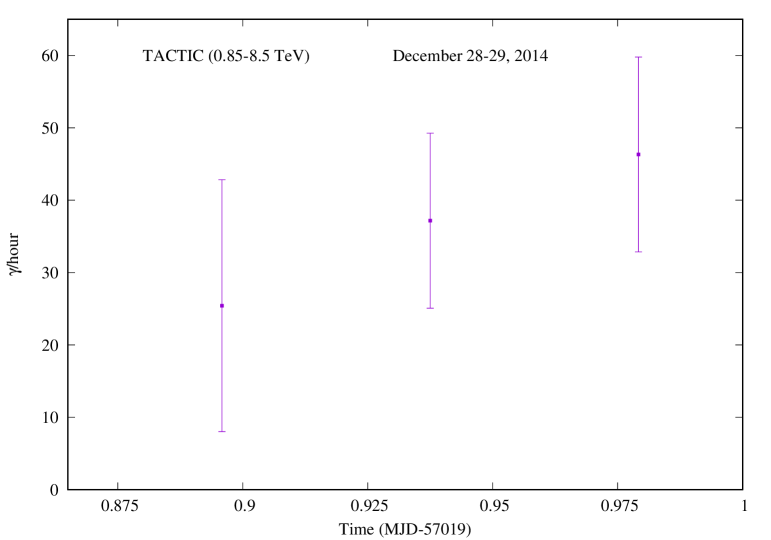
As discussed in Section 3.1, the analysis of TACTIC data results in the statistically significant detection of TeV photons at a rate of (398) - rays per hour in a livetime of 2.2 hours. The intra-night TeV light curve of Mrk 421 observed with TACTIC on the night of December 28, 2014 (MJD 57019.89583-57019.97917) is shown in Figure 2. The individual TeV - ray rates in the intra-night light curve correspond to a statistical significance of more than 3. Detailed analysis of the flux measured during the flaring activity at smaller time bins will give evidence of very fast variability at TeV - ray energies in Mrk 421. The temporal analysis of such a short duration flare is also important because a large fraction of the bolometric luminosity of blazars is produced at GeV-TeV energies. However, the detailed temporal analysis of the intra-night TeV light curve does not indicate significant variability because of the large error bars in the - ray rates as shown in Figure 2. The null hypothesis for constant emission during the flaring activity gives a constant TeV - ray rate of (385) - rays per hour corresponding to the reduced- and degree of freedom (/dof) value of 0.45/2 with the probability 63.5. This again indicates that the average TeV - ray emission from Mrk 421 during the short duration high activity state observed with TACTIC is compatible with the emission level 3-times higher than that of the Crab Nebula.
3.3 - ray differential energy spectrum
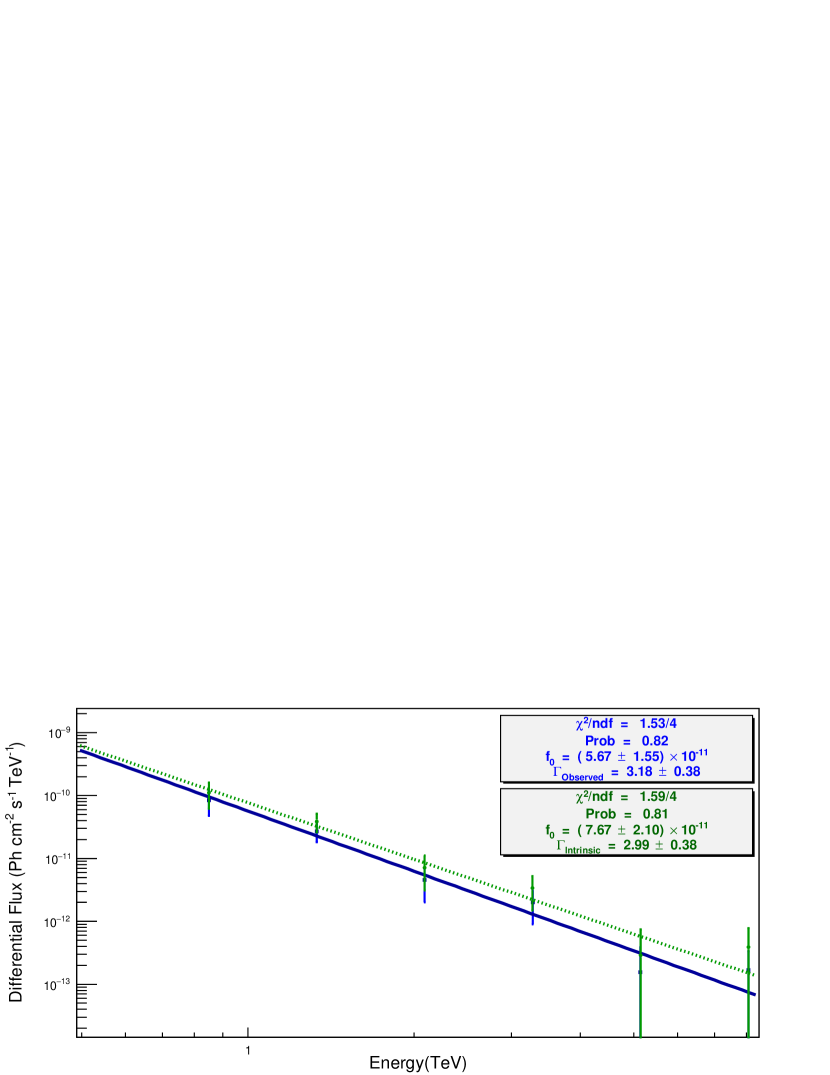
The TACTIC observations of Mrk 421 on the night of December 28, 2014 confirm the detection of statistically significant TeV - ray photons in a short livetime of 2.2 hours. This enables to obtain the TeV spectrum of the source down to short timescale from the TACTIC observations. The unfolded differential energy spectrum of Mrk 421 derived from the TACTIC observations during the high activity state is shown in Figure 3. The time averaged differential energy spectrum between 0.85-8.5 TeV is described by a simple power law of the form :
| (1) |
with an observed photon spectral index of and a normalization constant of ph cm-2 s-1 TeV-1 at 1 TeV. The mean integral flux above 0.85 TeV is (3.681.07) 10-11 ph cm-2 s-1 which corresponds to 3.2 times the Crab Nebula flux. We have also calculated the intrinsic VHE spectrum of the source, considering the absorption of TeV photons by pair creation due to interaction with the extragalactic background light (EBL) photons. Despite being a nearby source at redshift , a significant absorption of TeV photons is obtained for the EBL model proposed by Domínguez et al. (2011) [61]. The intrinsic VHE spectrum corresponding to the above observed spectrum is also described by a power law with photon spectral index and normalization constant ph cm-2 s-1 TeV-1 at 1 TeV. Within error bars the observed and intrinsic spectral indices of Mrk 421 are found to be consitent with the previous values reported in the literature [15,16]. The time averaged HE - ray spectrum of the source from Fermi-LAT observations on December 28, 2014 is also described by a power law with spectral index 1.410.11 in the energy range 100 MeV to 300 GeV and the corresponding integral flux above 100 MeV is found to be (1.710.72) 10-7 ph cm-2 s-1.
3.4 Comparison with near simultaneous HAWC observation
The High Altitude Water Cherenkov (HAWC) observatory at an altitude of 4.1 km provides continuous survey of the sky and opens a new window for identifying extreme VHE flares [62]. The wide field of view and high duty cycle of HAWC provides unique opportunity to observe every TeV source that transits over the observatory for up to 6 hours each sidereal day. Long term monitoring of Mrk 421 with the HAWC observatory for 17 months during November 2014-April 2016 gives an average flux of (4.530.14) 10-12 ph cm-2 s-1 above 2 TeV under a constant flux emission model [63]. An integral flux of (2.910.38) 10-11 ph cm-2 s-1 above 2 TeV was measured on December 29, 2014 (MJD 57020.33-57020.58) from 6 hours of observations of Mrk 421 with the HAWC observatory. The time averaged integral flux above 0.85 TeV measured with the TACTIC on the night of December 28, 2014 (MJD 57019.89583-57019.97917) is found to be (3.680.64) 10-11 ph cm-2 s-1 in an observation time of 2.2 hours. The near simultanoeus measurements of the VHE integral flux with TACTIC and HAWC indicate that Mrk 421 is observed to be in a high activity state at TeV energies. The conversion of integral flux measured with TACTIC from the short term flaring state of Mrk 421 in Crab units above 1 TeV also gives a flux value of 3-times the Crab Nebula flux above 1 TeV, which is much higher than the quiescent level (33 of Crab Nebula flux) of Mrk 421 estimated from the long-term light curves for the period 1991-2009 [31].
4 Results from multi-wavelength observations
4.1 Multi-wavelength light curves
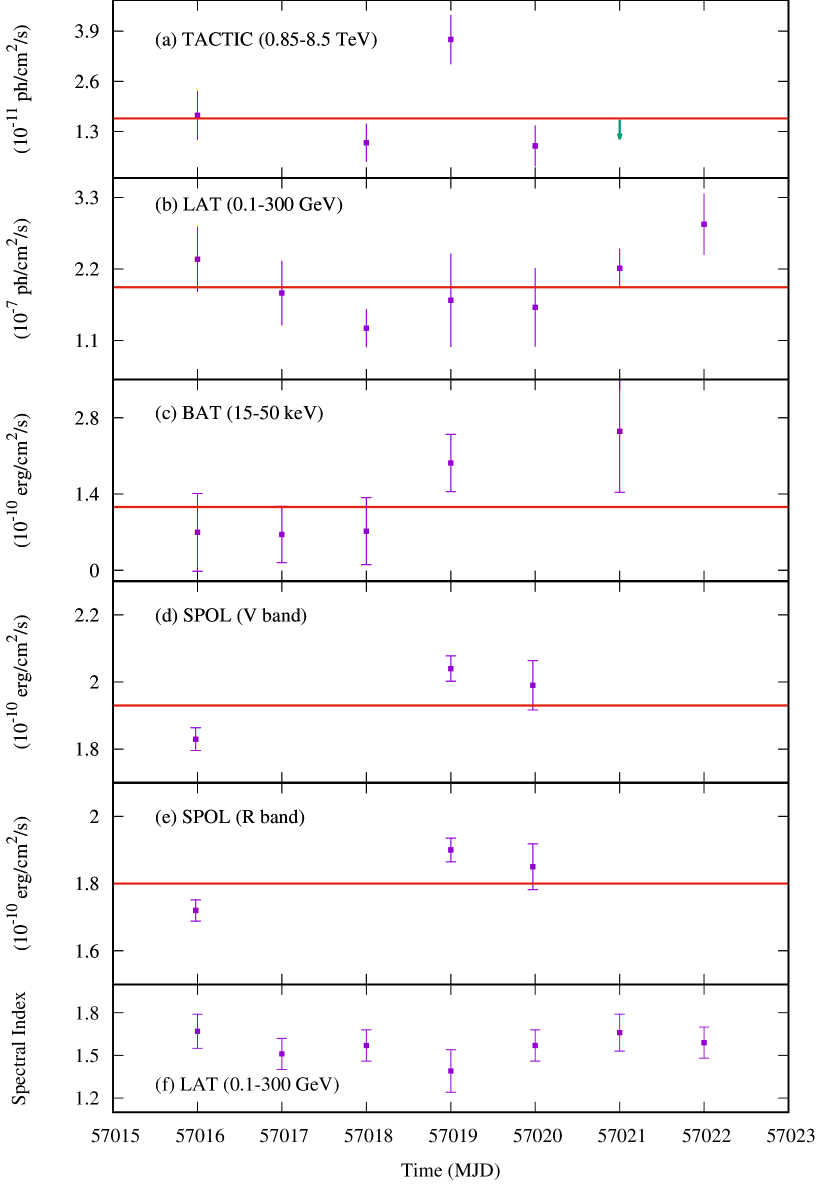
The multi-wavelength daily light curves of the blazar Mrk 421 during December 25-31, 2014 (MJD 57016-57022) in TeV, GeV, hard X-ray and optical (V and R) bands are shown in Figure 4(a-e). The TeV flux points averaged over one day as shown in Figure 4(a), represent the integral flux above 0.85 TeV corresponding to the TACTIC observations with detection significance more than 2 whereas observations with statistical significance less than 2 are depicted as upper limits. We observe that the source undergoes a flaring activity at TeV energies on December 28, 2014 (MJD 57016) with an integral flux of (3.680.64) 10-11 ph cm-2 s-1 ( 3 times the Crab Nebula flux) above 0.85 TeV, which corresponds to the statistical significance of 5.16 for TACTIC observation of Mrk 421 in a live time of 2.2 hours. The daily averaged light curves shown in Figure 4(b-e) are results from the near simultaneous observations of Mrk 421 with Fermi-LAT, Swift-BAT and SPOL respectively. The visual inspection of the multi-wavelength light curves shown in Figure 4 indicates that TeV emission from the source is variable during this period with a dominant flaring activity observed on December 28, 2014 (MJD 57019). We use null hypothesis for a constant flux emission to characterize the variability present in the emissions from the source in different energy bands. The values of constant flux level and correponding goodness of fit obtained from the null hypothesis for the flux points in various energy bands are given in Table 1. The values of reduced- and degree of freedom (/dof) along with the probabilities indicate that the flux points measured with TACTIC and SPOL (V and R bands) are not consistent with the constant emission model whereas the HE - ray in the energy range 0.1-100 GeV and hard X-ray emission in the energy range 15-50 keV measured with Fermi-LAT and Swift-BAT respectively are constant during this period. The horizontal solid lines (red) in Figure 4(a-e) represent average flux level in different energy bands. It is evident that the TeV flaring activity detected with TACTIC on December 28, 2014 (MJD 57019) is also accompanied by relatively enhanced activity in lower energy bands except Fermi-LAT wherein the flux value is slightly below the average level. However, the HE –ray emission measured with Fermi-LAT is observed to be gradually increasing after the TeV flaring activity on December 28, 2014 (MJD 57019), which may lead to the higher flux level estimated during this period. In Figure 4(f), we have shown the variation of HE –ray photon spectral indices of a power law fit obtained from Fermi-LAT daily observations of Mrk 421. No significant trend of spectral hardening with the increasing flux in HE band is observed during this period. However, it is to be noted that the HE –ray emission measured from Fermi-LAT gradually increases after the relatively high TeV activity state. But, due to lack of observations available in other wave-bands during this period, no clear explaination can be given for such activity in the emission from the source. Also, it is beyond the scope of this work as we mainly focus on the short term high activity state of Mrk 421 detetcted at TeV energies on December 28, 2014 (MJD 57019) with the TACTIC telescope .
| Instrument | Energy Range | Average flux | /dof | Probability |
|---|---|---|---|---|
| TACTIC | 0.85-8.6 TeV | (1.640.60)10-11 ph cm-2 s-1 | 4.56/3 | 0.003 |
| LAT | 0.1-300 GeV | (1.920.21)10-7 ph cm-2 s-1 | 1.81/6 | 0.092 |
| BAT | 15-50 keV | (1.160.33)10erg cm-2 s-1 | 1.44/4 | 0.217 |
| SPOL | V-band | (1.930.07)10erg cm-2 s-1 | 9.24/2 | 0.000 |
| SPOL | R-band | (1.800.06)10erg cm-2 s-1 | 7.40/2 | 0.000 |
4.2 Variability Analysis
The multi-wavelength emission from Mrk 421 during December 25-31, 2014 (MJD 57016-57022) is observed to be variable with significant flux changes at TeV energies. In order to further quantify the intrinsic source variability, we have estimated fractional variability (Fvar), variability amplitude parameter (Amp) and relative variability amplitude (RVA) in different energy bands. The variability analysis of multi-wavelength light curves using these methods is possible only when the fluctuations in flux points exceed the measurement error. The fractional variability statistic (Fvar) is given by [64]
| (2) |
and the formal uncertainty in Fvar is computed by
| (3) |
where is the variance, is the mean square measurement error, is the mean flux and is the number of flux points in the light curve. The estimated values of Fvar in different energy bands are summarized in Column 2 of Table 2. The highest value of Fvar is obtained for TeV observations from the TACTIC whereas measurements with Fermi-LAT and Swift-BAT in HE - ray and hard X-ray bands respectively are error dominated. The values of fractional variability for optical observations are high because of low measurement errors in the flux points. Therefore, we observe that the blazar Mrk 421 exhibits significant variability during December 25-31, 2014 at TeV energies. The intrinsic variability of the source in soft X-rays can not be probed due to unavailability of observations during this period.
The percentage variation in the multi-wavelength light curves is calculated through the peak-to-peak variability amplitude parameter (Amp) which is defined as [65]
| (4) |
and the error in Amp is estimated as
| (5) |
where Fmax and Fmin are the maximum and minimum flux values with uncertainties Fmax and Fmin respectively in each light curve, F is the error in mean flux, and is the average measurement error. The calculated values of Amp for the multi-wavelength light curves is given in Column 3 of Table 2. A maximum peak-to-peak variation is obtained for TeV –rays whereas optical emissions in V and R bands show minimum variation during this period. The lowest values of Amp for optical observations are also consistent with the visual inspection of light curves where the peak flux values are not clearly identified as compared to TeV light curve. The next parameter for characterizing the variability of the source is the estimation of relative variability amplitude (RVA) which we define as [66]
| (6) |
and the uncertainty on RVA is given by
| (7) |
The RVA values given in Column 4 of Table 2 are also found to be consistent with the general behaviour of blazars wherein maximum variability is expected at high energy bands. Above analysis based on the estimation of three variability parameters also indicates the presence of variability in the emissions from Mrk 421 in different energy bands with TeV flux points showing maximum variability.
| Energy Range | Fvar | Amp() | RVA |
|---|---|---|---|
| 0.85-8.6 TeV | 0.520.17 | 9535 | 0.500.15 |
| 0.1-300 GeV | 0.200.10 | 6629 | 0.380.11 |
| 15-50 keV | 0.360.29 | 6127 | 0.590.29 |
| V-band | 0.350.01 | 6.22.2 | 0.050.01 |
| R-band | 0.350.01 | 6.92.6 | 0.050.01 |
4.3 Temporal analysis of TeV light curve
In order to compute the approximate value of the minimum variability timescale from the TeV light curve shown in Figure 4(a), we assume that TeV emission in the flaring activity evolves exponentially during rising or falling of the flux. We define the e-folding timescale as [67]
| (8) |
where is the time difference between and flux points i.e. and respectively in the light curve. The shortest variability timescale is calculated as . This method of computing minimum variability timescale uses only two flux measurements and it does not require any fitting of the flux points in the light curve. The minimum variability timescale for TeV - ray emission on December 28, 2014 from TACTIC observations of Mrk 421 is found to be 0.72 days. A conservative estimate of minimum variability timescale in the source frame of Mrk 421 gives days. Such a short variability timescale in TeV - ray emission of the source will be useful in constraining the size of emitting region and its location in the jet from the central engine.
4.4 Spectral Energy Distribution
In order to understand the broad-band emission characteristics of the source during relatively high activity state at TeV energies, we have used a simple one zone leptonic SSC model fully described in [68]. In this model, the emission region is assumed to be a spherical blob of radius moving down the blazar jet with bulk Lorentz factor at a viewing angle . The blob is homogeneously filled with a population of relativistic electrons (and positrons) with the differential number density described by a smooth broken power law of the form :
| (9) |
where is the Lorentz factor of electrons (and positrons) in the blob rest frame, is the normalization constant, and are the low and high energy spectral indices before and after the break respectively and is the Lorentz factor corresponding to the break in the electron distribution. and are the Lorentz factors corresponding to the minimum and maximum energies of the electron distribution in the emission region respectively. The emitting region is also assumed to be filled with a uniform tangled magnetic field . The relativistic electrons are considered to lose their energy through synchrotron process in the magnetic field and by the inverse Compton scattering off the synchrotron photons produced by them. Due to the relativistic bulk motion of the jet, the radiation from emitting region is boosted in the rest frame of the blazar by the Doppler factor given as
| (10) |
where is bulk speed of jet in the units of speed of light in vacuum, . In case of low viewing angle approximation for blazars, corresponding to . The size of emission region is constrained by the minimum variability timescale (tvar) using the relation :
| (11) |
The broad-band emissions from the blob due to synchrotron and SSC processes are estimated using the convolution of single particle emissivity with the particle distribution given in Equation 9. Finally, taking into account the relativistic boosting and other cosmological effects, the flux measured by the observer at energy is given by [69]
| (12) |
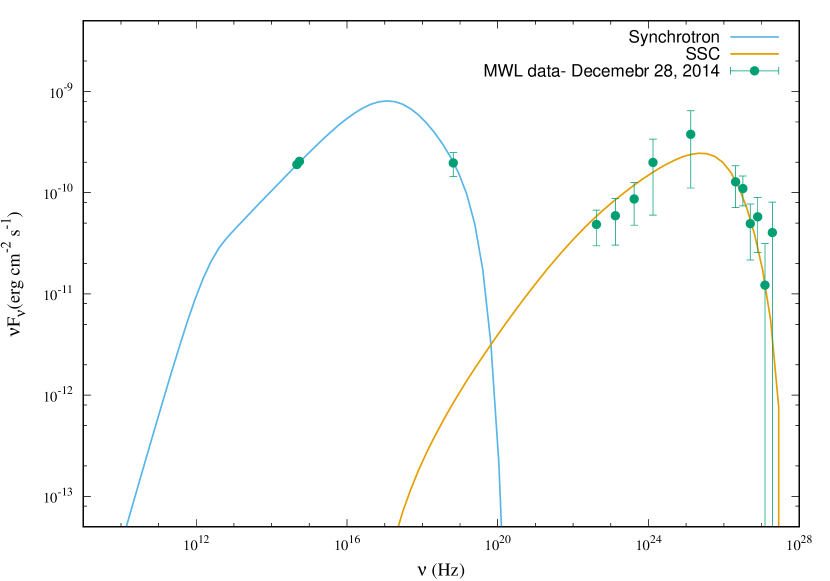
where is luminosity distance of the source, V is the volume of emission region and is the emissivity at energy corresponding to synchrotron and SSC processes. We have applied this simple SSC model to reproduce the broad-band emission from Mrk 421 measured on December 28, 2014. The near simultaneous multi-wavelength flux measurements along with the SED obtained from the synchrotron and inverse Compton processes are shown in Figure 5. We observe that the multi-wavelength flux points are broadly reproduced by the simple SSC model. The best fit model parameters derived from the broad-band SED modelling in the present work have been summarized in Table 3 and are found to be consistent with the values reported in the literature for Mrk 421 [11,16].
| Parameter | Symbol | Value |
|---|---|---|
| Radius of emission region | R | 2.111016 cm |
| Bulk Lorentz factor of jet | 13 | |
| Low energy index of particle ditribution | p | 2.21 |
| High energy index of particle ditribution | q | 4.22 |
| Break energy of particle distribution | Eb | 48 GeV |
| Magnetic field | B | 0.60 G |
| Particle energy density | Ue | 2.7010-3 erg cm-3 |
5 Discussion and Conclusions
We have performed a detailed study of the short term TeV flare of high synchrotron peaked blazar Mrk 421 detected with the TACTIC telescope on the night of December 28, 2014 (MJD 57019) using the data collected during December 25-31, 2014 (MJD 57016-57022). The TACTIC telescope has detected 8617 TeV –ray photons with a statistical significance of 5.17 in a short livetime of 2.2 hours on December 28, 2014. The time averaged VHE –ray rate detected with the TACTIC during this period corresponds to the source activity at the level of 3-times the emission from the Crab Nebula. The main focus of this work is to analyze and study this short duration TeV flare of Mrk 421 observed with the TACTIC and near simultaneous activity of the source in other wave-bands. The observed and intrinsic differential energy spectra of TeV photons detected with the TACTIC are described by power law with spectral indices 3.180.38 and 2.990.38 respectively in the energy range 0.85-8.5 TeV. The corresponding integral flux measured with the TACTIC telescope above 0.85 TeV is obtained to be (3.680.64) 10-11 ph cm-2 s-1. The quasi-simultaneous measurements of the integral flux from Mrk 421 with the TACTIC and HAWC observatory characterize the relatively high activity state of the source at TeV energies during observations on December 28, 2014.
We have also used near simultaneous observations available in other wave-bands from HE - ray to optical observations. From the analysis of the multi-wavelength light curves, it is found that the TeV - ray flare observed with the TACTIC on December 28, 2014 is detected without any significant change in lower energy bands. However, this can not be termed as an orphan flare because observations of soft X-rays and radio are not available during this period. We have applied the null hypothesis for constant flux to characterize the varaibility of the source in different energy bands in the first step. The goodness of fit (/dof and probability) obtained corresponding to the null hypothesis indicates that the emission in TeV band is significantly variable whereas other wave-bands do not show significant variability. We have estimated various amplitude parameters in order to further quantify the variability present in the multi-wavelength light curves of Mrk 421 during the period December 25-31, 2014. We find that the TeV light curve exhibits relatively high values of variability parameters and implies strong variability during the above period. However, the highest value of is obtained for hard X-rays which implies that the maximum flux is approximately three times the minimum flux in the light curve. But the large fluctuations in the individual flux measurements reduce its intrinsic varability with large error bar. The daily HE - ray photon spectral indices also do not show any significant change during this period. The overall behaviour of the intrinsic fractional varaiability is found to be consistent with the general trend of high synchrotron peaked blazars where variability amplitude increases with energy [70] and highest variability with F0.52 occurs in TeV flux points measured with the TACTIC. This also indicates that the VHE emission originates from a very compact region in the jet and it can be attributed to the change in electron injection or turbulance in the jet [71]. The lower values of variability amplitudes for optical and Fermi-LAT observations can be attributed to the fact that variability amplitude is higher at frequencies beyond the synchrotron and inverse Compton peaks in blazar SED. Also, in high synchrotron peaked blazars like Mrk 421 the optical emission lines are weak and therefore the synchrotron photons at X-ray energies are the dominant targets for the inverse Compton scattering to produce the TeV –rays. Therefore, correlated variability at X-ray and TeV energies is expected from the single zone leptonic SSC model. The temporal analysis of TeV light curve gives a conservative estimate of the minimum variability timescale of 0.69 days in the source frame. However, the minimum variability timescale estimated from the analysis of near simultaneous multi-wavelength light curves with flaring activities will give the strongest possible upper-limit on the size of the active region in the jet taking into account the light travel time effects. The data statistics available during this period is not sufficient to perform such detailed temporal analysis of the emission from the source.
The one day broad-band spectral energy distribution of the source using near simultaneous observations on December 28, 2014 can be broadly reproduced by simple one zone leptonic SSC model. The model parameters estimated from the best fitting of the SED are found to be in agreement with the values recently reported in the literature for Mrk 421 [72,11,16]. The difference between the electron spectral indices and is more than the expected value for the pure radiative/synchrotron cooling break in the electron spectrum. This can be attributed to the energy dependent acceleration and escape timescales [73,74] which have not been explicitly modelled in the present work. The kinetic energy or power of the jet is estimated from the derived model parameters by assuming that the hadrons in the emission region are cold and do not contribute in the radiative process. Under this approximation, the kinetic power of the jet in the source frame is given by [75]
| (13) |
where , are are comoving energy densities corresponding to leptons, magnetic field and cold protons respectively. Using the best fit model parameters given in Table 3, the jet power is estimated to be 7.441044 erg s-1 which is consistent with the value generally assumed for blazars. The model parameters derived in this work represent one of the probable parameter set for Mrk 421, however they may considerably differ from the values estimated using the multi-zone emission models [17] and because of their inherent degeneracy. The fact that strictly simultaneous multi-wavelength observations are not available during the TeV flaring activity of Mrk 421 detected with the TACTIC telescope on the night of December 28, 2014, it is difficult to provide any firm conclusion about the emission processes involved in the source. However, given that Mrk 421 is known to exhibit frequent flaring activities in all energy bands from radio to TeV with short variability timescales, future contemporaneous multi-wavelength observations of short duration flaring activities will help in constraining the parameter space in a relatively better way.
Acknowledgment
We thank the anonymous referee for his/her valuable comments which have significantly improved the contents of the manuscript. Authors are thankful to MIRO, PRL, Mt. Abu for providing the facility to realuminise the TACTIC mirror facets. We acknowledge the use of public data obtained through Fermi Science Support Center (FSSC) provided by NASA and Swift/BAT transient monitor results provided by the Swift/BAT team. Data from the Steward Observatory spectropolarimetric monitoring project were used. This program is supported by Fermi Guest Investigator grants NNX08AW56G, NNX09AU10G, NNX12AO93G, and NNX15AU81G. We would also like to thank our colleague Dr. Sunder Sahayanathan for useful discussions and suggestions.
References
- [1] M. H. Ulrich et al., 1975, ApJ, 198, 261
- [2] A. A. Abdo et al., 2010, ApJ, 716, 30
- [3] Y. C. Lin et al., 1992, ApJL, 401, L61
- [4] M. Punch et al., 1992, Nature, 358, 477
- [5] A. D. Kerrick et al., 1995, ApJL, 438, 59
- [6] J. A. Gaidos et al., 1996, Nature, 383, 319
- [7] F. Krennrich et al., 2002, ApJL, 575, 9
- [8] M. Błażejowski et al., 2005, ApJ, 630, 130
- [9] J. Albert et al., 2007, ApJ, 663, 125
- [10] G. G. Litchi et al., 2008, A&A, 486, 721
- [11] V. A. Acciari et al., 2011, ApJ, 738, 25
- [12] I. Donnarumma et al., 2009, ApJL, 691, 13
- [13] G. Aielli et al., 2010, ApJL, 714, 208
- [14] L. Fortson, VERITAS Collaboration, 2012, AIP Conf. Proc., 1505, 514
- [15] M. Tluczykont, HESS Collaboration, 2011, arXiv:1106.1035
- [16] K. K. Singh et al., 2015, Astrop. Phys., 61, 32
- [17] A. Shukla et al., 2012, A&A, 541, 140
- [18] B. Bartoli et al., 2016, ApJS, 222, 6
- [19] N. Isobe et al., 2010, PASJ, 62, 55
- [20] K. K. Singh et al., 2012, New Astron., 17, 679
- [21] T. Takahashi et al., 1996, ApJL, 470, 89
- [22] L. Maraschi et al., 1999, ApJL, 526, 81
- [23] G. Fossati et al., 2000, ApJ, 541, 166
- [24] W. Brinkmann et al., 2001, A&A, 365, 162
- [25] K. K. Yadav et al., 2007, Astrop. Phys., 27, 447
- [26] P. Chandra et al., 2010, J. Phys. G, 37, 125201
- [27] A. A. Abdo et al., 2011, ApJ, 736, 131
- [28] P. Chandra et al., 2012, J. Phys. G, 39, 045201
- [29] A. Sinha et al., 2016, A&A, 591, 83
- [30] B. Ghosal et al., 2017, Astrop. Phys., 87, 55
- [31] M. Tluczykont et al., 2010, A&A, 524, 48
- [32] J. H. Buckley et al., 1996, ApJL, 472, 9
- [33] G. Fossati et al., 2008, ApJ, 677, 906
- [34] P. F. Rebillot et al., 2006, ApJ, 641, 740
- [35] J. Aleksić et al., 2015, A&A, 576, 126
- [36] X. Chen et al., 2011, MNRAS, 416, 2368
- [37] A. Mastichiadis et al., 2013, MNRAS, 434, 2684
- [38] K. K. Singh et al., 2017, New Astron., 54, 24
- [39] L. Maraschi et al., 1992, ApJL, 397, 5
- [40] S. D. Bloom, & A. P. Marscher, 1996, ApJ, 630, 130
- [41] M. Böttcher, 2007, ApSS, 309, 95
- [42] C. D. Dermer, & R. Schlickeiser, 1993, ApJ, 416, 458
- [43] M. Sikora et al., 1994, ApJ, 421, 153
- [44] F. A. Aharonian, 2000, New Astron., 5, 337
- [45] A. Möucke et al., 2003, Astrop. Phys., 18, 593
- [46] K. Mannheim et al., 1993, A&A, 269, 67
- [47] A. Möucke et al., 2000, Astrop. Phys., 15, 121
- [48] R. Koul et al., 2007, NIM A, 578, 548
- [49] A. M. Hillas, 1985, ICRC, 3, 445
- [50] A. M. Hillas, 1998, ApJ, 503, 744
- [51] V. K. Dhar et al., 2009, NIM A, 606, 795
- [52] P. Chandra et al., 2017, New Astron., 54, 42
- [53] K. K. Singh et al., 2015, New Astron., 36, 1
- [54] W. B. Atwood et al., 2009, ApJ, 697, 1071
- [55] F. Acero et al., 2015, ApJS, 218, 23
- [56] J. R. Mattox et al., 1996, ApJ, 461, 396
- [57] S. D. Barthelmy et al., 2005, SSRv, 120, 143
- [58] H. A. Krimm et al., 2013, ApJSS, 209, 14
- [59] P. S. Smith et al., 2009, arXiv:0912.3621
- [60] T. P. Li, & Y. Q. Ma, 1983, ApJ, 272, 317
- [61] A. Domínguez et al., 2011, MNRAS, 410, 2556
- [62] A. Albert et al., 2017, ApJ, 843, 116
- [63] A. Albert et al., 2017, ApJ, 841, 100
- [64] S. Vaughan et al., 2003, MNRAS, 345, 1271
- [65] J. Heidt, & S. J. Wagner, 1996, A&A, 305, 42
- [66] Y. Y. Kovalev et al., 2005, AJ, 130, 2473
- [67] G. Calderone et al., 2011, MNRAS, 413, 2365
- [68] S. Sahayanathan, & S. Godambe, 2012, MNRAS, 419, 1660
- [69] M. C. Begelman et al., 1984, Rev. Mod. Phys., 42, 237
- [70] Y. H. Zhang et al., 2005, ApJ, 629, 686
- [71] E. S. Howard et al., 2004, AJ, 127, 17
- [72] E. Pian et al., 2014, A&A, 570, 77
- [73] S. Sahayanathan, 2008, MNRAS, 388, L49
- [74] K. K. Singh et al., 2014, New Astron., 27, 34
- [75] A. Celloti et al., 1997, MNRAS, 286, 415