Adhesion-induced Discontinuous Transitions
and Classifying Social Networks
Abstract
Transition points mark qualitative changes in the macroscopic properties of large complex systems. Explosive transitions, exhibiting properties of both continuous and discontinuous phase transitions, have recently been uncovered in network growth processes. Real networks not only grow but often also restructure, yet common network restructuring processes, such as small world rewiring, do not exhibit phase transitions. Here, we uncover a class of intrinsically discontinuous transitions emerging in network restructuring processes controlled by adhesion – the preference of a chosen link to remain connected to its end node. Deriving a master equation for the temporal network evolution and working out an analytic solution, we identify genuinely discontinuous transitions in non-growing networks, separating qualitatively distinct phases with monotonic and with peaked degree distributions. Intriguingly, our analysis of heuristic data indicates a separation between the same two forms of degree distributions distinguishing abstract from face-to-face social networks.
Phase transitions mark qualitative changes in the collective behavior of large complex systems by separating regimes of distinct collective states. The change of the global system state is induced by a control parameter passing a critical value. Common examples include the liquid-gas transition, where the fluid density drops discontinuously upon smoothly decreasing the pressure and the transition between magnetic and non-magnetic states in ferromagnetic solids with increasing temperature.
Recent studies have revealed new forms of ‘explosive’ transitions in the macroscopic structure of networks Achlioptas2009 ; Bohman2009 ; Stauffer1994a ; Cohen2010 . The network ensembles in these examples originate from a growth process, where links are added sequentially. While initially deemed discontinuous, these transitions have since been shown to be more subtle Nagler2011 ; Ziff2009 ; Schroder2013 ; Boccaletti2016 ; Fronczak . Despite strong analogies to finite size and super-critical properties of discontinuous phase transitions Nagler2011 ; DSouza2015 they are in fact continuous Riordan2011 ; DaCosta2010 . Some notable exceptions have been found under specific conditions, for instance for two-layer networks, globally optimized link selection or inhomogeneous node preferences Chen2015 ; DSouza2014 ; bassler2015extreme . Studies of models of non-growing networks with implicitly degree-dependent rewiring lindquist2009network found different types of degree distributions. The question about existence and type of phase transitions has not been addressed. At the same time, a range of processes that restructure rather than grow the system are known to not exhibit phase transitions but instead show a gradual crossover between the different network structures Watts1998 ; grosskinsky2002universal ; grabow2012small ; watts1999small ; newman2000mean ; Molkenthin2016a . Under which conditions phase transitions may possibly emerge in non-growing systems and whether they could be discontinuous thus remains unknown to date.
Here, we study a class of network restructuring processes with explicit adhesion preference of a link to stay connected to its end nodes. The resulting networks exhibit a genuine discontinuous phase transition in their macroscopic structure as an adhesion parameter changes. A degree-dependent asymmetry of the node-link adhesion induces a transition between classes of networks with qualitatively different degree distributions, one monotonically decaying with degree, the other peaked. Intriguingly, the two classes consistently distinguish abstract (e.g. online) from face-to-face (e.g. offline) social networks as we confirm by comparing analytical and simulational results of our theory with structural network data for empirical systems.
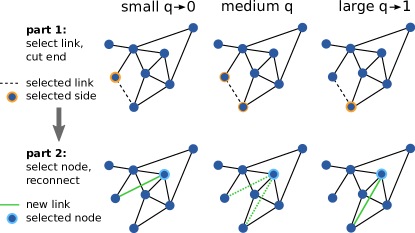
Degree-dependent network restructuring. Consider a basic restructuring process of a non-growing temporal network of nodes and links, starting from an arbitrary interaction topology. In each time step of restructuring (Fig. 1), a link in the network is chosen at random from the uniform distribution among all links. One of the two end nodes of that link is cut (‘given up’ by the unit it connected to), with probability choosing the lower-degree node and with probability the higher-degree node. The cut end of the link reconnects to a different unit of some degree , randomly chosen with a probability distribution proportional to .
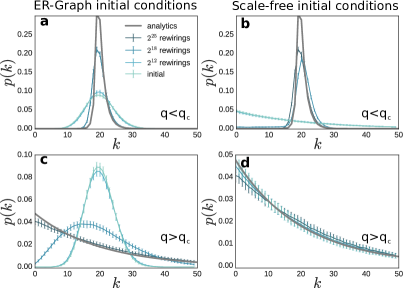
The resulting time evolution defines a stochastic ensemble of temporal networks. After sufficiently long times, we consistently observe convergence to a network ensemble dependent only on (unique attractor). Indeed, the degree distributions become stationary and independent of the initial network structure (Fig. 2). For low the stationary distribution is peaked, for higher it is decaying. Below, we evaluate the order parameter
| (1) |
given by the normalized mode (position of the maximum) of the stationary degree distribution and show that the system exhibits a well-defined phase transition in the thermodynamic limit where and thus .
To qualitatively understand how the transition emerges and how it depends on adhesion and network topology, we derive and analyze a master equation characterizing the degree distribution of the evolving network ensemble. Consider the possible degree changes at a given time step . The one end node that sticks at the randomly chosen link does not change its degree, whereas the other end node reduces its degree by one. Subsequently, the node that the link rewires to increases its degree by one. As a consequence, the degree distribution of the temporal network process satisfies the discrete-time master equation
| (2) |
The unwiring probability represents the probability of decreasing the degree of one of the nodes with degree by rewiring away from it and the linking probability the probability of increasing the degree of a node with degree by rewiring to it.
As the temporal network evolution is a Markov chain that is irreducible, i.e. every network in the ensemble can be reached with positive probability, the stationary degree distribution is unique and given as solution of Eq. 2 with . We rewrite Eq. 2 at the fixed point as a matrix equation
| (3) |
where is a vector with entries and a matrix with entries based on and . Adding to each row of the matrix the previous row and dividing by simplifies Eq. 3 to
| (4) |
Since the last row of is identically zero, does not have full rank and there exists a stationary solution for , given by the eigenvector to the eigenvalue zero as
| (5) |
We fix arbitrarily and then normalize by for all k such that to obtain the exact stationary degree distribution.
Asymmetric adhesion induces discontinuous transitions. To calculate the peak position of the degree distribution, we first consider the unlinking and linking probabilities and . Since links are selected uniformly at random, the probability of a link with an end node of degree being selected is , where is the number of links in the network. That node is chosen to be cut from the link with probability if is smaller than the degree of the other end node of the link and with probability if it is larger than that degree. For uncorrelated degrees of the two end nodes we obtain the approximation
| (6) |
where , and are the probabilities that a node neighbouring a degree node has itself a degree larger than, equal to, or smaller than . Numerical results suggest that for networks where is substantially smaller than the node degrees are indeed sufficiently weakly correlated in the stationary state for .
The cut link rewires following preferential attachment Barabasi1999 and rewires to a new node with probability proportional to . The offset of prevents a node from being removed if its degree falls to zero. So the (linking) probability of reconnecting to a node of degree is
| (7) |
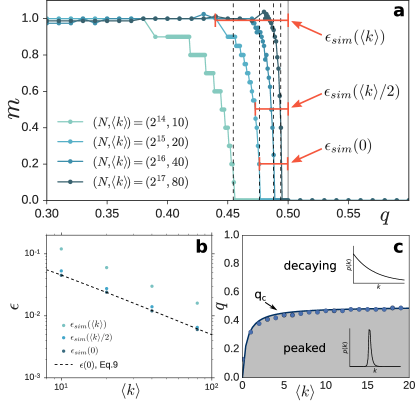
To understand how the peak position changes, we calculate the values of where the maximum of the degree distribution changes from to in the steady state ensemble. We then demonstrate that for all in the limit as and thus such that the order parameter discontinuously jumps at that value of . Fig. 3 displays finite system results and illustrates the scaling as and grow. For finite systems, the point is defined by the condition that the two consecutive probabilities become equal, .
Using and writing the probabilities and , where , Eqs. (5 - 7) yield the equation
| (8) |
for . For the right-hand-side is larger than one for all finite . We thus consider the deviation
| (9) |
such that (8) results in
| (10) |
This provides strong evidence for a discontinuous phase transition, because in the limit we have for all as long as . We make additional progress by noting that changes sign at the median of the distribution. For the typical (though not universal) ordering of the mode , median and mean of a unimodal distribution with positive skewness groeneveld1977mode ; abadir2005mean , , we thus find that indeed and , consistent with the transitions observed in the simulations of finite systems (Fig. 3a). As a result, the peak position changes discontinuously from to at in the limit of and thus .
For we specifically have and and consequently such that we obtain the exact expression
| (11) |
Direct numerical simulations show that the same scaling holds for across values of , compare Fig. 3b
The approximate scaling form (10), the exact result (11) and the numerical analysis summarized in Fig. 3 jointly indicate a discontinuous phase transition at in the limit , and thus . We emphasize that the order parameter changes abruptly from for all to for as the adhesion parameter continuously varies across it’s critical value from below.
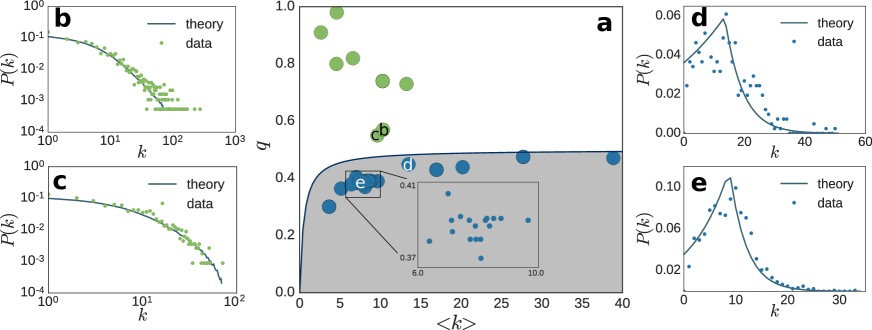
Transition line separates abstract from personal social networks. Interestingly, a wide range of social networks exhibit one of these two specific types of degree distributions – decaying or peaked – theoretically identified above. Moreover, the theoretical transition line exactly separates the collection of networks into those with close personal contacts and those created through more abstract, indirect or online-only interactions, compare Fig. 4:
We have compared the degree distributions resulting from the simple model to those obtained from 33 social networks, as reported in references Kunegis2013 and starbuck ; konect:boguna ; konect:dolphins ; konect:coleman1957 ; konect:ucidata-zachary ; konect:arenas-jazz ; konect:freeman1998 ; konect:knuth1993 ; konect:boguna ; DBLP:Massa . The systems range from networks of direct personal interactions with face-to-face contacts in various private and educational contexts or reported friendships of humans and of dolphins, to more abstract social interactions, including online social networks as well as offline, but hierarchically determined social relations (see supplemental material for more details). The average degree was computed from each data set thus leaving as the only free parameter. A least-squares fit to each degree distribution yields the best-suitable for each network. Intriguingly this even led to good quantitative agreement of the degree distributions (see Fig. 4 b-e, see also supplemental material).
We were amazed to observe that all networks in which personal, typically face-to-face relationships define links exhibit a peaked degree distribution, whereas all networks in which abstract, i.e. online relationships define links, exhibit decaying degree distributions, see Fig. 4. Indeed, a permutation test assigning the labels ’abstract’ and ’personal’ to the degree distributions randomly yields the same classification only in one out of cases.
Discussion and Conclusions. Studies of network structure forming processes have previously uncovered explosive transitions in a range of network growth processes DSouza2015 whereas most restructuring processes for fixed size networks exhibit gradual cross-overs between random and regular graphs with no distinct transition. Notably, the rewiring mechanisms in the latter types of processes are independent of any properties of the nodes or links Watts1998 ; grosskinsky2002universal ; grabow2012small ; watts1999small ; newman2000mean ; Molkenthin2016a .
Here, we revealed a discontinuous phase transition in network structural features in a simple model class of temporal networks that do not grow but exhibit degree-dependent link adhesion. As the underlying microscopic mechanisms rely on a simple local cutting and rewiring process, they imply self-organization of the networks’ large-scale structures. Driven by the tendency of a link to stick to a node (adhesion) depending on that node’s degree, a discontinuous phase transition emerges between two types of degree distributions – peaked and decaying – when smoothly varying this tendency via a control parameter.
Intriguingly, the same two types of degree distributions are observed for a wide range of social networks. Moreover, among the 33 topologies of social networks analyzed, all those networks established through personal contacts exhibit peaked and all those with more abstract, indirect or impersonal contacts exhibit decaying degree distributions. The results thus suggest that the simple, abstract model, that is a priori unrelated to specific and widely heterogeneous social dynamics, surprisingly serves as a good indicator for the separation between networks with more personal and more abstract social relations.
Several general constraints as well as social mechanisms might be supporting this binary classification. The primary mechanisms underlying the model restructuring process are based on the model ingredient that sustaining a link is node-dependent. From the perspective of a node in a socio-economic setting, such as trade or friendships, this may be interpreted as the bilateral effort (e.g., time, money or motivation) to keep a connection. Such constraints on the number of sustainable links may lead a node to cut ties with less beneficial connections (i.e. a less involved friend or a less influential business partner), similar to our model settings that otherwise are far from fully capturing the intricacies across social networks.
Taken together, the results presented above not only highlight severe theoretical consequences of link adhesion – inducing a discontinuous transition for restructuring networks in the first place – and yield novel insights into structural phase transitions in temporally evolving networks HOLME201297 ; PhysRevLett.110.198701 ; scholtes2014causality . They may also serve as a starting point for future investigations about the mechanisms and the influence of constraints in evolving socio-economic systems.
Acknowledgements. We thank Stefan Grosskinsky, Yael Fender, Frank Schweitzer, Alex Arenas and Johanna Wolter for valuable comments on presentations about this work. This work is supported through the German Science Foundation (DFG) by a grant towards the Cluster of Excellence ‘Center for Advancing Electronics Dresden’ (cfaed).
References
- [1] D. Achlioptas, R. M. D’Souza, and J. Spencer. Explosive Percolation in Random Networks. Science, 358(3186):2000–2002, 2009.
- [2] T. Bohman. Emergence of Connectivity in Networks. Science, 323(5920):1438–1439, 2009.
- [3] D. Stauffer and A. Aharony. Introduction to Percolation Theory. Taylor & Francis, London, 1994.
- [4] R. Cohen and S. Havlin. Complex Networks - Structure, Robustness and Function. Cambridge University Press, 2010.
- [5] J. Nagler, A. Levina, and M. Timme. Impact of single links in competitive percolation. Nature Physics, 7(3):265–270, 2011.
- [6] R. M. Ziff. Explosive growth in biased dynamic percolation on two-dimensional regular lattice networks. Physical Review Letters, 103(4), 2009.
- [7] M. Schröder, S. H. Ebrahimnazhad-Rahbari, and J. Nagler. Crackling noise in fractional percolation. Nature Communications, 4:2222, 2013.
- [8] S. Boccaletti, J.A. Almendral, S. Guan, I. Leyva, Z. Liu, I. Sendiña-Nadal, Z. Wang, and Y. Zou. Explosive transitions in complex networks’ structure and dynamics: Percolation and synchronization. Physics Reports, 660:1 – 94, 2016.
- [9] A. Fronczak and P. Fronczak. Mixed-order phase transition in a minimal, diffusion-based spin model. Physical Review E, 94:012103, 2016.
- [10] R. M. D’Souza and J. Nagler. Anomalous critical and supercritical phenomena in explosive percolation. Nature Physics, 11(July):531–538, 2015.
- [11] O. Riordan and L. Warnke. Explosive percolation is continuous. Science, 333(6040):322–324, 2011.
- [12] R. A. Da Costa, S. N. Dorogovtsev, A. V. Goltsev, and J. F. F. Mendes. Explosive percolation transition is actually continuous. Physical Review Letters, 105(25), 2010.
- [13] W. Chen, Z. Zheng, X. Jiang, and R. M D’Souza. Multiple discontinuous percolation transitions on scale-free networks. Journal of Statistical Mechanics, 2015(4):P04011, 2015.
- [14] R. M. D’Souza and A. Waagen. Given enough choice, simple local rules percolate discontinuously. European Physics Journal B, 87(12):304, 2014.
- [15] K. E. Bassler, W. Liu, B. Schmittmann, and R. K. P. Zia. Extreme Thouless effect in a minimal model of dynamic social networks. Physical Review E, 91(4):042102, 2015.
- [16] J. Lindquist, J. Ma, P. Van den Driessche, and F. H. Willeboordse. Network evolution by different rewiring schemes. Physica D: Nonlinear Phenomena, 238(4):370–378, 2009.
- [17] D. J. Watts and S. H. Strogatz. Collective dynamics of ’small-world’ networks. Nature, 393(6684):440–442, 1998.
- [18] S. Großkinsky, M. Timme, and B. Naundorf. Universal attractors of reversible aggregate-reorganization processes. Physical Review Letters, 88(24):245501, 2002.
- [19] C. Grabow, S. Grosskinsky, and M. Timme. Small-world network spectra in mean-field theory. Physical Review Letters, 108(21):218701, 2012.
- [20] D. J. Watts. Small worlds: the dynamics of networks between order and randomness. Princeton University Press, 2003.
- [21] M. E. J. Newman, C. Moore, and D. J. Watts. Mean-field solution of the small-world network model. Physical Review Letters, 84(14):3201, 2000.
- [22] N. Molkenthin and M. Timme. Scaling Laws in Spatial Network Formation. Physical Review Letters, 168301(October):1–5, 2016.
- [23] A. Barabási and R. Albert. Emergence of scaling in random networks. Science, 286(5439):509–512, 1999.
- [24] J. Kunegis. KONECT - The Koblenz Network Collection, . In Web Observatory Workshop, pages 1343–1350, 2013.
- [25] Hamsterster friendships network dataset – KONECT, http://konect.uni-koblenz.de/networks/petster-friendships-hamster, 2016.
- [26] R. Guimerà, L. Danon, A. Díaz-Guilera, F. Giralt, and A. Arenas. Self-similar community structure in a network of human interactions. Physical Review E, 68(6):065103, 2003.
- [27] L. Isella, J. Stehlé, A. Barrat, C. Cattuto, J. Pinton, and W. Van den Broeck. What’s in a crowd? Analysis of face-to-face behavioral networks. Journal of Theoretical Biology, 271(1):166–180, 2011.
- [28] J. Moody. Peer influence groups: Identifying dense clusters in large networks. Social Networks, 23(4):261–283, 2001.
- [29] R. A. Groeneveld and G. Meeden. The mode, median, and mean inequality. The American Statistician, 31(3):120–121, 1977.
- [30] K. M. Abadir. The mean-median-mode inequality: counterexamples. Econometric Theory, 21(2):477–482, 2005.
- [31] W. H. Starbuck. The collegial phenomenon: The social mechanisms of cooperation among peers in a corporate law partnership by Emmanuel Lazega. American Journal of Sociology, 109(1):226–228, 2003.
- [32] M. Boguñá, R. Pastor-Satorras, A. Díaz-Guilera, and A. Arenas. Models of social networks based on social distance attachment. Physical Review E, 70(5):056122, 2004.
- [33] D. Lusseau, K. Schneider, O. J. Boisseau, P. Haase, E. Slooten, and S. M. Dawson. The bottlenose dolphin community of Doubtful Sound features a large proportion of long-lasting associations. Behavioral Ecology and Sociobiology, 54:396–405, 2003.
- [34] J. Coleman, E. Katz, and H. Menzel. The diffusion of an innovation among physicians. Sociometry, pages 253–270, 1957.
- [35] W. Zachary. An information flow model for conflict and fission in small groups. Journal of Anthropological Research, 33:452–473, 1977.
- [36] P. M. Gleiser and L. Danon. Community structure in jazz. Advances in Complex Systems, 6(4):565–573, 2003.
- [37] L. C. Freeman, C. M. Webster, and D. M. Kirke. Exploring social structure using dynamic three-dimensional color images. Social Networks, 20(2):109–118, 1998.
- [38] D. E. Knuth. The Stanford GraphBase: A Platform for Combinatorial Computing, volume 37. Addison-Wesley, Reading, 1993.
- [39] P. Massa, M. Salvetti, and D. Tomasoni. Bowling alone and trust decline in social network sites. In Eighth IEEE International Conference on Dependable, Autonomic and Secure Computing, DASC 2009, Chengdu, China, 12-14 December, 2009, pages 658–663, 2009.
- [40] P. Holme and J. Saramäki. Temporal networks. Physics Reports, 519(3):97 – 125, 2012.
- [41] R. Pfitzner, I. Scholtes, A. Garas, C. J. Tessone, and F. Schweitzer. Betweenness preference: Quantifying correlations in the topological dynamics of temporal networks. Physical Review Letters, 110:198701, 2013.
- [42] I. Scholtes, N. Wider, R. Pfitzner, A. Garas, C. J. Tessone, and F. Schweitzer. Causality-driven slow-down and speed-up of diffusion in non-markovian temporal networks. Nature Communications, 5:5024, 2014.