Definition of a scoring parameter to identify low-dimensional materials components.
Abstract
The last decade has seen intense research in materials with reduced dimensionality. The low dimensionality leads to interesting electronic behavior due to electronic confinement and reduced screening. The investigations have to a large extent focused on 2D materials both in their bulk form, as individual layers a few atoms thick, and through stacking of 2D layers into heterostructures. The identification of low-dimensional compounds is therefore of key interest. Here, we perform a geometric analysis of material structures, demonstrating a strong clustering of materials depending on their dimensionalities. Based on the geometric analysis, we propose a simple scoring parameter to identify materials of a particular dimension or of mixed dimensionality. The method identifies spatially connected components of the materials and gives a measure of the degree of “1D-ness,” “2D-ness,” etc., for each component. The scoring parameter is applied to the Inorganic Crystal Structure Database and the Crystallography Open Database ranking the materials according to their degree of dimensionality. In the case of 2D materials the scoring parameter is seen to clearly separate 2D from non-2D materials and the parameter correlates well with the bonding strength in the layered materials. About 3000 materials are identified as one-dimensional, while more than 9000 are mixed-dimensionality materials containing a molecular (0D) component. The charge states of the components in selected highly ranked materials are investigated using density functional theory and Bader analysis showing that the spatially separated components have either zero charge, corresponding to weak interactions, or integer charge, indicating ionic bonding.
pacs:
I Introduction
Low-dimensional materials with one or more characteristic lengths of the materials limited to the atomic scale have received significant attention recently. Since the discovery of graphene the world has seen intense research in 2D materials involving synthesis and investigation of mechanical, electronic, magnetic, and catalytic properties of new materials Novoselov et al. (2004); Bhimanapati et al. (2015); Ferrari et al. (2015); Zeng et al. (2018). Also a number of computational efforts have been dedicated to the identification of new 2D materials and to the construction of computational databases with information about their stability and (photo-) electronic properties Mounet et al. (2018); Ashton et al. (2017); Haastrup et al. (2018). One of the driving forces behind this research has been an interest in ultra-small electronic components and this has also led to studies of 1D or quasi-1D materials as possible interconnects Stolyarov et al. (2016); Geremew et al. (2018). Furthermore, the possibility of combining materials of different dimensionality into new van der Waals bonded mixed-dimensional heterostructures has recently been discussed Jariwala et al. (2017). The realization of such structures relies on the identification of appropriate weakly interacting material components of different dimensionalities.
In the following we shall define a simple geometrical scoring parameter to identify low-dimensional components in existing materials. The scoring parameter is easy to compute and can be applied to large materials databases. We illustrate this by mining the Inorganic Crystal Structure Database Bergerhoff et al. (1983) (ICSD) and the Crystallography Open Database Gražulis et al. (2012) (COD) to find materials with clearly identifiable low-dimensional atomic structures. The identified materials consist of weakly interacting components as we demonstrate for 2D materials by comparison with previously calculated exfoliation energies. Apart from being interesting in their own right, the materials components may also form templates for substitution of similar chemical elements to form new materials of different dimensions Mounet et al. (2018); Haastrup et al. (2018).
II Results and discussion
II.1 Bond-length interval analysis
The definition of the scoring parameter requires first, that we can identify the dimension(s) of a periodic solid. Given an atom in a bonded cluster, the cluster dimension is given by the rank of the subspace spanned by the atom and its periodically connected neighbors. We refer to this method as the rank determination algorithm (RDA), which is described in detail in the Methods section.
(a)

(b)
Boron Nitride (BN)

k
\ch((CH3)2 NH2)2 (Al2H(PO4)3)

k
Legend:
 0D
0D
 02D
02D
 2D
2D
 3D
3D
An accurate identification of bonded clusters requires a full electronic structure calculation, where the bond strength and character can be addressed. However, for purposes of screening large materials databases this approach is computationally infeasible. Instead, we use a simple geometric criterion for bonding. We describe two atoms, and , as bonded if the distance between them is less than a specified multiple of their covalent radius sum:
| (1) |
Here, is the distance between atoms and , and are the corresponding covalent radii Cordero et al. (2008), and is a variable to be investigated. The latter choice is motivated by the strong dependence of the classification of the dimensionality of a material upon the value; as illustrated for the boron-nitride structure in Fig. 1(a), too small a value will underestimate the dimensionality, whereas too large a value will overestimate it. Rather than attempt to identify a good value of , we observe that, for any given structure, there exists a finite number of relevant intervals to investigate.
We start by considering the set of interatomic distances in a material, sorted by increasing value [where ]. Each interatomic distance corresponds to a possible bond; as shown in Fig. 1(a), bonds can be physical or not. Bonds are inserted one at a time, and at each step the RDA is used to determine the number of components and their dimensionality. Initially, every atom is a separate 0D component; as more bonds are inserted, the number of components decreases and the component dimensionalities increase. The process terminates when a single 3D component is left; i.e., all atoms are contained in the same bonded cluster. This process finds all value intervals in which the dimensionality classification is constant, of which there are a finite number. The interval identification method is described in more detail in the Methods section.
Fig. 1(b) shows the application of this method to two different layered structures. It can be seen that different dimensionality classifications exist at different values. Furthermore, the intervals have very different widths; the first interval is of the form , whereas the last interval is of the form .
(a)
(b)
(c)

(d)

0D
 1D
1D
 2D
2D
 3D
3D
II.2 Defining the scoring parameter
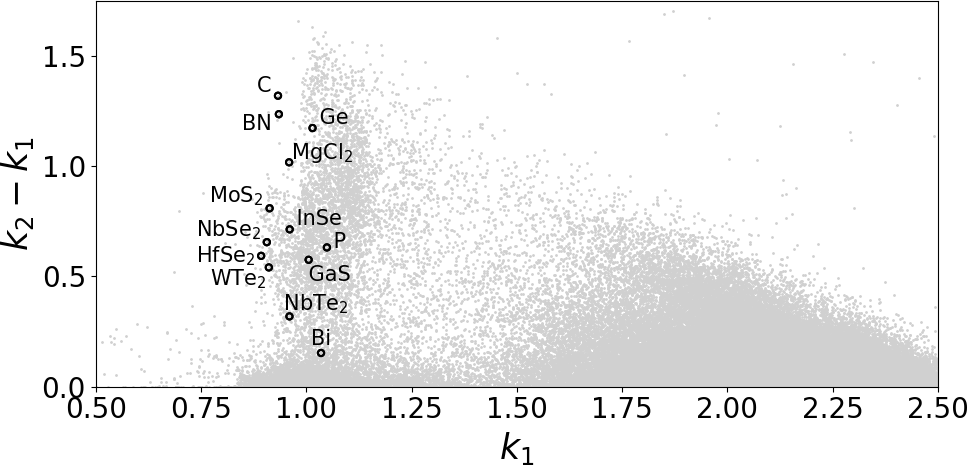
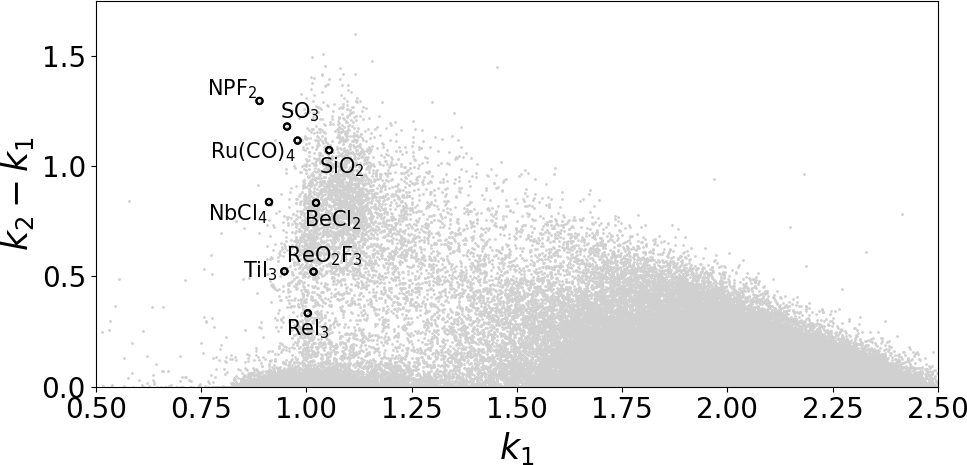
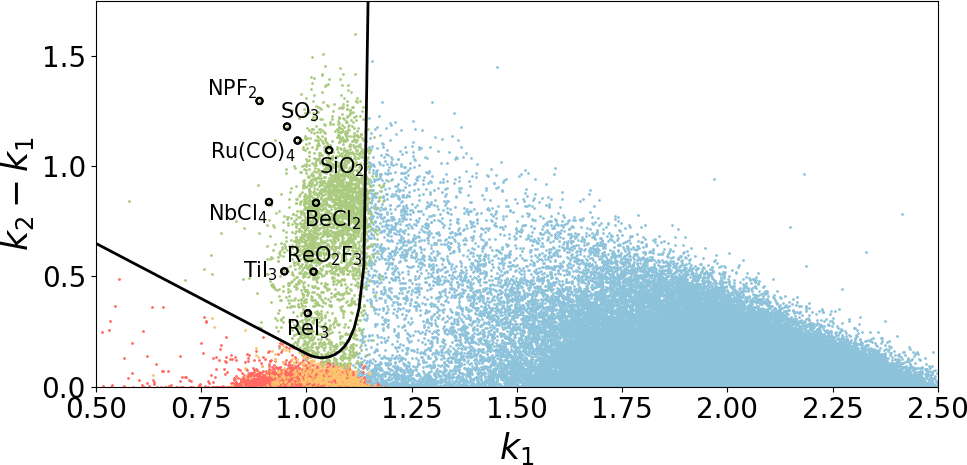
Figs. 2(a) and 2(b) show the intervals for all structures in the ICSD and COD with, respectively, a 2D interval and a 1D interval. In both cases there is a visible cluster of structures in the approximate region and . The position of the cluster is intuitive from a bonding perspective. First, if the bonding model and covalent radii exactly described the actual bond lengths, the cluster would lie on the line ; the variability in the interval starting points results from the simplicity of the ball-and-stick bonding model. Second, since low-dimensional components are geometrically separated, we should expect a correspondingly wide interval; it can be seen that easily exfoliable structures such as graphite, boron nitride, and molybdenum disulfide have wide intervals.
We propose a scoring parameter which distills the above observations of the interval plots into a single number:
| (2) |
where
| (3) |
Here, is a constant which determines the scale at which a bond is broken. We use , which is chosen so that ; slightly different values of the parameter will give similar results. Fig. 3 illustrates how a interval is transformed into a score.
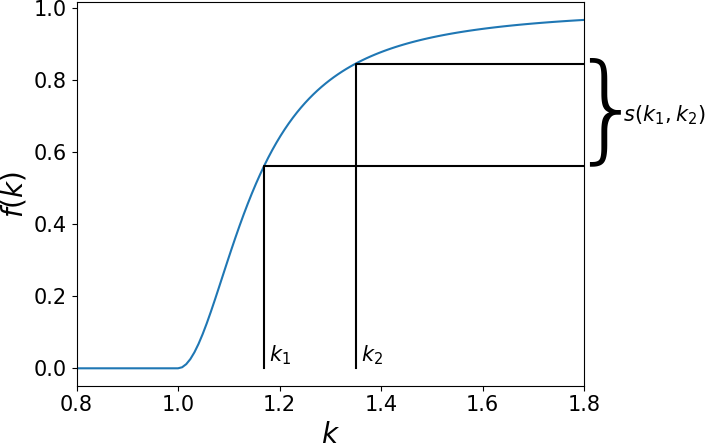
The interval width increases the score, but with diminishing returns as increases above 1. This avoids the interval dominating unless is close to 1, in which case the structure is indeed 3D. Furthermore, values below 1 are effectively set to 1; this avoids erroneous low-dimensional classifications when . In structures with low-dimensional components, the scoring parameter rewards large intercomponent distances. A further convenient property of the scoring scheme is that the interval scores sum to 1. We have found that the best results are achieved by merging intervals with the same types of dimensionalities [e.g. intervals of the same color in Fig. 1(b)].
The principal motivation of the scoring scheme is to identify the intuitively correct dimensionality classification, by determining whether a interval lies within a cluster of the type shown in Figs. 2(a) and 2(b). Using the scoring parameter, the structures are colored in Figs. 2(c) and 2(d) according to their dimensionality classification.
| COD 2300448 | COD 9011286 | COD 411179 |
 |
 |
 |
| \chAl2O3 | \chAuTe2 | \chTi2Cl2N2 |
| 0.12 | 0.47 | 0.97 |
| 0.88 | 0.52 | 0.03 |
The scoring scheme is demonstrated for three structures in Fig. 4. The first material, \chAl2O3, is clearly a bulk crystalline structure. If a single value threshold at were used, however, it would result in a misclassification as a layered structure. Similarly, the scoring scheme also ensures that the \chTi2Cl2N2 structure is correctly identified as a layered structure. The \chAuTe2 has an ambiguous classification, lying close to the contour . In this case the dimensionality classification is sensitive to small changes in the functional form or the parameters of the scoring function. Then, the useful information contained in the scores is not in their exact values, but rather that and are approximately equal in value; this can be interpreted as a layered structure with a very small interlayer spacing.
It should be emphasized that the scoring is exclusively based on interatomic distances and atomic sizes, and that it simply assumes that longer bonds tend to be weaker than shorter ones. The physical characters of the bonds, i.e. whether they can be considered covalent, ionic or of dispersion type, are not revealed. Nonetheless, the coarse treatment of bond lengths is justified by the cluster separation in Fig. 2. We will show that the scoring scheme allows for identification of interesting materials, whose properties can then be investigated experimentally or using electronic structure methods.
The scaled bonding criterion described in Equation 1 is the same one employed by Ashton et al. Ashton et al. (2017) in their study of layered materials. An additive bonding criterion of the form is used by Mounet et al.Mounet et al. (2018) and Cheon et al. Cheon et al. (2017), using van-der-Waals radii and elemental radii respectively. In these works, the material dimension is determined by sampling a range of parameter values (either or ) in a fixed interval, which does not easily permit the construction of a scoring parameter. Cluster dimensionalities are determined using a topology-scaling algorithm (TSA) Ashton et al. (2017) (also proposed in Cheon et al. (2017)), which relates the dimension to the number of bonded clusters as a function of the size of a periodic supercell, or using the RDA Mounet et al. (2018). Due to the use of a fixed-size supercell, the TSA and RDA can respectively underestimate and overestimate the number of bonded clusters in certain materials with complex geometries. In the methods section we describe a variant of the RDA which correctly assigns all atoms to bonded clusters without the need to specify a supercell. Except for such complicated cases, however, our definition agrees with the TSA and the supercell RDA.
Other methods for identification of layered materials include the analysis of the packing fraction Björkman et al. (2012); Lebègue et al. (2013), identification of layered slab structures Gorai et al. (2016), and the use of discrepancies between experimental lattice constants and those predicted by density functional theory (DFT) Choudhary et al. (2017). By identifying structures with interlayer sodium atoms, Zhang et al. Zhang et al. (2018) have investigated promising layered cathode materials for sodium-ion batteries. McKinney et al. McKinney et al. (2018) have extended this search to general ‘ionic layered’ structures.
| COD | ICSD | |||
| Removed | Remain. | Removed | Remain. | |
| Initial | - | 400731 | - | 184754 |
| atoms | 185329 | 215402 | 7474 | 177280 |
| Partial occupancy | 49015 | 166387 | 75659 | 101621 |
| Missing hydrogen | 1470 | 164917 | 7184 | 94437 |
| Defective | 10219 | 154698 | 5703 | 88734 |
| Duplicates | 15646 | 139052 | 60019 | 28715 |
| Total remaining | 167767 | |||
| Dim. | 0 | 1 | 2 | 3 |
|---|---|---|---|---|
| 0 | 105199 | |||
| 1 | 3503 | 3285 | ||
| 2 | 2946 | 15 | 4623 | |
| 3 | 3010 | 22 | 0 | 45148 |
| 1D | ||||
|---|---|---|---|---|
| COD 4344111 | ICSD 79796 | ICSD 428184 | ICSD 33693 | ICSD 238683 |
|
|
|
|
|
| \ch N P F2 | \ch Si Ta4 Te4 | \ch Al (P S4) | \ch S | \ch Li Cl C3 H7 N O |
| 2D | 3D | |||
| COD 9007661 | ICSD 163023 | ICSD 188831 | ICSD 411179 | ICSD 164652 |
|
|
|
|
|
| \ch Mo S2 | \ch Sr ((C F3 S O2)2 N)2 | \ch Na (Au (C H3 S O3)4) | \ch Ag (B (C N)4) | \ch Ca (C (C N)3)2 |
| 1D+2D | 1D+3D | |||
| COD 7222569 | ICSD 248420 | COD 1529916 | COD 9000964 | ICSD 412254 |
|
|
|
|
|
| \ch Na (H2 O)3 | \ch Na3 H P2 O7 | \ch S29 Ta4 P4 | \ch Na2 (H2 O)6 | \ch Li (N3) (H2 O) |
| \ch (Mn (N C S)3) | \ch (H2 O)9 | \ch | \ch Ni8 (C O3)6 (O H)6 | \ch |
II.3 Mining the ICSD and COD
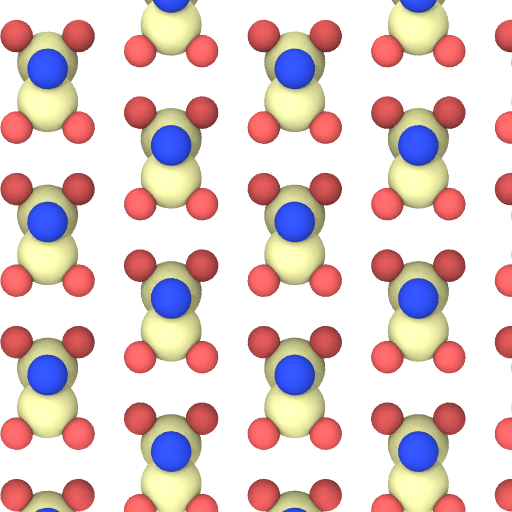
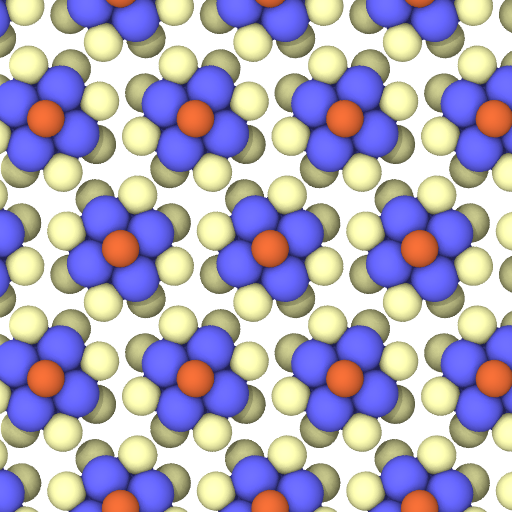
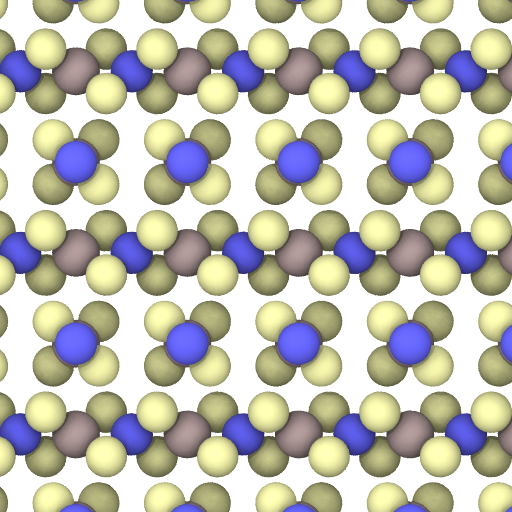
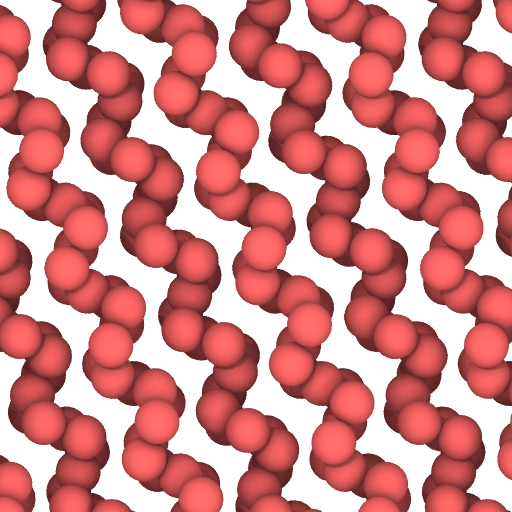
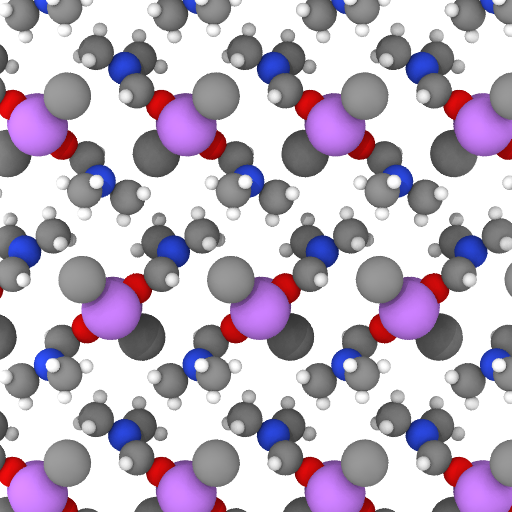
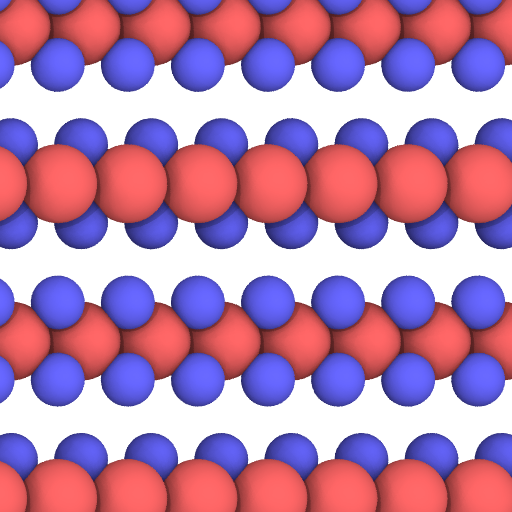
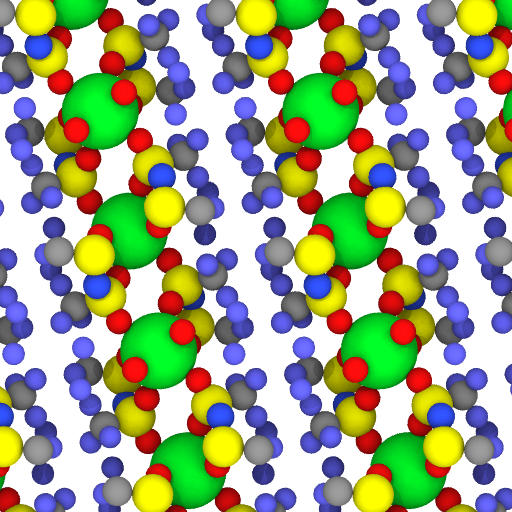
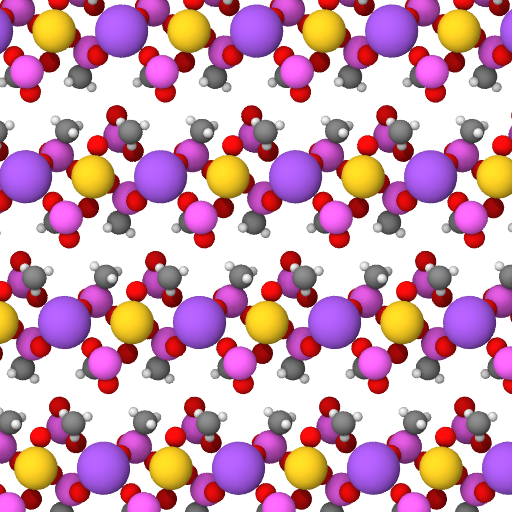
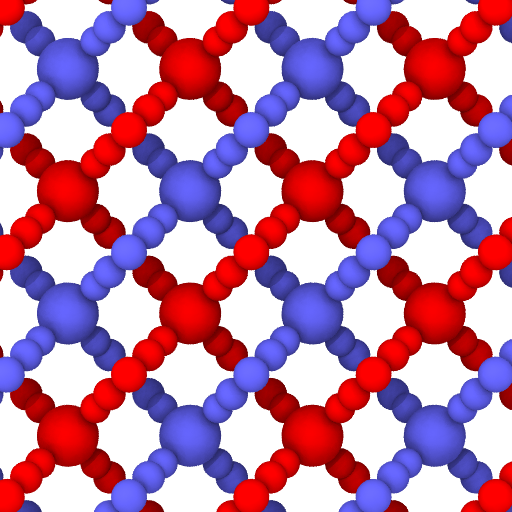
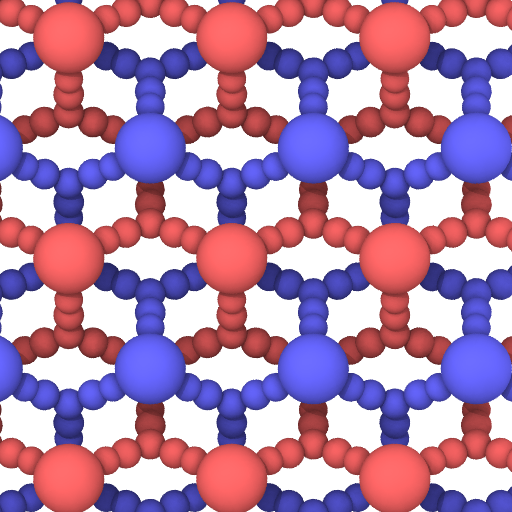
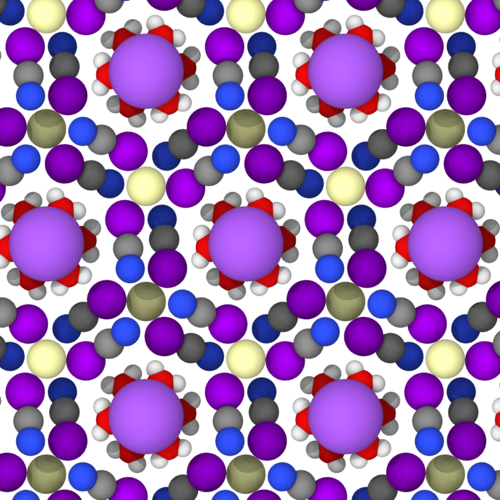
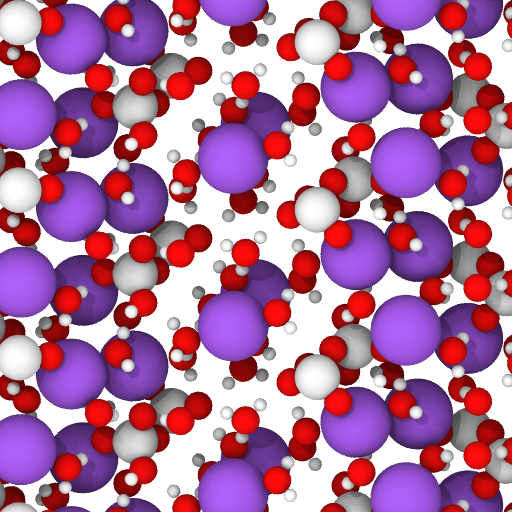
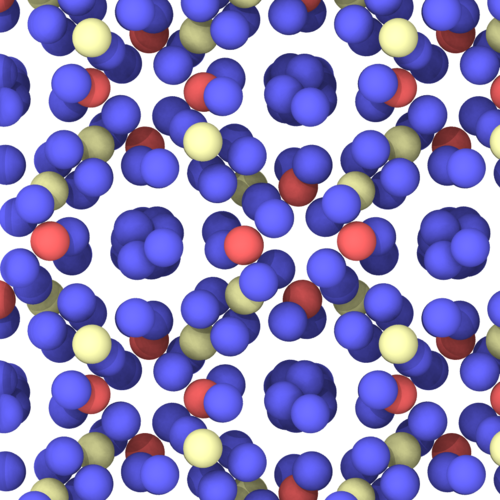
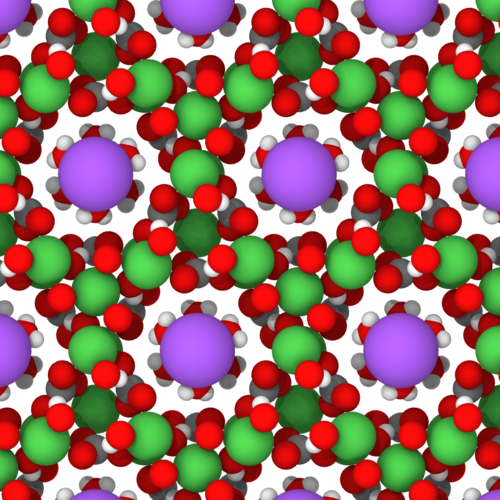
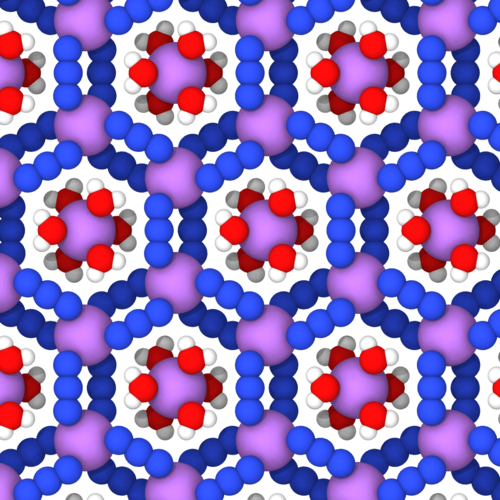
We have analyzed all materials in the ICSD and COD using the proposed scoring parameter. Fig. 5 shows examples of materials with different dimensionalities and high values of the scoring parameter.
The database has been filtered in standard ways Kirklin et al. (2015); Mounet et al. (2018) by removing incomplete and/or defective entries, structures with more than 200 atoms, structures with partial occupancies, theoretically calculated structures, and structures with missing hydrogen atoms. Duplicate structures are removed using the structure matcher function of pymatgen Ong et al. (2013). The filtering process reduces the initial set of 585485 CIF files to 167767 structures. The filtering statistics are shown in Table 1.
An overview of the database is shown in Table 2. In this table the materials have all been categorized by the dimension(s) with the largest value of the scoring parameter . In some cases all values may be fairly small and the classification is then rather uncertain. A large number of materials (105199) are classified as 0D. These are mostly molecular crystals, which we shall not consider any further here.
The second largest category is the 3D materials. Most of these have a single 3D component, but some of them have two components still with large -values. Two examples [Ag(B(CN)4 and Ca(C(CN)3)2] are shown in Fig. 5. As can be seen from the figure, both materials consist of two identical interpenetrating networks which cannot be disentangled without breaking bonds. The two networks are sufficiently spatially separated to give scoring values above 0.7. (In the figure the two networks are colored red and blue).
4623 materials are identified as two-dimensional, which is about 2.8% of all materials. This can be compared to for example the study by Mounet et al. Mounet et al. (2018) where they find 1825 out of 108423 materials (or also about 1.7%) of the materials to be easily or potentially exfoliable. About 2% of the materials are classified as 1D.
There are also some materials with several components of different dimensionality. In particular there are 9459 materials which have one or more 0D components in combination with components of higher dimensionality. These correspond to molecules or molecular ions embedded in the higher dimensional network. Only a few materials combine 1D, 2D, and 3D components. We find 15 materials combining 1D and 2D. There are 22 materials which combine 1D and 3D components. Three of them are shown in Fig. 5.
While we have made every effort to remove inconsistent structures from the database, an automated filtering is not sufficient given the many different types of errors and partial structures present in the ICSD and COD. The numbers presented here should therefore be taken as only approximate.
A database containing the calculated scoring parameters for all dimensionalities for all compounds in the ICSD and COD is available at the Computational Materials Repositorycmr (2019).

Classification:
 0D
0D
 02D
02D
 1D
1D
 2D
2D
 3D
3D
| Source | ID | Compound | |||
|---|---|---|---|---|---|
| COD | 1000410 | \chTlAlF4 | 0.987 | 0.992 | 2.330 |
| COD | 9000046 | \chC | 0.986 | 0.933 | 2.251 |
| ICSD | 27987 | \chBN | 0.984 | 0.935 | 2.170 |
| ICSD | 248325 | \chC3N4 | 0.983 | 0.910 | 2.155 |
| ICSD | 187384 | \chRb (Au (C F3 S O3)4) | 0.982 | 1.010 | 2.313 |
| ICSD | 163023 | \chSr((CF3SO2)2N)2 | 0.981 | 1.014 | 2.516 |
| COD | 1525422 | \chK3 Mn (C N)6 | 0.980 | 0.935 | 2.039 |
| COD | 1534338 | \chMgCl2 | 0.977 | 0.959 | 1.976 |
| ICSD | 161278 | \chB3C10N3 | 0.977 | 0.965 | 1.968 |
| COD | 2242431 | \chCs(N(SO2CF3)2) | 0.977 | 0.965 | 1.968 |
| Source | ID | Compound | |||
|---|---|---|---|---|---|
| COD | 4344111 | \chNPF2 | 0.984 | 0.889 | 2.184 |
| COD | 9010982 | \chSO3 | 0.983 | 0.954 | 2.133 |
| ICSD | 72577 | \chRu(CO)4 | 0.982 | 0.979 | 2.095 |
| ICSD | 47183 | \chCu Co (CO)4 | 0.980 | 0.926 | 2.044 |
| ICSD | 291211 | \chSiS2 | 0.967 | 0.986 | 1.815 |
| ICSD | 22090 | \chRuCl3 | 0.967 | 0.940 | 1.812 |
| ICSD | 415951 | \chV (Al Cl4)2 | 0.965 | 0.990 | 1.784 |
| ICSD | 78778 | \chCrF4 | 0.964 | 0.985 | 1.780 |
| ICSD | 428185 | \chAl P S4 | 0.964 | 0.995 | 1.771 |
| ICSD | 419661 | \chCrF5 | 0.962 | 0.996 | 1.751 |
II.4 Physical Significance of the Scoring Parameter
Due to the well-defined identification of the 2D materials, the scoring scheme also serves as a simple predictor of exfoliability. Mounet et al. Mounet et al. (2018) have calculated the exfoliation energy (i.e. the binding energy between layers) of 1535 layered materials, and they suggest an energy of 35 meV/Å2 as the threshold for “easily exfoliable” materials. They furthermore highlight 11 materials, which they denote as “well-known” 2D materials.
In Fig. 6 we show the calculated exfoliation energies versus the scoring parameter . There is a clear correlation between the scoring parameter and the exfoliation energy with essentially all of the high-scoring materials (say ) having an exfoliation energy below the threshold. The separation of materials of different dimensionality is also clearly seen here by the low density of points in the region . The 11 well-known 2D materials are also shown in the figure. All of them, except \chBi2Te3, have high scoring values with . Despite its small interlayer distance, \chBi2Te3 is nonetheless classified as a 2D material, since is larger than its other scores.
It should be noted that although the exfoliation energy is a highly relevant quantity for the exfoliation process, it is not clear whether an absolute threshold in energy is the best indicator of exfoliability. The exfoliation process involves breaking the bonds between the layers keeping the bonds within the layers intact, so the exfoliation energy should be seen relative to the intralayer bond strengths. While the scoring parameter proposed here does not explicitly involve the energetics, the high-scoring materials have a clear separation between the intra- and intercomponent bond lengths, which can be expected to be a characteristic of easily exfoliable materials.
II.5 Ranking of Low-dimensional Materials
In addition to dimensionality classification, the scoring parameter defines an order on materials. We have identified the ten materials in the ICSD and COD with the highest 2D scores, shown in Table 3. Widely studied layered structures such as graphene, boron nitride, and magnesium chloride are highly ranked. Some of the remaining structures have much larger unit cells, but are nonetheless clearly van der Waals bonded layered structures. It should be noted that the detailed ordering of the top materials is sensitive to the detailed choice of the function in Equation 3, whereas the overall classification of the materials is more robust.
Similarly a list of the highest-scoring 1D materials is provided in Table 4. We shall not discuss these materials in depth here, but briefly characterize the top five entries with two or three different chemical elements. For all of these the one-dimensional or chain-like character has already been recognized. \chNPF2 consists of chains of alternating nitrogen and phosphorous atoms with the fluorine atoms bound to the phosphorous. The chains can also close on themselves forming ring-shaped molecules. \chSO3 is an asbestos-like structure made up of corner-linked \chSO4 tetrahedra forming spiraling chains, while the chains in the \chSiS2 structure consists of edge-sharing tetrahedra. The two ruthenium compounds form chains of ruthenium atoms. \chRu(CO)4 is constructed from planar units with ruthenium in the middle and CO molecules attached with a fourfold rotation symmetry. These units are then stacked forming chains of ruthenium. \chRuCl3 is in the phase also called the \chZrCl3 structure. Here again the ruthenium atoms form linear chains, but with the chlorine atoms connecting two adjacent ruthenium atoms. It can be noted that \chRuCl3 also appears as a strongly layered material ( = 0.933) in the phase with prototype \chRhBr3. We have performed density functional calculations for these highly 1D compounds using the GPAW code Mortensen et al. (2005); Enkovaara et al. (2010) and the Atomic Simulation Environment (ASE) Bahn and Jacobsen (2002); Larsen et al. (2017). The three compounds \chNPF2, \chSO3, and \chSiS2 are found to be non-magnetic large band gap semiconductors.
In the two compounds with ruthenium chains the distance between the ruthenium atoms are in fact comparable to the bond distance in ruthenium bulk metal. However, the strong couplings to the attached atoms and molecules lead to opening of band gaps. According to the DFT calculations \chRu(CO)4 is non-magnetic while \chRuCl3 is found to be antiferromagnetic. Details of the calculations can be found in the Supplementary Material.
The scoring approach also allows for identification of materials with several components of different dimensionality. Five of these are shown in Fig. 5. The two 1D+2D materials and the last two 1D+3D materials all involve alkali atoms (Na or Li) decorated with water molecules as the 1D component. Note that in the case of \chNa (H2 O)3 (Mn (N C S)3 the chains penetrate the 2D layers in the framework, while in the case of \chNa3 H P2 O7 (H2 O)9 the chains run parallel to the 2D components.
In these materials charge transfer takes place with approximately one electron per alkali atom donated to the 2D or 3D framework. We have investigated this by performing DFT calculations followed by a Bader analysis, Bader and Bader (1990); Tang et al. (2009) where an electronic charge is associated with each atom based on a natural per-atom division of the electronic density. For the compounds \chNa (H2 O)3 (Mn (N C S)3 and \chNa2 (H2 O)6 Ni8 (C O3)6 (OH)6 the chains consist of \chNa (H2 O)3 units with an electron transfer of 0.85 and 0.90 electrons per unit, respectively. Similarly in the case of \chLi (N3)(H2O), the charge transfer is 0.85 per \chLi (H2 O)3 unit. \chNa3 H P2 O7 (H2 O)9 contains chains of \chNa (H2 O)4 molecular ions with a charge transfer of 0.80 electrons per unit.
The charge transfer in these systems illustrates that the geometrically defined scoring parameter does not only identify components which are exclusively van der Waals bonded to each other. Charge transfer may take place between spatially separated components giving rise to bonding of a more ionic character.

The last compound in Fig. 5 of mixed dimensionality is \chS29 Ta4 P4. It has a very intriguing structure. It consists of spiraling sulfur chains penetrating a 3D network constructed of \chTa P S6 building blocks. The 3D network itself consists of two identical interpenetrating components. The ability of Ta-P-S compounds to form tunnels has previously been reported Evain et al. (1987) and sulfur spirals appear in several compounds. The present compound does not exhibit any charge transfer between the components. Fig. 7 shows the calculated density of states for the \chS29 Ta4 P4 compound projected onto the 1D and 3D components. The two components are seen to exhibit different band gaps. This opens the possibility for selectively exciting electrons in one of the components using light with an appropriate wavelength.
III Conclusion
We have defined a simple geometric scoring parameter to identify materials of particular dimensionality. The parameter provides an estimate of the degree to which a given dimensionality is present in the compound. The parameter is easy to calculate and can be applied to large materials databases. As mentioned in the introduction several computational 2D materials databases are presently under construction while 1D materials and materials of mixed dimensionality have received much less attention. The present approach allows for simple identification of existing 1D or mixed-dimensional materials, which can form templates that can be used to construct larger computational databases for materials of a given dimensionality.
IV Methods
IV.1 Component Dimensionality
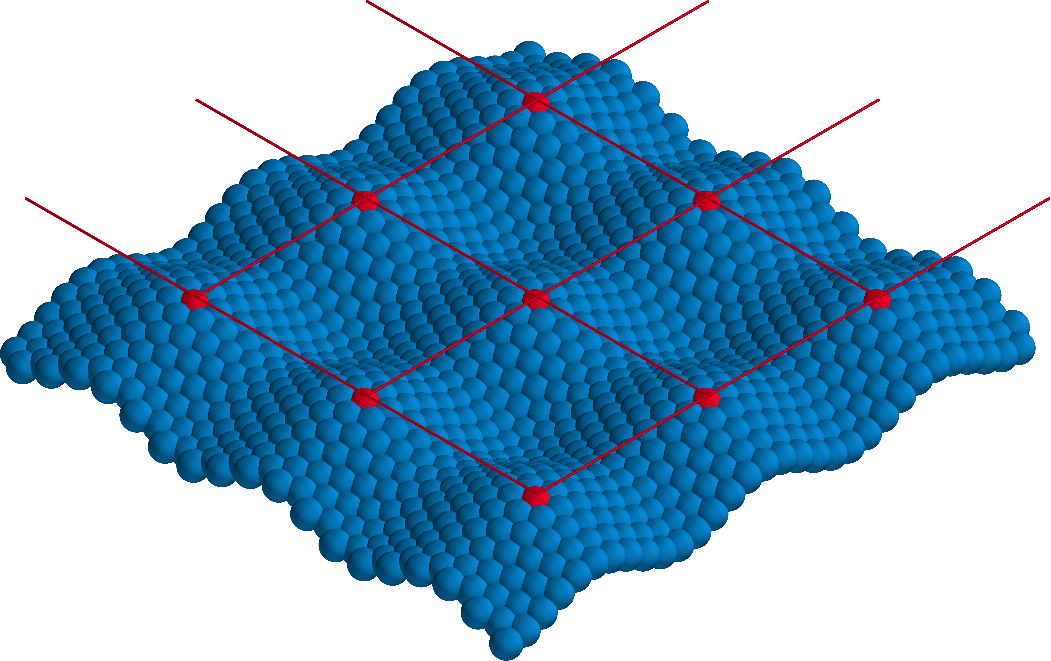
A material will in general consist of several clusters of bonded atoms. Such clusters we term the components of the material. The components may have different dimensionalities and they should therefore be investigated separately.
Our definition of material dimensionality of a component is as follows: select an atom in the component, with atomic coordinates . Let denote the set of atoms to which the first atom is bonded, and which have the same fractional coordinates but in different unit cells, i.e., , where is the unit cell description and is an integer vector. Then, the component dimensionality is the rank of the subspace spanned by :
| (4) |
This definition (illustrated in Fig. 8) accommodates both corrugation and thickness. While is an infinite set for all but 0D components, can be determined in a finite number of steps by exploiting the periodicity of a material.
As described above, determination of the dimension of a material requires an analysis of its constituent bonded clusters, or components. To find the dimension of a component, the rank determination algorithm (RDA) of Mounet et al. Mounet et al. (2018) uses a supercell of fixed size with open boundary conditions. If the supercell is too small, the number of components might be overestimated.
Conversely, the topological scaling algorithm (TSA) of Ashton et al. Ashton et al. (2017) uses periodic unit cells, which can underestimate the number of components by forming improper connections between them. By improper connections, we mean components which are disconnected in the infinite crystal but are connected due to the periodic cell chosen.
The problem of improper connections is illustrated with a contrived example in Fig. 9, which shows the side view of a selection of periodic helical structures. We define an helix as a structure which has components, whose component has coordinates given by:
| (5) |
The number of components is dependent on the size (along the axis) of the periodic cell. In the formulation given in Equation (5) any integer is a valid cell length.
Fig. 9 shows how the number of components changes with varying cell periodicity. In general, the number of components for an helix with periodicity is given by . In order to avoid improper connections between components, a periodic cell of size is needed. This is further complicated for cells containing multiple helices of different sizes. In this case, the correct size of the periodic cell is given by , where denotes the number of components in the helix. For example, a structure containing a -helix, a -helix, and a -helix requires a periodic cell of length 210. This cell is so large that it is unlikely that it would be tested using the existing methods.
While the example described here is contrived, self-penetrating helical networks have been assembled experimentally Xiao et al. (2007); Yang et al. (2012). Furthermore, the problem illustrated has practical consequences: an incorrect periodic cell (such as the use of a primitive unit cell) causes the interpenetrating polymer networks shown in Fig. 5 to be misclassified as 2D materials.
IV.2 Algorithm
Component dimensionalities can be identified using a modified breadth-first-search (BFS) algorithm, shown in Algorithm 1. In standard BFS, the search terminates when all nodes have been visited. Here, we terminate the search when the rank of the subspace spanned by a component (i.e. the dimensionality) can no longer increase. The rank of a set of points is defined as:
| (6) |
where rankM denotes the standard matrix rank.
In this algorithm, components in the aperiodic primitive unit cell are the graph vertices, and connections between components (across unit cell boundaries) are graph edges. We note that, by definition, no edges exist between components within the same cell.
The input to the algorithm (line 1) is a set of graph edges () and a component () whose dimension we wish to determine. We maintain a set of visited or seen vertices (line 2) and a set of visited vertices for each of the components in the aperiodic primitive unit cell (line 3). A vertex queue is maintained whose elements consist of a component index and cell coordinates. The queue is initialized with the component in the cell with coordinates (line 4). The algorithm runs until the queue is empty (line 5). The first element in the queue is extracted and removed (lines 6 and 7). If the element has already been visited it is skipped (line 8), otherwise it is added to the set of visited elements (line 11). If the addition of the vertex serves to increase the rank of the set of visited vertices (line 12), it is added to the set (line 13).
New vertices in adjacent cells are generated from the edge list. For a component , the edge list (line 15) specifies the neighboring components () and the cell offset (), from which the coordinates of the neighboring cell can be calculated (line 16). If the neighbor element has already been visited it is either skipped (line 17), or added to the queue (line 21) if it serves to increase the rank of the set of visited vertices (line 20). When the queue is empty, the rank of the component is returned (line 25).
IV.3 Interval Identification
The purpose of the modified method (described in Algorithm 2) is to identify intervals in in which the dimensionality classification is constant.
The input to the algorithm (line 1) is the set of all possible edges, sorted according to their values, from lowest to highest. Each element in this set, , contains the value of the edge and the indices, and , of the vertices it connects. Periodic boundary conditions must be taken into account when generating this set. Due to the periodicity this set is infinitely large; the relevant (finite) subset, however, can be generated incrementally.
The algorithm proceeds by inserting edges from into the graph, one by one (line 5). For every edge in the primitive cell, the corresponding number of edges are inserted into the supercell. Connected components in both the primitive cell and the supercell are identified after each edge insertion (line 6), from which a component histogram is calculated (line 8). The histogram, , contains the number of 0D, 1D, 2D, and 3D components present. Prior to any edge insertion, only 0D components are present, which is reflected in the initial state of the histogram (line 3). If an edge insertion produces a change in the component histogram (line 9), the interval is added (line 10) to the set of results (line 4). The algorithm terminates when the histogram consists only a single 3D component (line 12). A 3D interval is added to the results (line 13), which implicity contains all uninserted edges in : once the dimensionality is fully 3D, no further edge insertions can change the classification.
The algorithms developed here are included in the ASE Larsen et al. (2017) library.
Acknowledgements.
The authors thank Nicolas Mounet and Nicola Marzari for kindly providing data for the layered compounds identified by Mounet et al. (2018), FIZ Karlsruhe – Leibniz Institute for Information Infrastructure for providing CIF files of all entries in the ICSD, and anonymous referees for comments which improved the manuscript. This work was supported by Grant No. 7026-00126B from the Danish Council for Independent Research and by the VILLUM Center for Science of Sustainable Fuels and Chemicals which is funded by the VILLUM Fonden research grant (9455).References
- Novoselov et al. (2004) K. S. Novoselov, A. K. Geim, S. V. Morozov, D. Jiang, Y. Zhang, S. V. Dubonos, I. V. Grigorieva, and A. A. Firsov, Science 306, 666 (2004).
- Bhimanapati et al. (2015) G. R. Bhimanapati, Z. Lin, V. Meunier, Y. Jung, J. Cha, S. Das, D. Xiao, Y. Son, M. S. Strano, V. R. Cooper, L. Liang, S. G. Louie, E. Ringe, W. Zhou, S. S. Kim, R. R. Naik, B. G. Sumpter, H. Terrones, F. Xia, Y. Wang, J. Zhu, D. Akinwande, N. Alem, J. A. Schuller, R. E. Schaak, M. Terrones, and J. A. Robinson, ACS Nano 9, 11509 (2015).
- Ferrari et al. (2015) A. C. Ferrari, F. Bonaccorso, V. Fal’ko, K. S. Novoselov, S. Roche, P. Bøggild, S. Borini, F. H. L. Koppens, V. Palermo, N. Pugno, J. A. Garrido, R. Sordan, A. Bianco, L. Ballerini, M. Prato, E. Lidorikis, J. Kivioja, C. Marinelli, T. Ryhänen, A. Morpurgo, J. N. Coleman, V. Nicolosi, L. Colombo, A. Fert, M. Garcia-Hernandez, A. Bachtold, G. F. Schneider, F. Guinea, C. Dekker, M. Barbone, Z. Sun, C. Galiotis, A. N. Grigorenko, G. Konstantatos, A. Kis, M. Katsnelson, L. Vandersypen, A. Loiseau, V. Morandi, D. Neumaier, E. Treossi, V. Pellegrini, M. Polini, A. Tredicucci, G. M. Williams, B. Hee Hong, J.-H. Ahn, J. Min Kim, H. Zirath, B. J. van Wees, H. van der Zant, L. Occhipinti, A. Di Matteo, I. A. Kinloch, T. Seyller, E. Quesnel, X. Feng, K. Teo, N. Rupesinghe, P. Hakonen, S. R. T. Neil, Q. Tannock, T. Löfwander, and J. Kinaret, Nanoscale 7, 4598 (2015).
- Zeng et al. (2018) M. Zeng, Y. Xiao, J. Liu, K. Yang, and L. Fu, Chem. Rev. (2018), 10.1021/acs.chemrev.7b00633.
- Mounet et al. (2018) N. Mounet, M. Gibertini, P. Schwaller, D. Campi, A. Merkys, A. Marrazzo, T. Sohier, I. E. Castelli, A. Cepellotti, G. Pizzi, and N. Marzari, Nat. Nanotechnol. 13, 246 (2018).
- Ashton et al. (2017) M. Ashton, J. Paul, S. B. Sinnott, and R. G. Hennig, Phys. Rev. Lett. 118, 106101 (2017).
- Haastrup et al. (2018) S. Haastrup, M. Strange, M. Pandey, T. Deilmann, P. S. Schmidt, N. F. Hinsche, M. N. Gjerding, D. Torelli, P. M. Larsen, A. C. Riis-Jensen, J. Gath, K. W. Jacobsen, J. J. Mortensen, T. Olsen, and K. S. Thygesen, 2D Materials 5, 042002 (2018).
- Stolyarov et al. (2016) M. A. Stolyarov, G. Liu, M. A. Bloodgood, E. Aytan, C. Jiang, R. Samnakay, T. T. Salguero, D. L. Nika, S. L. Rumyantsev, M. S. Shur, K. N. Bozhilov, and A. A. Balandin, Nanoscale 8, 15774 (2016).
- Geremew et al. (2018) A. Geremew, M. A. Bloodgood, E. Aytan, B. W. K. Woo, S. R. Corber, G. Liu, K. Bozhilov, T. T. Salguero, S. Rumyantsev, M. P. Rao, and A. A. Balandin, IEEE Trans. Electron Devices 39, 735 (2018).
- Jariwala et al. (2017) D. Jariwala, T. J. Marks, and M. C. Hersam, Nat. Mater. 16, 170 (2017).
- Bergerhoff et al. (1983) G. Bergerhoff, R. Hundt, R. Sievers, and I. Brown, J. Chem. Inf. Comp. Sci. 23, 66 (1983).
- Gražulis et al. (2012) S. Gražulis, A. Daškevič, A. Merkys, D. Chateigner, L. Lutterotti, M. Quirós, N. R. Serebryanaya, P. Moeck, R. T. Downs, and A. Le Bail, Nucleic Acids Research 40, D420 (2012).
- Cordero et al. (2008) B. Cordero, V. Gómez, A. E. Platero-Prats, M. Revés, J. Echeverría, E. Cremades, F. Barragán, and S. Alvarez, Dalton Trans. , 2832 (2008).
- Cheon et al. (2017) G. Cheon, K.-A. N. Duerloo, A. D. Sendek, C. Porter, Y. Chen, and E. J. Reed, Nano Lett. 17, 1915 (2017).
- Björkman et al. (2012) T. Björkman, A. Gulans, A. V. Krasheninnikov, and R. M. Nieminen, Phys. Rev. Lett. 108, 235502 (2012).
- Lebègue et al. (2013) S. Lebègue, T. Björkman, M. Klintenberg, R. M. Nieminen, and O. Eriksson, Phys. Rev. X 3, 031002 (2013).
- Gorai et al. (2016) P. Gorai, E. S. Toberer, and V. Stevanović, J. Mater. Chem. A 4, 11110 (2016).
- Choudhary et al. (2017) K. Choudhary, I. Kalish, R. Beams, and F. Tavazza, Sci. Rep. 7, 5179 (2017).
- Zhang et al. (2018) X. Zhang, Z. Zhang, S. Yao, A. Chen, X. Zhao, and Z. Zhou, npj Comput. Mater. 4, 13 (2018).
- McKinney et al. (2018) R. McKinney, P. Gorai, S. Manna, E. Toberer, and V. Stevanović, J. Mater. Chem. A 6, 15828 (2018).
- Kirklin et al. (2015) S. Kirklin, J. E. Saal, B. Meredig, A. Thompson, J. W. Doak, M. Aykol, S. Rühl, and C. Wolverton, NPJ Comput. Mater. 1, 15010 (2015).
- Ong et al. (2013) S. P. Ong, W. D. Richards, A. Jain, G. Hautier, M. Kocher, S. Cholia, D. Gunter, V. L. Chevrier, K. A. Persson, and G. Ceder, Comput. Mater. Sci. 68, 314 (2013).
- cmr (2019) “Computational Materials Repository,” https://cmr.fysik.dtu.dk/lowdim/lowdim.html (2019).
- Mortensen et al. (2005) J. J. Mortensen, L. B. Hansen, and K. W. Jacobsen, Phys. Rev. B 71, 035109 (2005).
- Enkovaara et al. (2010) J. Enkovaara, C. Rostgaard, J. J. Mortensen, J. Chen, M. Dułak, L. Ferrighi, J. Gavnholt, C. Glinsvad, V. Haikola, H. A. Hansen, H. H. Kristoffersen, M. Kuisma, A. H. Larsen, L. Lehtovaara, M. Ljungberg, O. Lopez-Acevedo, P. G. Moses, J. Ojanen, T. Olsen, V. Petzold, N. A. Romero, J. Stausholm-Møller, M. Strange, G. A. Tritsaris, M. Vanin, M. Walter, B. Hammer, H. Hakkinen, G. K. H. Madsen, R. M. Nieminen, J. K. Nørskov, M. Puska, T. T. Rantala, J. Schiøtz, K. S. Thygesen, and K. W. Jacobsen, J. Phys. Condens. Matter 22, 3202 (2010).
- Bahn and Jacobsen (2002) S. R. Bahn and K. W. Jacobsen, Comput. Sci. Eng. 4, 56 (2002).
- Larsen et al. (2017) A. Larsen, J. Mortensen, J. Blomqvist, I. E. Castelli, R. Christensen, M. Dulak, J. Friis, M. Groves, B. Hammer, C. Hargus, E. Hermes, P. Jennings, P. Jensen, J. Kermode, J. Kitchin, E. Kolsbjerg, J. Kubal, K. Kaasbjerg, S. Lysgaard, J. Maronsson, T. Maxson, T. Olsen, L. Pastewka, A. Peterson, C. Rostgaard, J. Schiøtz, O. Schütt, M. Strange, K. S. Thygesen, T. Vegge, L. Vilhelmsen, M. Walter, Z. Zeng, and K. W. Jacobsen, J. Phys. Condens. Matter 29, 273002 (2017).
- Bader and Bader (1990) R. F. W. Bader and R. F. Bader, Atoms in Molecules: A Quantum Theory, International series of monographs on chemistry (Clarendon Press, 1990).
- Tang et al. (2009) W. Tang, E. Sanville, and G. Henkelman, J. Phys. Condens. Matter 21, 084204 (2009).
- Evain et al. (1987) M. Evain, S. Lee, M. Queignec, and R. Brec, J. Solid State Chem. 71, 139 (1987).
- Xiao et al. (2007) D.-R. Xiao, Y.-G. Li, E.-B. Wang, L.-L. Fan, H.-Y. An, Z.-M. Su, and L. Xu, Inorganic Chemistry 46, 4158 (2007).
- Yang et al. (2012) G.-P. Yang, L. Hou, X.-J. Luan, B. Wu, and Y.-Y. Wang, Chem. Soc. Rev. 41, 6992 (2012).