22institutetext: Department of Diagnostic and Interventional Radiology, University of Tübingen
33institutetext: Institute of Epidemiology, Helmholtz Zentrum München 44institutetext: Department of Diagnostic and Interventional Radiology, University Hospital Heidelberg
Authors’ Instructions
Deep Shape Analysis on Abdominal Organs
for Diabetes Prediction
Abstract
Morphological analysis of organs based on images is a key task in medical imaging computing. Several approaches have been proposed for the quantitative assessment of morphological changes, and they have been widely used for the analysis of the effects of aging, disease and other factors in organ morphology. In this work, we propose a deep neural network for predicting diabetes on abdominal shapes. The network directly operates on raw point clouds without requiring mesh processing or shape alignment. Instead of relying on hand-crafted shape descriptors, an optimal representation is learned in the end-to-end training stage of the network. For comparison, we extend the state-of-the-art shape descriptor BrainPrint to the AbdomenPrint. Our results demonstrate that the network learns shape representations that better separates healthy and diabetic individuals than traditional representations.
1 Introduction
Shape models have been widely used in medical imaging, not only as a prior for segmentation algorithms, but also as a powerful tool to assess morphological differences between subjects [8]. A critical element in shape analysis is the choice of a numerical representation which can be used for a quantitative analysis of shape. Multiple shape representations have been previously explored, ranging from very basic volumetric and thickness measurements [19, 6], to more complex models such as Point Distribution Models [2], spectral signatures [20], spherical harmonics [4], medial representations [5], and diffeomorphisms [13].
Despite the ample success of deep learning for many medical imaging tasks, their application for medical shape analysis is still largely unexplored; mainly because typical shape representations such as point clouds and meshes do not possess an underlying Euclidean or grid-like structure. Deep networks can learn complex, hierarchical feature representations from data that typically outperforms hand-crafted features, which are not optimal for the given task.
Recently, we have introduced the Multi-Structure PointNet (MSPNet) [7], which is able to learn shape representations directly on point clouds and can predict a label given the shape of multiple brain structures. To the best of our knowledge MSPNet is the first deep end-to-end learning system used to perform prediction based on organ shapes. MSPNet operates directly on point clouds, without the need to create meshes and it does not require computing point correspondences between different shapes.
As most work on shape analysis, we have used MSPNet in the study brain morphology; however, the use of shape models to analyze other anatomical regions remains a relatively unexplored area. In an effort to fill this gap, we propose the deep shape analysis of abdominal anatomy. Our main interest lies on the use of MSPNet to learn shape representations which are able to measure morphological differences in the liver and spleen of healthy subjects when compared to individuals diagnosed with diabetes mellitus. Diabetes mellitus is a worldwide prevalent condition, which is defined by levels of hyperglycaemia giving rise to risk of microvascular damage and its diagnosis is associated with complications, which lead to reduced life expectancy and diminished quality of life [15].
Concretely, we propose the first deep learning approach operating on the shape of abdominal organs for the prediction of diabetes. Further, we extend the state-of-the-art shape representation BrainPrint [20] to the abdomen, yielding the AbdomenPrint. Finally, we compare MSPNet and AbdomenPrint in the challenging task of predicting diabetes directly from the shape of the liver and spleen.
1.1 Related Work
The use of shape models for the analysis of morphological changes associated with disease or other factors has mainly been explored in neuroimaging. Significant relationships between measurements of brain morphology and a variety of factors such as age [1] and neurodegenerative diseases [20] have been throughly explored. In this work, we focus on the abdominal organs liver and spleen. Previous approaches have explored the morphological analysis of the liver based on imaging data. Lamecker et al. [11] present for the first time a statistical shape model of the liver. Dura et al. [3] present the construction of a a probabilistic liver atlas. In terms of using shape models for the diagnosis of liver related diseases, Kohara et al. [10] use a statistical shape model of the liver to assess differences between healthy subjects and individuals diagnosed with cirrhosis. A similar approach is proposed by Mukherjee et al. [14] for the discrimination of chronic liver disease from CT Data and by Hori et al. [9] where a statistical shape model is used to evaluate differences in liver shape caused by hepatic fibrosis.
Shape analysis of the spleen is a far less explored area of research. Tateyama [18] et al. present the use of a Point Distribution Model (PDM) for the analysis of spleen shape. Yates et al. [24] present a morphological study of the spleen, relating the principal components obtained from a statistical shape model to anthropometric and demographic information.
In this work, we deviate from these previous approaches in the methodology used to assess relationships between abdominal morphology and clinical variables. Instead of modeling shape variation using the commonly used features derived from Point Distribution Models, we evaluate the use of two state-of-the-art approaches: MSPNet[7] and BrainPrint [20]. These two approaches have previously been used for the morphological analysis of brain structures, but they have yet to be applied for the analysis of abdominal structures.
2 Method
The usual pipeline of shape analysis of anatomical structures consists of extracting a binary segmentation of the structure of interest from an image (either manually or automatically) followed by the extraction of a shape descriptor vector which can be used to quantitatively model the shape of an organ of interest. In the case of a classification task, we can then find a function mapping shape descriptors to a label . which corresponds to the variable to be predicted. In our case is an indicator variable which determines if a particular subject is healthy or has been diagnosed with a diabetic condition .
In our experiments, we evaluate the use of two different shape representations . In both cases, independent shape representations and are calculated independently for the liver and spleen, and are afterwards concatenated to obtain a global shape descriptor .
2.1 AbdomenPrint
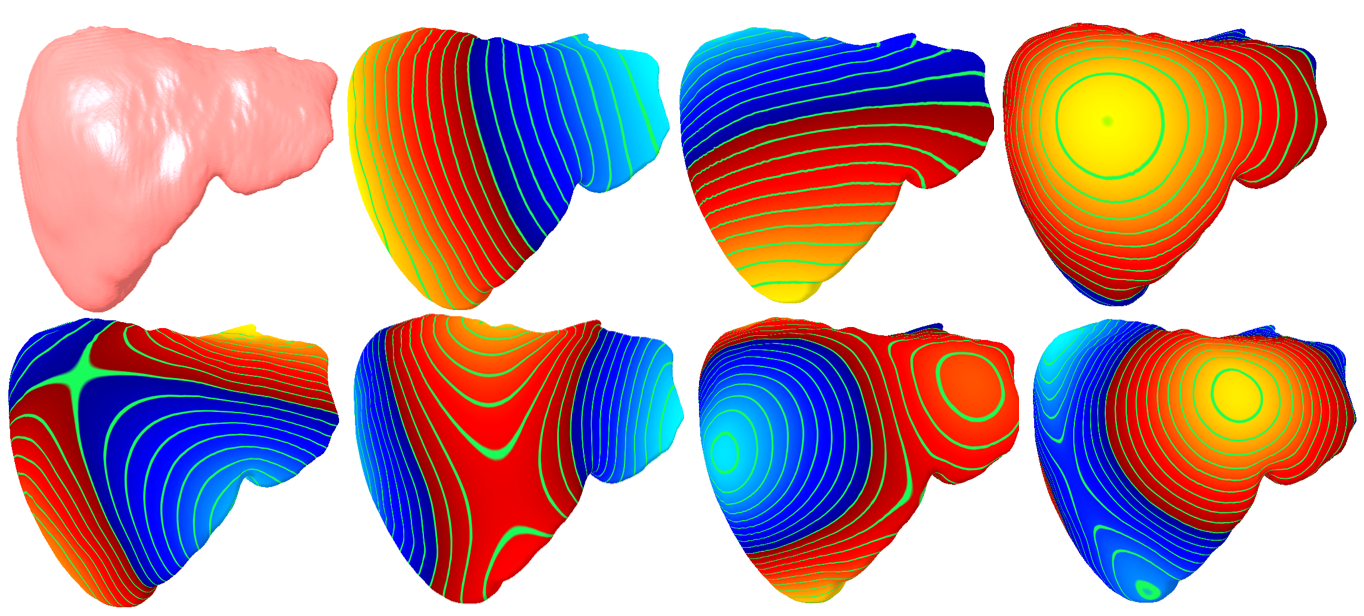
The AbdomenPrint is the analogy of the BrainPrint [20], which has been successfully used to associate morphological changes in the brain correlated to Alzheimer’s disease [22, 23, 21], but in our case we apply it to the analysis of abdominal organs. AbdomenPrint uses the shapeDNA [17] as shape descriptor, which is computed from the intrinsic geometry of organs by calculating the Laplace-Beltrami spectrum. Considering the Laplace-Beltrami operator , the spectrum is obtained by solving the Laplacian eigenvalue problem:
| (1) |
The solution of this problem consists of a series of eigenvalues and eigenfunctions (see figure 1). The first non-zero eigenvalues, computed with the finite element method, form the ShapeDNA: . We further linearly re-weight the eigenvalues, , to balance the impact of higher eigenvalues that show higher variance [20]. The shape of an organ can then be represented by the vector of normalized eigenvalues . For the computation of shapeDNA, triangular meshes are constructed from organ segmentations via marching cubes.
2.2 MSPNet
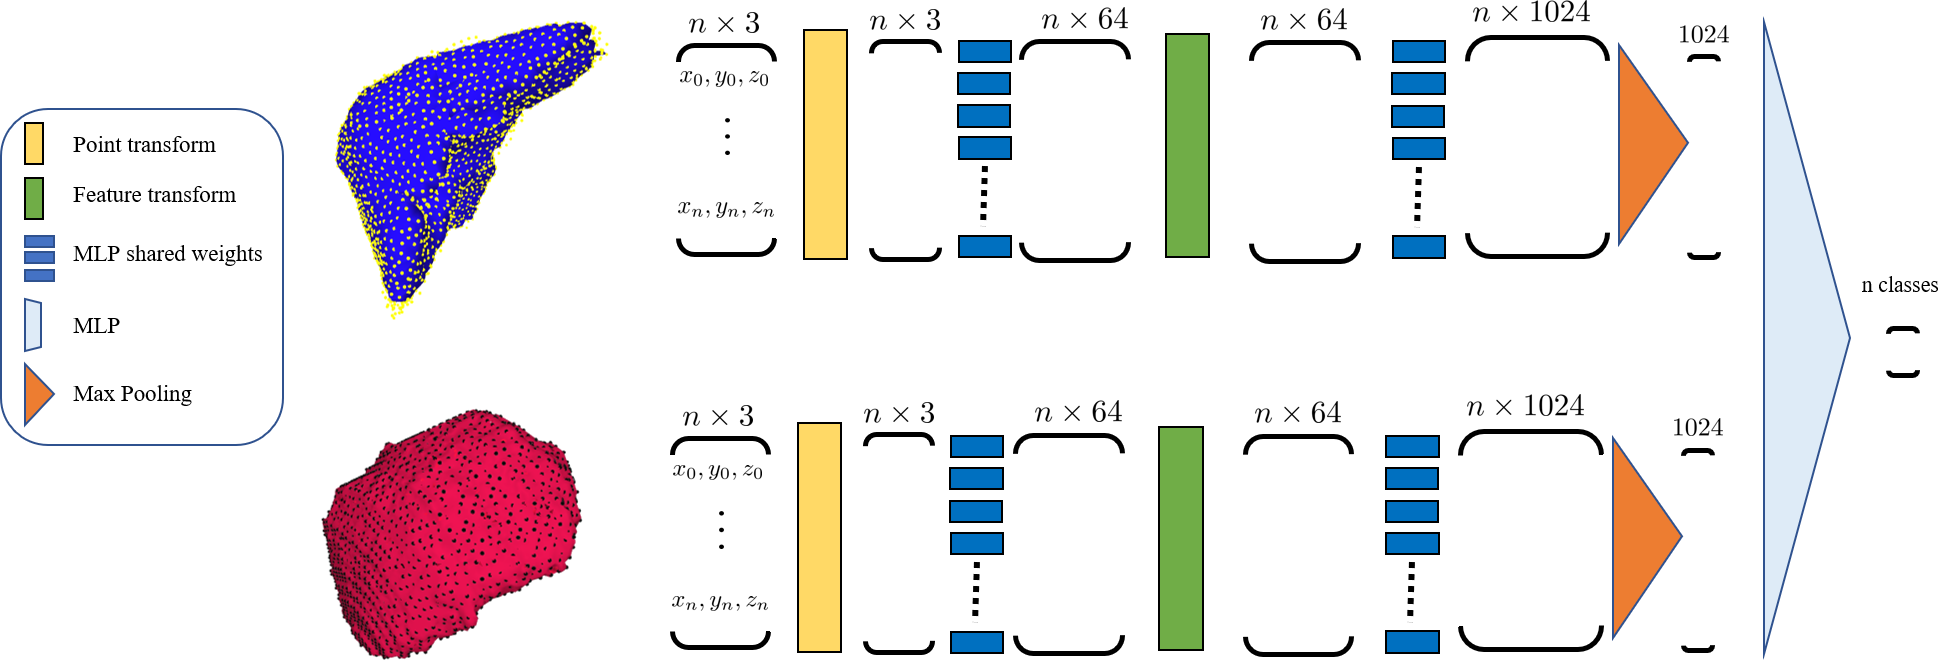
We have recently introduced Multi-structure PointNet (MSPNet) [7] for shape analysis of brain structures. MSPNet is a network architecture based on PointNet, a state of the art deep learning approach for point cloud classification [16]. In MSPNet, a shape representation can be learned in an end-to-end fashion directly from a point cloud where correspond to the cartesian coordinates of the points representing the surface of the organ of interest. Different to other shape representations based on point clouds such as Point Distribution Models, in MSPNet it is not required for the points in to be ordered, which means that no anatomical correspondences between shapes are needed.
To obtain a shape representation using MSPNet, the point cloud vector is fed to the network (see fig. 2). The first stage of the network corresponds to a transformation network which corresponds to a function mapping the input point cloud to a transformation matrix . This transformation matrix is applied to the input point cloud, so that the input point clouds are aligned before further processing is done. This transformation layer is known as T-Net [16], and is similar in structure to PointNet. After this transformation is applied to the input point cloud, the representation is obtained by applying layers:
| (2) |
where corresponds to the shared weights of the th layer, is a non linear activation function and correspond to the activation of the th point of the previous layer. By processing the point cloud through these shared weight layers, MSPNet obtains a global feature vector at the last shared weight layer corresponds to a feature representation of each organ. This feature vector is then connected to a fully connected multilayer perceptron corresponding to a function . It is important to notice that since this network is trained in an end-to-end fashion, the feature vector is optimized for the diabetes classification task.
3 Experiments
Experiments are performed on a set of whole-body Magnetic Resonance Images (MRI) obtained from the Cooperative Health Research in the Region Augsburg project (KORA). Manual segmentations of the liver and the spleen were obtained from 359 images, 228 corresponding to healthy controls and 131 corresponding to subjects diagnosed with either pre-diabetes or diabetes according to definitions by the world health organization [15]. From these segmentations, point clouds are obtained by uniformly sampling the surface area of each organ.
3.1 Diabetes classification
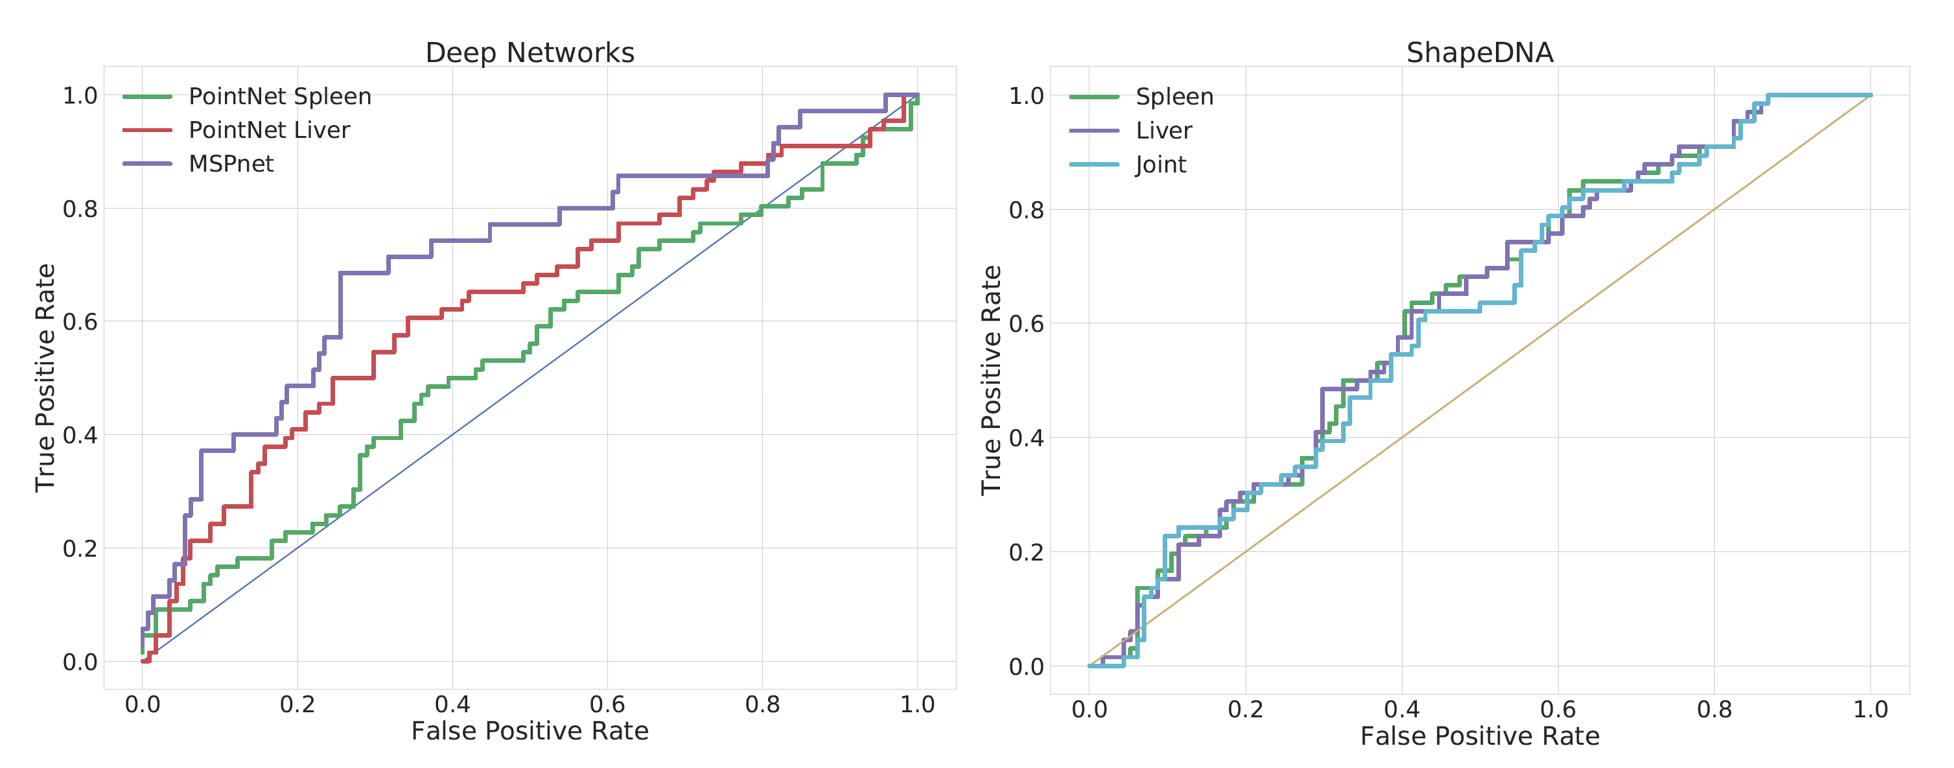
For a first experiment we evaluate the ability of each shape representation for the problem of discriminating between shapes of organs obtained from healthy individuals compared to subjects diagnosed with pre-diabetes or diabetes. Our set of 359 images is split divided in training and testing sets (50/50) and classification performance is evaluated in terms of Area Under the Curve (AUC) (Table 1) of the Receiver Operating Characteristic (ROC) curves shown in figure 3. For comparison we compute AbdomenPrint features, and a gradient boosting classifier is trained to operate on the obtained shape descriptors. Our results show that although both methods are able to detect differences between diabetic and control patients, MSPNet presents a higher classification performance. It is also worth mentioning that using joint shape descriptors of both the spleen and the liver did not improve classification for AbdomenPrint, whereas MSPNet was able to leverage on joint information obtained from both organs simultaneously.
| Liver | Spleen | Abdomen | |
| AbdomenPrint | 0.61 | 0.60 | 0.62 |
|---|---|---|---|
| MSPNet | 0.69 | 0.61 | 0.74 |
3.2 Visualization of the Shape Feature Spaces
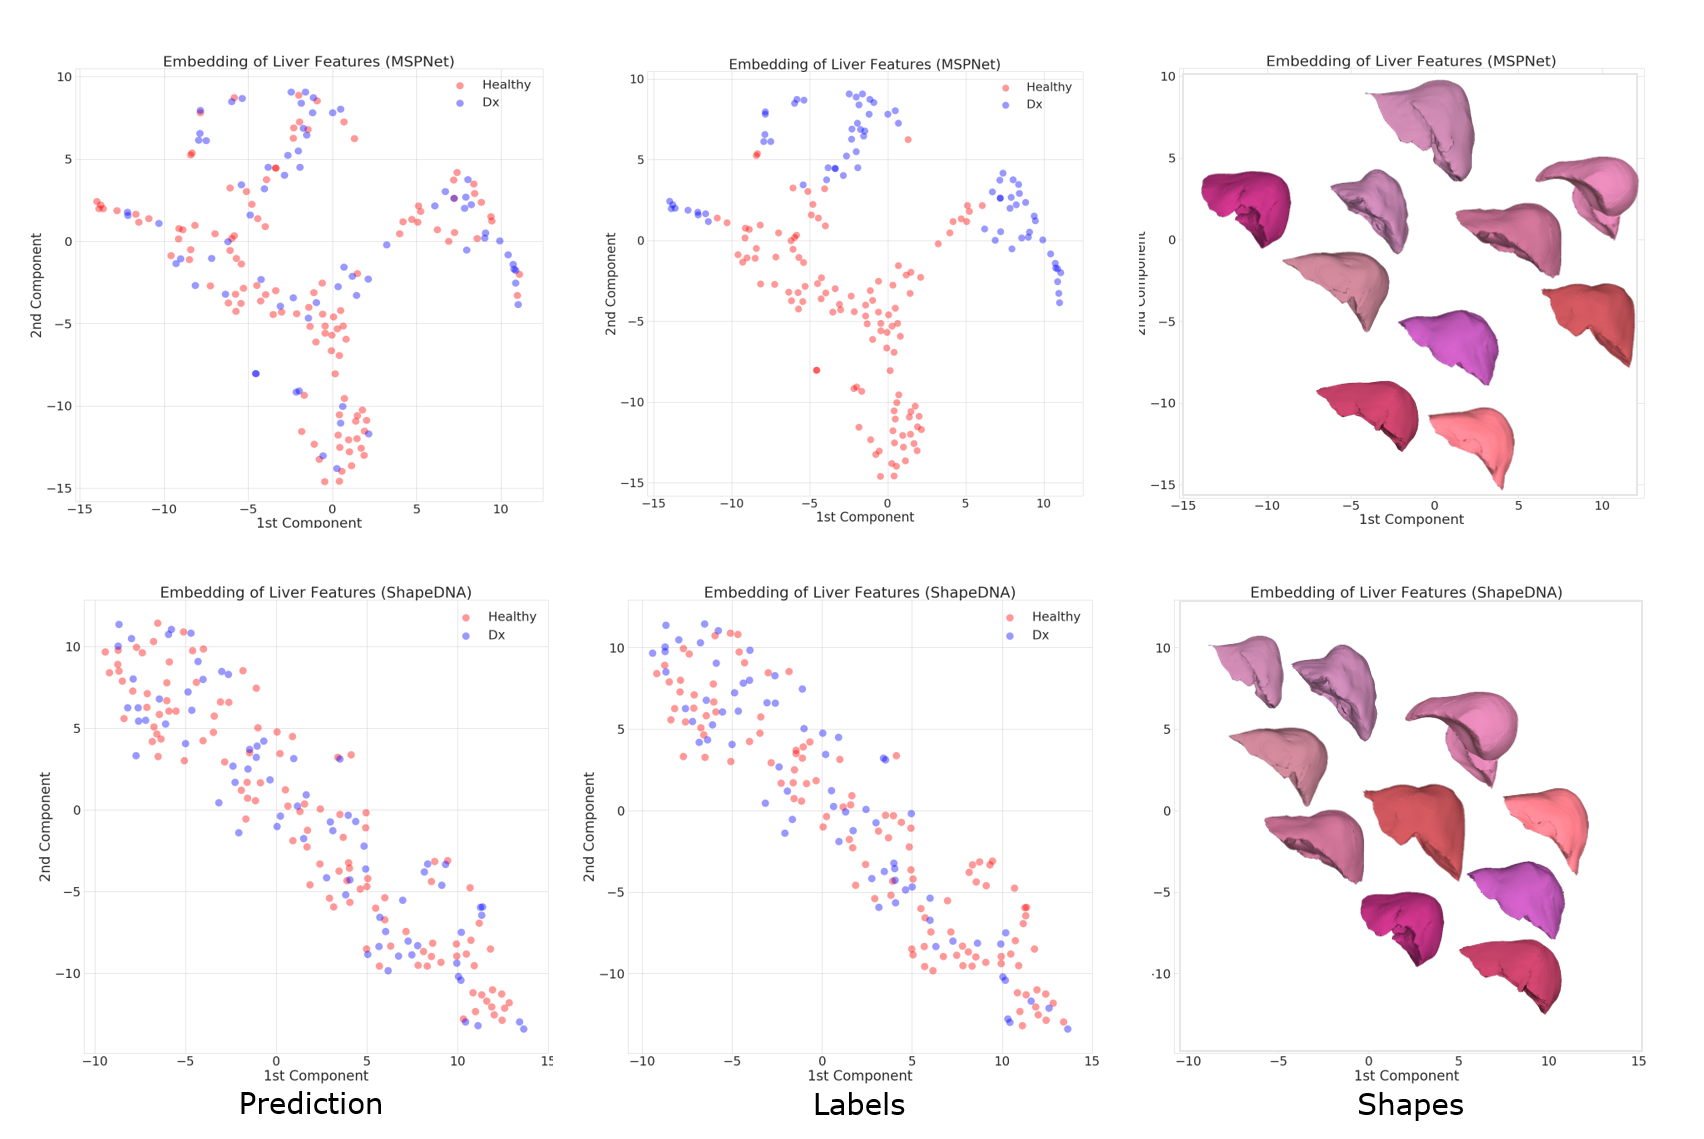
One of the main advantages of using representations that are trained in an end-to-end fashion for classification is that the obtained shape representation is specifically optimized for a particular task. In the case of MSPNet, we expect the shape descriptors to lie on a space where shapes of organs of healthy patients are clustered close to each other and separated to the shapes of organs of patients diagnosed with diabetes. To have a better understanding of the properties of these learned representations, we visualize 2D projections of the shape descriptors by embedding them into a two dimensional space using t-Distributed Stochastic Neighbor Embedding (t-SNE) [12]. These embeddings can be observed in figure 4, where we present embeddings on the 2D space for the liver using both AbdomenPrint and MSPNet. In this figure we can observe that the feature space obtained using MSPNet leads to clusters which group together either healthy subjects or individuals diagnosed with pre-diabetes or diabetes. This can be explained by the fact that the shape descriptors of MSPNet are specifically optimized for the separation between these two classes as opposed to AbdomenPrint, which uses standard descriptors that are not targeted to a specific task.
4 Conclusions
We have proposed the use of a deep learning based representation for the morphological analysis of abdominal organs, and we have applied this representation for the task of diabetes classifications. Our results show that the use of learning representations based on deep networks have the potential to uncover shape deformations correlated to disease, and potentially to other factors. Compared to other methods, which rely on engineered features, the shape descriptors learned by MSPNet are optimized for the task of diabetes classification and are based on a simple point cloud representation without the need of calculating meshes or finding points correspondences between subjects.
4.1 Acknowledgments.
This work was supported in part by DFG, SAP SE and the Bavarian State Ministry of Education, Science and the Arts in the framework of the Centre Digitalisation.Bavaria (ZD.B).
References
- [1] Cole, J.H., Franke, K.: Predicting age using neuroimaging: Innovative brain ageing biomarkers. Trends in neurosciences (2017)
- [2] Cootes, T., Taylor, C., Cooper, D., Graham, J.: Active Shape Models-Their Training and Application. Comput. Vis. Image Underst. 61(1), 38–59 (jan 1995)
- [3] Dura, E., Domingo, J., Ayala, G., Marti-Bonmati, L., Goceri, E.: Probabilistic liver atlas construction. Biomedical engineering online 16(1), 15 (2017)
- [4] Gerardin, E., Chételat, G., Chupin, M., Cuingnet, R., Desgranges, B., Kim, H.S., Niethammer, M., Dubois, B., Lehéricy, S., Garnero, L., et al.: Multidimensional classification of hippocampal shape features discriminates alzheimer’s disease and mild cognitive impairment from normal aging. Neuroimage 47(4), 1476–1486 (2009)
- [5] Gorczowski, K., Styner, M., Jeong, J.Y., Marron, J., Piven, J., Hazlett, H.C., Pizer, S.M., Gerig, G.: Statistical shape analysis of multi-object complexes. In: Computer Vision and Pattern Recognition, 2007. pp. 1–8 (2007)
- [6] Gutierrez-Becker, B., Klein, T., Wachinger, C., Initiative, A.D.N., et al.: Gaussian process uncertainty in age estimation as a measure of brain abnormality. NeuroImage 175, 246–258 (2018)
- [7] Gutierrez-Becker, B., Wachinger, C.: Deep multi-structural shape analysis: Application to neuroanatomy. In: International Conference on Medical Image Computing and Computer Assisted Interventions (2018), https://arxiv.org/abs/1806.01069
- [8] Heimann, T., Meinzer, H.P.: Statistical shape models for 3d medical image segmentation: a review. Medical image analysis 13(4), 543–563 (2009)
- [9] Hori, M., Okada, T., Higashiura, K., Sato, Y., Chen, Y.W., Kim, T., Onishi, H., Eguchi, H., Nagano, H., Umeshita, K., Wakasa, K., Tomiyama, N.: Quantitative imaging: Quantification of liver shape on CT using the statistical shape model to evaluate hepatic fibrosis. Acad. Radiol. 22(3), 303–309 (2015), http://dx.doi.org/10.1016/j.acra.2014.10.001
- [10] Kohara, S., Tateyama, T., Foruzan, A.H., Furukawa, A., Kanasaki, S., Wakamiya, M., Chen, Y.w.: Application of statistical shape model to diagnosis of liver disease. Softw. Eng. Data Min. (SEDM), 2010 2nd Int. Conf. (1), 680–683 (2010)
- [11] Lamecker, H., Lange, T., Seebass, M.: Segmentation of the liver using a 3d statistical shape model (2004)
- [12] Maaten, L.v.d., Hinton, G.: Visualizing data using t-sne. Journal of machine learning research 9(Nov), 2579–2605 (2008)
- [13] Miller, M.I., Younes, L., Trouvé, A.: Diffeomorphometry and geodesic positioning systems for human anatomy. Technology 2(01), 36–43 (2014)
- [14] Mukherjee, D.P., Higashiura, K., Okada, T., Hori, M., Chen, Y.W., Tomiyama, N., Sato, Y.: Utilizing disease-specific organ shape components for disease discrimination: Application to discrimination of chronic liver disease from CT data. Lect. Notes Comput. Sci. (including Subser. Lect. Notes Artif. Intell. Lect. Notes Bioinformatics) 8149 LNCS(PART 1), 235–242 (2013)
- [15] Organization, W.H., et al.: Definition, diagnosis and classification of diabetes mellitus and its complications: report of a who consultation. part 1, diagnosis and classification of diabetes mellitus (1999)
- [16] Qi, C.R., Su, H., Mo, K., Guibas, L.J.: Pointnet: Deep learning on point sets for 3d classification and segmentation. Proc. Computer Vision and Pattern Recognition (CVPR), IEEE 1(2), 4 (2017)
- [17] Reuter, M., Wolter, F.E., Peinecke, N.: Laplace–beltrami spectra as ‘shape-dna’of surfaces and solids. Computer-Aided Design 38(4), 342–366 (2006)
- [18] Tateyama, T., Foruzan, A., Chen, Y.W.: PCA based statistical shape model of the spleen. 5th Int. Conf. Nat. Comput. ICNC 2009 6(January) (2009)
- [19] Valizadeh, S., Hänggi, J., Mérillat, S., Jäncke, L.: Age prediction on the basis of brain anatomical measures. Human brain mapping 38(2), 997–1008 (2017)
- [20] Wachinger, C., Golland, P., Kremen, W., Fischl, B., Reuter, M.: Brainprint: a discriminative characterization of brain morphology. NeuroImage 109, 232–248 (2015)
- [21] Wachinger, C., Nho, K., Saykin, A.J., Reuter, M., Rieckmann, A.: A longitudinal imaging genetics study of neuroanatomical asymmetry in alzheimer’s disease. Biological psychiatry (2018)
- [22] Wachinger, C., Reuter, M.: Domain adaptation for alzheimer’s disease diagnostics. Neuroimage 139, 470–479 (2016)
- [23] Wachinger, C., Salat, D.H., Weiner, M., Reuter, M.: Whole-brain analysis reveals increased neuroanatomical asymmetries in dementia for hippocampus and amygdala. Brain 139(12), 3253–3266 (2016)
- [24] Yates, K.M., Lu, Y.C., Untaroiu, C.D.: Statistical shape analysis of the human spleen geometry for probabilistic occupant models. J. Biomech. 49(9), 1540–1546 (2016), http://dx.doi.org/10.1016/j.jbiomech.2016.03.027