Microscopic effects of Dy-doping in the topological insulator Bi2Te3
Abstract
Magnetic doping with transition metal ions is the most widely used approach to break time-reversal symmetry in a topological insulator (TI) — a prerequisite for unlocking the TI’s exotic potential. Recently, we reported the doping of Bi2Te3 thin films with rare earth ions, which, owing to their large magnetic moments, promise commensurately large magnetic gap openings in the topological surface states (TSS). However, only when doping with Dy has a sizable gap been observed in angle-resolved photoemission spectroscopy, which persists up to room-temperature. Although disorder alone could be ruled out as a cause of the topological phase transition, a fundamental understanding of the magnetic and electronic properties of Dy-doped Bi2Te3 remained elusive. Here, we present an X-ray magnetic circular dichroism, polarized neutron reflectometry, muon spin rotation, and resonant photoemission (ResPE) study of the microscopic magnetic and electronic properties. We find that the films are not simply paramagnetic but that instead the observed behavior can be well explained by the assumption of slowly fluctuating, inhomogeneous, magnetic patches with increasing volume fraction as the temperature decreases. At liquid helium temperatures, a large effective magnetization can be easily introduced by the application of moderate magnetic fields, implying that this material is very suitable for proximity coupling to an underlying ferromagnetic insulator or in a heterostructure with transition metal-doped layers. However, the introduction of some charge carriers by the Dy-dopants cannot be excluded at least in these highly doped samples. Nevertheless, we find that the magnetic order is not mediated via the conduction channel in these rare earth doped samples and therefore magnetic order and carrier concentration are expected to be independently controllable. This is not generally the case for transition metal doped topological insulators.
pacs:
75.30.Hx; 78.70.Dm; 75.50.Pp; 73.61.NgI Introduction
Three-dimensional (3D) topological insulators (TIs) Kane and Mele (2005); Fu et al. (2007); Qi et al. (2008); Zhang et al. (2009) have captured the attention of the condensed matter physics community owing to the intriguing properties of their spin-momentum locked topological surface states (TSSs). The TSS is protected by time-reversal symmetry (TRS), making it robust against backscattering from non-magnetic impurities Roushan et al. (2009). To observe exotic quantum phenomena such as the quantum anomalous Hall effect (QAHE) Yu et al. (2010); Liu et al. (2008); Wang et al. (2014, 2013); Liu et al. (2013), TRS has to be broken and a controlled gap has to be introduced in the linearly dispersing TSS Dirac cone. This is achieved by doping with magnetic impurities He et al. (2014), which means that the QAHE can be observed in the absence of an applied magnetic field. Long-range ferromagnetically ordered TIs exhibit a finite gap of tens of meV at the Dirac point Yu et al. (2010), transforming the massless Dirac Fermion state to a massive one Chen et al. (2010); Sengupta and Klimeck (2015).
Ferromagnetic doping in the common 3D TIs Bi2Se3 and Bi2Te3 is focused on the transition metal ions such as Cr Haazen et al. (2012); Collins-McIntyre et al. (2014) or Mn Chen et al. (2010); Zhang et al. (2012); Watson et al. (2013) or V Chang et al. (2013, 2015). In Cr- and V-doped (Bi,Sb)2Te3 thin films, the QAHE has been observed at mK temperatures Chang et al. (2013, 2015), despite a magnetic ordering temperature in those samples of 15 K in case of Cr doping Chang et al. (2013) and about twice the value for V doping Chang et al. (2015). This highlights an important problem for the QAHE: The deterioration of the electric transport properties through the presence of magnetic doping, often attributed to the presence of non-topological impurity bands near the Fermi-surface which allow bulk conduction Peixoto et al. (2016); Krieger et al. (2017). In consequence, very low temperatures are necessary, both to enhance magnetic order and to suppress the dissipative transport channels Kou et al. (2014). In order to minimize the adverse effects of the magnetic impurities, low doping concentrations are desirable. As the size of the Dirac gap increases with the magnetic moment Chen et al. (2010), the doping concentration can be reduced by using a larger magnetic moment.
In our recent work, we have shown that rare earth (RE) ions, such as the high moment ions Ho Harrison et al. (2015a) and Dy Harrison et al. (2014a, 2015b, 2015c) with effective magnetic moments () of up to 10.65 , can be used to dope thin films of Bi2Te3 up to 35% (in % of the Bi sites for substitutional doping) without loss of crystalline quality. Furthermore, as shown for Gd-doped Bi2Te3 thin films Harrison et al. (2014a), the isoelectronic substitutional doping of RE3+ ions on Bi sites should not introduce any additional charge carriers.
Owing to their well-shielded shells, RE ions behave like isolated magnetic moments and the materials thus remain paramagnetic Jensen and Mackintosh (1991). Despite this absence of long-range ferromagnetic order in Dy-doped Bi2Te3, we have observed a gapped TSS band in angle-resolved photoemission spectroscopy (ARPES) up to room-temperature Harrison et al. (2015c), which is unexpected but not unprecedented Xu et al. (2012); Franz and Molenkamp (2013). In fact, in Cr:Bi2Se3 thin films, a gapped TSS has also been observed in the absence of long-range ferromagnetic order, which the authors attributed to the inhomogeneous doping and the formation of Cr clusters which lead to short-range ferromagnetic order Chang et al. (2014). This illustrates the important role disorder and subsequent impurity scattering appears to play in magnetically doped TIs in general Alpichshev et al. (2012); Black-Schaffer and Balatsky (2012).
The experimentally determined gap sizes in Mn-doped Bi2Se3 and Bi2Te3 are well above the values predicted by theory, and the gap opening persist to temperatures well above the magnetic transition temperatures Henk et al. (2012); Xu et al. (2012), casting doubts on their magnetic origins. However, in RE-doped Bi2Te3 thin films, we only found a gap opening in the case of Dy doping Harrison et al. (2015c), but not for Ho- or Gd-doping, despite the very similar structural properties (at the same doping levels) Li et al. (2013); Harrison et al. (2014a, b). It appears that the microscopic nature of Dy doping is more complex, as evidenced by its magnetic properties as well Harrison et al. (2015b).
Here we report a microscopic study of the magnetic properties of Dy-doped Bi2Te3 thin films using x-ray circular magnetic dichroism (XMCD), polarized neutron reflectometry (PNR), and muon-spin rotation (SR), and of the effect of Dy-doping on the electronic band structure using soft x-ray ARPES. Temperature and magnetic-field dependent XMCD at the edges of Dy and Te give insight into the magnetic ordering and coupling in the films, whereas PNR allows for a precise determination of the doping concentration and the effective magnetization of the material as a function of depth Marrows et al. (2009). SR is a well-established technique to study local magnetic order, which has been very successful for understanding dilute magnetic semiconductors Saadaoui et al. (2016); Dunsiger et al. (2010). Finally, we used soft x-ray ARPES to gain chemical selectivity for the study of the electronic characteristics of Dy dopants in Bi2Te3.
We find that Dy-doped Bi2Te3, while not ferromagnetic itself, offers a large, induced magnetic polarization at small external fields with slow fluctuations of the very large moments. We see some evidence for dopant induced excitations close to the Fermi energy but no evidence that these contribute to the (short range) magnetic ordering. These properties make Dy-doped TIs interesting materials for use as functional layers in complex TI heterostructures.
II Experimental Methods
Sample growth and previous characterization: (DyxBi1-x)2Te3 thin films, with denoting the substitutional Dy concentration (as a fraction of the Bi sites), were grown by molecular beam epitaxy (MBE) on Al2O3(0001) (-plane sapphire) substrates Harrison et al. (2015b). The rhombohedral films were prepared using a two-step growth recipe with substrate temperatures of 250∘C and 300∘C. The films are free of secondary phases as confirmed by x-ray diffraction. Using in situ reflection high-energy electron diffraction (RHEED) we confirmed that streak-like diffraction patterns remained observable during growth. The growth recipe and the structural properties of the films are described in detail in Refs. Harrison et al. (2015b, c). The films investigated there had a Dy concentration of and 0.113.
For the lower Dy concentration, the TSS bandstructure remains intact and shows a linear dispersion, whereas for the higher concentration a sizable gap was observed in ARPES Harrison et al. (2015c), suggesting a possible change in magnetic properties.
X-ray spectroscopy: X-ray absorption spectroscopy (XAS) and x-ray magnetic circular dichroism (XMCD) measurements were carried out at beamline ID32 Kummer et al. (2016) at the European Synchrotron Radiation Facility (ESRF), Grenoble (France). All measurements were performed on an in-situ cleaved sample (the same sample as used for the neutron measurements) in total-electron-yield (TEY) mode, giving a sampling depth of the order of 3-5 nm. We studied the Te and the Dy edges as a function of temperature and in-plane applied magnetic field.
Polarized neutron reflectometry: The structural and magnetic depth profiles of two samples with high Dy concentration were explored using polarized neutron reflectometry (PNR) without polarization analysis at the Polref beamline at the ISIS neutron and muon source (Rutherford Appleton Laboratory, UK). Measurements were carried out at room temperature and low temperatures (3 K and 5 K) and low and high magnetic fields (0.02 T and 0.7 T), applied in the sample plane, parallel to the neutron spin polarization. Reflectivity curves were acquired for the two spin eigenstates (commonly referred to as spin-up and spin-down) of the incoming beam. In this configuration the reflectivity measurement is sensitive to the structural depth profile as well as the magnetic component parallel to the applied field. In particular the neutron senses the total magnetic induction as a function of depth within the sample. Model fitting was carried out using the GenX package Björck and Andersson (2007) based on an optical transfer matrix approach Blundell and Bland (1992) and a differential evolution fitting algorithm.
Muon spin spectroscopy: Transverse and longitudinal field muon-spin rotation (SR) measurements were carried out using the low-energy muon (LEM) beamline at SS Prokscha et al. (2008). The LEM beamline produces very slow, spin-polarized, positive muons with tunable energies between 0 and 30 keV Morenzoni et al. (2004, 2002). Muon spin spectroscopy is a very sensitive probe of the local (but not element specific) magnetic order. Dynamics can be probed on the timescale. For the measurements, the samples were glued to a Ni plated Al sample holder with a small magnetic field applied perpendicular to the surface of the sample. Measurements were made on two Dy:Bi2Te3 films of different Dy concentrations, one of which is equivalent to the one used for XMCD and PNR. All data analysis was carried out using the WiMDA program Pratt (2000).
Soft x-ray angle resolved photoemission spectroscopy: Soft x-ray ARPES measurements were performed at the ADRESS beamline of the Swiss Light Source at the Paul Scherrer Institut, Switzerland Strocov et al. (2010). The experiment was carried out with linear horizontal polarized light at a pressure below 10-10 mbar and temperatures below 11.5 K on the same sample that was investigated in the SR experiment. The sample was in-situ cleaved before the measurements. The combined analyzer and beamline resolution at photon energies around 1.3 keV was better than 170 meV. The ARPES setup is described elsewhere Strocov et al. (2014). Supporting XAS measurements were conducted by measuring the TEY.
III Results
III.1 Structural properties
The structural properties of the samples investigated here are commensurate with those reported in our previous investigations Harrison et al. (2014a, 2015b): X-ray diffraction measurements show single phase diffraction patterns with no contamination phases even at the highest doping concentration of . The -axis lattice parameter shifts slightly from Å in an undoped Bi2Te3 thin film grown in the same chamber to 30.7 Å for the main sample under investigation (). As the ionic radius of Dy3+ (105 pm) is similar, but slightly smaller than that of the host cation Bi3+ (117 pm), a fraction of the Dy does not dope substitutionally, but is instead likely to accumulate in the van der Waals gap.
Neutron reflectivity measurements are sensitive to the replacement of Bi ions by Dy as the bound coherent nuclear scattering length, , is much stronger for Dy ( fm) than for Bi ( fm). We are able to estimate the doping concentration from the fits of the high temperature polarized neutron data to for the main sample under investigation and to for the more highly doped sample, i.e., and , respectively. In our estimate of the Dy concentration we make use of the assumption that the accumulation in the van der Waals gap does not significantly alter the number of atoms present per unit volume (the increased number of atoms in the gap is offset mostly by the expansion of the lattice). As previously reported Harrison et al. (2014a, 2015b), the crystal structure is stable even when incorporating high concentrations of Dy with both substitution and accumulation in the van der Waals gap, but without the formation of parasitic phases.
III.2 Magnetic behavior
The overall magnetic properties of the films were measured using bulk-sensitive superconducting quantum interference device (SQUID) magnetometry and are similar to those reported in Ref. Harrison et al. (2015b). The magnetization vs temperature curve shows paramagnetic behavior and no opening in the hysteresis loop is observed, with saturation occurring near 3 T at 1.8 K.
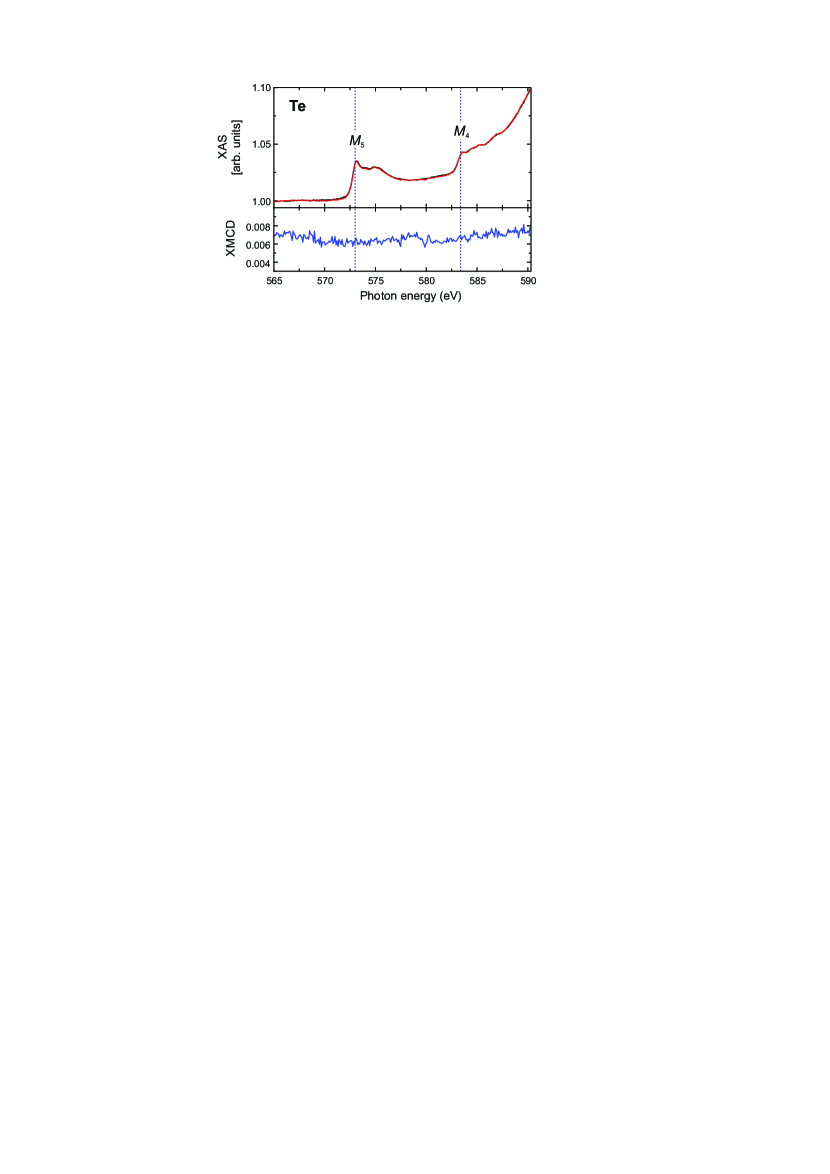
The temperature-dependent magnetic response was investigated using XMCD at the Dy edges. There is a clear XMCD signal at 4 K under an applied field of 2 T, see Fig. 1. Determining the asymmetry at the peak maximum to be , and comparing it to the theoretical value calculated for the Dy Hund’s rule ground state which has an effective magnetic moment /atom Figueroa et al. (2017), we obtain /atom (31% of the value) at 4 K in a field of 2 T. XMCD measurements at the Te edges at the same temperature in an applied field of 8 T showed no measurable response, see Fig. 2.
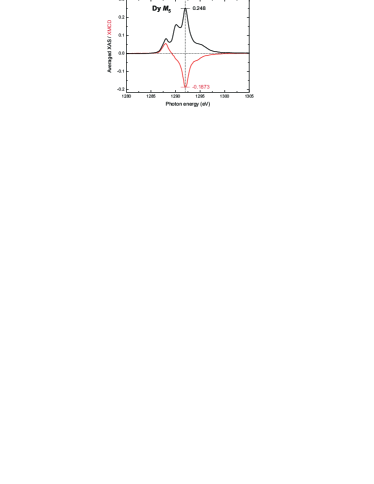
We carried out XMCD measurements at the Dy edge as a function of temperature. The temperature-dependent magnetization curves, vs. Arrott plots (not shown) do not follow a linear behavior and no evidence for a ferromagnetic transition was observed, consistent with Figueroa et al. (2017).
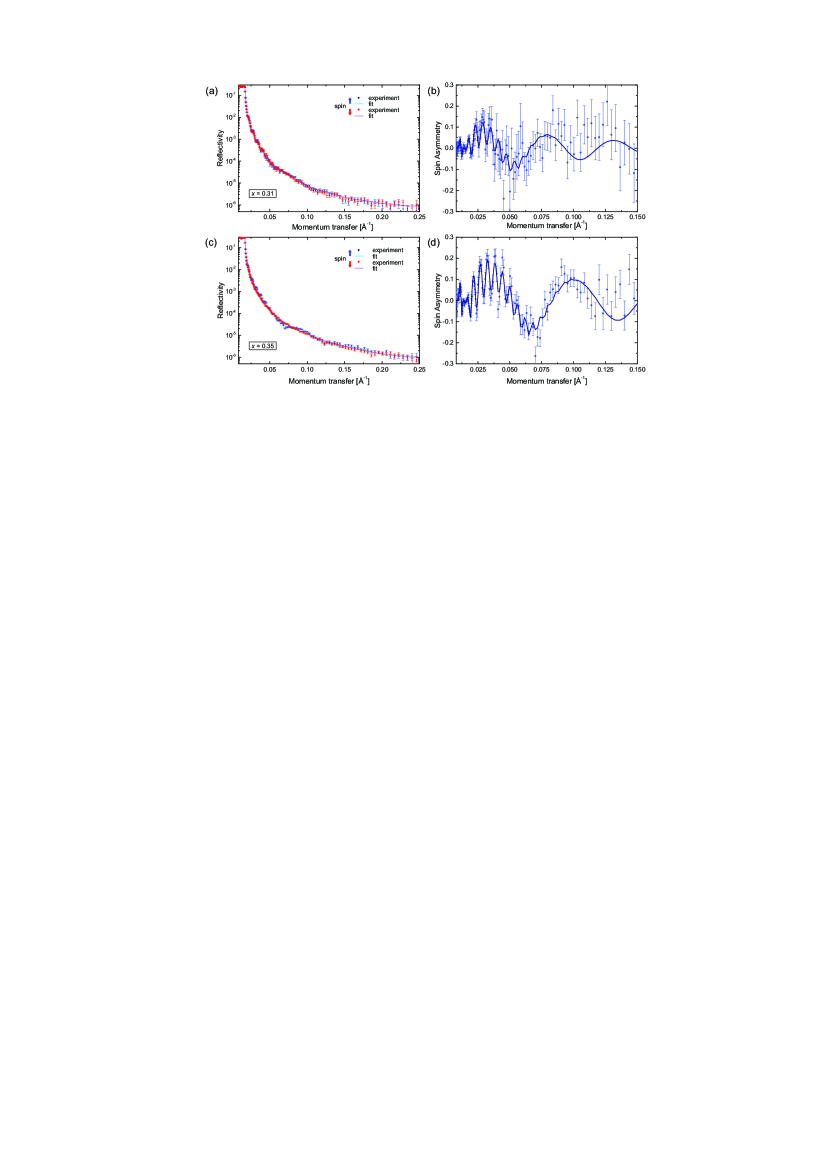
PNR is sensitive to the overall magnetic field in the sample, and for a typical paramagnet away from any phase transitions and in moderate applied fields the total internal field remains too weak too be detectable by neutron reflectometry. In contrast, the samples under investigation here show a clear magnetic response at moderate applied fields, 0.7 T, and low temperature, 3 K and 5 K, respectively. Figures 3(a,c) show the reflectivity curves for the two Dy-doped samples with clear spin splitting in both samples and sizable spin asymmetries, see Figs. 3(b,d). Sizable oscillations are present with maximum amplitudes around 0.15 and 0.2. The effective magnetic moment measured along the quantization axis of the neutron is 1.7 per Dy atom for . For the sample at 3 K the magnetic response is even higher, 2.8 per Dy atom, likely because of the lower measurement temperature. The model fits give an even magnetization throughout the doped layers. The measurements clearly show that a large effective magnetization, here more than of the full Dy-moment, can be induced even though the TI does not itself order ferromagnetically at these temperatures.
SR measurements reveal a complex picture: Transverse field measurements were made on a different film as a function of temperature and implantation energy in a small applied field of mT. The general behavior is that, (i) oscillations occur at frequencies corresponding to magnetic fields close to the applied field ; (ii) the oscillation amplitude remains nearly constant upon cooling from 300 K to 175 K, then it decreases steadily down to 25 K and saturates below this temperature, see Fig. 4(a); (iii) the relaxation rate of the oscillation is seen to remain fairly small until the sample is cooled below 100 K, at which point it increases until around 25 K, below which it remains high, see Fig. 4(b). A second sample with approximately three times lower doping concentration was measured with qualitatively the same behavior. Additional zero field measurements also do not show evidence of long range magnetic order.
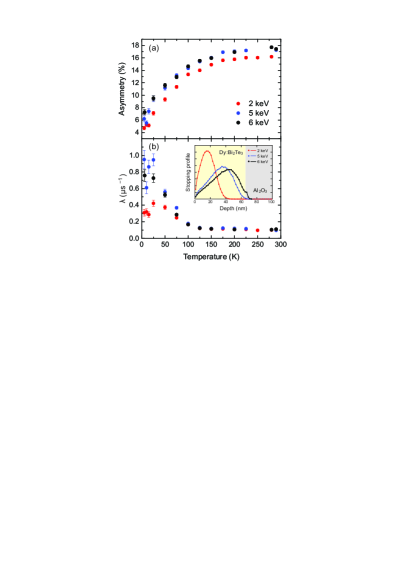
The decrease in the oscillation amplitude is consistent with the sample giving rise to a magnetic response, whose volume fraction increases as the temperature decreases. More specifically, the sample appears to contain paramagnetic regions and islands of static magnetism, on the (s) timescale, which itself might contain some degree of frozen disorder or short range order. Alternatively, this behavior would also be commensurate with fluctuating spins in a paramagnetic environment, which slow down as the temperature decreases. However, supporting longitudinal field measurements (not shown) indicate that the sample contains some regions that give rise to static local magnetic fields. This picture is also consistent with the PNR measurements (see Section IV). From similar SR investigations Steinke et al. (2018) we know that the residual asymmetry that can be achieved for samples grown in our MBE chamber on Al2O3 substrates and Ni sample plates is of the order of 1-3 % for a sample that has more or less fully developed magnetic order. The larger low temperature asymmetry-amplitude in our Dy-doped sample then points towards a fraction of the sample in which no magnetic order develops, i.e. the regions between the islands. A qualitatively similar behavior has been observed for transition metal (V and Cr) doped TIs where the ferromagnetic transition proceeds by the formation of ferromagnetic patches and where it was shown that very slow fluctuations persist well below the Krieger et al. (2017); Lachman et al. (2015); Steinke et al. (2018). However, in those materials, a clear ferromagnetic transition with a well-defined was observed. This is not the case for Dy-doped samples.
The residual relaxation rate of the slowly relaxing component, Fig. 4(b), increases below 100 K as the amplitude decreases, also consistent with an increase in the static or dynamic disorder. These are both reflected in the relaxation rate. Interestingly, there is a depth dependence to the residual relaxation rate with a maximum around 5 keV in the center of the film, as can be seen in Fig. 4(b), and as confirmed by a more detailed depth-dependent scan at 5 K (not shown). This implies that the field distribution is not uniform as a function of depth in the film.
III.3 Electronic properties
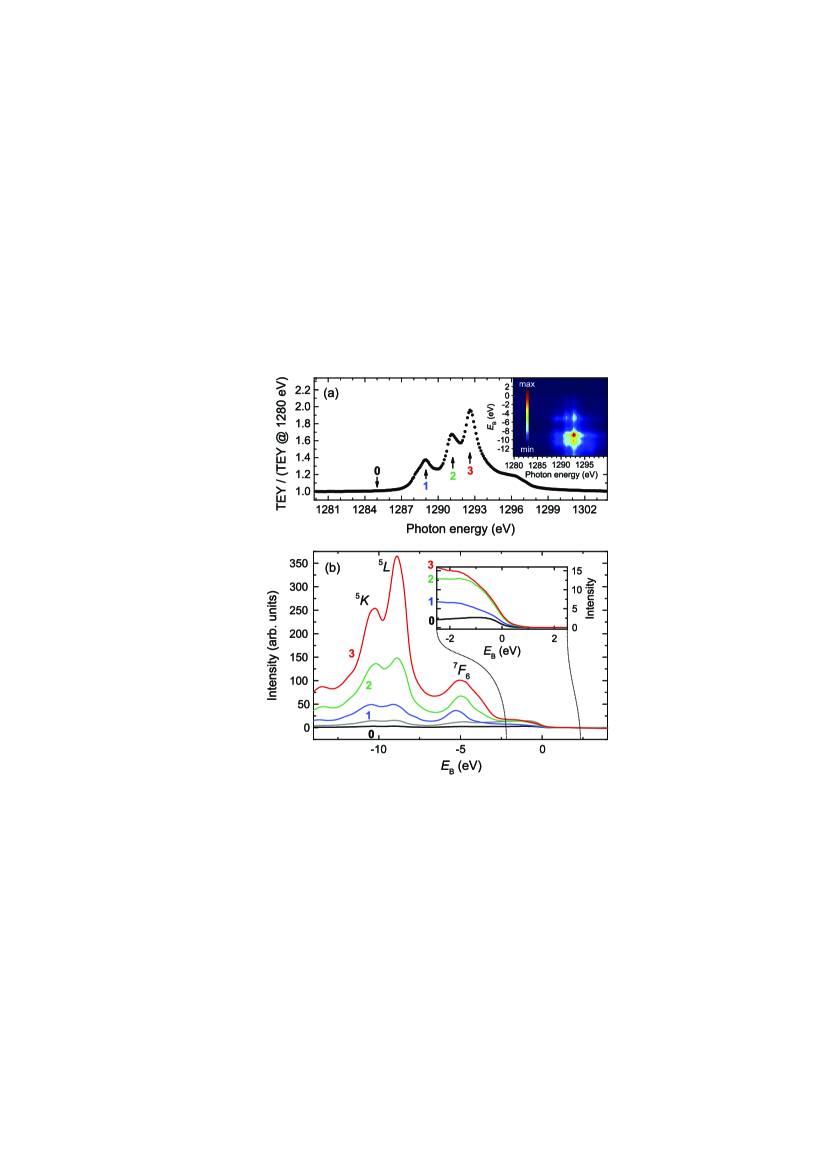
The XAS spectrum at the Dy edge (see also Fig. 1) is shown in Fig. 5(a) together with the corresponding resonant photoemission (ResPE) intensity map as a function of photon and electron binding energies. We restrict our analysis here to angle-integrated PE data because angle-resolved measurements show only a negligible -dependence, which may be due to the disorder introduced by the doping. Scanning of the photon energy across the Dy absorption edge allows for resonant photoemission, where after an initial x-ray absorption, the core-hole excitation decays emitting an electron. For further details see Appendix A. The XAS and ResPE spectra exhibit a linear dichroism at the peak marked with the label 2 upon changing from - to -polarized incident X-rays (not shown). A similar dichroism in XAS has previously been reported in non-ferromagnetic Dy Sacchi et al. (1991, 1992). Further details of our data are revealed in Fig. 5(b) which presents cuts of the ResPE intensity at photon energies corresponding to the individual peaks of the XAS spectrum shown in Fig. 5(a). The peaks shown in Fig. 5(b) at the binding energies of , , and eV correspond to the multiplet states , , and , respectively, which in photoemission are accessible from the () ground state (see Ref. van der Laan and Thole (1993)). Excitation at the photon energy of a deep core level enhances specific direct photoemission peaks by two orders of magnitude, where the intensities are governed by the dipole matrix elements. The lower energy peak (#1) in the Dy XAS favors decay into high-spin (septet) final states, whereas the higher energy XAS peaks (#2 and #3) favor low-spin (quintet) final states. The structure between and eV therefore confirms the local atomic information about the Dy ions. However, if valence states have an admixture of Dy weight, they will show an intensity increase at energies near the Fermi level beyond the multiplet region. We find that there is indeed a small resonant enhancement of the spectral weight at in the inset of Fig. 5(b). The possible presence of Dy excitations close to can induce charge carriers. We note that the sample under investigation here is very highly doped and includes not only substitutional dopants but also Dy accumulation in the van der Waals gap. We are unable to separate the contributions from these two sites.
IV Discussion
Despite the lack of a ferromagnetic transition, our samples display a large internal magnetic field at moderate applied fields and low temperatures; more than of the full Dy magnetization at 3 K and 0.7 T. PNR is a static measurement and so the moments extracted are due to a net increase of the alignment of the Dy-moments with the external field and not due to a slowing of the fluctuations of these moments. The gradual decrease of the asymmetry with temperature in the SR data reflects the increase of the magnetic volume fraction which we therefore attribute to the formation of magnetically ordered islands embedded in a paramagnetic environment. Below 25 K the magnetic volume fraction remains constant, at least down to liquid He temperatures. The SR slow relaxation rate probes the field distribution inside the paramagnetic region of the sample. It similarly increases smoothly with decreasing temperature, before reaching a maximum at around 25 K and then remaining high, but with large scatter. This implies an increase in the width of the magnetic field distribution (implying an increase in the magnetic fields) in the paramagnetic region and/or a slowing down of the fluctuation rate of those fields. The magnetic fields in the paramagnetic region can be attributed to the stray fields emanating from the magnetically ordered islands. Again the sizable static magnetization seen in the PNR data is commensurate with an increase in the net magnetic fields but of course a slowing down of the fluctuation rate may also be present.
We also note that there is a large difference in the effective magnetic moment per Dy-atom in the PNR measurements between 5 K and 3 K, albeit on different samples (see discussion below), whereas the magnetic volume fraction seen in the SR-asymmetry remains constant below 25 K. This is also consistent with the picture of inhomogeneous islands of some magnetic order, where the Dy-spins order sufficiently below 25 K to fully depolarize the spin of the implanted muons, and of interstitial regions where no magnetic order is present. The muons stopping in the islands no longer contribute to the precession signal. But it is precisely the degree of alignment within (and between) the islands that will give rise to the internal magnetic field that is measured with neutron reflectometry.
As discussed in detail in Ref. Harrison et al. (2015b), the saturation magnetization of Dy-doped samples is strongly doping concentration-dependent, with a strongly decreasing moment for higher doped samples. This implies that the magnetic behavior stems from the substitutional Dy ions rather than the residual accumulations in the van der Waals gap. It is for this reason that we ascribe the majority of the sizable difference in the magnetization measured by PNR to the different acquisition temperatures.
In contrast to the clear magnetic response on the Dy site, our XMCD measurements could not detect any magnetic signal on the Te site. This is in clear contrast to transition metal doped ferromagnetic TIs where such measurements have shown a measurable polarization on the anion site, confirming a conduction band mediated magnetic response in those systems Duffy et al. (2017a); Ye et al. (2015); Duffy et al. (2017b) that is absent in the Dy-doped case. Despite this, our ResPE results provide some evidence for possible dopant-induced charge carriers, but these do not seem to contribute to the magnetic ordering as evidenced by the XMCD results. The samples under investigation here are, however, highly doped and lower doping might significantly reduce or perhaps eliminate these additional excitations. As reported in Ref. Harrison et al. (2015c), we were able to observe a sizable band gap at doping concentrations nearly lower than those investigated here. In addition, the similar ionic radii of Dy3+ and Bi3+ should also reduce the number of structural defects the dopant introduces. These can also lead to additional charger carriers.
V Conclusion
In conclusion, we have shown that the rare earth element Dy is an interesting dopant for 3D TIs. The structure is robust, even for high levels of doping, and no ferromagnetic impurity phases are formed. The Dy-doped TIs are not fully ferromagnetic but instead display complex, short range and inhomogeneous magnetic order. Nevertheless, PNR has clearly shown that a large effective magnetization can be induced. This can be easily exploited in proximity-coupled heterostructures, rather than using external applied fields as used in this study. While the use of Dy as a dopant does not rule out the presence of dopant-induced charge carriers, these do not stabilize the magnetic order. Therefore independent control of these two essential parameters for QAHE applications should be feasible in Dy-doped TI based heterostructures.
Acknowledgements.
We thank the ISIS neutron source (doi:10.5286/ISIS.E.82353238) and the Swiss muon source for beamtime, and we acknowledge XMCD beamtime on ID32 at the European Synchrotron Radiation Facility (ESRF) awarded under proposal HC-2718. T.H. acknowledges funding from the John Fell Fund (University of Oxford) and thanks RCaH for their hospitality. L.D. acknowledges financial support STFC (UK) and T. L and L. D. from EPSRC (UK). J.A.K., Z.S. and V.N.S. acknowledge support from the Swiss National Science Foundation (SNF-Grant No. 200021_165910).Appendix A: Resonant photoemission at the Dy absorption edge
Scanning the photon energy across the Dy absorption edge allows for resonant photoemission. For Dy, this second-order process of an initial x-ray absorption and the core-hole excitation decay emitting an electron is given using multi-electronic configurations as , which is in resonance with the direct photoemission process , where is a continuum state. This process enhances the Dy contributions to the total PES spectral weight Molodtsov et al. (1997); Kobayashi et al. (2014). In the case of rare-earth elements, the strongly localized -electrons are highly correlated, and the spectrum observed by photoemission can be described in the limit of localized atomic multiplet excitations Arenholz et al. (1995); Taguchi et al. (2003). The resulting spectrum is dominated by the large - Coulomb interactions, which for Dy splits the final state into a multiplet 10 eV wide (see Refs. van der Laan and Thole (1993); van der Laan et al. (1999)).
References
- Kane and Mele (2005) C. L. Kane and E. J. Mele, Phys. Rev. Lett. 95, 146802 (2005).
- Fu et al. (2007) L. Fu, C. L. Kane, and E. J. Mele, Phys. Rev. Lett. 98, 106803 (2007).
- Qi et al. (2008) X. L. Qi, T. L. Hughes, and S. C. Zhang, Phys. Rev. B 78, 195424 (2008).
- Zhang et al. (2009) H. Zhang, C.-X. Liu, X.-L. Qi, X. Dai, Z. Fang, and S.-C. Zhang, Nat. Phys. 5, 438 (2009).
- Roushan et al. (2009) P. Roushan, J. Seo, C. V. Parker, Y. Hor, D. Hsieh, D. Qian, A. Richardella, M. Z. Hasan, R. Cava, and A. Yazdani, Nature 460, 1106 (2009).
- Yu et al. (2010) R. Yu, W. Zhang, H.-J. Zhang, S.-C. Zhang, X. Dai, and Z. Fang, Science 329, 61 (2010).
- Liu et al. (2008) C. X. Liu, X. L. Qi, X. Dai, Z. Fang, and S. C. Zhang, Phys. Rev. Lett. 101, 146802 (2008).
- Wang et al. (2014) Q.-Z. Wang, X. Liu, H.-J. Zhang, N. Samarth, S.-C. Zhang, and C.-X. Liu, Phys. Rev. Lett. 113, 147201 (2014).
- Wang et al. (2013) J. Wang, B. Lian, H. Zhang, and S.-C. Zhang, Phys. Rev. Lett. 111, 086803 (2013).
- Liu et al. (2013) X. Liu, H.-C. Hsu, and C.-X. Liu, Phys. Rev. Lett. 111, 086802 (2013).
- He et al. (2014) K. He, Y. Wang, and Q.-K. Xue, Natl. Sci. Rev. 1, 38 (2014).
- Chen et al. (2010) Y. Chen, J.-H. Chu, J. Analytis, Z. Liu, K. Igarashi, H.-H. Kuo, X. Qi, S.-K. Mo, R. Moore, D. Lu, M. Hashimoto, T. Sasagawa, S. Zhang, I. Fisher, Z. Hussain, and Z. Shen, Science 329, 659 (2010).
- Sengupta and Klimeck (2015) P. Sengupta and G. Klimeck, Semicond. Sci. Technol. 30, 045004 (2015).
- Haazen et al. (2012) P. P. J. Haazen, J.-B. Laloe, T. J. Nummy, H. J. M. Swagten, P. Jarillo-Herrero, D. Heiman, and J. S. Moodera, Appl. Phys. Lett. 100, 082404 (2012).
- Collins-McIntyre et al. (2014) L. J. Collins-McIntyre, S. E. Harrison, P. Schönherr, N.-J. Steinke, C. J. Kinane, T. R. Charlton, D. Alba-Veneroa, A. Pushp, A. J. Kellock, S. S. P. Parkin, J. S. Harris, S. Langridge, G. van der Laan, and T. Hesjedal, Europhys. Lett. 107, 57009 (2014).
- Zhang et al. (2012) D. Zhang, A. Richardella, D. W. Rench, S.-Y. Xu, A. Kandala, T. C. Flanagan, H. Beidenkopf, A. L. Yeats, B. B. Buckley, P. V. Klimov, D. D. Awschalom, A. Yazdani, P. Schiffer, M. Z. Hasan, and N. Samarth, Phys. Rev. B 86, 205127 (2012).
- Watson et al. (2013) M. Watson, L. Collins-McIntyre, A. Coldea, D. Prabhakaran, L. R. Shelford, S. C. Speller, T. Mousavi, C. Grovenor, Z. Salman, S. R. Giblin, G. van der Laan, and T. Hesjedal, New J. Phys. 15, 103016 (2013).
- Chang et al. (2013) C.-Z. Chang, J. Zhang, X. Feng, J. Shen, Z. Zhang, M. Guo, K. Li, Y. Ou, P. Wei, L.-L. Wang, Z.-Q. Ji, Y. Feng, S. Ji, X. Chen, J. Jia, X. Dai, Z. Fang, S.-C. Zhang, K. He, Y. Wang, L. Lu, X.-C. Ma, and Q.-K. Xue, Science 340, 167 (2013).
- Chang et al. (2015) C.-Z. Chang, W. Zhao, D. Y. Kim, H. Zhang, B. A. Assaf, D. Heiman, S.-C. Zhang, C. Liu, M. H. W. Chan, and J. S. Moodera, Nat. Mater. 14, 473 (2015).
- Peixoto et al. (2016) T. R. F. Peixoto, H. Bentmann, S. Schreyeck, M. Winnerlein, C. Seibel, H. Maaß, M. Al-Baidhani, K. Treiber, S. Schatz, S. Grauer, C. Gould, K. Brunner, A. Ernst, L. W. Molenkamp, and F. Reinert, Phys. Rev. B 94, 195140 (2016).
- Krieger et al. (2017) J. A. Krieger, C.-Z. Chang, M.-A. Husanu, D. Sostina, A. Ernst, M. M. Otrokov, T. Prokscha, T. Schmitt, A. Suter, M. G. Vergniory, E. V. Chulkov, J. S. Moodera, V. N. Strocov, and Z. Salman, Phys. Rev. B 96, 184402 (2017).
- Kou et al. (2014) X. Kou, S.-T. Guo, Y. Fan, L. Pan, M. Lang, Y. Jiang, Q. Shao, T. Nie, K. Murata, J. Tang, Y. Wang, L. He, T.-K. Lee, W.-L. Lee, and K. L. Wang, Phys. Rev. Lett. 113, 137201 (2014).
- Harrison et al. (2015a) S. E. Harrison, L. J. Collins-McIntyre, S. L. Zhang, A. A. Baker, A. I. Figueroa, A. J. Kellock, A. Pushp, Y. L. Chen, S. S. P. Parkin, J. S. Harris, G. van der Laan, and T. Hesjedal, Appl. Phys. Lett. 107, 182406 (2015a).
- Harrison et al. (2014a) S. E. Harrison, L. J. Collins-McIntyre, S. Li, A. A. Baker, L. R. Shelford, Y. Huo, A. Pushp, S. S. P. Parkin, J. S. Harris, E. Arenholz, G. van der Laan, and T. Hesjedal, J. Appl. Phys. 115, 023904 (2014a).
- Harrison et al. (2015b) S. E. Harrison, L. J. Collins-McIntyre, S.-L. Zhang, A. A. Baker, A. I. Figueroa, A. J. Kellock, A. Pushp, S. S. P. Parkin, J. S. Harris, G. van der Laan, and T. Hesjedal, J. Phys.: Condens. Matter 27, 245602 (2015b).
- Harrison et al. (2015c) S. E. Harrison, L. J. Collins-McIntyre, P. Schönherr, A. Vailionis, V. Srot, P. A. van Aken, A. J. Kellock, A. Pushp, S. S. P. Parkin, J. S. Harris, B. Zhou, Y. L. Chen, and T. Hesjedal, Sci. Rep. 5, 15767 (2015c).
- Jensen and Mackintosh (1991) J. Jensen and A. R. Mackintosh, Rare Earth Magnetism (Clarendon Press, Oxford, Oxford, 1991).
- Xu et al. (2012) S.-Y. Xu, M. Neupane, C. Liu, D. Zhang, A. Richardella, L. A. Wray, N. Alidoust, M. Leandersson, T. Balasubramanian, J. Sanchez-Barriga, O. Rader, G. Landolt, B. Slomski, J. H. Dil, J. Osterwalder, T.-R. Chang, H.-T. Jeng, H. Lin, A. Bansil, N. Samarth, and M. Z. Hasan, Nature Phys. 8, 616 (2012).
- Franz and Molenkamp (2013) M. Franz and L. W. Molenkamp, Topological Insulators (Elsevier, 2013).
- Chang et al. (2014) C.-Z. Chang, P. Tang, Y.-L. Wang, X. Feng, K. Li, Z. Zhang, Y. Wang, L.-L. Wang, X. Chen, C. Liu, W. Duan, K. He, X.-C. Ma, and Q.-K. Xue, Phys. Rev. Lett. 112, 056801 (2014).
- Alpichshev et al. (2012) Z. Alpichshev, R. R. Biswas, A. V. Balatsky, J. G. Analytis, J.-H. Chu, I. R. Fisher, and A. Kapitulnik, Phys. Rev. Lett. 108, 206402 (2012).
- Black-Schaffer and Balatsky (2012) A. M. Black-Schaffer and A. V. Balatsky, Phys. Rev. B 85, 121103 (2012).
- Henk et al. (2012) J. Henk, M. Flieger, I. V. Maznichenko, I. Mertig, A. Ernst, S. V. Eremeev, and E. V. Chulkov, Phys. Rev. Lett. 109, 076801 (2012).
- Li et al. (2013) S. Li, S. E. Harrison, Y. Huo, A. Pushp, H. T. Yuan, B. Zhou, A. J. Kellock, S. S. P. Parkin, Y.-L. Chen, T. Hesjedal, and J. S. Harris, Appl. Phys. Lett. 102, 242412 (2013).
- Harrison et al. (2014b) S. E. Harrison, B. Zhou, Y. Huo, A. Pushp, A. J. Kellock, S. S. P. Parkin, J. S. Harris, Y. Chen, and T. Hesjedal, Appl. Phys. Lett. 105, 121608 (2014b).
- Marrows et al. (2009) C. Marrows, L. Chapon, and S. Langridge, Materials Today 12, 70 (2009).
- Saadaoui et al. (2016) H. Saadaoui, X. Luo, Z. Salman, X. Y. Cui, N. N. Bao, P. Bao, R. K. Zheng, L. T. Tseng, Y. H. Du, T. Prokscha, A. Suter, T. Liu, Y. R. Wang, S. Li, J. Ding, S. P. Ringer, E. Morenzoni, and J. B. Yi, Phys. Rev. Lett. 117, 227202 (2016).
- Dunsiger et al. (2010) S. R. Dunsiger, J. P. Carlo, T. Goko, G. Nieuwenhuys, T. Prokscha, A. Suter, E. Morenzoni, D. Chiba, Y. Nishitani, T. Tanikawa, F. Matsukura, H. Ohno, J. Ohe, S. Maekawa, and Y. J. Uemura, Nat. Mater. 9, 299 (2010).
- Kummer et al. (2016) K. Kummer, A. Fondacaro, E. Jimenez, E. Velez-Fort, A. Amorese, M. Aspbury, F. Yakhou-Harris, P. van der Linden, and N. B. Brookes, J. Synchrotron Rad. 23, 464 (2016).
- Björck and Andersson (2007) M. Björck and G. Andersson, J. Appl. Cryst. 40, 1174 (2007).
- Blundell and Bland (1992) S. J. Blundell and J. A. C. Bland, Phys. Rev. B 46, 3391 (1992).
- Prokscha et al. (2008) T. Prokscha, E. Morenzoni, K. Deiters, F. Foroughi, D. George, R. Kobler, A. Suter, and V. Vrankovic, Nucl. Instr. Meth. A 595, 317 (2008).
- Morenzoni et al. (2004) E. Morenzoni, T. Prokscha, A. Suter, H. Luetkens, and R. Khasanov, J. Phys. Cond. Mat. 16, S4583 (2004).
- Morenzoni et al. (2002) E. Morenzoni, H. Glückler, T. Prokscha, R. Khasanov, H. Luetkens, M. Birke, E. M. Forgan, C. Niedermayer, and M. Pleines, Nucl. Instr. Meth. B 192, 254 (2002).
- Pratt (2000) F. L. Pratt, Physica B 289, 710 (2000).
- Strocov et al. (2010) V. N. Strocov, T. Schmitt, U. Flechsig, T. Schmidt, A. Imhof, Q. Chen, J. Raabe, R. Betemps, D. Zimoch, J. Krempasky, X. Wang, M. Grioni, A. Piazzalunga, and L. Patthey, J. Synchrotron Rad. 17, 631 (2010).
- Strocov et al. (2014) V. N. Strocov, X. Wang, M. Shi, M. Kobayashi, J. Krempasky, C. Hess, T. Schmitt, and L. Patthey, J. Synchrotron Rad. 21, 32 (2014).
- Figueroa et al. (2017) A. Figueroa, A. Baker, S. Harrison, K. Kummer, G. van der Laan, and T. Hesjedal, J. Magn. Magn. Mater. 422, 93 (2017).
- Steinke et al. (2018) N.-J. Steinke, L. B. Duffy, P. J. Baker, S. Langridge, J. Krieger, S. L. Zhang, F. Kronast, G. van der Laan, A. Suter, T. Prokscha, Z. Salman, and T. Hesjedal, unpublished (2018).
- Lachman et al. (2015) E. O. Lachman, A. F. Young, A. Richardella, J. Cuppens, H. R. Naren, Y. Anahory, A. Y. Meltzer, A. Kandala, S. Kempinger, Y. Myasoedov, M. E. Huber, N. Samarth, and E. Zeldov, Sci. Adv. 1, e1500740 (2015).
- Sacchi et al. (1991) M. Sacchi, O. Sakho, and G. Rossi, Phys. Rev. B 43, 1276 (1991).
- Sacchi et al. (1992) M. Sacchi, F. Sirotti, G. Rossi, R. J. H. Kappert, J. Vogel, and J. C. Fuggle, J. Electr. Spectr. Related Phenom. 58, 393 (1992).
- van der Laan and Thole (1993) G. van der Laan and B. T. Thole, Phys. Rev. B 48, 210 (1993).
- Duffy et al. (2017a) L. B. Duffy, A. I. Figueroa, G. van der Laan, and T. Hesjedal, Phys. Rev. Materials 1, 064409 (2017a).
- Ye et al. (2015) M. Ye, W. Li, S. Zhu, Y. Takeda, Y. Saitoh, J. Wang, H. Pan, M. Nurmamat, K. Sumida, F. Ji, Z. Liu, H. Yang, Z. Liu, D. Shen, A. Kimura, S. Qiao, and X. Xie, Nat. Commun. 6, 8913 (2015).
- Duffy et al. (2017b) L. B. Duffy, A. I. Figueroa, L. Gladcuk, N.-J. Steinke, K. Kummer, G. van der Laan, and T. Hesjedal, Phys. Rev. B 97, 224422 (2017b).
- Molodtsov et al. (1997) S. L. Molodtsov, M. Richter, S. Danzenbächer, S. Wieling, L. Steinbeck, and C. Laubschat, Phys. Rev. Lett. 78, 142 (1997).
- Kobayashi et al. (2014) M. Kobayashi, I. Muneta, Y. Takeda, Y. Harada, A. Fujimori, J. Krempaský, T. Schmitt, S. Ohya, M. Tanaka, M. Oshima, and V. N. Strocov, Phys. Rev. B 89, 205204 (2014).
- Arenholz et al. (1995) E. Arenholz, E. Navas, K. Starke, L. Baumgarten, and G. Kaindl, Phys. Rev. B 51, 8211 (1995).
- Taguchi et al. (2003) M. Taguchi, G. van der Laan, E. Arenholz, S. S. Dhesi, and E. Dudzik, Phys. Rev. B 68, 104408 (2003).
- van der Laan et al. (1999) G. van der Laan, E. Arenholz, Z. Hu, A. Bauer, E. Weschke, C. Schüssler-Langeheine, E. Navas, A. Mühlig, G. Kaindl, J. B. Goedkoop, and N. B. Brookes, Phys. Rev. B 59, 8835 (1999).