Spline Regression with Automatic Knot Selection
Abstract
In this paper we introduce a new method for automatically selecting knots in spline regression. The approach consists in setting a large number of initial knots and fitting the spline regression through a penalized likelihood procedure called adaptive ridge. The proposed method is similar to penalized spline regression methods (e.g. P-splines), with the noticeable difference that the output is a sparse spline regression with a small number of knots. We show that our method – called A-spline, for adaptive splines – yields sparse regression models with high interpretability, while having similar predictive performance similar to penalized spline regression methods. A-spline is applied both to simulated and real dataset. A fast and publicly available implementation in R is provided along with this paper.
Keywords: Spline Regression, B-splines, Penalized Likelihood, Adaptive Ridge, Bandlinear Systems, Changepoint Detection.
1 Introduction
Spline regression has known a great development in the past decades (see Wahba, 1990; Hastie et al., 2001; Ruppert et al., 2009; Wood, 2017) and has become a tool of choice for semiparametric regression. This success can be explained by the fact that splines are restrictive enough to benefit from the simplicity of parametric estimation, and yet are general enough to accurately approximate a large variety of smooth function. Spline regression is performed by choosing a set of knots and by finding the spline defined over these knots that minimizes the residual sum of squares. The number of knots has an important influence in the resulting fit: with not enough knots the regression is underfitted and with too many knots it is overfitted. Choosing the position of knots is also an issue since uniformly distributed knots can lead to overfitting in an area where there are few points and underfitting in an area where there are many points.
The most widely used spline regression methods overcome this difficulties by using a penalization approach. In smoothing splines, knots are set at each data point and the wiggliness of the spline is controlled by penalizing over its integrated squared second order derivative . The smoothing spline estimate has a closed-form expression and computationally efficient techniques have been developed. We refer to (Hastie et al., 2001, Section 5) for a detailed explanation on smoothing splines. O’Sullivan (1986) generalized smoothing splines to an arbitrary choice of knots. This allows to set fewer knots than the sample size. Two R implementations are available in the package gam (Hastie, 2018; Hastie et al., 2001) and the package mgcv (Wood, 2017). Later, Eilers and Marx (1996); Marx and Eilers (1998) introduced a penalty based on the finite order differences of the parameters. The corresponding splines are called P-splines. This penalization is closely related to that of O’Sullivan (see Eilers and Marx, 1996, Section 3): it is simpler since no integration is involved, and it allows for generalizations to derivatives of higher order. However, O-Sullivan’s penalty is more general in that the knots do not have to be equally spaced. See Wand and Ormerod (2010) and Eilers et al. (2015, Appendix A) for comparisons of the two methods. A detailed review of P-splines is given in Eilers et al. (2015) and citations therein. We note that P-splines are also closely related to Whittaker (1922)’s graduation method, which can be seen as a P-spline of order with knots placed at data points.
These regularized approaches in spline regression are simple and computationally fast. However, a spline regression with fewer knots is easier to interpret, which in many cases is a desired goal. Thus, some attempts have been made to find a non-penalized regression procedure with an automatic selection of knots. The idea is to choose more knots – and so basis splines – in data-dense regions where the underlying function has more variability. One could try to find the best knots by setting a very large number of knots and exploring the set of splines defined on any subset of the knots. But as pointed out by Wand (2000), this method is not tractable in practice. Previous attempts to find the best number and location of knots can be found in the literature; we refer to Wand (2000) for a review. Friedman (1991) has developed a multivariate variable selection technique called MARS (Multivariate Adaptive Regression Splines). It uses a recursive partitioning of the domain and sequentially selects the most relevant knots with a forward step size procedure followed by backward step size procedure. See also (Friedman and Silverman, 1989) and (Hastie et al., 2001, Section 9.4) for details. Luo and Wahba (1997) have later developed a closely related approach for automatic selection of knots called Hybrid Adaptive Splines. Like MARS, it uses a forward stepwise regression procedure and instead of using a backward procedure to remove unnecessary knots, it fits penalized splines. Other paths have been taken to solve this computationally intensive problem. Namely, Jamrozik et al. (2010) have offered to estimate the best location of knots using a differential evolution algorithm. However, their approach was limited to a number of knots varying between and and to splines of order .
In this article, we introduce a new computationally efficient method to automatically select the number and position of the knots from the data. It is called A-splines, for adaptive splines. It is based on a regularization method with an approximate L0 norm penalty. Although our approach is different from P-splines, A-spline regression uses an objective function closely related to that of P-spline. Our method is defined for splines of any order . In particular, using splines of order – i.e piecewise constant functions – allows to perform automatic detection of breakpoints. Splines of order , i.e. continuous broken lines, can be used as a generalization of the linear model which allows for shifts in the slope. In most cases when the true function is assumed to be “smooth”, splines of order are used, which yield a sparser model than the state-of-the-art spline regression methods. Therefore, our method is to be preferred when the simplicity of the model is a desired feature.
This paper is constructed as follows. Section 2 gives a short summary of B-splines and B-spline regression. Section 3 introduces our spline regression method. In Section 4, our method is extended to the generalized linear model framework. Section 5 deals with the choice of the bias-variance tradeoff parameter. Section 6 compares the prediction performance of our model to P-splines through a simulation study. Section 7 gives some details about the fast implementation of the fitting algorithm. Finally, A-spline is illustrated on several real datasets in Section 8.
2 B-spline Regression
2.1 B-spline Basis
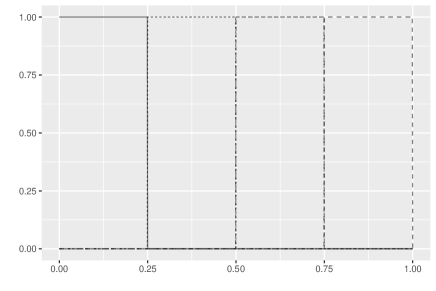
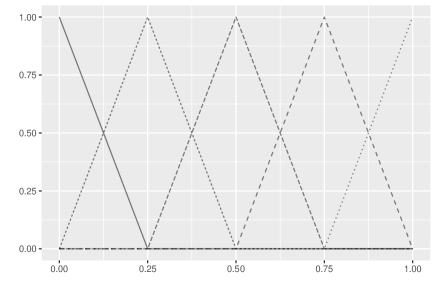
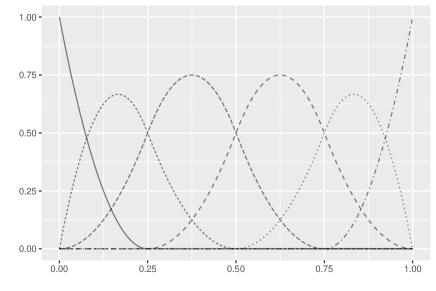
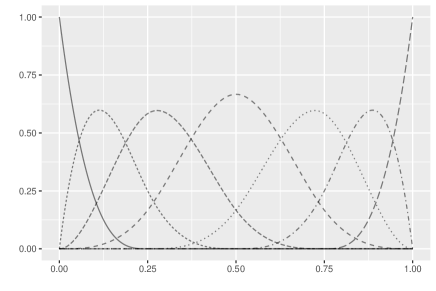
In this section we recall the definition and some basic properties of splines and B-splines. Throughout this work, let be the ordered knots included in a real interval . A spline of order is a piecewise polynomial function of order such that its derivatives up to order are continuous at every knot . The set of splines of order over the knots is a vector space of dimension .
A possible choice of spline basis is the truncated power basis: , , , where . The first functions of the basis are polynomials and the other functions are truncated polynomials of degree . Decomposing a spline into the truncated power basis brings out powers of large numbers, which lead to rounding errors and numerical inaccuracies (De Boor, 1978, p. 85).
In order to solve this problem, De Boor (1978) introduced a spline basis – called B-splines – more adapted to computational implementation of spline regression. A B-spline is a spline which is non-zero over for some . For , the -th B-spline of order is noted and is defined by
and . Important properties of a B-spline are: (i) the B-spline is non-zero over an interval spanning knots; (ii) at a point, only B-splines are non-zero; (iii) . An illustration of B-spline bases of order to is given in Figure 1. In practice, B-splines can be computed using the function bSpline from the R package splines2 (Wang and Yan, 2017).
2.2 B-Spline Regression
Let be the univariate data and consider the non-parametric regression setting
| (1) |
with i.i.d. Gaussian errors and where is a “smooth” function. The function is estimated by a spline over an interval containing all s. Fitting the data consists in minimizing the sum of squares
| (2) |
where is the B-spline coefficients. The knots are present as parameter of to highlight that the whole fitting procedure depends on the choice of the knots. This is the framework of ordinary least squares regression with design matrix and parameter :
| (3) |
3 Automatic Selection of Knots
When there are many knots, spline regression is prone to overfitting. In the extreme case, when there as as many parameters as data points, the fitted spline interpolates the data. In this paper, we propose to estimate the spline which makes the best tradeoff between model dimension (i.e. number of knots) and goodness of fit. To this effect, we choose a high number of equally spaced initial knots and penalize over the number of knots. When a B-spline is defined over the knots and is such that for some , it can be reparametrized as a B-spline over the knots . Consequently, one would like to penalize over the number of non-zero -order differences:
| (4) |
where is the L0 norm, i.e. if and otherwise, and where the parameter tunes the tradeoff between goodness of fit and regularity of the spline. This penalty allows to remove a knot that is not relevant for the regression, to merge the adjacent intervals and and to continue the fitting procedure with a spline defined over the remaining knots. When , the fitted function is a B-spline with all knots and when , the fitted function is a polynomial of degree .
However, the penalty in Equation (4) is non differentiable and the estimation is therefore computationally non-tractable. To overcome this difficulty, an approximation method for the L0 norm is introduced in the next section.
3.1 Adaptive ridge
Following the work from Rippe et al. (2012) and Frommlet and Nuel (2016), we approximate the L0 norm by using an iterative procedure called Adaptive Ridge. The new objective function is the weighted penalized sum of squares:
| (5) |
where is the first order difference operator, , and are positive weights. The penalty is close to the L0 norm penalty when the weights are iteratively computed from the previous values of the parameter following the formula:
where is a small constant. Indeed the function approximates the function when is sufficiently small. In practice, one typically sets (Frommlet and Nuel, 2016). At convergence, gives a measure of how relevant the -th knot is. One chooses a threshold of and selects the knots with a weighted differences higher than , which we note . The number of selected knots will be noted , such that the number of parameters of the selected spline is . Since the selected knots are present in breakpoints of the curve, one then fits unpenalized B-splines over the knots , as explained in Section 2.2. Consequently, this method provides a regression model that is both regularizing and simple, in the sense that the model dimension is small.
We note that Frommlet and Nuel (2016) give a more general formula for the weights that allows to approximate any Lp norm, for . In particular, the L1 norm could be chosen, which induces both shrinkage and selection of the coefficient. Let us note that this method was already developed by Eilers and De Menezes (2005) with B-splines of order using an exact L1 norm and a median regression solver.
Input:
Output:
of Equation (5) easily rewrites
| (6) |
where and is the matrix representation of the difference operator . The minimization of is explicit:
| (7) |
A detailed explanation of the adaptive ridge procedure is given in Algorithm 1.
The penalty term is conveniently written with the circulating matrix . However, for computational efficiency, is never computed and instead we implement a fast computation algorithm for the penalty term. More details about the implementation are given in Section 7.
Relation to P-Splines
It is interesting to note that A-splines are closely related to P-splines (Eilers and Marx, 1996), whose objective function writes:
| (8) |
where the difference order is a parameter to be chosen. Thus, the implementation of A-splines can be seen as a weighted P-splines fitting. The philosophies of A-splines and P-splines are however very different. P-splines avoid choosing the best knots by penalizing over the differences of the coefficients. Instead, we directly choose the best knots for spline regression.
4 Generalized Linear Model
Spline regression has also been used to fit values in the general linear model setting, like in Eilers and Marx (1996); Hastie et al. (2001). In this section, we extend A-spline regression to the generalized linear model. In this setting, one estimates , where is the canonical link function and the variance of is a function of : . Like the linear model, can be estimated using spline regression. The generalized linear model is fitted using the Iteratively Reweighted Least Squares (IRLS) algorithm (McCullagh and Nelder, 1989, Section 2.5). With weighted penalization, the IRLS iteration writes:
| (9) |
where is the step index and is the diagonal matrix with entries
with . In practice, the estimation procedure in Algorithm 1 remains the same, except that is minimized by the Newton-Raphson procedure given in Equation (9).
5 Choice of the Penalty Constant
In this section, one selects the penalty that performs the best trade-off between goodness of fit and regularity. A first criterion is the AIC, which was used by Eilers and Marx (1996) in a similar context:
| (10) |
A different criterion is the Bayesian Information Criterion (BIC) (see Schwarz, 1978):
| (11) |
Bayesian criteria maximize the posterior probability , where is the integrated likelihood and is the prior distribution on the model . This problem is equivalent to minimizing . By integration
where is the likelihood and is the prior distribution of the parameter, which is taken constant in the following. Thus Bayesian criteria are defined as
The BIC is the Bayesian criterion obtained when one chooses a uniform prior on the model: . As explained by Żak-Szatkowska and Bogdan (2011), a uniform prior on the model is equivalent to a binomial prior on the model dimension. Therefore, the BIC tends to give too much importance to models of dimensions around . Since the adaptive knot selection is performed with a large number of initial knots, this will result in underpenalized estimators.
To this effect, Chen and Chen (2008) have developed an extended Bayesian information criterion called EBIC0. The EBIC0 criterion is defined by choosing:
and
| (12) |
The EBIC0 assigns the same a priori probability to all models of same dimension. Therefore the EBIC0 will tend to choose sparse models even with a high number of initial knots. These criteria’s selection performances are compared in the next section through a simulation study.
6 Simulation Study
| Sample size | AIC | BIC | EBIC |
|---|---|---|---|
| 50 | 0.02220 | 0.02418 | |
| 100 | 0.00754 | 0.00324 | |
| 200 | 0.00285 | 0.00136 | |
| 400 | 0.00131 | 0.00072 |
| Sample size | AIC | BIC | EBIC |
|---|---|---|---|
| 50 | 0.02239 | 0.02459 | |
| 100 | 0.00755 | 0.00486 | |
| 200 | 0.00316 | 0.00247 | |
| 400 | 0.00156 | 0.00141 |
| Sample size | AIC | BIC | EBIC |
|---|---|---|---|
| 50 | 0.02000 | 0.02211 | |
| 100 | 0.00735 | 0.00627 | |
| 200 | 0.00354 | 0.00234 | |
| 400 | 0.00177 | 0.00106 |
| Sample size | AIC | BIC | EBIC |
|---|---|---|---|
| 50 | 0.02082 | 0.02138 | |
| 100 | 0.00727 | 0.00509 | |
| 200 | 0.00333 | 0.00194 | |
| 400 | 0.00170 | 0.00081 |
6.1 Comparing the Selection Criteria
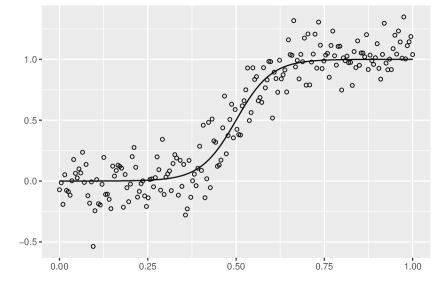
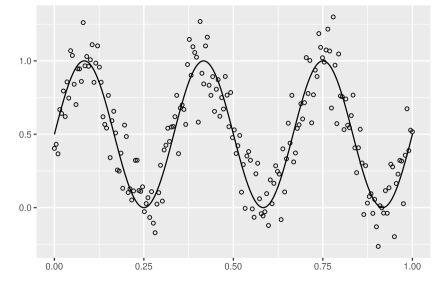
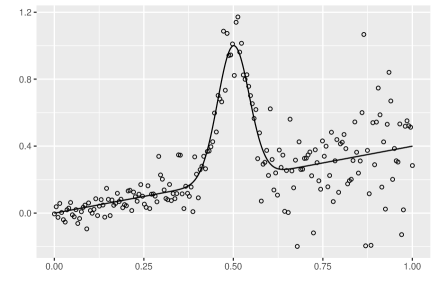
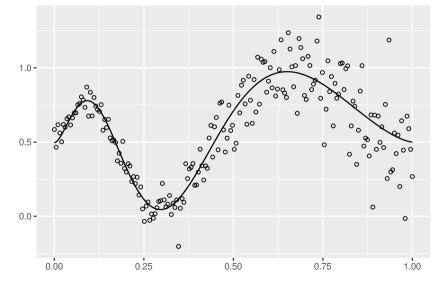
A simulation study has been conducted to compare the performances of the three criteria. Data are simulated as follows. The are taken uniformly over and are simulated using Equation (1), where is a known function and . We use four different functions: the Bump function
the Logit function
the Sine function
and the SpaHet – for spatially heterogeneous – function
These functions were used by Wand (2000) and Ruppert (2002) in similar contexts for benchmarking the efficiency of spline regression. The functions to have been rescaled in order to vary in , so that all simulation cases have similar signal-to-noise ratios. We choose homoscedastic errors for the functions Logit and Sine and heteroscedastic errors for the Bump and SpaHet functions: , so that the variance increases from when to when . Data are simulated with sample sizes , , , and . Illustration of the functions and of the simulated data are given in Figure 2. For each example datasets were simulated. A-splines are fitted and we compare the Mean Squared Error (MSE) of the estimated function for the three criteria:
The median MSEs are displayed in Table 1 for each value of the sample size. For all functions and for all criteria, the MSE decreases with the sample size, as is expected. The comparison between the criteria brings the same conclusions for all four functions: the BIC and EBIC0 always perform better than the AIC. Moreover, note that the EBIC0 always outperforms the BIC for the sample size , and performs almost as well for the sample size . In conclusion, the BIC and EBIC0 are to be preferred over the AIC and overall; the EBIC0 seems a better choice than the BIC.
6.2 Comparing A-splines with P-splines
In this section, the performance of A-splines is compared to penalized spline regression methods. For the sake of simplicity, we limit our study to comparing A-splines and P-splines. We use the same simulation setting as the previous section. We use the EBIC0 criterion to select the penalty.
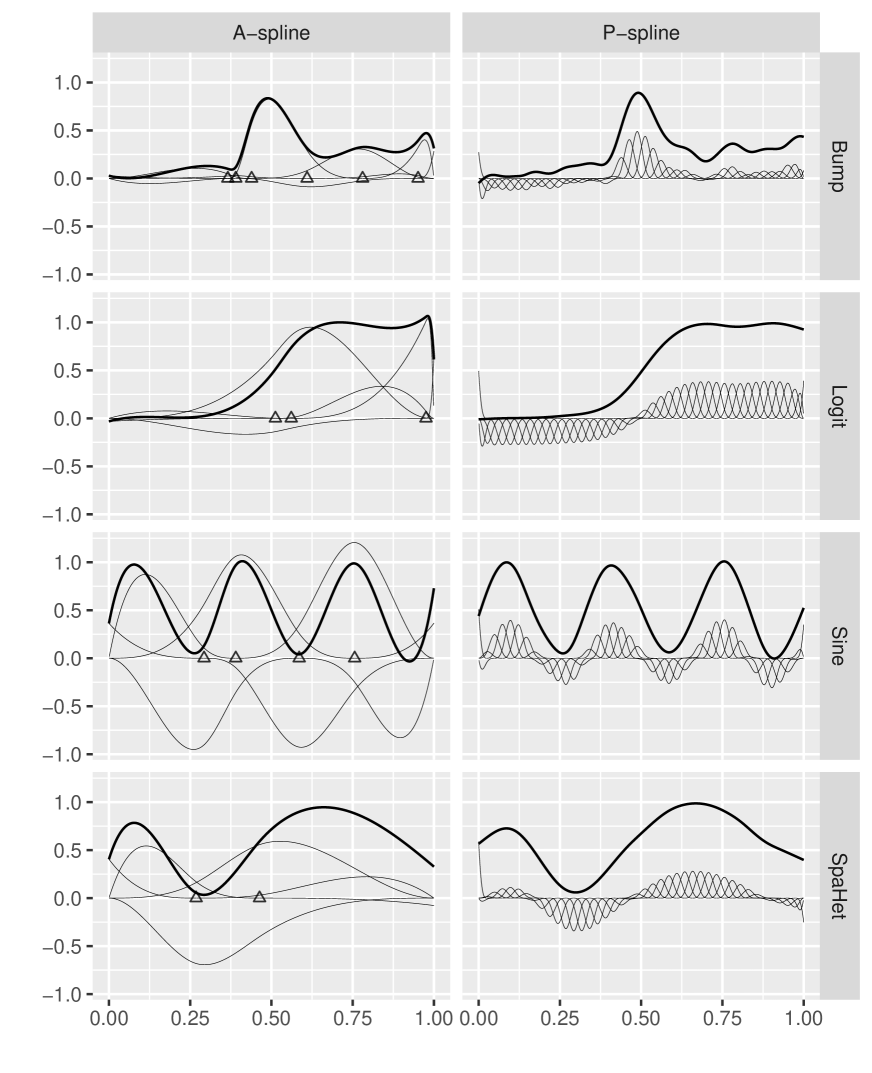
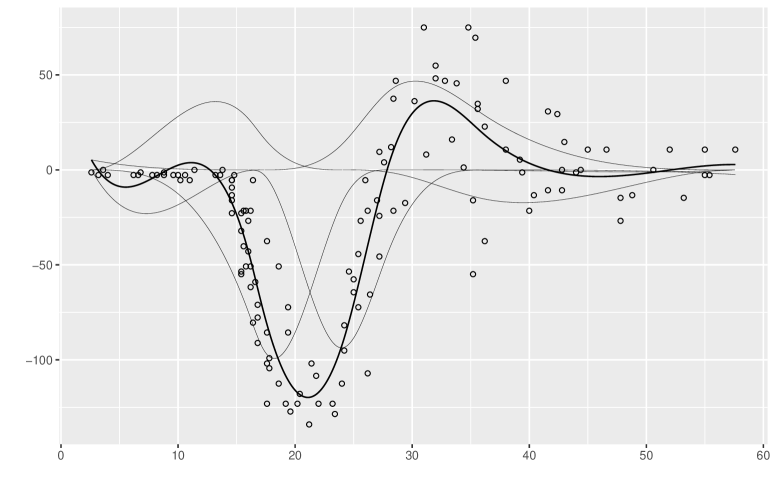
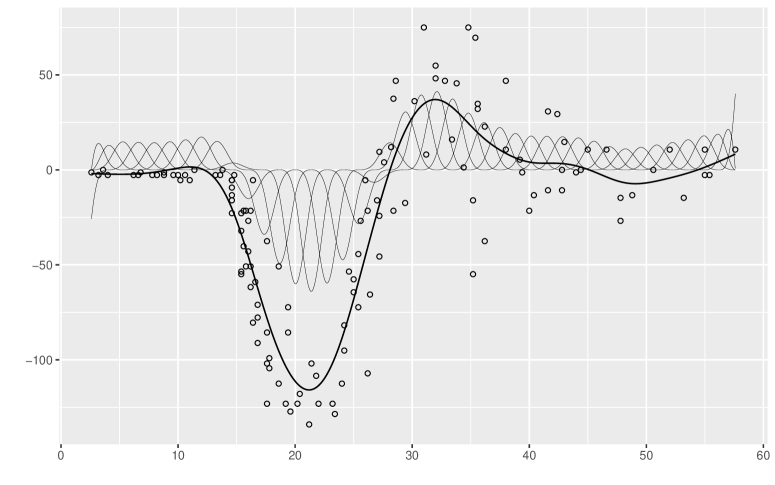
Figure 3 represents the fitted functions with A-splines and P-splines for the four functions with datasets of size . The thick lines represent the estimated functions; the thin lines represent the splines’ basis decomposition. With every function, A-spline and P-spline yield similar estimates. The basis decomposition highlights that A-spline selects very sparse models, which are also simpler. Over the replications, A-spline selects a median number of splines for the Bump function, for the Logit function, for the Sine function, and for the SpaHet function.
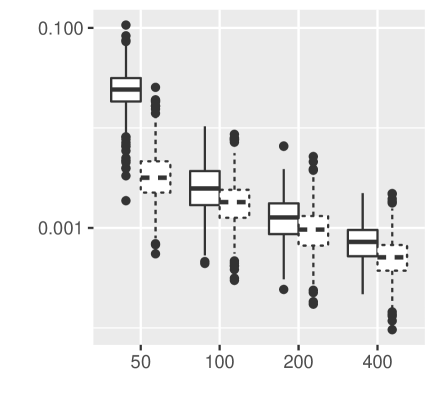
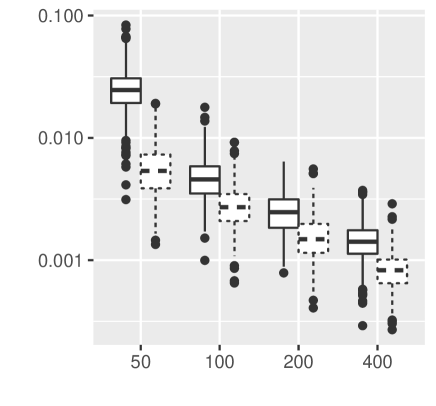
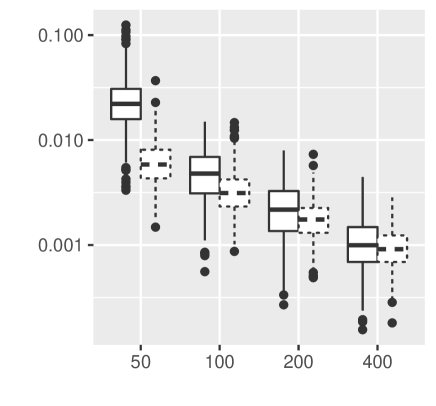
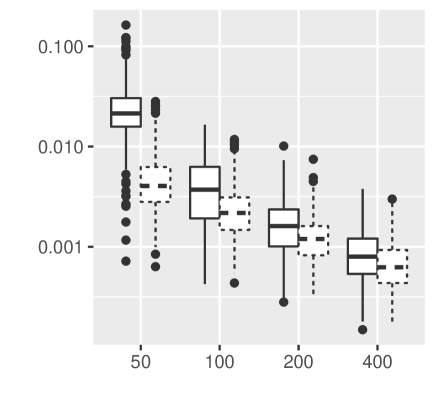
A quantitative comparison is also made to ensure that A-spline has a predictive performance comparable to P-spline. Figure 4 shows the MSE for A-splines (solid lines) and P-splines (dotted lines) for every sample size and every function. It shows that for sample size , P-splines performs better than A-splines on average. When the sample size increases, A-splines performs almost as well as P-splines. These two remarks are true for all four reference functions. In conclusion, for prediction purposes P-splines are to be favored for very small dataset but for data sets of size and above, A-splines and P-splines turn out to have close to equal predictive performance.
7 Practical Implementation
In this section, the implementation of A-splines is explained in details. Particular attention has been brought to the computation of matrix products. Consequently, fitting A-splines is almost instantaneous: seconds with initial knots and on a standard laptop. In the next three sections, several bottlenecks in the computation of A-splines are addressed. Matrix products computations are accelerated using an Rcpp (Eddelbuettel, 2013) implementation. An R implementation of the A-spline estimation procedure is publicly available in the package aspline111github.com/goepp/aspline.
Let us note that the design matrix only appears in the regression model through and , so apart from the computation of , , and , which is done only once, the algorithm does not depend on the sample size.
7.1 Adaptive Spline Regression with Several Penalties
The penalty constant tunes the tradeoff between goodness of fit and regularity. To choose the optimal , regression is performed for a sequence of penalties and a criterion is used to determine which regression model to select. Computing the procedure for a series of values of significantly increases the computing time. Note that a small variation of yields a small variation of . Consequently, is a good initial point for the minimization of . Making use of this hot start significantly speeds up the minimization of and thus decreases the computation time of the adaptive ridge procedure. This implementation of the adaptive ridge is introduced in Rippe et al. (2012) and Frommlet and Nuel (2016) and a similar idea is used in the implementation of the LASSO in the package glmnet (Friedman et al., 2010).
7.2 Fast Computation of the Weighted Penalty
The matrix inversion in Equations (7) and (9) is the computational bottleneck of the adaptive ridge procedure. The matrix is symmetric and -banded, and as noticed by Wand and Ormerod (2010), so is . Consequently, the inversion is done using Cholesky decomposition and back-substitution, as implemented in the package bandsolve222github.com/monneret/bandsolve. This reduces the temporal complexity from to . For example, if and , the computation time will be reduced by a factor . It is important to note that the matrices and are not stored in memory: only the vector and the first row of are used. This leads to improvements in spatial complexity, the details of which are not given here.
7.3 Fast Computation of the Weighted Design Matrix
In the setting of generalized linear regression, the matrix product in Equation (9) is computed at each iteration of the Newton-Raphson procedure. Since the design matrix has rows, this operation makes the generalized linear regression computationally expensive for large datasets. Fortunately is sparse: it has non-zero elements in each row. Due to this structure, the product only has non-zero entries. Each entry takes operations to compute on average. Thus the matrix product can be computed with a temporal complexity, compared to the complexity of the naive implementation. For instance, even with and , this implementation is faster by a factor .
8 Real Data Applications
Our method is illustrated with several real data applications.
We first present a dataset of simulated motorcycle accidents used to crash-test helmets. The data consists of observations of helmet acceleration (in units of ) measured along time after impact (in milliseconds). These data have being used as illustration of spline regression by Silverman (1985) and Eilers and Marx (1996) and are available in Hand et al. (1993). This dataset represents a good test for non parametric regression since the variance of the errors varies a great deal and there are several breakdown moments in the data. A-spline regression of order is performed (Figure 5a). For the sake of the illustration, our regression in compared to P-splines of order (Figure 5b). We have set equally spaced initial knots for both regression methods. In both figures, the solid lines represent the estimated fit and the dashed lines represent the decomposition of the fit onto the B-spline family. The two estimations are almost equal. A-spline regression has selected only knots as relevant, and thus the fitted function is a linear combination of splines.
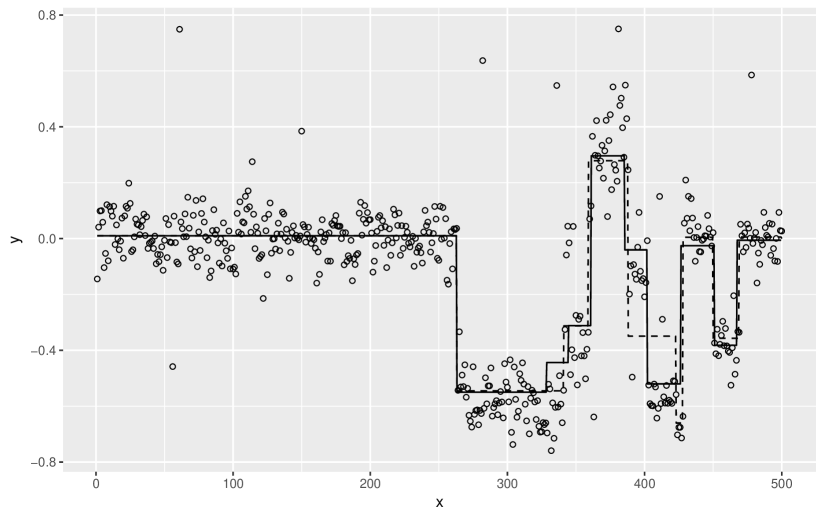
The second illustrative example uses a dataset of array Comparative Genomic Hybridization (aCGH) profiles for 57 bladder tumor samples (see Stransky et al., 2006, for references and access to the data). This dataset was used by Bleakley and Vert (2011) in the similar context of changepoint detection. The data represent the log-ratio of DNA quantity along probes. For the illustration, the first observations of individual ’s aCGH profile are used. We fit a spline of order , i.e. a piecewise constant function. Indeed, A-splines of order perform a regression with changepoint detection of the data, which is a desired goal for these data. The fitted spline is represented in solid line in Figure 6. The estimated function performs a satisfying estimation of the changepoints and of the mean values over each interval. Our regression method estimated changepoints, each corresponding to a shift in the mean value of the signal. Our method is compared to a popular changepoint detection algorithm (dashed line of Figure 6) called PELT (Killick et al., 2012). We used R package changepoint.np (Haynes et al., 2016) . This method detects changepoints, all of which correspond to a changepoint detected by the A-spline regression.
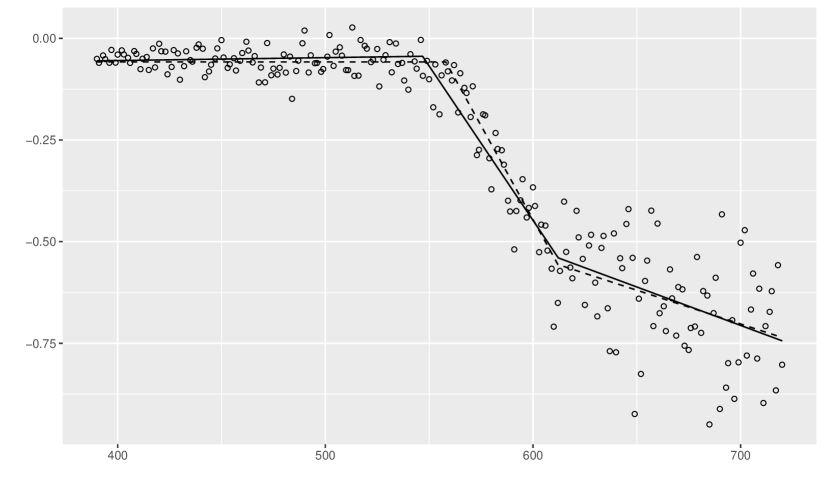
The third example is based on the LIDAR data (Sigrist et al., 1994; Holst et al., 1996), which is used by Ruppert et al. (2003) to illustrate regression methods. The data come from a light detection and ranging (LIDAR) experiment. It consists of observations of log-ratio of measured light intensity between two sources, as a function of the distance travelled by the light before being reflected (in meters). The data are available in the R package SemiPar and are represented in Figure 7. The scatter plot clearly displays a smooth decrease of the y-variable. More precisely, the y-variable is slightly decreasing for lower values of . There is a clear decrease of the slope between m and m, after which the slope gradually increases. To highlight these shifts in slope, splines of order (i.e. piecewise linear functions) are chosen to fit the data. The A-spline fit displays two slope changes, at m and m. These moments visually correspond to the two biggest shifts in slope. We also fit Friedman (1991)’s MARS procedure (in dashed line, Figure 7) and compare it to A-splines. We use an implementation of the procedure in the R package earth. This method also selects two breakpoints of the slope, at and , which are very close to the breakpoints detected by A-splines.
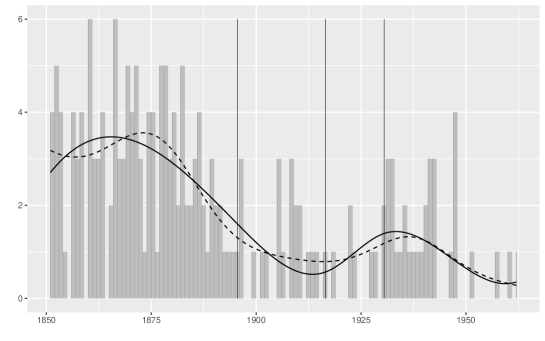
The last example uses the data of the registered number of disasters in British coal mines per year between the years and (Diggle and Marron, 1988). The number of coal disasters in each year is assumed to be Poisson distributed and the mean of the distribution is fitted using a Poisson regression. The data are fitted using A-spline regression of order . The fitted curve is given in Figure 8. The selected knots are represented by vertical dashed lines. The regression is compared to P-splines (in dashed lines), which yields a similar estimation – although less regularized.
9 Conclusion
In this paper we introduce a method called A-spline (for adaptive spline) performing spline regression which automatically selects the number and position of the knots. For that purpose, we set a large number of initial knots and use an iterative penalized likelihood approach (the adaptive ridge) to sequentially remove the unnecessary knots. The model achieving the best bias-variance tradeoff is selected using a Bayesian criterion: either the BIC or the EBIC0.
Our method yields sparse models which are more interpretable than classical penalized spline regressions (e.g. P-splines). Yet, a simulation study shows that our method has predictive performances comparable to P-splines.
When using A-spline with low order splines (e.g. 0 or 1), the approach allows performing changepoint detection. Indeed, A-spline of order 0 fit a piecewise constant function to the data and hence detect changepoint in terms of mean. A-spline of order 1 fits a piecewise linear continuous function (i.e. a continuous broken line) that detects changepoints in terms of slope.
A fast implementation of A-spline is provided in R and Rcpp. Thanks to this, the computation of A-spline is very fast ( for on the standard laptop), even when fitting generalized linear models with large sample sizes.
Our work can be naturally generalized to multivariate data using multidimensional B-splines. Moreover, we limited our work to using B-splines for the sake of simplicity. But a variety of other splines can be used instead. For example M-splines, which are a basis of non-negative splines, could be used for fitting non-negative functions (e.g. densities) and I-splines, which are a basis of monotonous splines, would yield a sparse isotonic regression model. Finally, our spline regression method can be used for non-parametric transformation of variables. In particular, splines of order could provide an automatic categorization of continuous covariates variables in regression models.
References
- (1)
- Bleakley and Vert (2011) Bleakley, K. and Vert, J.-P. (2011), ‘The Group Fused Lasso for Multiple Change-Point Detection’, arXiv preprint arXiv:1106.4199 .
- Chen and Chen (2008) Chen, J. and Chen, Z. (2008), ‘Extended Bayesian Information Criteria for Model Selection with Large Model Spaces’, Biometrika 95(3), 759–771.
- De Boor (1978) De Boor, C. (1978), A Practical Guide to Splines, Vol. 27, Springer-Verlag New York.
- Diggle and Marron (1988) Diggle, P. and Marron, J. S. (1988), ‘Equivalence of Smoothing Parameter Selectors in Density and Intensity Estimation’, Journal of the American Statistical Association 83(403), 793–800.
- Eddelbuettel (2013) Eddelbuettel, D. (2013), Seamless R and C++ Integration with Rcpp, Springer New York, New York, NY.
- Eilers and De Menezes (2005) Eilers, P. H. C. and De Menezes, R. X. (2005), ‘Quantile Smoothing of Array CGH Data’, Bioinformatics 21(7), 1146–1153.
- Eilers and Marx (1996) Eilers, P. H. C. and Marx, B. D. (1996), ‘Flexible Smoothing with B-splines and Penalties’, Statistical Science 11(2), 89–102.
- Eilers et al. (2015) Eilers, P. H. C., Marx, B. D. and Durbán, M. (2015), ‘Twenty Years of P-splines’, Statistics and Operations Research Transactions 39(2), 149–186.
- Friedman (1991) Friedman, J. H. (1991), ‘Multivariate Adaptive Regression Splines’, The Annals of Statistics 19(1), 1–67.
- Friedman and Silverman (1989) Friedman, J. H. and Silverman, B. W. (1989), ‘Flexible Parsimonious Smoothing and Additive Modeling’, Technometrics 31(1), 3–21.
- Friedman et al. (2010) Friedman, J., Hastie, T. and Tibshirani, R. (2010), ‘Regularization Paths for Generalized Linear Models via Coordinate Descent’, Journal of Statistical Software 33(1), 1–22.
- Frommlet and Nuel (2016) Frommlet, F. and Nuel, G. (2016), ‘An Adaptive Ridge Procedure for L0 Regularization’, PLoS ONE 11(2), e0148620.
- Hand et al. (1993) Hand, D. J., Daly, F., McConway, K., Lunn, D. and Ostrowski, E. (1993), A Handbook of Small Data Sets, Vol. 1 of Chapman & Hall Statistics Texts, cRc Press.
- Hastie (2018) Hastie, T. (2018), ‘Gam: Generalized Additive Models’.
- Hastie et al. (2001) Hastie, T., Friedman, J. and Tibshirani, R. (2001), The Elements of Statistical Learning, Springer Series in Statistics, 2nd edn, Springer New York.
- Haynes et al. (2016) Haynes, K., Killick, R., Fearnhead, P. and Eckley, I. (2016), ‘Changepoint.np: Methods for Nonparametric Changepoint Detection’.
- Holst et al. (1996) Holst, U., Hössjer, O., Björklund, C., Ragnarson, P. and Edner, H. (1996), ‘Locally Weighted Least Squares Kernel Regression and Statistical Evaluation of LIDAR Measurements’, Environmetrics 7(4), 401–416.
- Jamrozik et al. (2010) Jamrozik, J., Bohmanova, J. and Schaeffer, L. (2010), ‘Selection of Locations of Knots for Linear Splines in Random Regression Test-Day Models’, Journal of Animal Breeding and Genetics 127(2), 87–92.
- Killick et al. (2012) Killick, R., Fearnhead, P. and Eckley, I. A. (2012), ‘Optimal Detection of Changepoints with a Linear Computational Cost’, Journal of the American Statistical Association 107(500), 1590–1598.
- Luo and Wahba (1997) Luo, Z. and Wahba, G. (1997), ‘Hybrid Adaptive Splines’, Journal of the American Statistical Association 92(437), 107–116.
- Marx and Eilers (1998) Marx, B. D. and Eilers, P. H. (1998), ‘Direct Generalized Additive Modeling with Penalized Likelihood’, Computational Statistics & Data Analysis 28(2), 193–209.
- McCullagh and Nelder (1989) McCullagh, P. and Nelder, J. A. (1989), Generalized Linear Models, Chapman & Hall/CRC Monographs on Statistics & Applied Probability, 2 edn, Chapman and Hall.
- O’Sullivan (1986) O’Sullivan, F. (1986), ‘A Statistical Perspective on Ill-Posed Inverse Problems’, Statistical Science 1(4), 502–518.
- Rippe et al. (2012) Rippe, R. C. A., Meulman, J. J. and Eilers, P. H. C. (2012), ‘Visualization of Genomic Changes by Segmented Smoothing Using an L0 Penalty’, PLoS ONE 7(6), e38230.
- Ruppert (2002) Ruppert, D. (2002), ‘Selecting the Number of Knots for Penalized Splines’, Journal of Computational and Graphical Statistics 11(4), 735–757.
- Ruppert et al. (2009) Ruppert, D., Wand, M. and Carroll, R. J. (2009), ‘Semiparametric Regression During 2003–2007’, Electronic Journal of Statistics 3, 1193–1256.
- Ruppert et al. (2003) Ruppert, D., Wand, M. P. and Carroll, R. J. (2003), Semiparametric Regression, Cambridge University Press.
- Schwarz (1978) Schwarz, G. (1978), ‘Estimating the Dimension of a Model’, The Annals of Statistics 6(2), 461–464.
- Sigrist et al. (1994) Sigrist, M. W., Winefordner, J. D. and Kolthoff, I. (1994), Air Monitoring by Spectroscopic Techniques, Vol. 127, John Wiley & Sons.
- Silverman (1985) Silverman, B. W. (1985), ‘Some Aspects of the Spline Smoothing Approach to Non-Parametric Regression Curve Fitting’, Journal of the Royal Statistical Society, Series B 47, 1–52.
- Stransky et al. (2006) Stransky, N., Vallot, C., Reyal, F., Bernard-Pierrot, I., de Medina, S. G. D., Segraves, R., de Rycke, Y., Elvin, P., Cassidy, A., Spraggon, C., Graham, A., Southgate, J., Asselain, B., Allory, Y., Abbou, C. C., Albertson, D. G., Thiery, J. P., Chopin, D. K., Pinkel, D. and Radvanyi, F. (2006), ‘Regional Copy Number–Independent Deregulation of Transcription in Cancer’, Nature Genetics 38(12), 1386–1396.
- Wahba (1990) Wahba, G. (1990), Spline Models for Observational Data, Vol. 59, Society for Industrial and Applied Mathematics.
- Wand (2000) Wand, M. P. (2000), ‘A Comparison of Regression Spline Smoothing Procedures’, Computational Statistics 15(4), 443–462.
- Wand and Ormerod (2010) Wand, M. P. and Ormerod, J. T. (2010), ‘On Semiparametric Regression with O’Sullivan Penalised Splines’, Australian & New Zealand Journal of Statistics 52(2), 239–239.
- Wang and Yan (2017) Wang, W. and Yan, J. (2017), ‘Splines2: Regression Spline Functions and Classes’.
- Whittaker (1922) Whittaker, E. T. (1922), ‘On a New Method of Graduation’, Proceedings of the Edinburgh Mathematical Society 41, 63–75.
- Wood (2017) Wood, S. N. (2017), Generalized Additive Models: An Introduction with R, 2 edn, Chapman and Hall/CRC.
- Żak-Szatkowska and Bogdan (2011) Żak-Szatkowska, M. and Bogdan, M. (2011), ‘Modified Versions of the Bayesian Information Criterion for Sparse Generalized Linear Models’, Computational Statistics & Data Analysis 55(11), 2908–2924.