Radiation Pressure Limits on the Star Formation Efficiency and Surface Density of Compact Stellar Systems
Abstract
The large columns of dusty gas enshrouding and fuelling star-formation in young, massive stellar clusters may render such systems optically thick to radiation well into the infrared. This raises the prospect that both “direct” radiation pressure produced by absorption of photons leaving stellar surfaces and “indirect” radiation pressure from photons absorbed and then re-emitted by dust grains may be important sources of feedback in such systems. Here we evaluate this possibility by deriving the conditions under which a spheroidal, self-gravitating, mixed gas-star cloud can avoid catastrophic disruption by the combined effects of direct and indirect radiation pressure. We show that radiation pressure sets a maximum star cluster formation efficiency of at a (very large) gas surface density of pc g cm, but that gas clouds above this limit undergo significant radiation-driven expansion during star formation, leading to a maximum stellar surface density very near this value for all star clusters. Data on the central surface mass density of compact stellar systems, while sparse and partly confused by dynamical effects, are broadly consistent with the existence of a metallicity-dependent upper-limit comparable to this value. Our results imply that this limit may preclude the formation of the progenitors of intermediate-mass black holes for systems with .
keywords:
hydrodynamics – instabilities– ISM: jets and outflows – radiative transfer – galaxies: ISM – galaxies: star clusters1 Introduction
It has been appreciated for some time that the direct radiation flux from young stars may be sufficiently intense to drive gas out of isolated protoclusters experiencing intense star formation. As such, direct radiation pressure – i.e., the momentum flux imparted by starlight to gas mediated via the photons’ initial absorption and scattering by the dust borne by the gas – is an important agent of “feedback” in such systems, a view supported by both observational (Scoville et al., 2001; Lopez et al., 2011, 2014) and theoretical (Krumholz & Matzner, 2009; Fall et al., 2010; Murray, Quataert, & Thompson, 2010; Murray et al., 2011; Skinner & Ostriker, 2015; Thompson & Krumholz, 2016) perspectives.
In this article – which leaves off from developments in our previous paper on star-forming discs (Crocker et al., 2018, hereafter CKTC18) which, in turn, follows Krumholz & Thompson (2012, 2013) – we show that indirect radiation pressure (i.e., radiation pressure due to dust-reprocessed photons rather than direct starlight photons; cf. Murray, Quataert, & Thompson, 2010) will also, in many cases, have an important dynamical effect in nascent star clusters. Indirect radiation pressure effects arise because the molecular gas, from which stars form, bears dust that reradiates absorbed UV and optical light at infrared (IR) wavelengths. This same dust may – if it presents a sufficiently large column – subsequently scatter or absorb and reradiate the starlight down-scattered into the IR. Indeed, at the large gas and, consequently, dust columns concomitant to the intense star formation surface densities encountered in local ultra-luminous infrared galaxies (such as Arp 220) or in sub-mm galaxies at higher redshifts, a star-forming environment may be optically thick to photons with wavelengths as long m111Fits to such galaxies’ spectral energy distributions imply gas columns of g cm-2 (Chakrabarti & McKee, 2008), corresponding to optical depths of at 20 m and at 100 m.. Most pertinent here, similar or even larger dust columns and consequent optical depths are also encountered in the densest star-forming clouds found in the Milky Way and other galaxies in the local Universe. For example, Clarkson et al. (2012) find that the stellar surface density in the central pc of the Arches cluster near the Galactic Centre is g cm-2, and this is only a lower limit on the initial gas surface density, corresponding to optical depths of several at 100 m. The young or still-forming super star clusters in M82 (McCrady & Graham, 2007) and NGC 253 (Leroy et al., 2018) have gas columns exceeding g cm-2, so at 100 m the optical depth is .
The existence of large optical depths at IR wavelengths in such systems raises the interesting possibility that, as the downshifted photons bang around inside the gas column, much more momentum can be extracted from them than is possible in the single-scattering limit pertinent to direct radiation pressure. Indeed, in the “strong-trapping” limit the momentum per unit time extracted from starlight is amplified from to , where is the optical depth222Ultimately only bound, in principle, by energy conservation to where is a characteristic velocity of the outflowing gas (e.g., Lamers & Cassinelli, 1999).. While such a trapped radiation field could in principle eject gas from galaxies (Murray et al., 2011), whether it does so in practice is a separate question. Both analytic calculations and simulations suggest that dust-reprocessed radiation pressure is a threshold effect: for a given column of gas and stars, there exists a critical maximum radiation flux that can be forced through the column while the gas remains in a stable hydrostatic equilibrium. As long as such an equilibrium exists, the gas plus radiation pressure forces self-adjust to be in balance with the gravitational force, and IR radiation pressure has little effect on the dynamics. Once the flux exceeds the critical value, however, the gas column becomes unstable and turbulent, and simulations show that the instability saturates into a state where the mass-averaged radiation force exceeds (though, as a result of radiation Rayleigh-Taylor instability, only slightly) the mass-averaged gravitational force, rendering the entire gas column super-Eddington and thus liable to ejection on a dynamical timescale (e.g., Davis et al., 2014; Tsang & Milosavljević, 2015; Zhang & Davis, 2017). Thus the question of whether indirect radiation pressure is important for star formation reduces to the question of whether star forming systems have combinations of gas column and radiative flux that place them into the stable and sub-Eddington regime or the unstable and super-Eddington one.
In CKTC18 we showed that the radiative flux in most star-forming discs, averaged over the entire star-forming disc, fall into the former rather than the latter category. Consequently, for the vast majority even of starbursting galaxies, radiation pressure cannot be an important regulator of star formation or driver of winds at galactic scales. On the other hand, as first shown by Thompson et al. (2005) and later confirmed in CKTC18, there is a very suggestive coincidence (cf. Andrews & Thompson, 2011) between the upper boundary of the occupied region of the Kennicutt-Schmidt (KS) parameter space (of star formation surface density vs. gas surface density ) and the critical value of the star formation surface density ( pc-2 Myr-1, corresponding to a critical radiative flux of kpc-2) where indirect radiation pressure effects preclude hydrostatic equilibrium. This strongly suggests that, while indirect radiation pressure is not an important agent of feedback on global scales for most systems, it nevertheless circumscribes the parameter space along the locus of the KS relation that may be occupied by real systems. Moreover, even if a star forming system is globally sub-Eddington, the fact that star formation is highly clumpy can render individual star-forming sub-regions (i.e., nascent star clusters and super star clusters forming out of individual giant molecular clouds) super-Eddington, driving outflows away from these sub-regions (Murray et al., 2011). Numerical exploration of this question in the context of the most massive star clusters, where the effect is expected to be most important, has been highly limited by computational costs. Skinner & Ostriker (2015) and Tsang & Milosavljević (2018) both simulate indirect radiation pressure effects in a forming star cluster, and find them to be quite modest, but they survey a very small part of parameter space, and one where, as we show below, indirect radiation pressure effects are not expected to be significant. Moreover, these authors adopt a constant opacity to indirect radiation pressure, an assumption that we showed in CKTC18 leads to fundamental changes in the dynamics of the problem. Motivated by the need to explore this problem over a wider range of parameters than simulations currently permit, here we direct our attention to the importance of indirect radiation and to its effects on local scales within regions experiencing intense star formation, e.g., individual molecular clumps that are collapsing to form stellar proto-clusters or, in principle, larger stellar spheroids. Furthermore, we simultaneously incorporate direct radiation pressure effects in our model following the treatment of Fall et al. (2010, hereafter FKM10).
One might suspect that a threshold feedback mechanism such as indirect radiation pressure might be important for star-forming subregions because Hopkins et al. (2010) have compiled observations that support the existence of a universal, maximum central333That is, not the effective or mean surface density but the limiting surface mass density as . surface mass density pc g cm-2 for spheroidal stellar systems across a span of 7 orders of magnitude in total stellar mass and 5 in effective radius . These dense stellar systems include globular clusters in the Milky Way and nearby galaxies, massive star clusters in nearby starbursts, nuclear star clusters in dwarf spheroidals and late-type discs, ultra-compact dwarfs, and galaxy spheroids spanning the range from low-mass “cusp” bulges and ellipticals to massive “core” ellipticals; these systems are all baryon dominated and likely formed in rapid, dissipational events. Hopkins et al. (2010) have already weighed a number of theoretical scenarios that might explain the existence of a universal including that it is an effect of infrared radiation pressure mediated by dust. While seen as particularly promising by Hopkins et al. (2010), these authors did note that an explanation invoking indirect radiation pressure faces a number of challenges and further, recent work involving some of the original authors (Grudić et al., 2018a, b) seems to cast further doubt on this general scenario. The most significant challenge facing the scenario is presented by the differing metallicities of these systems and, therefore, the well-motivated expectation that their dust-to-gas ratio – and therefore infrared opacity – should vary. In particular, one would expect ceteris paribus that systems that form their stars at quite high redshift and which are observed to have low stellar metallicities today, would have higher maximum surface densities. Other challenges include that the mechanism would seem not to work if the stellar content of the system were built up in a number of star-formation events and that, again for systems formed at high redshift, there has been a lot of time for dynamical relaxation to diminish the central surface mass density. We revisit the question of whether the observed maximum stellar surface density can in fact be explained by radiation pressure effects in this work.
In brief, this paper extends previous work in three ways: i) we determine the stability curve for star forming, dusty clouds subject to radiation pressure deriving from the nascent stars adopting a realistic temperature-dependent opacity (rather than assuming a constant value); ii) we account simultaneously for direct and indirect radiation pressure effects; and iii) we follow the evolution of star clusters (forming out of giant molecular clouds) accounting for radiation pressure in our determination of the final state surface mass density as a function of initial state surface mass density. The remainder of this paper is as follows. In Section 2 we present a theoretical calculation for the process of star formation limited by both direct and dust-reprocessed radiation. In Section 3 we compare this theoretical calculation to observations of star clusters, and discuss further implications of our findings. We summarise and conclude in Section 4.
1.1 A word on notation and symbols
To forestall any potential confusion, below we label (dimensionful and dimensionless) reference values of some general quantity with a subscript asterisk: . Thus, for instance, is a reference (dimensionful) temperature and is a (dimensionless) reference optical depth (both defined below). Quantities connected to stars or star formation are labelled with a subscript “⋆". Thus, for instance, is the total stellar mass of the system and is the critical star formation surface density (defined below).
2 Radiation pressure effects in star-forming clouds
Our goal in this section is to derive a theoretical model for the joint effects of direct and indirect radiation pressure feedback on a star-forming cloud. We begin in Section 2.1 by considering the effects of indirect radiation pressure, summarising the relevant results from CKTC18 and adapting them from planar to spherical geometry. We then derive evolutionary tracks for star-forming clouds subject to indirect radiation pressure effects in Section 2.2. We extend this analysis to include the effects of direct radiation pressure, based on the treatment of FKM10, in Section 2.3.
2.1 Indirect radiation pressure
2.1.1 Recapitulation of CKTC18
The fundamental calculation in CKTC18 is as follows: for a specified planar column of self-gravitating, dusty gas and stars with a specified turbulent velocity dispersion and internal radiation source, we search for a density and temperature profile that allows the system to be in simultaneous hydrostatic and radiative equilibrium. We then show that such equilibria exist if the radiation flux is below a critical value, and that radiation fluxes above this value destabilise the gas, causing it to become turbulent and driving much of it off in a wind. The system we consider in CKTC18 is, in the approximation that the local radiation spectrum is always well described by a Planck function and that dust and gas are dynamically-well coupled, fully characterised by its surface densities of gas and stars , by the radiation flux per unit area provided by the stars444Of course, very similar considerations around, e.g., the stability (or not) of the gas column (see below), apply in the case that the radiative flux is dominantly supplied by an active galactic nucleus rather than star formation, but the physical context under consideration here is that of an isolated gas cloud collapsing to form a stellar cluster or super cluster; we therefore limit ourselves to consideration of the case that the radiative flux is supplied by stars. , and by the temperature-dependent Rosseland mean opacity of the dusty gas ; for K, the opacity is well-approximated by a powerlaw (Semenov et al., 2003)555We show in Appendix A that the systems we consider in this paper satisfy this constraint.. From these dimensional quantities, CKTC18 (partially following Krumholz & Thompson 2012, 2013) show that one can define three dimensionless parameters that, together with the functional form of , determine the stability of the system:
| (1) | |||||
| (2) | |||||
| (3) |
where is the reference temperature at the top of the column, is the opacity evaluated at this temperature, and is the gravitational acceleration at the top of the column. Intuitively, the quantities , , and are the gas fraction, the effective optical depth, and the effective Eddington ratio, with the latter two quantities computed using the conditions that prevail at the top of the atmosphere. We emphasise that is distinct from , which we define as the mass-weighted mean Eddington ratio throughout the gas column; the former is computed using conditions at the top of the gas column, while the latter is a mass-weighted mean over the gas column, and thus depends on the configuration of mass and radiation flux.
While and are physically distinct, CKTC18 show that the former determines the latter. For any specified gas fraction and optical depth, and for an opacity law as expected at the temperatures relevant for star-forming molecular gas, there exists a maximum value of the Eddington ratio , and thus a maximum radiation flux , at which such a gas column can be in hydrostatic balance.666To be precise, CKTC18’s calculation of depends on the assumption one makes about the efficiency of convective transport in regions where the column is unstable to convection, but where conventional convection is unable to carry a significant heat flux because radiation rather than gas dominates the enthalpy budget. CKTC18 derive values of for the two limiting cases of efficient convection (i.e., convection is able to carry enough heat to fully flatten the entropy gradient) and zero convective heat flux. (These two cases are labelled and , where c (rt) means convection (radiative transfer) governs the temperature profile.) The two differ substantially only at gas fractions above . For our purposes in this paper we will mostly use the efficient convection limit, since simulations suggest reality lies closer to that case, only referencing the inefficient convection limit on occasion to point out the overall similarity of the results it produces. See CKTC18 for further discussion and cf. Appendix B. If the system satisfies , then the mass arranges itself into a vertical density profile for which , and the system is both stable and sub-Eddington. (We use the self-consistently calculated density – and consequent temperature – profiles from CKTC18 in the modelling presented in this paper.) If , on the other hand, no equilibrium matter profile is possible and, in fact, the system is unstable to the development of radiation Rayleigh-Taylor instability. Numerical simulations then show that in the saturated state of the instability asymptotes to a value close to but just above unity, so that mass is slowly driven upward out of the gravity well by the radiation force. In physical units, for Milky Way dust opacity, and in a planar geometry, the condition that and thus that gas be ejected is approximately equivalent to the condition that the radiation flux kpc-2 (a scale previously identified in Thompson et al., 2005) corresponding to a maximal star formation surface density pc-2 Myr-1.
2.1.2 From planar to spherical geometry: limiting cases
A gas cloud that is collapsing to form a star cluster will differ from the case considered in CKTC18 in that its geometry is primarily 3D rather than 2D. We must therefore extend the CKTC18 calculation from approximately planar to approximately spherical geometry. The column density of the cloud remains a critical variable, even in spherical geometry, because this is what will determine the run of temperature through the cloud, as first shown by Chakrabarti & McKee (2005, 2008), and the temperature determines the opacity and thus the radiation pressure force. A second issue to consider in spherical geometry is that the column density will not be uniform due to the clumpiness of the gas. However, we show in Appendix C that this has relatively modest effects, and induces uncertainties in our final results only at the factor of few level. However, the change from planar to spherical geometry nonetheless has an important effect on the stability of the system against indirect radiation pressure. While in spherical geometry the gravitational force and radiation flux both decline as (for large enough that most of the mass is enclosed), the force exerted by indirect radiation pressure on gas at the surface of a cloud falls faster than because, as the cloud’s radius expands, the dust temperature and opacity decline (again assuming that K, so that we have ). In terms of our dimensionless parameters, the key distinguishing characteristic of spherical geometry is that is a decreasing function of cloud radius, so that falls with radius as well. This differs from the planar case, for which there is no flux divergence and thus the opacity goes to a fixed, non-zero value as , rather than dropping to zero, so that is constant. It also differs from the case of the direct radiation force treated in FKM10 and that we shall revisit below, where the opacity is determined by the colour temperature of the stellar sources and thus is independent of distance.
Because the indirect radiation force in spherical geometry drops with radius faster than the gravitational force, there is no maximum flux beyond which it becomes impossible for a gas column to remain hydrostatic. At sufficient distance, the IR radiation force always drops to zero (in terms of our dimensionless parameters, ), and thus for a sufficiently extended spherical configuration a solution that looks like a pressure-supported atmosphere always exists. (Recall that this statement applies only to the IR force; we will address the question of the direct radiation force below.) In light of this discussion, we can ask what happens to a star-forming cloud that, as a result of a rising luminosity as gas transforms into stars, begins to violate the planar stability condition derived by CKTC18 at its surface (i.e., using the radiation flux and surface density evaluated at the cloud radius ). If in planar geometry, then the mass-weighted mean Eddington ratio , and there is no way that the system can return to a sub-Eddington state as long as the flux remains fixed. For spherical geometry, on the other hand, a system that has at its starting radius will at some point expand enough to have , because will drop below . We can imagine two limiting outcomes for what will happen in this case:
Type A (disruption): any time a spherical cloud finds itself in a configuration with , it expands violently, leaving it vulnerable to rapid disruption by something else: hydrodynamic stripping by background flows, loss of mass from supernovae, stellar winds, or direct radiation pressure, or by tidal stripping. Under this assumption a cloud that becomes super-Eddington is assumed to disrupt almost immediately.
Type B (quasi-equilibrium expansion): a cloud that finds itself with undergoes quasi-equilibrium expansion as needed in order to remain marginally stable, , at its instantaneous gas fraction and luminosity. It will continue to form stars until it is disrupted by direct radiation pressure or some other mechanism.
While neither of these two limiting cases for cloud evolution is likely to to exactly describe the messy, non-linear reality of cloud expansion under radiation pressure, they will bracket reality. Moreover, as we show below, expressed in terms of an efficiency defined as the ratio of final to initial surface density, they lead to rather similar results. We spend a few sentences here, however, discussing which scenario is likely to be closer to the truth. This basically comes down to a question of relative timescales. The timescale for the surface density to change is a dynamical time. However, the timescale for the temperature and thus opacity to change is significantly smaller than that, because the timescale to reach thermal equilibrium is the radiation diffusion time, which is the size of the system divided by the characteristic diffusion speed of . Thus the thermal equilibration time is , which is smaller than the crossing time by a factor of . Thus to good approximation the opacity that the radiation field sees adjusts instantaneously (with respect to the dynamical time).
The remaining question is whether, in a cloud that finds itself at a luminosity such that it exceeds the stability limit at its current radius, gas is accelerated rapidly enough to exceed the escape speed before it has time to move far enough out in radius for the spherical divergence of the radiation field to reduce the force back below the Eddington limit. For indirect radiation pressure mediated by infrared radiation and powered by star formation, the answer to this is likely ‘no’ and for the following reason: suppose we have a cloud with initial radius and surface gravitational acceleration , which finds itself slightly super-Eddington because ongoing star formation makes the radiation flux passing through it large enough that . It will only remain super-Eddington until the material is able to expand significantly, so the condition for disruption is, roughly, that the gas be accelerated to above the escape speed before the radius changes by a factor of order unity. Suppose further that the net outward acceleration of the material is , which we can write in terms of an effective Eddington ratio for the accelerating gas as Thus by the time the gas propagates from to , its velocity will be The escape speed from radius is , and from it is . Thus the condition that is satisfied only if . However, numerical simulations of super-Eddington dusty atmospheres show that, as a result of RRT instability, is very close to unity even when gas is unstable and being ejected (Krumholz & Thompson, 2012, 2013; Davis et al., 2014; Tsang & Milosavljević, 2015; Zhang & Davis, 2017), so that . This in turn means that the IR radiation will not be sufficient to raise gas to the escape speed over a distance of radius .777Note that this argument applies only if changes in the radiative flux occur on timescales that are not fast compared to the timescale over which the gas can dynamically readjust so as to maintain . This condition is satisfied for systems where the power source is star formation, since the radiation flux provided by stars cannot increase much faster than the dynamical time of the system. However, it might not be satisfied for active galactic nuclei, where changes in the accretion behaviour of the small inner accretion disc can drive luminosity increases on timescales much shorter than the dynamical time of the vastly larger dusty torus. Also note the situation here is quite different to the direct radiation scenario explored in Thompson & Krumholz (2016). In that case, radiation pressure can drive out significant amounts of material because a non-negligible fraction of material (in low column regions) finds itself super-Eddington by a factor ; such does not occur in the simulations of indirect radiation pressure. There might be some tail of fast-moving material that gets accelerated to escape speed, but the bulk certainly is not. Thus, while we certainly expect some gas to be driven out of a system as it forms stars, the effect of indirect radiation pressure in dusty, star-forming (spherical) clouds can be largely characterised as causing a quasi-equilibrium expansion to lower surface mass density (i.e., the ‘Type B’ scenario). Of course, this picture is complicated if there are other sources of feedback acting but, as we show below, even accounting for direct radiation pressure effects, this general picture does not change too much.
2.2 Evolutionary tracks with indirect radiation pressure
With the preceding discussion in mind, we now adapt our previous work to the case of spherical, self-gravitating and star-forming molecular clouds. With the cloud radius, the total (cross-sectional) surface mass density is
| (4) |
where, in the last equality, we utilise the gas (mass) fraction . The surface gravity is
| (5) |
The luminosity of a simple stellar population of mass and age that fully samples the IMF can be approximated by (Krumholz & Dekel, 2010; Crocker et al., 2018), where is the light to mass ratio of a zero age stellar population, and is the time required for the population to reach statistical equilibrium between an increase in luminosity from new stars forming and a decrease from older stars going out. For a Chabrier IMF, erg s-1 g and Myr.888Formally, , where erg g is the light to mass ratio for a stellar population in statistical equilibrium between star formation and stellar death (Kennicutt & Evans, 2012). To presage later discussion, if the typical IMF varies with environment or evolves with cosmic time or with location because, e.g., of metallicity effects, then so, too, will the typical . Moreover, even if the universe realises an approximately constant IMF, because this is itself uncertain (e.g., Murray, 2009), must itself be considered to be uncertain. Binarity effects – not accounted for in this estimate of – might also be important. Since the radiation pressure effects we investigate here are expected to have set the final mass configuration within a nascent cluster at , i.e., well before its radiative output reaches the statistical equilibrium regime999On the basis of the modelling by Skinner & Ostriker (2015) we expect a cluster to have formed and its gas dispersed before where is the freefall time. Conservatively normalising to a cluster of relatively low volumetric mean density , we have yr, so even for this extremal (for our purposes) case we have a formation time ., we henceforth write . The temperature of the cloud surface is
| (6) |
With these equations we can now write the optical depth and Eddington ratio as
| (7) | |||||
| (8) |
respectively, where we have normalised the opacity by defining
| (9) |
For Solar metallicity, cm2 g-1 for K. Note that drops out of both and ; also note that, although the centre-to-edge column density is the quantity that determined , we have chosen to parameterise our system in terms of the projected column density , because this is the observable quantity to which we are interested in comparing.
2.2.1 The stability limit
If we now set
| (10) |
with evaluated from equation 8 and as calculated numerically in CKTC18 (using equation 7 for ), then for any given stellar surface density we can solve numerically for the gas fraction at which the cloud transitions from stable to unstable against indirect radiation pressure effects. Clouds that have gas fractions are unstable to indirect radiation pressure, while those with are stable. Although it is possible to express all our results in terms of gas fraction, it is more intuitive to instead consider a cloud that began its evolution consisting entirely of gas, with surface density , and whose stellar surface density is a result of subsequent star formation. In this case the gas fraction is simply related to the star formation efficiency by
| (11) |
Thus at fixed stellar surface density, clouds that have already processed a large fraction of their gas into stars () are more stable than those that have processed little gas into stars (), with the two regimes separated at a critical efficiency . We show these two regimes and the value of that separates them in Figure 1 (with the uncoloured region marked ‘allowed’ showing the stable zone of parameter space, and the blue shaded ‘excluded’ region showing the unstable zone); the numerical evaluation used in the plot is for Solar metallicity.
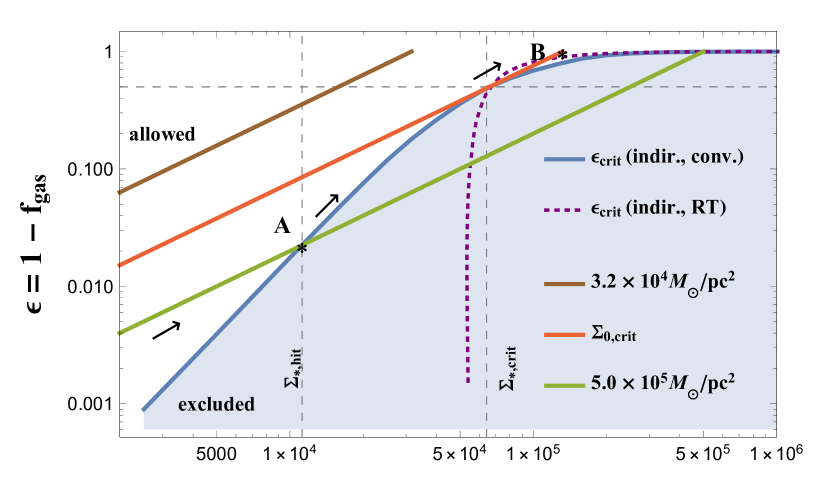
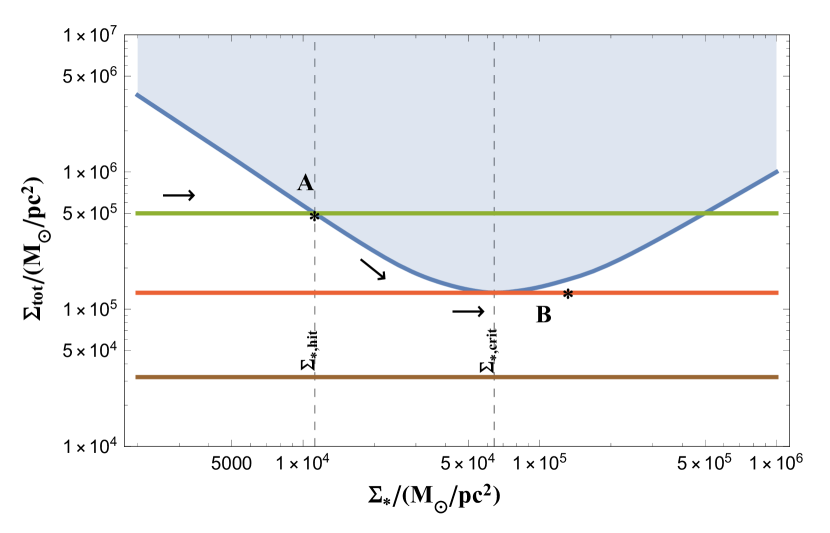
In Figure 1 we also show trajectories in the plane of taken by spherical, star-forming clouds evolving at constant total surface mass densities of /pc/pc2 and /pc2; we define in detail below. Since , in a log-log plot these trajectories are simply lines of slope unity, with a vertical offset determined by . Clouds begin their lives in the lower left corner of the plot, and as they convert gas into stars they move to the upper right. Comparing these cloud trajectories to the stability curve for indirect radiation pressure, it is clear that we can distinguish two types of trajectory. Clouds with small initial surface densities, such as the one whose evolutionary path is illustrated by the brown line in Figure 1, can convert all of their gas into stars without encountering the stability line; indirect radiation pressure effects, therefore, do not limit the gas-to-stars conversion efficiency in such systems. However direct radiation pressure effects do limit the eventual stellar surface density as described in Section 2.2.2. Clouds with larger values of the initial gas surface density , as illustrated for example by the green line in Figure 1, will eventually encounter the stability line once they have converted enough of their mass to stars. This cloud becomes unstable once in reaches the stellar surface density where the green curve intersects the blue stability line, at the point marked A in the plot; we calculate the stellar surface density at which this occurs in the next section. These two regimes are separated by a critical initial surface density pc-2 (at Solar metallicity),101010This is the value for . In the case that , we find pc-2, nearly identical. (See footnote 6 for the meanings of and .) which corresponds to , i.e., the value of such that the cloud trajectory is tangent to the stability curve (shown by the red line in Figure 1 that grazes the blue stability curve at indicated by the right vertical dashed line). We can derive an accurate approximation to analytically as follows. The first step is to obtain an analytic approximation to the stability curve shown by the blue line in Figure 1. We do so making use of an analytical approximation derived in CKTC18:
| (12) |
With this approximation, and making use of equation 7 and equation 8, we can express the stability curve as
| (13) |
where
Armed with this expression, it is straightforward to find the critical value of at which the stability curve is tangent to a cloud trajectory , since this just amounts to the requirements that and
| (15) |
With a bit of algebra one can show that the solution is , and plugging this into the approximation for the stability curve, equation 13, immediately gives
| (16) |
and
| (17) | |||||
Assuming – as is indicated by many observations (Leroy et al., 2011; Santini et al., 2014; Accurso et al., 2017) – that the dust-to-gas ratio scales directly with the gas metallicity at least down to metallicities of of Solar, and also assuming that dust properties are similar to those determined locally, these generalise to
| (18) |
where acknowledges the possibility that there could be metallicity-dependent evolution of the light-to-mass ratio because, e.g., of systematic IMF changes with .
2.2.2 Evolutionary tracks for unstable clouds
What happens if as for the green curve in Figure 1? In this case the cloud trajectory will hit the stability curve (as does the example green curve, at the point A in Figure 1) at some stellar surface density (indicated by the left vertical line in Figure 1). We can solve numerically for the intersection point , and the corresponding star formation efficiency at this point in the cloud’s evolution, by solving equation 10 simultaneously with using our tabulated stability curve . We can obtain an analytic approximation to this solution using the approximate stability curve given by equation 13, which yields
| (19) |
The solution is
| (20) | |||||
| (21) |
where . The stellar surface density is the coordinate of A in Figure 1, and is the coordinate of A in the upper panel of Figure 1.
From this point two evolutionary paths, type A and type B as identified above, are possible. In the case where a cloud expels its gas and ceases star formation as soon as it becomes unstable (type A), the final efficiency for conversion of gas into stars is simply , and the corresponding stellar surface density is ; the end point of such an evolutionary history is indicated by the asterisk labelled ‘A’ in Figure 1. The second evolutionary path (type B) is one wherein the cloud expands in order to maintain marginal stability, and is illustrated by the arrows in Figure 1. In this case a cloud begins evolving at constant , and thus along a line of of slope unity described by . However, once the cloud hits the stability line at , it cannot continue to evolve at constant . Instead, it travels along the marginal stability curve, which corresponds to expanding in radius while the star formation efficiency increases. It remains on this curve, at the edge of stability, until reaching the tangent point at , at which point it can continue its evolution at a new constant surface density . If indirect radiation pressure were the only effect limiting star formation, the cloud would then proceed to form stars at this surface density until it converted all its mass to stars and reached a final star formation efficiency ; the endpoint of such a trajectory is indicated by the ‘B’ in Figure 1. In this case the final stellar surface density is simply . We will see in the next section that the effects of direct radiation pressure alter this conclusion, though only slightly.111111Note here that we are defining final stellar surface density simply as the total mass in stars formed divided by the final cross-sectional area. In reality, for a type B evolutionary path stars that form before the cloud becomes unstable to indirect radiation pressure could form in a more compact configuration than stars that form later, after the cloud has begun expanding. In principle we could use a more sophisticated definition of surface density that weights by mass formed in different phases of the evolution. However, such an estimate could differ from our simple one by at most a factor of , because half of the total mass in stars (or slightly less once direct radiation pressure is included) forms after the cloud reaches a total surface density . Given the simplicity or our model overall, the extra algebraic complexity required to capture this factor of 2 effect does not seem warranted.
2.3 Evolutionary tracks with direct radiation pressure
As presaged above, we next incorporate direct radiation pressure effects following FKM10. For direct radiation pressure, the critical luminosity at which gas is expelled corresponds to that which delivers enough momentum within one dynamical time to drive the atmosphere to roughly the escape speed. FKM10 show that the required luminosity is
| (22) |
where accounts for assistance from main-sequence winds and incomplete leakage of starlight and wind energy (Krumholz & Matzner, 2009), is a parameter of order unity that accounts for magnetic support and turbulent support, and 121212Note that is required for the similarity solution presented by Krumholz & Matzner (2009); a different similarity solution for can be obtained, but such a steep density profile does not seem physically relevant and we do not consider it further. where the internal density profile of the cloud follows ; following FKM10 we adopt a fiducial and consider in the range . We can rewrite this critical luminosity in terms of a flux at the surface cloud surface by dividing both sides by :
| (23) | |||||
Now equating the stellar radiation flux to the critical flux we obtain a critical stellar surface density required for direct radiation pressure force to eject the gas and halt star formation:
| (24) | |||||
Defining a characteristic scale for stellar surface density due to direct radiation pressure effects
| (25) | |||||
we can solve equation 24 to find (taking the positive root)
| (26) |
(this equation is equivalent to FKM10, Eq. 6). Some example curves for are shown in yellow in Figure 2, with the shaded yellow region indicating the part of parameter space where clouds are unstable to disruption by direct radiation pressure.
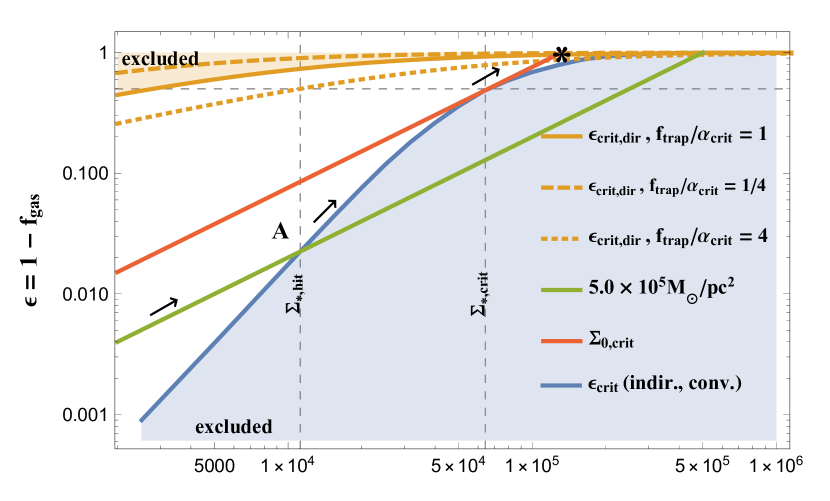
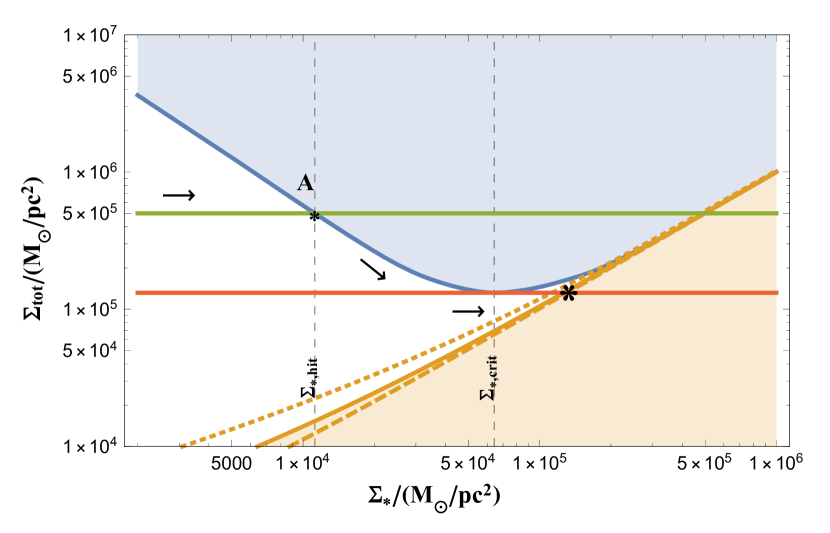
Note that, unlike for indirect radiation pressure, once the configuration of the system crosses the critical line, direct radiation pressure invariably blows out the remaining gas in the system, cutting off further star formation. The cloud cannot stabilise by expanding as it can for indirect radiation pressure, because the radial dependence of the radiation forces is fundamentally different. For indirect radiation pressure, expansion causes the radiation force per unit mass to drop faster than , because the flux falls as and the opacity falls as the cloud expands as well. For direct radiation forces, on the other hand, the extremely high opacity of dusty interstellar gas to radiation with the colour temperature of a star ( cm2 g-1) ensures that all photons will be absorbed for any reasonable column of gas. Consequently, the force delivered by the direct radiation field is simply the total momentum flux in the radiation field, which is constant and independent of radius (cf. Thompson et al., 2015). Thus expansion makes gravity stronger compared to the indirect radiation force, but weaker compared to the direct force, and for direct radiation forces expansion is therefore destabilising rather than stabilising.
Examining Figure 2, it is clear that clouds that begin their evolution with surface densities (i.e., with trajectories above the red line in the upper panel and below the red line in the lower panel) will be unbound by direct radiation pressure without ever being unstable against indirect radiation pressure, while clouds with (with an example shown by the green curve in upper and lower panels of Figure 2) will either be disrupted by indirect radiation pressure (under our ‘type A’ assumption) or will be forced to expand by indirect radiation pressure to surface density (under our ‘type B’ assumption), after which the cloud will continue to form stars at constant surface density until it is disrupted by direct radiation pressure.131313For a sufficiently large value of , or a sufficiently high metallicity, it is possible that the tangent point on the indirect radiation pressure curve could move within the zone of instability for direct radiation pressure, in which case clouds undergoing expansion under the effects of indirect radiation pressure would become vulnerable to disruption by direct radiation pressure before reaching a surface density . Since this case would require either very large values of or highly super-Solar metallicities, it seems unlikely to be relevant in nature, and thus we do not discuss it further. We show examples of both types of cloud trajectories in Figure 2.
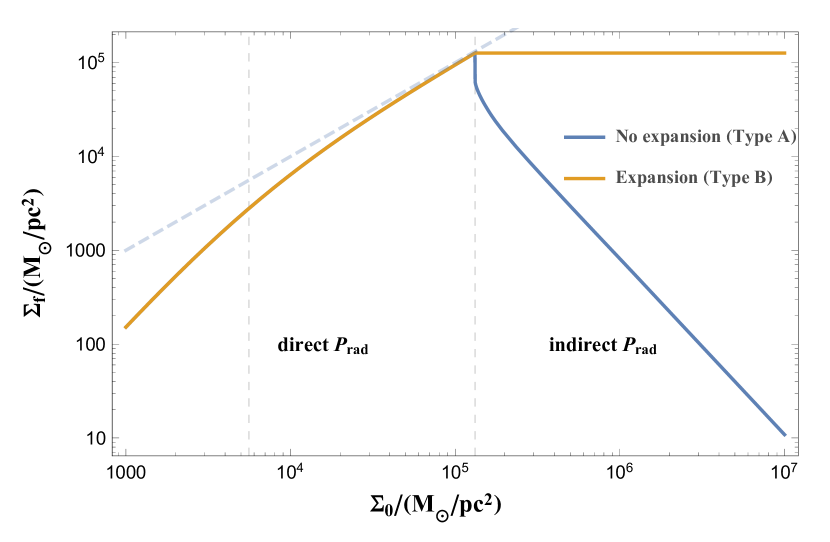
For type B evolutionary trajectories, where the cloud expands if it becomes unstable to indirect radiation pressure, the final star formation efficiency and surface density are always dictated by the total surface density of the cloud when it encounters the line of direct radiation pressure instability; this is , with the first case corresponding to clouds that begin their evolution at low surface density, , and the latter to clouds that begin their lives at high surface density, . In either case we can calculate the final star formation efficiency and stellar surface density analytically, simply by making the substitution in equation 26 and solving. The result is
| (27) | |||||
| (28) |
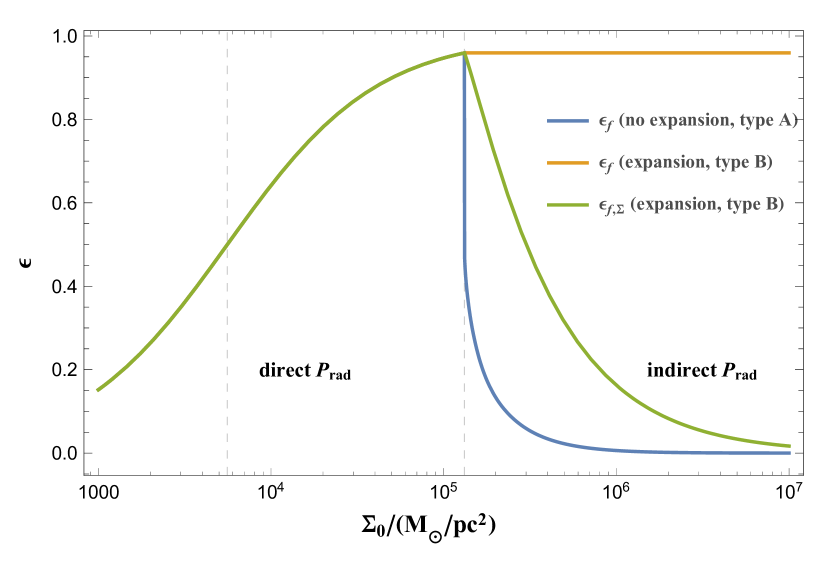
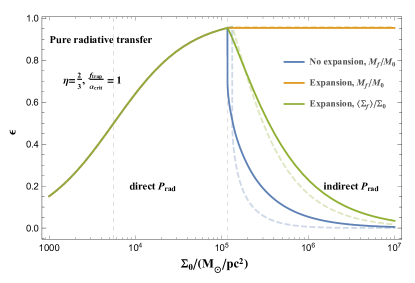
The maxima of these two functions occurs for , and for our fiducial parameter choices and Solar metallicity, these maxima are and pc-2. For type B trajectories, since the surface density of the final stellar state is different to that of the initial gaseous state, it is useful to define an additional measure of efficiency,
| (29) |
Intuitively, the difference between and is that the former measures the fraction of the initial gas mass transformed into stars, while the latter measures the ratio of the final stellar surface density to the initial gas surface density; thus the latter quantity accounts for the effects of expansion. The maximum possible value of is the same as for .
For type A trajectories, where we assume clouds disrupt instantaneously if they become unstable to direct radiation pressure, the results for and are identical to the type B case for , while for the final stellar surface density and star formation efficiency are given by the solution described in Section 2.2.2.
We show the relationship between and for both cases in Figure 3, and we show the corresponding relationship between and (or ) in Figure 4. In these plots we use the numerical value for rather than the analytic approximation, although the two differ only very slightly.
3 Discussion
3.1 Limits on surface density: observational comparison
The simple considerations set out above suggest that indirect and direct radiation pressure, acting in concert, should put an upper limit of pc for the maximum stellar surface density of star clusters. Interestingly, this finding is broadly consistent with observations. Indeed, as presaged above, Hopkins et al. (2010) pointed out the apparent existence of an empirical upper bound, at pc-2, to the central stellar surface mass density of compact stellar systems. Hopkins et al. (2010) remark that this rough limit holds over a 7 order magnitude range of total mass, a 5 order of magnitude range in physical size, and over orders of magnitude in metallicity. Given this, they tentatively conclude “that feedback from massive stars likely accounts for the observed , plausibly because star formation reaches an Eddington-like flux that regulates the growth of these diverse systems". However, a problem for this explanation – raised by Hopkins et al. (2010) and again recently by Grudić et al. (2018a, b) – is the expectation that should scale inversely as the metallicity (because of the expectation that the dust-to-gas mass ratio trace metallicity) whereas it did not seem to these authors that there was any such metallicity dependency evident in their data.
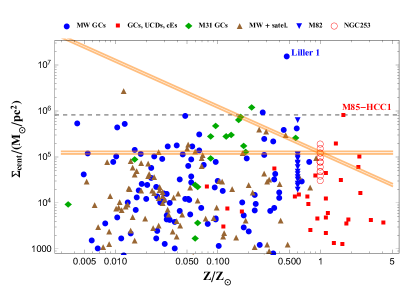
Our compilation of the central surface mass density of a number of systems vs. metallicity in shown in Figure 5. The data are still sparsely sampled and subject to selection effects that we have not rigorously characterised. Nevertheless, they do not seem to us to be inconsistent with such a metallicity-dependency for .
A further point to keep in mind here is that the sloped limit line in Figure 5 assumes a metallicity independent light to mass ratio . Were, for instance, the mean IMF to become systematically more “top heavy" for lower metallicity, this would have the overall effect of attenuating and plausibly even totally cancelling out the metallicity evolution of the critical central surface mass density (cf. recent observations of the 30 Doradus local starburst: Schneider et al., 2018, where the expected increase in concomitant with the claimed top-heavy IMF would roughly cancel out the effect of the LMC’s ). However we caution the reader that claims for strong metallicity effects on the IMF have frequently been contested or countered with seemingly contradictory examples or analysis (e.g., Bastian et al., 2010; Offner et al., 2014).
Aside from obtaining more data, a fuller empirical analysis of the issue of the putative maximal central surface mass density would have to deal with a number of issues that revolve around questions of systematics connected to the dynamical evolution of stellar systems. One possible confound is that metal-rich GCs tend to have formed nearer the centres of their host galaxies than relatively metal poor ones, i.e., in a relatively stronger tidal fields. This will render the former more compact at the present time, independent of their initial configuration.
In light of the complexity of applying our model to old stellar systems that may have undergone significant dynamical evolution, the data covering in-formation, embedded super star clusters in the NGC 253 nuclear star burst obtained by Leroy et al. (2018) provide a particularly interesting test of our model. From ALMA 350 MHz dust continuum observations, these authors find 14 candidate super star clusters () within the of molecular gas inside NGC 253’s nucleus. Each cluster has a large gas fraction and is, consequently, highly extincted behind very high gas and dust columns (yielding optical depths at 100 m). Nevertheless, Leroy et al. (2018) find no high velocity line wings in their data implying that each cluster’s gas is gravitationally bound. This finding is broadly consistent with our scenario which suggests that indirect radiation pressure effects in the nascent NGC 253 star clusters, while likely to cause some of the clusters to expand, will not expel the clusters’ gas (cf. Figure 5). Overall, indeed, we would expect a large fraction of each cluster’s original gas allocation to be turned into stars, consistent with the data and analysis presented by Leroy et al. (2018).
3.2 Stellar Mergers and Intermediate Mass Black Holes
A possible consequence of our picture is that clusters formed at higher metallicities (approaching solar) may be prevented by indirect radiation pressure from reaching the volumetric stellar number densities required such that stellar mergers may occur sufficiently rapidly in their cores to form the giant stellar precursors of intermediate mass black holes (IMBHs). Bonnell & Bate (2005) find that stellar mergers of massive stars can occur on a timescale less than their yr main sequence lifetimes – thus allowing for the dynamical formation of giant stars via mergers – for core cluster densities pc-3 assuming that a large fraction of massive stars are born into hard binary systems. This corresponds to a rough critical surface density
| (30) |
This critical surface density is shown, for the fiducial parameters, as the horizontal dashed line in Figure 5; compact stellar systems at may have trouble reaching this critical surface density (though it is to be acknowledged that there are a handful of star systems above this rough threshold at in our compilation). This effect is independent of and in addition to stellar mass loss due to Wolf-Rayet phase winds which also increases as a function of metallicity and may also preclude the formation of IMBHs (Yungelson et al., 2008; Glebbeek et al., 2009).
4 Summary
In this paper we investigate the combined effects of indirect, dust-reprocessed and direct, stellar radiation pressure on the formation of the densest star clusters. Adopting our calculation from CKTC18 of the largest column of dusty gas for which hydrostatic equilibrium is possible when the column is subject to the opposing forces of indirect radiation pressure and gravity and also drawing results on direct radiation pressure from FKM10, we construct here an evolutionary model for a dense protocluster gas cloud forming stars, and show that clouds with initial surface density pc-2 with Milky Way-like dust and dust-to-gas ratios will become super-Eddington with respect to indirect radiation pressure at some point during their star formation process. This effect is unlikely to push gas out of clusters in winds, abruptly cutting-off star formation. Rather, systems with sufficiently high initial surface mass densities probably suffer a rather gentle expansion under indirect radiation pressure effects. Only late in their evolution, once they have typically turned well more than 50% of their original gas allocation into stars, will direct radiation pressure effects turn on in such clusters, pushing the remaining gas out of the cluster at greater than the escape speed. This process is complete well before core-collapse supernovae start going off in such clusters.
The combined effect of direct and indirect radiation pressure is to set an upper limit of pc-2 on the surface densities of star clusters, and to produce a star formation efficiency – defined as the ratio of the initial gas surface density to the final stellar surface density – that has a maximum of for gas clouds with surface densities near this upper limit, and falls off sharply at either lower or higher surface densities. This limit is likely to preclude the formation of intermediate mass black holes via stellar collisions in any star cluster with a metallicity above of Solar. The scenario suggested by our model is qualitatively and quantitatively consistent with the empirical determination (Hopkins et al., 2010) that there seems to be an upper limit to the central surface mass density of compact stellar systems at pc-2. We compare our model to an updated compilation of measured stellar surface densities in a wide variety of compact stellar systems, and find that it is qualitatively consistent with the observations, including the possibility that star clusters formed with lower metallicities and thus lower dust content might have systematically higher maximum surface densities. Further tests of this model, and in particular the prediction that the results should depend on metallicity, will require additional measurements of surface densities in low-metallicity systems, preferably young ones so as to minimise the confounding effects of dynamical evolution.
Acknowledgements
The authors thank Mike Grudić and Phil Hopkins for helpfully providing a compilation of stellar cluster numerical data. This research has made use of the VizieR catalogue access tool, CDS, Strasbourg, France. The original description of the VizieR service was published in A&AS 143, 23. MRK acknowledges support from the Australian Research Council’s Discovery Projects grant DP160100695 and the ARC Centre of Excellence for All Sky Astrophysics in 3 Dimensions, project CE170100013. TAT is supported in part by NSF #1516967 and by NASA ATP 80NSSC18K0526. DM acknowledges support from the Australian Research Council Future Fellowship FT160100206.
References
- Accurso et al. (2017) Accurso, G., Saintonge, A., Catinella, B., et al. 2017, MNRAS, 470, 4750
- Andrews & Thompson (2011) Andrews, B. H., & Thompson, T. A. 2011, ApJ, 727, 97
- Barmby et al. (2007) Barmby, P., McLaughlin, D. E., Harris, W. E., Harris, G. L. H., & Forbes, D. A. 2007, Astronom. J., 133, 2764
- Bastian et al. (2010) Bastian, N., Covey, K. R., & Meyer, M. R. 2010, ARA&A, 48, 339
- Baumgardt & Hilker (2018) Baumgardt, H., & Hilker, M. 2018, arXiv:1804.08359
- Bonnell & Bate (2005) Bonnell, I. A., & Bate, M. R. 2005, MNRAS, 362, 915
- Chakrabarti & McKee (2005) Chakrabarti, S., & McKee, C. F. 2005, ApJ, 631, 792
- Chakrabarti & McKee (2008) Chakrabarti, S., & McKee, C. F. 2008, ApJ, 683, 693
- Clarkson et al. (2012) Clarkson, W. I., et al. 2012, ApJ, 751, 132
- Crocker et al. (2018) Crocker, R. M., Krumholz, M. R., Thompson, T. A., & Clutterbuck, J. 2018 (CKTC18), MNRAS, 478, 81
- Davis et al. (2014) Davis, S. W., Jiang, Y.-F., Stone, J. M., & Murray, N. 2014, ApJ, 796, 107
- Fall et al. (2010) Fall, S. M., Krumholz, M. R., & Matzner, C. D. 2010, ApJ, 710, L142
- Glebbeek et al. (2009) Glebbeek, E., Gaburov, E., de Mink, S. E., Pols, O. R., & Portegies Zwart, S. F. 2009, A&A , 497, 255
- Grudić et al. (2018a) Grudić, M. Y., Hopkins, P. F., Quataert, E., & Murray, N. 2018, arXiv:1804.04137
- Grudić et al. (2018b) Grudić, M. Y., Hopkins, P. F., Faucher-Giguère, C.-A., et al. 2018, MNRAS, 475, 3511
- Harris (1996) Harris, W. E. 1996, Astronom. J., 112, 1487
- Harris (2010) Harris, W. E. 2010, arXiv:1012.3224
- Hopkins et al. (2010) Hopkins, P. F., Murray, N., Quataert, E., & Thompson, T. A. 2010, MNRAS, 401, L19
- Janz et al. (2016) Janz, J., Norris, M. A., Forbes, D. A., et al. 2016, MNRAS, 456, 617
- Kennicutt & Evans (2012) Kennicutt, R. C., Jr., & Evans, N. J. E., II. 2012, ARA&A, 50, 531
- Krumholz & Matzner (2009) Krumholz, M. R., & Matzner, C. D. 2009, ApJ, 703, 1352
- Krumholz (2014) Krumholz, M. R. 2014, Phys. Rep., 539, 49
- Krumholz & Dekel (2010) Krumholz, M. R., & Dekel, A. 2010, MNRAS, 406, 112
- Krumholz & Matzner (2009) Krumholz, M. R., & Matzner, C. D. 2009, ApJ, 703, 1352
- Krumholz & Thompson (2012) Krumholz, M. R., & Thompson, T. A. 2012, ApJ, 760, 155
- Krumholz & Thompson (2013) Krumholz, M. R., & Thompson, T. A. 2013, MNRAS, 434, 2329
- Lamers & Cassinelli (1999) Lamers, H. J. G. L. M., & Cassinelli, J. P. 1999, Introduction to Stellar Winds, by Henny J. G. L. M. Lamers and Joseph P. Cassinelli, pp. 452. ISBN 0521593980. Cambridge, UK: Cambridge University Press, June 1999., 452
- Leroy et al. (2011) Leroy, A. K., Bolatto, A., Gordon, K., et al. 2011, ApJ, 737, 12
- Leroy et al. (2018) Leroy, A. K., Bolatto, A. D., Ostriker, E. C., et al. 2018, arXiv:1804.02083
- Lopez et al. (2011) Lopez, L. A., Krumholz, M. R., Bolatto, A. D., Prochaska, J. X., & Ramirez-Ruiz, E. 2011, ApJ, 731, 91
- Lopez et al. (2014) Lopez, L. A., Krumholz, M. R., Bolatto, A. D., Prochaska, J. X., Ramirez-Ruiz, E., & Castro, D. 2014, ApJ, 795, 121
- Massey & Hunter (1998) Massey, P., & Hunter, D. A. 1998, ApJ, 493, 180
- McCrady & Graham (2007) McCrady, N., & Graham, J. R. 2007, ApJ, 663, 844
- McLaughlin & van der Marel (2005) McLaughlin, D. E., & van der Marel, R. P. 2005, ApJS, 161, 304
- Murray (2009) Murray, N. 2009, ApJ, 691, 946
- Murray, Quataert, & Thompson (2010) Murray, N., Quataert, E., & Thompson, T. A. 2010, ApJ, 709, 191
- Murray et al. (2011) Murray, N., Ménard, B., & Thompson, T. A. 2011, ApJ, 735, 66
- Nagao et al. (2011) Nagao, T., Maiolino, R., Marconi, A., & Matsuhara, H. 2011, A&A , 526, A149
- Norris et al. (2014) Norris, M. A., Kannappan, S. J., Forbes, D. A., et al. 2014, MNRAS, 443, 1151
- Offner et al. (2014) Offner, S. S. R., et al. 2014, Protostars & Planets VI, p. 53
- Origlia et al. (2004) Origlia, L., Ranalli, P., Comastri, A., & Maiolino, R. 2004, ApJ, 606, 862
- Portegies Zwart et al. (2010) Portegies Zwart, S. F., McMillan, S. L. W., & Gieles, M. 2010, ARA&A, 48, 431
- Ryon et al. (2015) Ryon, J. E., Bastian, N., Adamo, A., et al. 2015, MNRAS, 452, 525
- Sandoval et al. (2015) Sandoval, M. A., Vo, R. P., Romanowsky, A. J., et al. 2015, ApJ, 808, L32
- Santini et al. (2014) Santini, P., Maiolino, R., Magnelli, B., et al. 2014, A&A , 562, A30
- Schneider et al. (2018) Schneider, F. R. N., Sana, H., Evans, C. J., et al. 2018, Science, 359, 69
- Scoville et al. (2001) Scoville, N. Z., Polletta, M., Ewald, S., et al. 2001, Astronom. J., 122, 3017
- Semenov et al. (2003) Semenov, D., Henning, T., Helling, C., Ilgner, M., & Sedlmayr, E. 2003, A&A , 410, 611
- Skinner & Ostriker (2015) Skinner, M. A., & Ostriker, E. C. 2015, ApJ, 809, 187
- Tan et al. (2014) Tan, J. C., Beltrán, M. T., Caselli, P., Fontani, E., Fuente, A., Krumholz, M. R., McKee, C. F., & Stolte, A. 2014, Protostars and Planets VI, 149
- Thompson et al. (2005) Thompson, T. A., Quataert, E., & Murray, N. 2005, ApJ, 630, 167
- Thompson et al. (2015) Thompson, T. A., Fabian, A. C., Quataert, E., & Murray, N. 2015, MNRAS, 449, 147
- Thompson & Krumholz (2016) Thompson, T. A., & Krumholz, M. R. 2016, MNRAS, 455, 334
- Tsang & Milosavljević (2015) Tsang, B. T.-H., & Milosavljević, M. 2015, MNRAS, 453, 1108
- Tsang & Milosavljević (2018) Tsang, B. T.-H., & Milosavljević, M. 2018, MNRAS, 478, 4142
- van der Wel et al. (2014) van der Wel, A., Franx, M., van Dokkum, P. G., et al. 2014, ApJ, 788, 28
- Webster & Smith (1983) Webster, B. L., & Smith, M. G. 1983, MNRAS, 204, 743
- Wolfire & Cassinelli (1986) Wolfire, M. G., & Cassinelli, J. P. 1986, ApJ, 310, 207
- Yungelson et al. (2008) Yungelson, L. R., van den Heuvel, E. P. J., Vink, J. S., Portegies Zwart, S. F., & de Koter, A. 2008, A&A , 477, 223
- Zhang & Davis (2017) Zhang, D., & Davis, S. W. 2017, ApJ, 839, 54
Appendix A Validity of the approximation
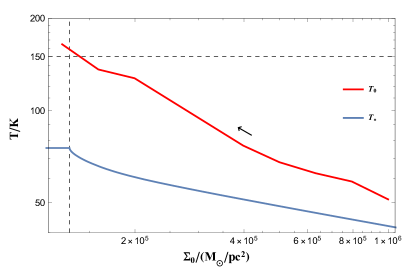
Our calculation of the critical Eddington ratio demarcating stable, sub-Eddington from unstable, super-Eddington behaviour assumes that the temperature K, so that we can approximate the temperature-dependence of the opacity as . Here we verify that this is in fact the case. In Figure 6 we plot the reference temperature (equation 6) and the central (i.e., midplane) temperature as calculated in CKTC18 as a function of surface density for marginally stable systems, i.e., for gas clouds with total surface density and gas fraction . Note that the behaviour of the opacity breaks down in the temperature range 150-200 K (Semenov et al., 2003), indicated in Figure 6 by the horizontal dashed line. Systems with evolve from right to left as they process gas into stars while simultaneously expanding. This plot indicates that, to the extent that it is accurate to treat the geometry in the planar limit, a scaling of is a very good approximation for most of the evolution of the forming clusters, only (slightly) breaking down as systems approach .
On very small scales around individual stars or stellar systems, of course, the planar approximation must break down, and the radiation temperatures will be higher. However, the scales on which this is the case are very small. For example, Wolfire & Cassinelli (1986) show that, even around a 300 star with a luminosity of , the dust temperature exceeds 200 K only within AU of the source. Even for the very dense star clusters we are considering, this is smaller than the typical separation for such luminous sources. For example, there are early O and WR stars that approach this luminosity in the central pc of R136 (Massey & Hunter, 1998), but this still corresponds to a mean interstellar separation AU. Thus the forces deposited in the small regions where our approximation does not apply will not tend to be dynamically dominant, since the forces exerted by different stars will tend to cancel one another.
Appendix B Results for convective versus radiative stability limits
As described in the main text, CKTC18’s calculation of the critical surface Eddington ratio at which systems transition from stable and sub-Eddington to unstable and super-Eddington depends weakly on the assumptions one makes about the effectiveness of convective heat transport in fluid where radiation pressure dominates the enthalpy budget, and thus conventional fluid convection is ineffective. All figures shown in the main text, except where noted, are for the “efficient convection" where one assumes that, despite radiation dominating the enthalpy budget, convection is nonetheless able to completely flatten the entropy gradient. To justify our assertion that the results would not change qualitatively under the opposite assumption that convection is unable to alter the entropy gradient in this regime, in Figure 7 we repeat our calculation of the final star formation efficiency using this alternative assumption. In this figure, the solid lines show the case assuming inefficient convection, while the dashed lines show the results assuming efficient convection as in the main text. Clearly there is little qualitative difference between the results in the two cases.
Appendix C The effects of a clumpy gas distribution
In CKTC18, we did not explicitly consider the effects of gas clumping on the column density, because we could simply envision our calculation as applying locally to every patch of a galactic disc. In spherical geometry, however, the column is necessarily an averaged quantity, and thus we must consider how inhomogeneities in a cloud are likely to affect the gas column density .
Up to the point where the radiation flux becomes large enough to start ejecting gas, variations in will be driven primarily by turbulence. Thus for the purposes of calculating at what point radiation is capable of ejecting mass, the column density distribution that is relevant is the one induced by turbulence, which Thompson & Krumholz (2016) show is well-described by a probability distribution function (PDF) that is approximately lognormal, with a dispersion given by
| (31) |
Here is the Mach number of the turbulence,
| (32) |
and is the index of the density power spectrum. For such a distribution, the area-weighted median column density is lower than the area-weighted mean by a factor of , while the mass-weighted median is higher by the same factor. For , this factor is , i.e., the median column density is within a factor of 4 of the mean column density. Thus the variations in column density induced by turbulence, as opposed to the variations in volume density, are relatively modest, and comparable to our uncertainties in other quantities (e.g., the dust opacity). Our estimated final column densities should be regarded as uncertain by roughly this factor.
There remains the possibility that these modest variations in column density will have substantially larger effects on the interaction of radiation with the gas, due to preferential escape of photons through low-density regions. However, radiation-hydrodynamic simulations show that this effect is surprisingly small, and does not substantially alter the conditions for gas to be ejected compared to the results of a naive laminar calculation (Davis et al., 2014; Tsang & Milosavljević, 2015; Zhang & Davis, 2017).