Evidence for ground state and defect-induced spin glass behaviour in the pyrochlore osmate Y2Os2O7
Abstract
We present AC and DC magnetometry, heat capacity, muon spin relaxation (SR) and resonant inelastic X-ray scattering (RIXS) studies of the pyrochlore osmate Y2Os2O7. We observe a non-zero effective moment governed by where is the fraction of Os sites which exhibit a spin, and spin freezing at temperature K, consistent with previous results. The field dependence of magnetisation data shows that the paramagnetic moment is most likely due to large moments on only a small fraction of Os sites. Comparison of single-ion energy level calculations with the RIXS data yields a non-magnetic ground state on the Os4+ sites. The spin-orbit interaction, Hund’s coupling and trigonal distortion of OsO6 octahedra are all important in modelling the experimentally observed spectra. We are able to rule out impurity effects, leaving disorder-related effects such as oxygen non-stoichiometry or site interchange between Os and Y ions as the most plausible explanation for the magnetic response in this material.
I Introduction
In the single-ion picture, octahedrally coordinated transition-metal ions with a electronic configuration, such as Os4+ and Ir5+, are expected to have a non-magnetic singlet ground state. For strong spin-orbit coupling, the levels are split into a fully-filled quadruplet and an empty doublet yielding an overall , while for strong Hund’s coupling each site is in a , state with and coupled by the spin–orbit interaction in a state. Since the ion is non-magnetic in both of these limits, the singlet ground state is expected to be robust.
Such materials have been studied since the 1960s Earnshaw et al. (1961), and although many are non-magnetic there are cases in which a magnetic moment and possibly magnetic ordering is nevertheless observed experimentally Ramos et al. (1995); Wang et al. (2014); Cao et al. (2014); Corredor et al. (2017); Dey et al. (2016); Hammerath et al. (2017); Zhao et al. (2016); Ranjbar et al. (2015); Terzic et al. (2017), with several different novel mechanisms being proposed to explain this Khaliullin (2013); Meetei et al. (2015); Bhowal et al. (2015); Chen et al. (2017). Notable examples which have been studied recently include the double perovskite iridates YIrO6 ( Sr, Ba) Cao et al. (2014); Dey et al. (2016); Corredor et al. (2017) and the pyrochlore osmates Os2O7 ( rare earth) Zhao et al. (2016). For the iridates, some theories proposed that a novel excitonic mechanism related to the interplay of spin–orbit coupling and superexchange was behind the magnetic state Khaliullin (2013); Meetei et al. (2015); Bhowal et al. (2015). It has been pointed out, however, that the superexchange interaction is probably not strong enough in the YIrO6 family to induce excitonic magnetism since the IrO6 octahedra are isolated from one another Pajskr et al. (2016). Instead, the observed moment has been ascribed to extrinsic effects, such as paramagnetic impurities Dey et al. (2016); Hammerath et al. (2017); Fuchs et al. (2018) and antisite disorder Chen et al. (2017); Fuchs et al. (2018).
The pyrochlore osmates provide more promising candidates for excitonic magnetism since the OsO6 octahedra form a corner-sharing network, meaning the superexchange is expected to be much larger. Less work has been done on this family of materials, with one experimental study on the Y and Ho pyrochlores observing non-zero moments in both cases Zhao et al. (2016).
In this work we add to previous studies on candidates for excitonic magnetism by reporting measurements on Y2Os2O7 made with a variety of techniques including AC and DC magnetic measurements, muon spin relaxation (SR) and resonant inelastic x-ray scattering (RIXS). The interpretation of the data is informed by single-ion electronic structure calculations. We find that the observed paramagnetic moments undergo a bulk spin freezing at low temperatures similar to that found to occur in canonical spin glasses. Single-ion calculations based on the actual distorted crystal structure yield a state in the intermediate coupling regime and indicate that spin–orbit coupling, Hund’s coupling and the trigonal crystallographic distortion are all important in modelling the experimental spectra. Having ruled out impurity effects, the field-dependence of magnetisation measurements shows that the magnetism must be due to large moments on only a small fraction of Os sites, allowing us to conclude that the observed paramagnetic moment is likely related to crystalline disorder, such as oxygen non-stoichiometry or site mixing between Os and Y ions.
II Experimental details
| Temperature (K) | (Å) | O48f occupancy (%) | (Os) (Å2) | (Y) (Å2) | (O48f) (Å2) | (O8b) (Å2) | |
|---|---|---|---|---|---|---|---|
| 200 | 10.225(1) | 0.3352(2) | 98.7(5) | 0.46(2) | 0.84(4) | 0.91(3) | 0.78(7) |
| 100 | 10.222(1) | 0.3354(2) | 98.5(8) | 0.42(3) | 0.71(5) | 0.83(5) | 0.70(9) |
| 2 | 10.220(1) | 0.3355(2) | 98.5(8) | 0.41(3) | 0.68(5) | 0.81(5) | 0.67(9) |
A 5.2 g polycrystalline sample of nominal composition Y2Os2O7 was synthesised through a conventional solid-state reaction. A stoichiometric mixture of Y2O3 and OsO2 was ground and sealed in an evacuated quartz tube, then the tube was heated up to 773 K and left at this temperature for 24 hours. The product was reground and pressed into a pellet and sealed in a new quartz tube under vacuum. The quartz tube was heated slowly up to 1173 K and kept at this temperature for 2 days. The target phase was thus obtained after shutting off the furnace.
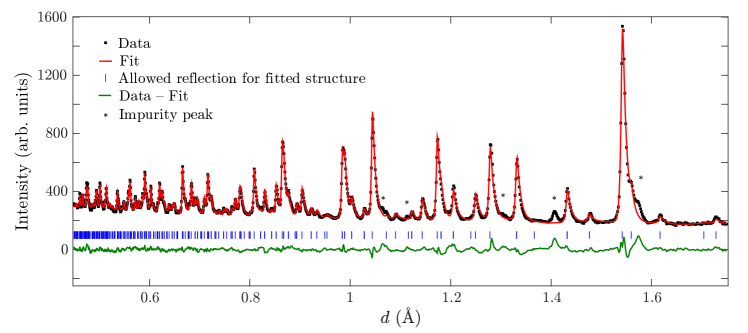
Elastic neutron scattering measurements performed on the GEM beamline at the ISIS facility Williams et al. (1997) allowed for a full structural refinement as shown in Fig. 1 and Table 1, yielding lattice parameter = 10.225(1) Å. Superficially, the refinement indicates an oxygen deficiency of approximately 1.5 %, but this result is not reliable as there is an uncertainty of around 2 % in the neutron scattering length of Os Sears (1992). The only fractional coordinate in this structure which is not constrained by symmetry is the oxygen site -coordinate which we find to be 0.3352(2) at 200 K. For reference, zero trigonal distortion of the OsO6 octahedra corresponds to , with indicating trigonal compression of the octahedra in this case. The structural parameters are similar but not identical to those reported in Ref. Zhao et al., 2016, with the variation possibly related to different levels of microscopic disorder resulting from the different sample synthesis routes. A small number of low-intensity peaks from an unidentified impurity phase can also be seen. These peaks could not be indexed by Y, Os, any known oxide of Y or Os, or any material expected to be close to the beam path. Based on the intensity of the strongest peaks in the neutron scattering spectrum we estimate that the impurity is on the level of and note that the SR, RIXS and specific heat measurements presented in this work, being bulk probes, are expected to be relatively insensitive to this level of impurity. The potential effects of the impurity on magnetisation will be discussed in Section III.1.
DC magnetisation measurements up to 16 T and specific heat measurements were performed on a Quantum Design Physical Property Measurement System (PPMS), and AC and DC magnetisation measurements up to 7 T were performed on a Quantum Design Magnetic Property Measurement System (MPMS). Muon-spin relaxation (SR) measurements were performed in a 4He cryostat (3.8–225 K) and a dilution refrigerator (92 mK–3.8 K) on the MuSR beamline at the ISIS Pulsed Muon Facility King et al. (2013) on part of the powder sample packed in a 25-m silver foil packet mounted on a silver backing plate. An additional measurement on the same sample was performed in a 4He cryostat on the GPS spectrometer at the Paul Scherrer Institute (PSI) to check the low decay time spectrum at 1.5 K. Resonant Inelastic X-ray Scattering (RIXS) data were taken on a pressed pellet of the sample at the beamline ID20 of the European Synchrotron Radiation Facility Moretti Sala et al. (2018).
III Results
III.1 DC Magnetisation
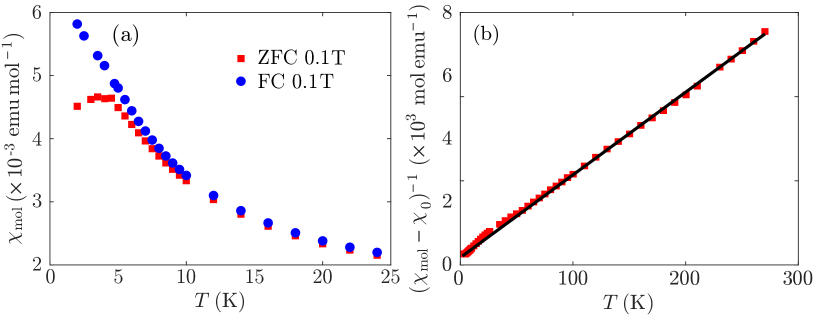
DC magnetic susceptibility data [Fig. 2] show Curie-Weiss-like behaviour over a large temperature range with departures below about 60 K and a significant splitting between field-cooled and zero-field-cooled curves below about 5 K. For temperatures above 70 K the data fits well to the form
| (1) |
where is the DC susceptibility expressed in CGS units (emu mol-1), is the fraction of Os sites which exhibit a magnetic moment and is the effective moment due to each of these Os sites [Fig. 2(b)]. This yields , a Curie-Weiss temperature of K, and a temperature-independent background susceptibility emu mol-1. The formula unit for all molar quantities here and throughout this work is Y2Os2O7 unless otherwise stated. The origin of the significant temperature-independent component of the susceptibility will be discussed in more detail in Section IV.3 in light of our RIXS results.
The observed DC magnetic susceptibility appears qualitatively very similar to that reported in Ref. Zhao et al., 2016, differing only by a constant factor close to 1. The sample measured in that work contained 7% Y2O3 and 10% OsO2 impurities and the authors do not mention any unknown impurity similar to the one seen here. The close similarity between the two samples from different sources and containing different secondary phases (albeit at low levels) indicates that the dominant features in the measured magnetisation are from the Y2Os2O7 phase. We will provide further evidence that the impurity does not affect the measured magnetisation in Section IV via in-depth analysis of our SR results.
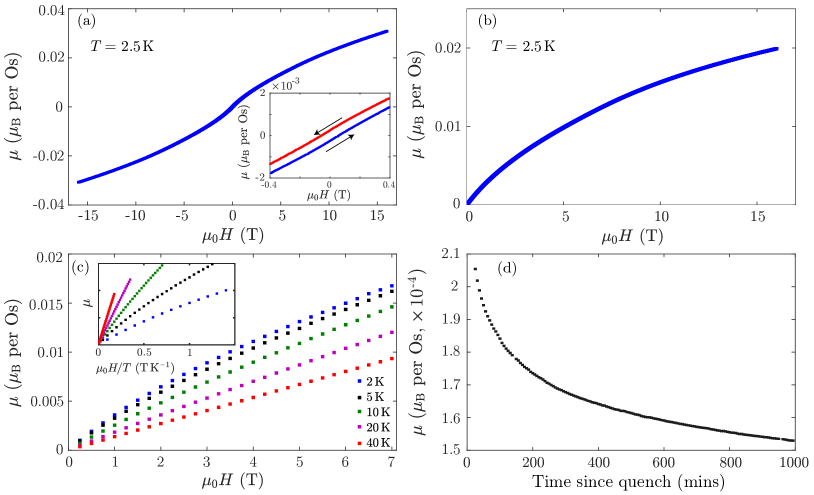
Magnetisation data taken up to 16 T at 2.5 K [Fig. 3(a)] shows a small hysteresis (inset of figure). Due to the significant van-Vleck susceptibility of this material, the moment is expected to be linear in at high enough fields once the Curie-Weiss-like moments have reached saturation. We therefore subtract a van-Vleck contribution corresponding to emu mol-1 consistent with the Curie–Weiss fit [Fig. 3(b)]. The moment does not saturate up to the maximum field of 16 T, but it does appear to be approaching saturation. We find that the observed rate of approach to saturation makes it unlikely that the saturated paramagnetic moment exceeds 0.04 per Os site averaged over the whole sample.
The temperature dependence of the magnetisation curves [Fig. 3(c)] shows that the moment does not exhibit normal paramagnetic behaviour at low temperature. Instead, it is close to temperature-independent at the lowest temperatures (2 K–5 K) with ideal paramagnetic behaviour according to the Brillouin function (i.e. being a function of only) not recovered up to 40 K.
The sample also shows a small but observable remanent magnetisation and time-dependent relaxation when quenched from 7 T [Fig. 3(d)] at 2 K, with the moment not decaying fully even after many hours. The curve does not fit to a single exponential, consistent with a spread of decay times.
III.2 AC Magnetisation
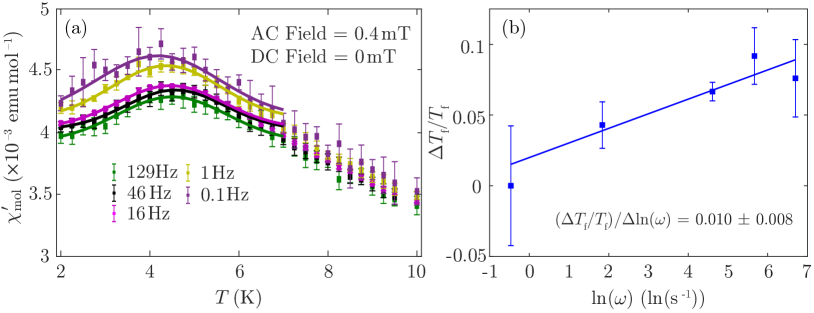
In the real part of the AC susceptibility [Fig. 4(a)] a clear peak is seen close to the proposed spin freezing temperature K (Ref. Zhao et al., 2016), with the peak moving to lower temperatures and having a higher maximum at lower frequencies. This shift in the peak position with frequency shows that there are slow magnetic dynamics in the 0.1–1000 Hz range. More quantitatively, we find that the peak shift is consistent with the relation
| (2) | ||||
with [Fig. 4(b)], which is within the range found for typical spin glasses Gatteschi et al. (2006); Bałanda (2013).
We found that the imaginary part of the AC susceptibility was smaller than the instrumental resolution of the magnetometer used for our measurements at all frequencies and temperatures measured, i.e. emu mol-1. This weak is consistent with the behaviour of known spin glasses and indicates a wide spread of relaxation times Bałanda (2013).
The hysteretic and frequency-dependent effects described here, including the splitting between field-cooled and zero-field-cooled DC magnetization, AC magnetization and remanence are all characteristic features of canonical spin glasses and other spin-glass-like pyrochlore systems such as Y2Mo2O7 Raju et al. (1992); Dunsiger et al. (1996).
III.3 Heat Capacity
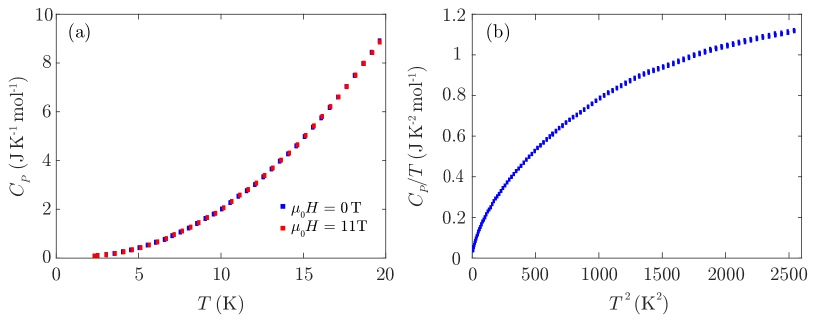
The zero-field specific heat of a pressed pellet made from the above sample is smooth at all temperatures down to 2 K and shows no obvious signature of the spin glass transition or any other magnetic behaviour [Fig. 5(a)]. A plot of as a function of [Fig. 5(b)] shows that the data do not fit a simple Debye model () over any measured temperature range.
Remarkably, on applying a large (11 T) magnetic field we find no observable change in the specific heat of Y2Os2O7 at any temperature as shown in Fig. 5(a). Since such a large magnetic field can reasonably be expected to significantly affect the magnetic state – and hence the magnetic component of the heat capacity – it is very likely that the specific heat measured experimentally is almost entirely due to phonons, and any magnetic contribution is unresolvably small at all temperatures.
Although surprising, we find that the lack of an observed magnetic specific heat signal is consistent with the results of the other measurements presented here. The effective moment per Os () is quite small and the spin glass state likely has a large amount of residual disorder, so the entropy change associated with the spin-freezing transition may be quite low. Additionally, the release of entropy for typical spin glasses has been observed to be spread over a large temperature range up to around Binder and Young (1986), resulting in a very small contribution to the specific heat at any given temperature Wenger and Keesom (1976).
Our measurements of Y2Os2O7 are consistent with the data presented by Zhou et al. in Ref. Zhao et al., 2016. However, our conclusion that there is no observable magnetic contribution to the specific heat differs. We therefore performed further heat capacity measurements on a pellet of Y2Ti2O7 as a non-magnetic reference sample. For Y2Ti2O7, we obtained virtually identical data to Zhou et al. up to 30 K. However we find that, after applying the same scaling, the zero-field specific heats of Y2Ti2O7 and Y2Os2O7 are not the same above 30 K, where any magnetic signal due to spin glass behaviour should be small. The discrepancy between this finding and the conclusions of Ref. Zhao et al., 2016 indicates that Y2Ti2O7 is not a sufficiently accurate non-magnetic background sample to isolate the small magnetic contribution to the heat capacity.
III.4 Muon Spin Relaxation (SR)
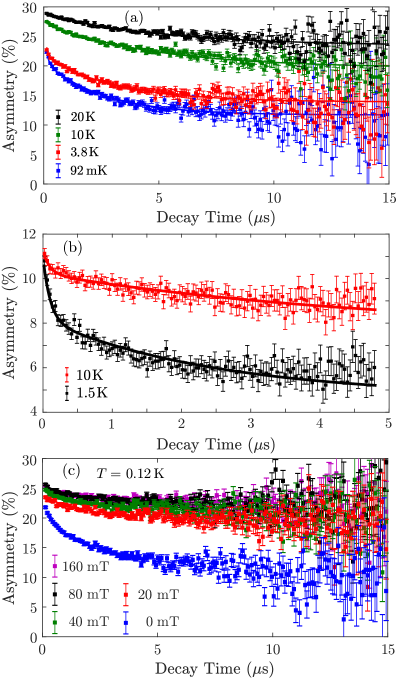
Zero-field SR data measured at ISIS shows very little relaxation of the implanted muons at high temperatures K (not shown), as expected for a paramagnet, with relaxing behaviour developing gradually on cooling below this point [Fig. 6(a)]. The relaxation becomes significantly greater below around 20 K as the spin freezing temperature is approached, although the spectrum does not completely stop evolving even at the lowest measured temperature of 92 mK. This indicates that the evolution of magnetic fluctuations in this system is very gradual, as is typical for spin glasses. No oscillations are seen at any temperature confirming that there is no long-range magnetic order, and additional datasets at 1.5 K and 10 K taken at PSI with much higher time resolution confirm that there is no oscillatory behaviour on shorter time scales down to 0.1 s [Fig. 6(b)]. Overall the data are remarkably similar to those seen in canonical spin glasses such as AgMn Keren et al. (1996), supporting the assertion that some kind of spin freezing occurs in this material.
In an applied longitudinal field at 0.12 K [Fig. 6(c)], a significant proportion of the relaxation is decoupled at the smallest measured field of 20 mT, with no observable change between 80 mT and 160 mT. A similar longitudinal field dependence was also found at 2 K (not shown). It has been shown that the relaxation caused by a distribution of static internal fields can be quenched by an applied field that exceeds the internal fields by about a factor of 10 (Ref. Hayano et al., 1979). Therefore, our observations suggest that there is a small ( mT) static (on the muon precession timescale) component of the internal field in Y2Os2O7.
III.5 Resonant Inelastic X-Ray Scattering (RIXS)
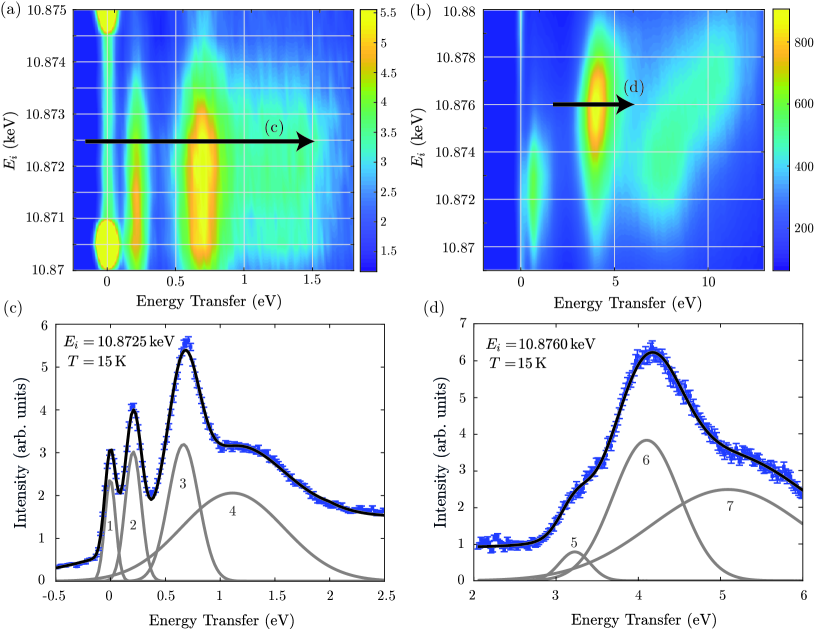
In Fig. 7(a–b), we show RIXS maps of the Os resonance measured at 15 K. In the lower resolution map (b) the most significant feature is a high intensity excitation peaked at energy transfer eV and keV. In the higher resolution map (a) two excitations are seen clearly at energy transfers eV and 0.7 eV, as well as a weaker, broad feature around –1.25 eV. Within the resolution of these data, all these lower energy excitations resonate at the same incident energy keV. There are also some broad, weak excitations at energy transfers around 3.33 eV and above 5 eV. Cuts through all these features [Fig. 7(c–d)] show that no splitting into sub-levels is resolvable in any of them.
As the incident photon energy is tuned to the Os edge we assume that the observed excitations involve Os states. The crystal field at the Os site is close to cubic with a small perturbing trigonal distortion, so to a first approximation we can identify the eV feature with single-ion – excitations and the low energy features with intra- excitations. This assumption allows us to estimate the cubic crystal field parameter 10 = 4.2 eV. This assignment is supported by the fact that the – and intra- excitations resonate at energies separated by around 4 eV and that this crystal field value is comparable to that found in other osmates, for example 10 = 4.3 eV in Ba2YOsO6 and 10 = 4.5 eV in Ca3LiOsO6 Taylor et al. (2017).
To quantify the energies and widths of these RIXS excitations, we performed phenomenological fits of the spectra in Fig. 7, with the data in panels (c) and (d) modelled by a linear background and several Gaussian peaks. The corresponding fit parameters, numbered as indicated in the figures, are given in Table 2.
IV Analysis
Our magnetization, heat capacity and SR results provide evidence for spin glass behavior in Y2Os2O7 with a small average magnetic moment per Os site of about 0.4 /Os, consistent with previous work (Ref. Zhao et al., 2016). We shall now present analysis which shows that this moment is most likely associated with a small concentration of sites carrying large spins in a non-magnetic host, as opposed to a small spin on every site.
| (eV) | (eV) | ||
|---|---|---|---|
| 1 | 470(20) | -0.003(2) | 0.050(2) |
| 2 | 600(20) | 0.206(2) | 0.073(3) |
| 3 | 640(30) | 0.665(4) | 0.139(6) |
| 4 | 410(10) | 1.11(3) | 0.47(2) |
| 5 | 170(20) | 3.23(2) | 0.19(3) |
| 6 | 820(40) | 4.10(1) | 0.41(2) |
| 7 | 530(20) | 5.08(6) | 0.93(4) |
IV.1 Field-Dependent Magnetisation
Assuming local moments with effective spin , we can establish from the results of our Curie–Weiss fit that
| (3) |
where is the -factor of the moment. We are unable to determine , and separately, but as the saturated moment
| (4) |
has a different dependence on and we can use the field dependence of our magnetisation data, together with assumptions derived from the observed spin-glass behavior, to test the likelihood of different values of .
For this analysis we shall consider and 1, chosen as representative of the scenarios in which the moments are dilute and concentrated, respectively. The lower value is typical of the levels of inter-site mixing and microscopic disorder reported in similar iridate materials Dey et al. (2016).
For each , we can use the constraint in Eq. (3) to eliminate one of and . Having done this, we can then calculate as a function of the remaining variable using Eq. (4). In the discussion which follows, we shall assume has been eliminated in this way, leaving as a function of alone, however the analysis would proceed in the same way if we were to treat as a function of instead.
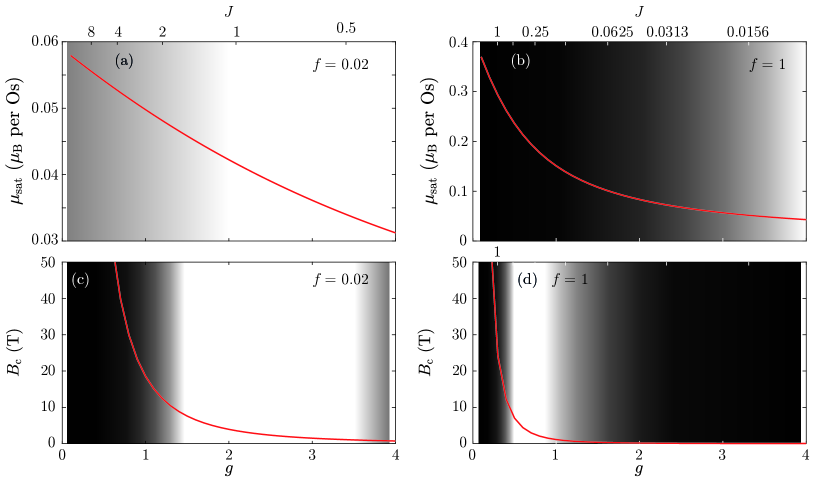
Plots of as a function of obtained this way are presented in Fig. 8(a) for , and Fig. 8(b) for . As discussed earlier, our magnetisation data indicate that does not exceed about , and so from Figs. 8(a–b) we see immediately that if , and for .
We now consider the implications of the spin-glass regime. Normal paramagnetic behavior is not observed here (see Fig. 3), and we assume that as a function of is governed instead by some average internal energy barrier comparable with the spin freezing temperature K, i.e. .111We note that the authors of Ref. Zhao et al., 2016 have extracted an energy barrier to spin reorientation of K based on a fit of the Arrhenius Law to the peaks in the real part of the AC susceptibility. This fitting procedure has been shown to yield unphysically large energy barriers when applied to spin glasses, as discussed in Refs. Bałanda, 2013; Hüser et al., 1983; Huser et al., 1986; Souletie and Tholence, 1985, with information about usually being required to obtain a physically realistic energy barrier. At we expect that spins can overcome the energy barrier and align with an external field provided , where
| (5) |
is a crossover field. Figures 8(c–d) plot as a function of for and , respectively, calculated from Eqs. (5) and (3). We take as a lower limit for , where T is an estimate of the saturation field at from Fig. 3, and we take the upper limit on to be . Hence, we conservatively estimate to be in the range 1 T 10 T. The allowed range of corresponding to this acceptable range of is indicated on Figs. 8(c–d).
Figure. 8 shows that there are values of which are very improbable. These are represented by the darker shaded regions on the plots. For we find that all values of are very unlikely under these constraints, while for the constraints are satisfied when . Converting this range of into a range of using Eq.(3), we obtain . Overall we find that for there is a wide range of physically reasonable and parameters consistent with the magnetisation data, but for no such combination of parameters exists.
It is noteworthy that, since the calculated and are both a factor of 5–10 larger for than for , the above arguments still hold for quite significant changes in or in the experimental constraints. For example, any value of still yields some plausible values of , whereas any leads to all values of being unlikely based on experiment. We therefore conclude that the fraction of occupied Os sites is very likely to be on the order of a few %, with the majority of Os sites adopting a non-magnetic state.
IV.2 Muon Spin Relaxation (SR)
Having established that the spins in the sample are very likely to be dilute, we now perform fitting and simulations of the spin-glass-like relaxation in our SR spectra.
IV.2.1 Fitting
At all temperatures the SR asymmetry appears to consist of a relaxing part plus a constant baseline component which does not relax even at long decay times, with the relative magnitudes of these two parts varying significantly with temperature. In order to quantify this we performed fits to the sum of two exponentials plus the baseline asymmetry, at each temperature where is the observed muon decay asymmetry, is the decay time, and are the two exponential decay rates, is relaxing asymmetry due to muons experiencing a field in the sample, and is the baseline asymmetry from muons which do not experience a magnetic field. includes muons which stop in the sample holder, cryostat/dilution fridge and any non-magnetic or paramagnetic parts of the sample. Throughout this procedure the initial asymmetry was held constant at for the 4He cryostat and at for the dilution fridge. These values were found by fitting the initial asymmetry to the highest temperature dataset available for each sample environment, since should only be a function of the muon beam polarisation and sample environment and is not expected to change with temperature. For datasets above 40 K we found that the spectrum fitted well to a single exponential so at these temperatures was fixed at 0, while for lower temperatures the full double-exponential form was required. The best possible fit was obtained by fixing to its value in the lowest-temperature dataset in each sample environment for all double-exponential fits.
Physically, exponential relaxation can result from a dilute distribution of static moments Walstedt and Walker (1974) or dynamic moments with a single correlation time within the resolution of the spectrometer Khasanov et al. (2008). The observation of two distinct exponential components may have a range of explanations including two different muon stopping sites, two different magnetic phases or two distinct correlation times for dynamic moments. Alternatively, the double-exponential fit may be a phenomenological fit to a more complex distribution of internal fields and relaxation times.
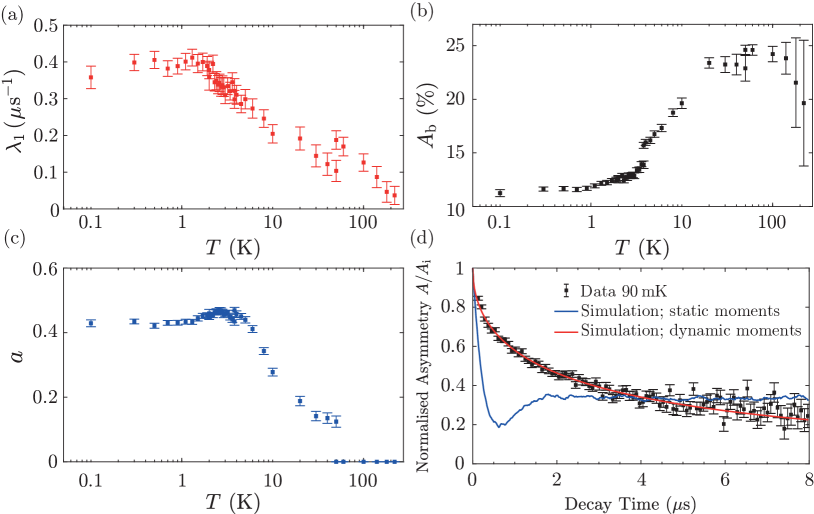
The temperature dependences of the double-exponential fit parameters are presented in Fig. 9. The relaxation rate shows behaviour which is reminiscent of that seen in other spin glasses Keren et al. (1996); Uemura et al. (1985), with an increase on cooling up to a peak at the spin-glass temperature followed by a plateau below this point. The spin freezing temperature is K based on this measurement, which is slightly lower than that seen in AC susceptibility. This discrepancy may be due to the different fluctuation timescales probed by the different techniques.
The baseline asymmetry shows a clear decrease on cooling before flattening out below , except for a jump at 3.8 K which can be attributed to the change of sample environment from 4He cryostat to dilution fridge at this temperature. This temperature dependence indicates that the volume of sample which is in a paramagnetic state decreases only gradually on cooling with no particularly sharp change at any temperature. A possible explanation for this would be if spins in different parts of the sample are freezing at slightly different temperatures, which is plausible behaviour for a spin glass.
Overall, it is very likely that the relaxing portion of the SR spectrum is caused by the same part of the sample as the dilute spins which show hysteretic, spin-glass-like behaviour in magnetisation measurements. Since the muons can be assumed to stop randomly throughout the Y2Os2O7 and impurity phases, we can therefore use the magnitude of the relaxing SR signal relative to the background to examine which of the two phases the spins are located in.
Muons stop randomly in the impurity and Y2Os2O7 phases in proportion to their volume, and it is reasonable to assume that muons stopping in the Y2Os2O7 would not couple significantly to magnetic fluctuations in the impurity phase. Since the impurity is only a few % of the sample by volume, the relaxing asymmetry would therefore be much smaller than the baseline asymmetry if the impurity were the source of spin-glass behaviour. At low temperature, the baseline asymmetry is similar in value to the relaxing asymmetry (e.g. % and % at 92 mK). We therefore find that a magnetic impurity phase cannot be the source of the observed spin-glass behaviour.
If the spins are located in the Y2Os2O7 phase, magnetic exchange mediated by ions located between the spins and the muon stopping sites in this phase would likely cause a significant magnetic field at the muon site. For example, in the double perovskite iridates it has been shown that exchange mediated by Y3+ and O2- ions is significant even between second- and third- nearest-neighbour Ir sites Fuchs et al. (2018). Furthermore, simulations presented in Ref. Fuchs et al., 2018 show that for a double perovskite lattice populated with a few % spins on one of the octahedral sites the majority of Ir sites are no further than the third-nearest-neighbour distance from a spin. Assuming that similar results hold for the pyrochlore structure of Y2Os2O7, muons stopping at most locations within the Y2Os2O7 phase will experience a significant magnetic field even if the spin concentration is low. We therefore conclude that the relaxing behaviour is consistent with dilute moments in the main Y2Os2O7 phase, and that the impurity phase shows no noticeable signal other than a constant background in SR.
IV.2.2 Simulations
For the lowest temperature dataset we have performed a simulation similar to that presented in Ref. Kirschner et al., 2016 to try to extract information about the spin dynamics. This simulation involves randomly populating a lattice with magnetic moments on a fraction of the sites then examining the internal field at a muon test site.
If the spins are assumed to be completely static, the simulation results in an asymmetry
| (6) |
where is the width of the field distribution at the muon site, is the probability of finding that field width for a randomly chosen muon site and MHz T-1 is the gyromagnetic ratio of the muon Hayano et al. (1979). The simulated spectrum assuming the most likely values of and is presented in Fig. 9(d), however we find that this model cannot reproduce the data for any values ().
If the spins are allowed to fluctuate, the model asymmetry becomes
| (7) |
where is the fluctuation rate Hayano et al. (1979). The model with fluctuations provides a much better fit to the data. For and the best fit is achieved with MHz, as plotted in Fig. 9(d). This fit is, however, reliant on an adjustment of from the previously fitted value of 11% to %. If the baseline asymmetry is fixed at 11% we find that the model cannot reproduce the data even in the dynamical case. This indicates either that the data is not well-modelled by this scenario or that even at the lowest temperatures a significant fraction (%) of muons stopping in the sample experience a non-magnetic or paramagnetic environment. Given that we have ruled out impurities on the level this latter situation would imply that the Y2Os2O7 phase still contains some non-magnetic regions even well below .
IV.3 RIXS Single Ion Calculations
It is reasonable to assume RIXS is sensitive to all Os sites in the sample, the majority of which we have now established to be non-magnetic based on the above analysis of our other experimental results. We therefore performed single-ion calculations assuming the electronic configuration for the Os ions, including inter-electron interactions, spin-orbit interaction and trigonal crystal field terms in the Hamiltonian in order to understand the origin of the excitations seen in RIXS. This procedure is outlined in Refs. Gerloch, 1983; König and Kremer, 1977 and involves writing each contribution to the Hamiltonian as a matrix using the properly antisymmetrized multielectron states of the configuration as a basis then numerically diagonalising the combined Hamiltonian. The inter-electron interaction is written in terms of Racah parameters Georges et al. (2013) , and which can be transformed into intra- and inter-orbital Coulomb interactions and and the effective Hund’s coupling via
| (8) |
Following Ref. Hempel, 1976 the crystal field is parametrised by , and , where represents the octahedral crystal field, and and small trigonal distortions away from the perfect octahedral case. 222The parameters , and used in this work correspond to the parameters with the same symbols in Ref. Hempel, 1976. The spin-orbit coupling strength enters via a single parameter .
Some of the above parameters could be found from experiment before performing calculations. We have estimated from the RIXS data that 10 = 4.2 eV, and there is a direct relationship between , the sign of and the oxygen position 0.3352(2) Lever and Hollebone (1972); Hempel et al. (1976) which yields eV and tells us that must have the same sign (–) as . The Racah parameter only appears on the diagonal elements of the Hamiltonian and causes only a constant shift of all energy levels. Since spectroscopy reveals only relative, not absolute energies, is not determined by this measurement.
All other parameters ( and ) are in general free and ideally would be fitted to experimental data. Unfortunately, we do not observe enough excitations in the experiment for this to be possible in this case. Instead, we need to fix some of the parameters to values obtained from other, similar compounds.
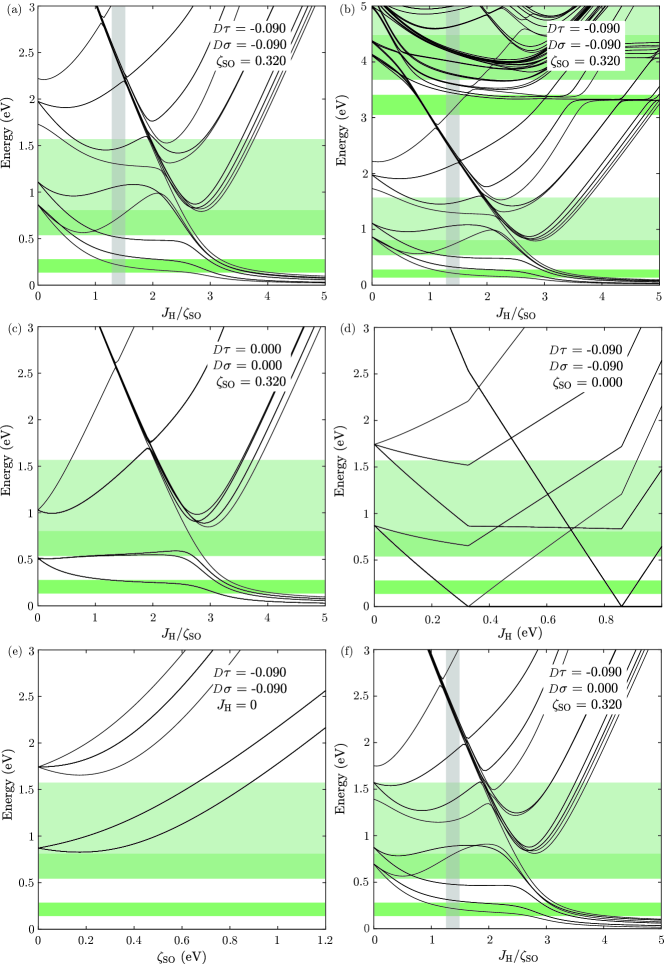
We fixed the values of 0.32 eV and to the values obtained for Ba2YOsO6 in Ref. Taylor et al., 2017 leaving as free parameters and . Fig. 10(a–b) shows the results of this calculation, in which best agreement with experiment is obtained for eV and a region around . All of the experimental peaks are consistent with one or more excitations in the calculation, although notably many of the experimental features are in fact a combination of several closely-spaced levels which are unresolved. There are several states (for example those at 0.3 eV and 0.5 eV) which fall close to the edges of the experimental peaks, as well as one set of nearly-degenerate states at around 2.1 eV which is not close to any feature in the experiment. It is possible that these states may have a low spectral weight if a full RIXS calculation were performed, in which case they would be unresolvable above the background, especially in the case of the 0.3 eV and 0.5 eV levels which may easily be swamped by the nearby, stronger excitations or combined with them via intersite hopping terms which are not included in this model.
Changing causes small perturbations to the low-lying energy levels and makes the agreement with experiment less good. The case is presented in Fig. 10(f) for comparison, showing how agreement is still close but slightly worse, in particular for the two lowest-energy observed peaks.
The above results are consistent with work on other osmates and iridates which has found Calder et al. (2016); Taylor et al. (2017); Yuan et al. (2017). We emphasise that because of the number of free parameters and the inherent uncertainty due to the unknown RIXS matrix elements we cannot conclude that the parameter values suggested here are definitely the values in this material, only that based on our current knowledge the present model is capable of explaining the data for plausible values of all parameters.
We also performed calculations by removing in turn the trigonal distortion (, Fig. 10(c)), spin orbit interaction (, Fig. 10(d)) and inter-electron interactions (, Fig. 10(e)). In all three cases we could not find any values of the remaining parameters which adequately reproduce the two lowest lying features at 200 meV and 700 meV in the RIXS spectrum. This allows us to conclude that all three effects (trigonal distortion, spin–orbit coupling and inter-electron interactions) are required to model the physics of this material.
The ground state for our likely set of parameters, as well as for any set of parameters calculated here as long as , is a non-magnetic singlet. This allows us to rule out any kind of single-ion physics, including the trigonal distortion, as the source of the magnetic moment, consistent with our conclusions from other techniques.
For all reasonable sets of parameters there are low-lying excitations in the 200–400 meV region, which may be either a doublet, triplet or closely-spaced singlet and doublet. Significantly, we find that for the trigonally distorted parameters found here ( eV) these lowest-lying excitations are a singlet at 200 meV and a degenerate doublet at 300 meV. This is in contrast to the undistorted case where the first excitation is a triplet. Quantitative theories of excitonic magnetism applied to the YIrO6 (Sr, Ba) materials such as Ref. Khaliullin, 2013 are based on a situation where the first excited state is a low-lying triplet. In the scenario proposed here for Y2Os2O7 the splitting between the singlet and doublet excitations is of the separation between the singlet excitation and the ground state, representing quite a significant departure from the scheme used in the theories. The theories may therefore need modification before being directly applied to the pyrochlore osmates.
In light of these calculations, we can now also explain the temperature independent component of the magnetic susceptibility in Fig. 2. It was shown in Refs. Chen et al., 2017; Khaliullin, 2013 for Ba2YIrO6 that, following standard second order perturbation theory, in the single-ion case the magnetic susceptibility of a system with a singlet ground state and a low-lying triplet excited state at 350 meV is temperature-independent and on the order of emu mol-1. For Y2Os2O7, the first and second excited states are a singlet and a doublet, respectively, with a similar average energy above the ground state as the triplet in Ba2YIrO6. The van-Vleck susceptibility for Y2Os2O7 is therefore expected to be of similar magnitude to that of Ba2YIrO6, consistent with our observed value of emu mol-1.
V Discussion
When all of our experimental results are considered together, a consistent picture emerges with the majority of Os sites in a non-magnetic state along with a few sites exhibiting a large spin. These magnetic defect sites are likely caused by some kind of microscopic disorder, for example related to oxygen deficiency in the sample, site disorder involving partial interchange of Y3+ and Os4+ ions, or partial static charge disproportionation (2 Os Os Os5+).
This scenario is very similar to that proposed in the recent preprint Ref. Fuchs et al., 2018 for the iridate Ba2YIrO6, where the authors show via electron spin resonance (ESR) spectroscopy that the observed magnetic moment is caused by a small percentage of Ir6+ () and Ir4+ () magnetic defects, with the majority of Ir sites remaining in the non-magnetic Ir5+ () configuration. A similar scenario in Y2Os2O7 would be consistent with all of our data; for example, only 1% of Os sites in the spin-only configuration (, ) would lead to , very close to our measured value of .
The authors of Ref. Fuchs et al., 2018 also show that medium- and long-range interactions, possibly involving exchange mediated by Y ions, are significant in Ba2YIrO6 and that the magnetic defects tend to form extended correlated clusters even at low concentrations. Such long-range interactions and clustering of magnetic defects would provide a natural explanation for the spin-freezing in Y2Os2O7, including the observation in our SR that the proportion of the sample exhibiting non-magnetic behaviour reduces gradually with temperature, and that some regions of the sample appear non-magnetic even below .
VI Conclusion
Our AC and DC magnetisation, heat capacity and SR measurements all show results consistent with low temperature spin-glass behaviour as suggested in Ref. Zhao et al., 2016. Having ruled out impurity effects, we have shown that the observed Curie-Weiss-like moment in Y2Os2O7 is very likely due to large moments located on a small proportion of Os sites, perhaps related to microscopic disorder in the sample. We have also shown via RIXS measurements in conjunction with single-ion energy level calculations that the majority of Os sites in Y2Os2O7 exhibit a ground state with low-lying singlet and doublet excited states in the single-ion picture. Overall, a scenario similar to that recently proposed by Fuchs et al. Fuchs et al. (2018) with a small proportion of magnetic defects in a or configuration along with majority non-magnetic Os sites can explain all of our observations.
VII Acknowledgements
We thank F. Lang for useful discussions. The European Synchrotron Radiation Facility (ESRF) provided synchrotron radiation. Experiments at the ISIS Neutron and Muon Source were supported by a beamtime allocation from the Science and Technology Facilities Council. This work was supported by the U.K. Engineering and Physical Sciences Research Council (Grant Nos. EP/N034872/1 and EP/N034694/1, and a studentship for N.R.D.), the National Natural Science Foundation of China (11774399,11474330), the Chinese Academy of Sciences (XDB07020100 and QYZDB-SSW-SLH043) and the Shanghai Pujiang Program (17PJ1406200). F. K. K. K. thanks Lincoln College, Oxford, for a doctoral studentship.
References
- Earnshaw et al. (1961) A. Earnshaw, B. N. Figgis, J. Lewis, and R. D. Peacock, J. Chem. Soc. 0, 3132 (1961).
- Ramos et al. (1995) E. Ramos, I. Alvarez, R. Sáez-Puche, M. Veiga, and C. Pico, J. Alloys Compd. 225, 212 (1995).
- Wang et al. (2014) J.-C. Wang, J. Terzic, T.-F. Qi, F. Ye, S.-J. Yuan, S. Aswartham, S. V. Streltsov, D. I. Khomskii, R. K. Kaul, and G. Cao, Phys. Rev. B 90, 161110 (2014).
- Cao et al. (2014) G. Cao, T.-F. Qi, L. Li, J. Terzic, S.-J. Yuan, L. E. DeLong, G. Murthy, and R. K. Kaul, Phys. Rev. Lett. 112, 056402 (2014).
- Corredor et al. (2017) L. T. Corredor, G. Aslan-Cansever, M. Sturza, K. Manna, A. Maljuk, S. Gass, T. Dey, A. U. B. Wolter, O. Kataeva, A. Zimmermann, M. Geyer, C. G. F. Blum, S. Wurmehl, and B. Büchner, Phys. Rev. B 95, 064418 (2017).
- Dey et al. (2016) T. Dey, A. Maljuk, D. V. Efremov, O. Kataeva, S. Gass, C. G. F. Blum, F. Steckel, D. Gruner, T. Ritschel, A. U. B. Wolter, J. Geck, C. Hess, K. Koepernik, J. van den Brink, S. Wurmehl, and B. Büchner, Phys. Rev. B 93, 014434 (2016).
- Hammerath et al. (2017) F. Hammerath, R. Sarkar, S. Kamusella, C. Baines, H.-H. Klauss, T. Dey, A. Maljuk, S. Gaß, A. U. B. Wolter, H.-J. Grafe, S. Wurmehl, and B. Büchner, Phys. Rev. B 96, 165108 (2017).
- Zhao et al. (2016) Z.-Y. Zhao, S. Calder, A. A. Aczel, M. A. McGuire, B. C. Sales, D. G. Mandrus, G. Chen, N. Trivedi, H.-D. Zhou, and J.-Q. Yan, Phys. Rev. B 93, 134426 (2016).
- Ranjbar et al. (2015) B. Ranjbar, E. Reynolds, P. Kayser, B. J. Kennedy, J. R. Hester, and J. A. Kimpton, Inorg. Chem. 54, 10468 (2015).
- Terzic et al. (2017) J. Terzic, H. Zheng, F. Ye, H.-D. Zhao, P. Schlottmann, L. E. De Long, S.-J. Yuan, and G. Cao, Phys. Rev. B 96, 064436 (2017).
- Khaliullin (2013) G. Khaliullin, Phys. Rev. Lett. 111, 197201 (2013).
- Meetei et al. (2015) O. N. Meetei, W. S. Cole, M. Randeria, and N. Trivedi, Phys. Rev. B 91, 054412 (2015).
- Bhowal et al. (2015) S. Bhowal, S. Baidya, I. Dasgupta, and T. Saha-Dasgupta, Phys. Rev. B 92, 121113 (2015).
- Chen et al. (2017) Q. Chen, C. Svoboda, Q. Zheng, B. C. Sales, D. G. Mandrus, H.-D. Zhou, J.-S. Zhou, D. McComb, M. Randeria, N. Trivedi, and J.-Q. Yan, Phys. Rev. B 96, 144423 (2017).
- Pajskr et al. (2016) K. Pajskr, P. Novák, V. Pokorný, J. Kolorenč, R. Arita, and J. Kuneš, Phys. Rev. B 93, 035129 (2016).
- Fuchs et al. (2018) S. Fuchs, T. Dey, G. Aslan-Cansever, A. Maljuk, S. Wurmehl, B. Büchner, and V. Kataev, Phys. Rev. Lett. 120, 237204 (2018).
- Williams et al. (1997) W. Williams, R. Ibberson, P. Day, and J. Enderby, Physica B Condens. Matter 241, 234 (1997).
- Sears (1992) V. F. Sears, Neutron News 3, 26 (1992).
- King et al. (2013) P. J. C. King, R. de Renzi, S. P. Cottrell, A. D. Hillier, and S. F. J. Cox, Phys. Scr. 88, 068502 (2013).
- Moretti Sala et al. (2018) M. Moretti Sala, K. Martel, C. Henriquet, A. Al Zein, L. Simonelli, C. J. Sahle, H. Gonzalez, M.-C. Lagier, C. Ponchut, S. Huotari, R. Verbeni, M. Krisch, and G. Monaco, Journal of Synchrotron Radiation 25, 580 (2018).
- Gatteschi et al. (2006) M. Gatteschi, R. Sessoli, and J. Villain, Molecular Nanomagnets (Oxford University Press, 2006).
- Bałanda (2013) M. Bałanda, Acta Phys. Pol. A 124, 964 (2013).
- Raju et al. (1992) N. P. Raju, E. Gmelin, and R. K. Kremer, Phys. Rev. B 46, 5405 (1992).
- Dunsiger et al. (1996) S. R. Dunsiger, R. F. Kiefl, K. H. Chow, B. D. Gaulin, M. J. P. Gingras, J. E. Greedan, A. Keren, K. Kojima, G. M. Luke, W. A. MacFarlane, N. P. Raju, J. E. Sonier, Y. J. Uemura, and W. D. Wu, Phys. Rev. B 54, 9019 (1996).
- Binder and Young (1986) K. Binder and A. P. Young, Rev. Mod. Phys. 58, 801 (1986).
- Wenger and Keesom (1976) L. E. Wenger and P. H. Keesom, Phys. Rev. B 13, 4053 (1976).
- Keren et al. (1996) A. Keren, P. Mendels, I. A. Campbell, and J. Lord, Phys. Rev. Lett. 77, 1386 (1996).
- Hayano et al. (1979) R. S. Hayano, Y. J. Uemura, J. Imazato, N. Nishida, T. Yamazaki, and R. Kubo, Phys. Rev. B 20, 850 (1979).
- Taylor et al. (2017) A. E. Taylor, S. Calder, R. Morrow, H. L. Feng, M. H. Upton, M. D. Lumsden, K. Yamaura, P. M. Woodward, and A. D. Christianson, Phys. Rev. Lett. 118, 207202 (2017).
- Note (1) We note that the authors of Ref. \rev@citealpnumZhao2016 have extracted an energy barrier to spin reorientation of \tmspace+.1667emK based on a fit of the Arrhenius Law to the peaks in the real part of the AC susceptibility. This fitting procedure has been shown to yield unphysically large energy barriers when applied to spin glasses, as discussed in Refs. \rev@citealpnumBalanda2013, Huser1983, Huser1986, Souletie1985, with information about usually being required to obtain a physically realistic energy barrier.
- Walstedt and Walker (1974) R. E. Walstedt and L. R. Walker, Phys. Rev. B 9, 4857 (1974).
- Khasanov et al. (2008) R. Khasanov, H. Luetkens, A. Amato, H.-H. Klauss, Z.-A. Ren, J. Yang, W. Lu, and Z.-X. Zhao, Phys. Rev. B 78, 092506 (2008).
- Uemura et al. (1985) Y. J. Uemura, T. Yamazaki, D. R. Harshman, M. Senba, and E. J. Ansaldo, Phys. Rev. B 31, 546 (1985).
- Kirschner et al. (2016) F. K. K. Kirschner, F. Lang, C. V. Topping, P. J. Baker, F. L. Pratt, S. E. Wright, D. N. Woodruff, S. J. Clarke, and S. J. Blundell, Phys. Rev. B 94, 134509 (2016).
- Gerloch (1983) M. Gerloch, Magnetism and Ligand Field Analysis (Cambridge University Press, 1983).
- König and Kremer (1977) E. König and S. Kremer, Ligand Field Diagrams (Plenum Press, 1977).
- Georges et al. (2013) A. Georges, L. de’ Medici, and J. Mravlje, Annu. Rev. Condens. Matter Phys. 4, 137 (2013).
- Hempel (1976) J. C. Hempel, J. Chem. Phys. 64, 4307 (1976).
- Note (2) The parameters , and used in this work correspond to the parameters with the same symbols in Ref. \rev@citealpnumHempel1976.
- Lever and Hollebone (1972) A. B. P. Lever and B. R. Hollebone, J. Am. Chem. Soc. 94, 1816 (1972).
- Hempel et al. (1976) J. C. Hempel, R. A. Palmer, and M. C. Yang, J. Chem. Phys. 64, 4314 (1976).
- Calder et al. (2016) S. Calder, J. G. Vale, N. A. Bogdanov, X. Liu, C. Donnerer, M. H. Upton, D. Casa, A. H. Said, M. D. Lumsden, Z. Zhao, J.-Q. Yan, D. Mandrus, S. Nishimoto, J. van den Brink, J. P. Hill, D. F. McMorrow, and A. D. Christianson, Nat. Commun. 7, 11651 (2016).
- Yuan et al. (2017) B. Yuan, J. P. Clancy, A. M. Cook, C. M. Thompson, J. Greedan, G. Cao, B. C. Jeon, T. W. Noh, M. H. Upton, D. Casa, T. Gog, A. Paramekanti, and Y.-J. Kim, Phys. Rev. B 95, 235114 (2017).
- Hüser et al. (1983) D. Hüser, L. E. Wenger, A. J. van Duyneveldt, and J. A. Mydosh, Phys. Rev. B 27, 3100 (1983).
- Huser et al. (1986) D. Huser, A. J. van Duyneveldt, G. J. Nieuwenhuys, and J. A. Mydosh, J. Phys. C Solid State Phys. 19, 3697 (1986).
- Souletie and Tholence (1985) J. Souletie and J. L. Tholence, Phys. Rev. B 32, 516 (1985).