LEMONY–a Library of Empirical Medium-resolution spectra by Observations with the NAOC Xinglong 2.16 m and YNAO Gaomeigu 2.4 m telescopes
Abstract
This study expands the coverage and improves the homogeneity of the distribution of MILES template stars in the parameter space, as well as extends the wavelength coverage of the template spectra to the far red beyond the Ca ii triplet. To achieve this we have carried out a major observational campaign using the OMR long-slit spectrograph mounted on the NAOC 2.16 m telescope and the YFOSC long-slit spectrograph mounted on the YNAO 2.4 m telescope. The original sample is based on the MILES library, supplemented by 918 stars selected from PASTEL database. In total, 822 OMR and 1,324 YFOSC spectra, covering respectively the wavelength ranges 3800–5180 and 5150–9000, have been collected and reduced. The spectra have a mean resolution FWHM (full-width at half-maximum) of Å and are wavelength- and flux-calibrated to an accuracy of km s-1 and per cent, respectively. The spectra are further corrected for systematic errors in the wavelength calibration to an accuracy of km s-1 by cross-correlating with the theoretical spectra. Almost all the spectra have an average signal to noise ratio (SNR) better than 100 per pixel. Combined with the MILES spectra, there are now 1,731, 1,542, 1,324 and 1,273 stars with spectra covering respectively 3800–5180, 3800–7500, 5150–9000 and 3800–9000. This paper describes our template star selection, the observation and data reduction, and presents the reduced spectra collected hitherto.
keywords:
Spectroscopy: optical - stars: atomospheric parameters1 INTRODUCTION
A low- to medium-resolution spectral library with a good and homogenous coverage of the stellar atmospheric parameter space (i.e. effective temperature , surface gravity and metallicity [Fe/H]) is an important tool in many astronomical applications, from the spectral synthesis analyses of stellar populations of galaxies (Guiderdoni & Rocca-Volmerange, 1987; Buzzoni, 1989; Worthey, 1994; Leitherer et al., 1996; Vazdekis, 1999; Bruzual & Charlot, 2003; Leitherer et al., 2010; Vazdekis et al., 2012; Röck et al., 2016; Milone et al., 2014) to the stellar atmospheric parameters determinations by spectral template matching (Adelman-McCarthy et al., 2008; Lee et al., 2008; Boeche et al., 2011; Wu et al., 2011; Xiang et al., 2015). The latter has become increasing important, driven by a number of already completed or still on-going large scale spectroscopic surveys, such as the Sloan Extension for Galactic Understanding and Exploration (SEGUE; Yanny et al., 2009), the Radial Velocity Experiment (RAVE; Steinmetz et al., 2006), the Large sky Area Multi-Object fiber Spectroscopic Telescope (LAMOST) Galactic Spectroscopic Surveys (Zhao et al., 2012; Deng et al., 2012; Liu et al., 2014; Yuan et al., 2015), and the APO Galactic Evolution Experiment (APOGEE; Majewski, 2012). These surveys are providing huge amounts of low- to intermediate-resolution spectral data to help improve our understanding of the structure, kinematics and chemistry, and formation and evolution of the Milky Way galaxy, and of other galaxies in general.
Specifically, the on-going LAMOST Galactic Spectroscopic Surveys have hitherto collected over 7.5 million low-resolution () quality optical spectra (Liu, Zhao & Hou, 2015). To derive robust estimates of the stellar atmospheric parameters as well as the radial velocities from this huge data set, two stellar parameter determination pipelines based on the technique of spectral template matching, the LAMOST Stellar Parameter Pipeline (LASP; Luo et al., 2015) and the LAMOST Stellar Parameter Pipeline at Peking University (LSP3; Xiang et al., 2015), have been developed. LASP determines both the atmospheric parameters as well as the radial velocities by template matching with the empirical spectral library ELODIE (Prugniel & Soubiran, 2001), whereas LSP3 uses ELODIE for the radial velocity determinations and another empirical spectral library MILES (Sánchez-Blázquez et al., 2006; Falcón-Barroso et al., 2011) for the atmospheric parameter determinations.
Several either empirical (Sánchez-Blázquez et al., 2006; Falcón-Barroso et al., 2011; Le Borgne et al., 2003; Heap & Lindler, 2007; Chen et al., 2014; Valdes et al., 2004; Vazdekis et al., 2012; Cenarro et al., 2001; Jones, 1999) or synthetic (Lastennet et al., 2002; Barbuy et al., 2003; Murphy & Meiksin, 2004; Munari et al., 2005a; Martins et al., 2005; Coelho et al., 2005) spectral libraries are now available (cf. the recent review by Wu et al. 2011). Compared to synthetic spectra, empirical spectra have the advantage that they represent real stars. On the other hand, empirical spectral libraries are always restricted by the available observations and thus limited in term of the parameter space coverage (Martins & Coelho, 2007; Wu et al., 2011). Either due to the lack of a wide coverage of the stellar atmospheric parameter space or insufficiently accurate flux-calibration over a wide wavelength range, most of those currently available empirical spectral libraries are not suitable as template spectral libraries for the determinations of the stellar atmospheric parameters. For examples, STELIB (Le Borgne et al., 2003), NGSL (Heap & Lindler, 2007) and XSL (Chen et al., 2014) have insufficient atmospheric parameter space coverage, while INDO-US (Valdes et al., 2004) and MIUSCAT (Vazdekis et al., 2012) suffer from poor flux-calibration, and CaT (Cenarro et al., 2001) and Jones (Jones, 1999) have narrow wavelength coverages. In comparison, MILES and ELODIE, adopted as the template library respectively LASP and LSP3, have broad atmospheric parameter coverages as well as wide wavelength ranges. MILES spectra were observed using a long-slit spectrograph with a spectral resolution comparable to that of the LAMOST spectra and were accurately flux-calibrated to a few per cent (Sánchez-Blázquez et al., 2006). In comparison, ELODIE spectra were obtained by the ELODIE spectrograph with medium (10,000) to high spectral resolution (42,000) and were poorly flux-calibrated. Thus the MILES spectral library is ideal for the determinations of the atmospheric parameters, although ELODIE works much better for the radial velocity determinations, given the much higher spectral resolution of the spectra of the latter (Xiang et al., 2015). With MILES, LSP3 has achieved a precision of 150 K, 0.25 dex, 0.15 dex for the determinations of , log , and [Fe/H], respectively, for LAMOST spectra of FGK type stars of signal-to-noise ratios (SNRs) per pixel better than 10.
As discussed in Xiang et al. (2015) and Yuan et al. (2015), there are several aspects of the MILES library that are desired of further improvement. Firstly, while the library has a decent coverage of the stellar parameter space, the distribution of stars in the parameter space is not uniform – there are clusters and holes of stars in the distribution that produce systematic errors in the derived atmospheric stellar parameters (Xiang et al., 2015). A more acute problem is that the spectra only cover wavelength ranges up to 7500 Å. Given that the LAMOST Galactic Spectroscopic Surveys target stars of all colors in the Galactic disk and halo, there are a significant fraction (about 30 per cent) of spectra that meet the survey SNR requirement, i.e. better than 10, in the red, but fail to do so in the blue, either because the stars are intrinsically red (i.e. of late spectral types) or heavily reddened by the interstellar dust grains, or both. The lack of suitable template spectra in the red is largely responsible for the fact that of all the spectra hitherto collected by LAMOST, only just over half have the atmospheric parameters determined (Luo et al., 2015; Yuan et al., 2015). Although there are several empirical libraries e.g. MIUSCAT, INDO-US, STELIB, NGSL and XSL as mentioned above, that provide spectra covering almost the whole optical wavelength range, those spectra are either poorly flux-calibrated or have insufficient coverage of the atmospheric parameter space. Thus it is highly desirable to extend the wavelength coverage of all MILES template spectra to the far red, beyond the Ca ii triplet for example. Finally, there is also room of expansion in the parameter coverage of MILES template stars, particularly toward low metallicities and low effective temperatures. With the above considerations in mind, we have embarked on a massive campaign to expand the MILES empirical spectral library. To maintain the maximum internal consistency, all spectra will be collected using long-slit spectrographs with a spectral resolution comparable to that of the MILES spectra and accurately flux-calibrated to a few per cent. Additional template stars with accurately known atmospheric parameters, mostly determined with high resolution spectroscopy, are selected and added to the library, and observed in order to increase the parameter coverage as well as to improve the homogeneity of the distribution of template stars in the parameter space. Spectra extending to the far red will also be collected such that LAMOST spectra of stars of either intrinsically red colors or heavily reddened by dust grains can also be properly analyzed with LSP3. The spectra collected will also be of interest for other applications such as the spectral synthesis analyses of stellar populations of galaxies as mentioned above.
The observed high SNR (better than 100 per pixel) spectra collected in LEMONY–a Library of Empirical Medium-resolution spectra by Observations with the NAOC Xinglong 2.16 m and YNAO Gaomeigu 2.4 m telescopes, are accurately wavelength- and flux-calibrated, and cover almost the whole optical range of 3800–9000 at a FWHM (full-width at half-maximum) resolution of Å. The spectra were collected with the NAOC 2.16m telescope in the blue and the YNAO 2.4m in the red.
Here we present the final results of this observational campaign. The paper is organized as follows. In Section 2 we describe the selection of additional template stars and observations. The data reduction is presented in Section 3. We describe the new library LEMONY to guide its use in Section 4. Qualities of the secured spectra are examined and discussed in Section 5. In Section 6, we discuss some improvements of LSP3 based on LEMONY. Finally, Section 7 summarizes the main results of the paper.
2 OBSERVATIONS
2.1 Target selection
As described above, the observational campaign to provide a new stellar library has two goals. The first is to increase the coverage in comparison to MILES library and improve the homogeneity of the distribution of the template stars in the parameter space. For this purpose, we have selected 918 additional template stars from the PASTEL (Soubiran et al., 2010) catalogue, a bibliographical compilation of accurate stellar atmospheric parameters including , and [Fe/H], mostly determined with high resolution, high signal-to-noise spectroscopy. By 2013, the catalogue contains 18,096 atmospheric parameter measurements for 8,428 unique stars, collected from 865 bibliographical references. For a given star, if one of the parameters has more than one determinations, the average is adopted for that parameter after -clipping. Adopting the simple averages of measurements available in the literature may however lead to some systematic errors as the values collected from different sources do not always have the same quality and are often determined using different techniques. Also note that not all values of effective temperature and surface gravity listed in PASTEL were determined with high resolution spectroscopy. To solve this problem, we have recalibrated the measurements of stellar atmospheric parameters collected in PASTEL (that includes essentially all stars in the MILES library) from a variety of sources such that they are on the same scale. The effective temperatures are recalibrated using the empirical metallicity-dependent calibrations of effective temperature against colours presented by Huang et al. (2015). The surface gravities are directly derived from the stellar radii and masses. The stellar radii are determined using the Hipparcos (Perryman et al., 1997) distances and the effective temperatures. The stellar masses are determined from the stellar evolution models based on the measured stellar luminosities, effective temperatures and metallicities. The metallicities are recalibrated using 34 benchmark stars of different spectral types, with measured metallicities accurate to better than 0.02 dex (Jofré et al., 2015). Considering that the determination of one atmospheric parameter depends on the values of the other parameter, we iterate the whole recalibration process until all the measurements converge. The results will be presented in a separate paper (Huang et al. 2018, in preparation).
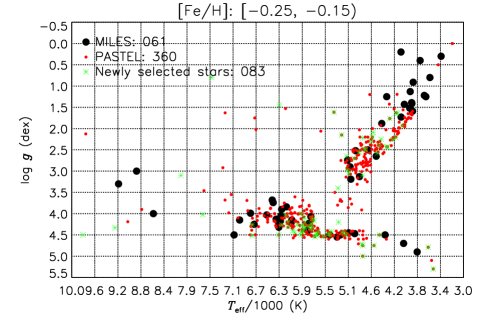
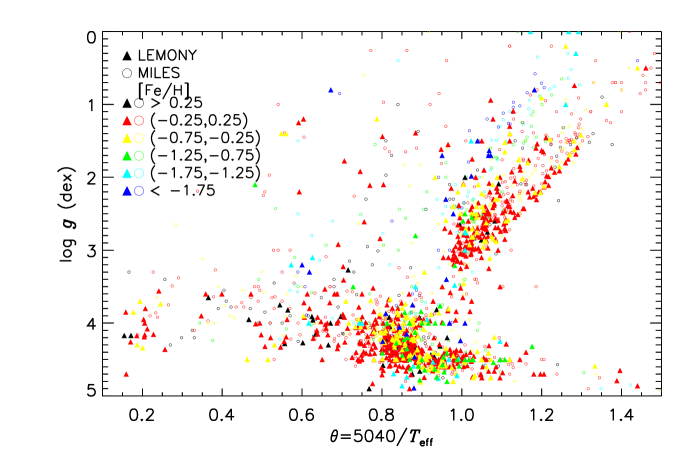
The newly selected 918 template stars consist of two parts. Firstly, we select all stars in PASTEL of effective temperatures higher than 10,000 K or lower than 3,000 K considering the extreme scarcity of such stars in the MILES library. Secondly, all stars of between 3,000 and 10,000 K in the MILES library and in the PASTEL catalogue are grouped into several metallicity bins, as listed in Table 1. Then stars in a given metallicity bin are plotted on a – diagram with grids of steps of 200 K and 0.25 dex in and , respectively. If available, new template stars are then selected from the PASTEL catalogue to ensure that the LEMONY library contains at least one template star in a given grid cell. As an example, Fig. 1 plots stars from the MILES library and from the PASTEL catalogue in the – plane for the metallicity bin dex. The new template stars selected from the PASTEL catalogue are also marked. The numbers of newly selected stars and those in the MILES library for the individual metallicity bins are listed in Table 1. The distribution of all template stars in the LEMONY library in the – and –[Fe/H] planes are presented in Figs. 2 and 3, respectively. These figures show that the LEMONY library has a broader parameter space coverage than the MILES and some of the holes apparent in the distribution of the MILES stars are now filled up by the newly selected targets.
| [Fe/H] metallicity bin (dex) | [5.0,1.75) | [1.75,1.25) | [1.25,1.0) | [1.0,0.75) | [0.75,0.65) |
|---|---|---|---|---|---|
| Number of stars in the MILES | 44 | 71 | 35 | 64 | 34 |
| Number of newly added stars | 33 | 37 | 20 | 37 | 16 |
| [Fe/H] metallicity bin (dex) | [0.65,0.55) | [0.55,0.45) | [0.45,0.35) | [0.35,0.25) | [0.25,0.15) |
| Number of stars in the MILES | 33 | 44 | 43 | 75 | 66 |
| Number of newly added stars | 23 | 33 | 61 | 50 | 83 |
| [Fe/H] metallicity bin (dex) | [0.15,0.05) | [0.05,0.05) | [0.05,0.15) | [0.15,0.25) | [0.25,1] |
| Number of stars in the MILES | 72 | 105 | 104 | 46 | 79 |
| Number of newly added stars | 126 | 148 | 103 | 76 | 72 |
2.2 Observations
To extend the wavelength coverage of the template spectra to the far red, the YFOSC long-slit spectrograph mounted on the YNAO 2.4 m telescope is used with a G8 grism to cover the wavelength range 5150–9800 Å. An EEV 20484068 CCD of 13.5m pixel size was used as detector. The G8 grism has a dispersion of 90 Å mm-1, yielding 1.22 Å per pixel at the detector. This setup was used to collect red spectra of all stars in the LEMONY library. All stars were observed with the YFOSC spectrograph with a slit width of 0.58 arcsec projected on the sky, yielding a FWHM resolution of Å. Right after the science exposures, exposures of He-Ne lamp were obtained to wavelength-calibrate the YFOSC spectra.
The blue spectra of the newly added stars are collected with the OMR long-slit spectrograph mounted on the NAOC 2.16 m telescope using a 1200B grating, covering 3800–5180 Å. A SPEC10 1340400 CCD of 20m pixel size was used as detector. The 1200B grating has a dispersion of 50 Å mm-1, yielding 1.03 Å per pixel at the detector. A slit width of 1.8 arcsec was used to obtain the blue spectra with a FWHM resolution of Å. The exposures of He-Ar lamp were also collected to wavelength-calibrate the OMR spectra.
For the purpose of accurate flux calibration, all stars were also observed with a wide slit of widths 5.05 and 9.5 arcsec with the YFOSC and OMR spectrographs, respectively. Those same wide slits were used to observe spectral standard stars for the flux-calibration. After flux-calibration, the spectrum of a template star obtained with the narrow slit was scaled with a low-order polynomial function to match the spectral energy distribution (SED) of the same star obtained with the wide slit.
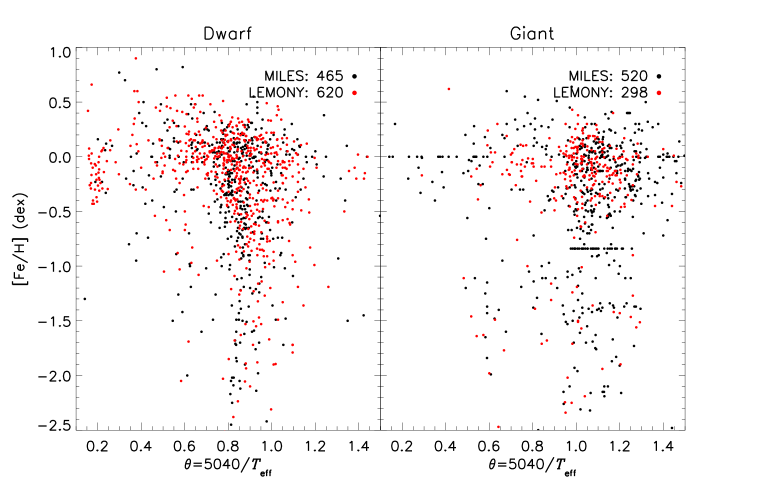
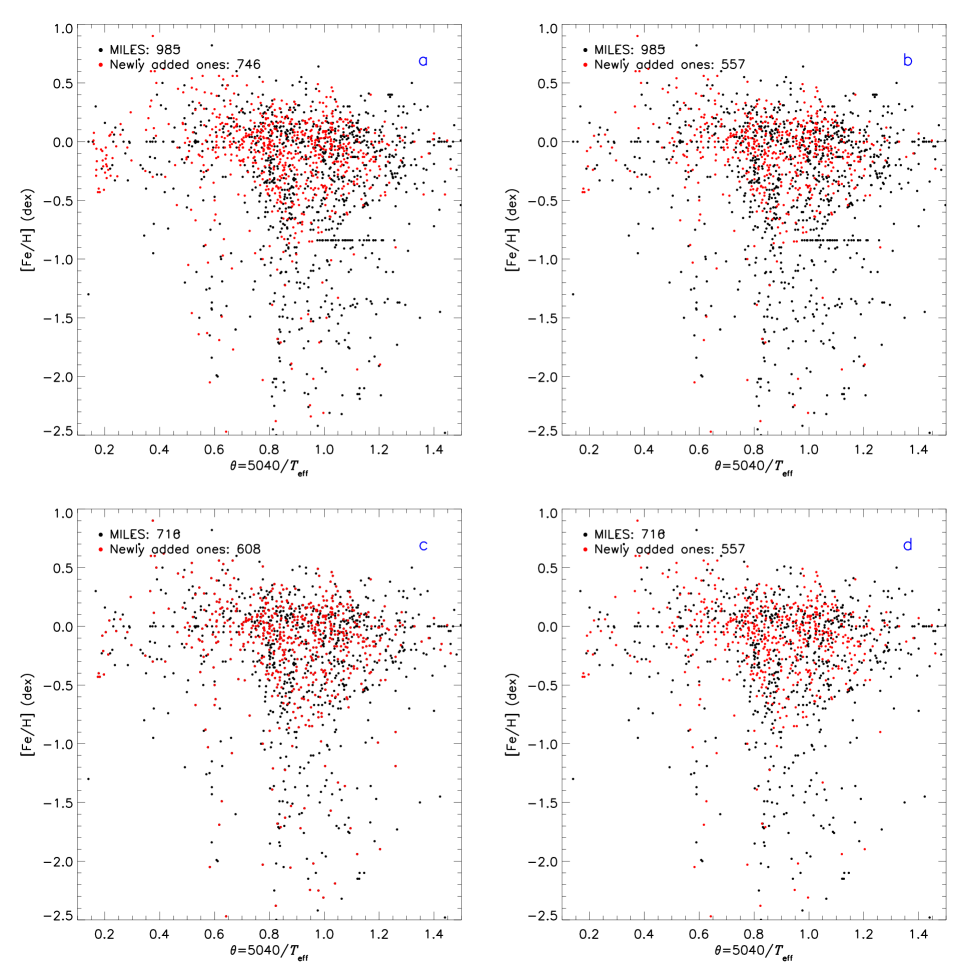
During the 2013–2017 observational season, 1,324 red spectra were collected in 134 (partial) observing nights with the YNAO 2.4 m telescope and 822 blue spectra were obtained in another 58 nights with the NAOC 2.16 m telescope. LEMONY contains 822 blue spectra and 1,324 red spectra. Including the spectra of MILES, one now has 1,731 stars with spectra covering 3800-5180 Å, 1,542 stars with spectra covering 3800-7500 Å, 1,324 stars with spectra covering 5150-9000 Å, and 1,273 stars with spectra covering 3800-9000 Å. Fig. 4 plots the distributions of those four groups of stars in the –[Fe/H] plane. The Figure shows that template stars with spectra covering 3800-7500 Å cover a broader parameter space than the MILES stars and some of the holes apparent in the distribution of the MILES stars are now filled up by the newly observed targets. The 1,324 stars with YFOSC red spectra also have a broad parameter space coverage. These stars can be used as templates to estimate the atmospheric parameters from the LAMOST red-arm spectra for stars that are either intrinsically red (i.e. of late spectral types) or heavily reddened by the interstellar dust grains. Compare to ELODIE, the 1,542 stars with spectra covering 3800-7500 Å contain more metal-poor giant stars.
3 data reduction
All LEMONY spectra were reduced with IRAF111IRAF is distributed by the National Optical Astronomy Observatories, USA, which are operated by the Association of Universities for Research in Astronomy, Inc., under cooperative agreement with the National Science Foundation, USA.. The reduction included several steps: bias subtraction, flat-fielding, cosmic ray cleaning, sky background subtraction, 1D spectrum extraction, wavelength calibration and (relative) flux calibration. The wavelength calibration and relative flux calibration are the essential steps affecting the spectral quality. In the following subsections, we will describe these two steps in some detail and the accuracy achieved.
3.1 Spectral SNR and resolution
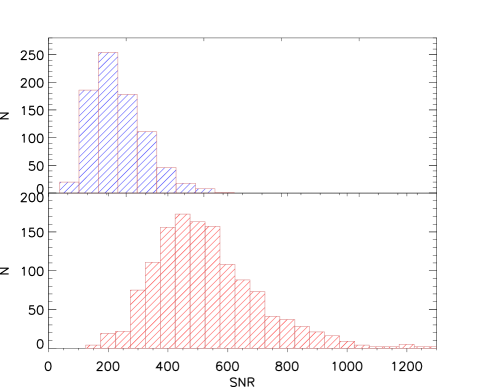
For the purpose of being used as the template spectra for the derivation of stellar atmospheric parameters from LAMOST spectra, the template spectra should have good SNRs and a resolution comparable to that of LAMOST spectra. The mean SNRs over the whole wavelength range of almost all our LEMONY spectra are higher than 100, except for 81 blue spectra, but still essentially all higher than 50. The stars with blue spectra of SNRs lower 100 have very low effective temperatures, leading to few photons in blue parts of the spectra. Fig. 5 plots the SNR distributions of the LEMONY blue and red template spectra.
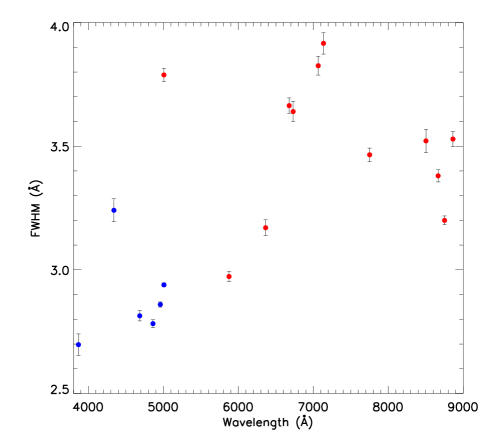
To estimate the spectral resolution as a function of wavelength, we make use of the spectra of planetary nebulae IC 4997 and NGC 2392 obtained with same instruments. The nebulae have rich emission lines across the whole optical spectral wavelength range and expansion velocities much smaller than our spectral resolution. The results are plotted in Fig. 6. As the Figure shows, the template spectra have an average resolution FWHM of approximately 2.8 Å, 3.6 Å and 3.3 Å for the blue, red and the whole spectra, respectively.
3.2 Wavelength calibration
As mentioned above, the spectra secured with the OMR and YFOSC spectrographs were respectively wavelength-calibrated using He-Ar and He-Ne arc exposures taken after the target observation. The root mean square (RMS) residuals of wavelength-calibration were around 0.1 Å. The spectra were then converted to heliocentric wavelengths after corrected for the diurnal and annual motions of the Earth. By comparing the radial velocities derived from our spectra with LSP3 with those of Gontcharov (2006) (with a mean accuracy of 0.7 km s-1) and Kharchenko et al. (2007) (with a mean accuracy of 2.0 km s-1), we find that the different segments of the spectrum of a given star yield different radial velocities, with a scatter on the level of 20 km s -1, indicating that there are large systematic errors in the spectral dispersion curve deduced from the arc spectrum. The errors are traced back to largely caused by the different light paths and focal lengths between the arc lamp and the celestial target, as well as by the lack of sufficient number of arc lines in the wavelength range 5150-5800.
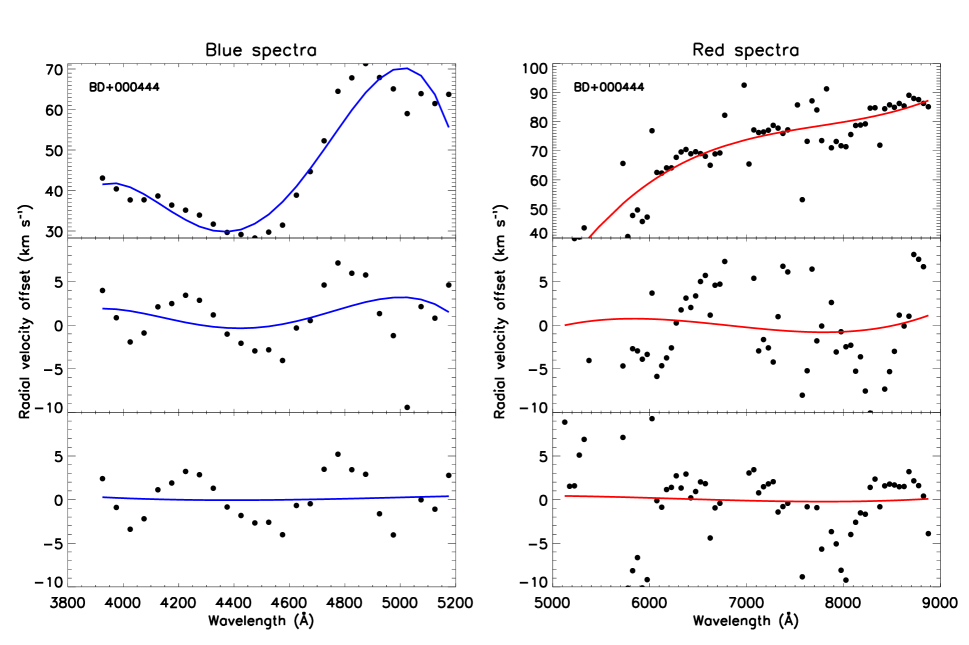
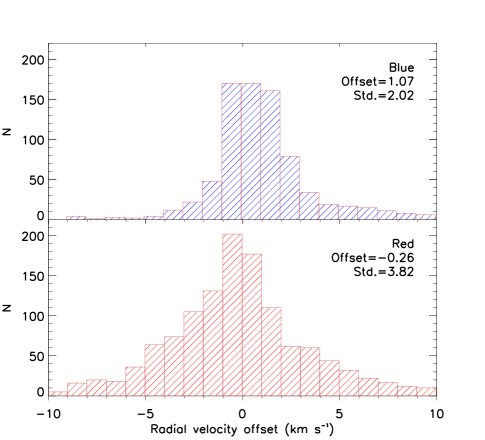
In order to improve the accuracy of wavelength calibration, we cross-correlate the reduced spectra with theoretical ones of identical atmospheric parameters. The correlation was carried out for each 250 Å spectral segment in steps of 50 Å. This wavelength length of 250 Å of spectral segments was chosen based on the following considerations: 1) Each of spectral segment should contain sufficient information allowing a robust estimate of the velocity offset; 2) A sufficient number of data points are generated ensuring a robust polynomial fit of the offset as a function of wavelength. The theoretical spectra were obtained by interpolating the synthetic spectral library of Munari et al. (2005b) of a spectral resolution , similar to our observed spectra. The resulting velocity offsets were fitted with a third-order or fourth-order polynomial as a function of wavelength. The fit was then used to correct for errors in the wavelength calibration. This process is repeated twice. Fig. 7 shows the radial velocity offsets as a function of wavelengths for the blue and red spectra of BD+000444. The top panels show results before the corrections. The middle panels show the results after the first round of corrections. Some systematic variations of the radial velocity offsets with wavelength remain but are acceptable considering the relatively low resolution of the spectra. The third panels show the results after the second round of corrections. The results are quite similar to those after the first round of corrections, suggesting that the results have converged. For each blue or red spectrum, the coefficients of the polynomial fits are presented in the online catalogues as described in Section 4. After the corrections, radial velocities deduced from the observed spectra with LSP3 show average offsets, after 3-clipping, of only km s-1 and km s-1 for the blue and red spectra, respectively, implying a wavelength calibration accuracy on the level of 4 km s-1(Fig. 8).
3.3 Flux calibration
For both spectral synthesis of stellar populations and stellar atmospheric parameter determinations, accurate flux calibration of the SEDs of the template stars is highly desired. For this purpose, several effects need to be considered and corrected for: the instrumental spectral response curve, the wavelength-dependent flux loss for narrow-slit observation due to the atmospheric differential refraction, the atmospheric extinction, and the interstellar reddening. To accurately determine the instrumental spectral response curve, each observing night we usually observed each observing night 3 and minimum 2 spectrophotometric standard stars selected from the list available at the ESO website. Hot stars with few or weak spectral features were preferred. Table 2 lists the standards used in our observational campaign. As described above, each target was observed with both narrow and wide slits. Spectra obtained with the wide-slit were flux-calibrated with the response curve derived from the standards (also observed with the wide-slit). The narrow-slit spectra of the targets were then scaled to match the SEDs of the wide-slit spectra. The atmospheric extinction was corrected for using the nominal extinction curve of the site.
The interstellar reddening was corrected for using the reddening law of Fitzpatrick (1999) assuming a total-to-selective extinction ratio . Values of selective extinction, i.e. colour excess , of all PASTEL stars have been derived by Huang et al. (2018, in preparation) using the “star pair” technique of Yuan, Liu & Xiang (2013). For stars in the MILES library, the extinction values given in the library were used. Huang et al. (2018, in preparation) have compared values of derived from the “star-pair” technique and those provided in MILES, and found that the differences are mostly smaller than 0.1 mag. The difference is a function of in the sense that the larger the values of , the larger the differences. The standard deviation of the differences is about 0.07 mag. Note that for both the purposes of spectral synthesis of stellar populations and stellar atmospheric parameter determinations, accurate relative, rather than absolute, flux-calibration is sufficient.
3.4 Notes
Beyond 7800 Å, the spectra are affected by interference fringing caused by: (1) the different light paths between celestial targets and the dome flat in each night; (2) the delay of observation of celestial targets relative to the dome flat, which leads to different temperature and thickness of the CCD between the celestial targets and dome flat observations. Typically, the fringing cause fake features with strength of 5 per cent of the continue level, while about 230 of 1,324 red spectra are affected by strong interference fringing whose strength are comparable to that of the absorption lines. The interference fringing was found hardly to removed from the spectra entirely, and it is a defect of the current data. Stars affected by strong interference fringing are marked by ’flag-f’ of value zero, while those unaffected by ’flag-f’ of value one in the catalogues as described in Section 4.
The red spectra are also affected by a number of strong telluric absorption features, notably the O2 bands at and 6870 Å and the H2O bands at , 7800 and 8200 Å. We opt not to rectify those features in our spectra, given the large uncertainties that might be introduced for any correction algorithm. Stars strongly affected by telluric absorption features are marked by ’flag-t’ of value zero, the others by ’flat-t’ of value one.
| Star | RA(J2000.0) | Dec.(J2000.0) | V (mag) | Spectral type |
|---|---|---|---|---|
| hh:mm:ss | dd:mm:ss | |||
| HR153 | 00:36:58.30 | +53:53:48.9 | 3.66 | B2IV |
| HR718 | 02:28:09.54 | +08:27:36.2 | 4.28 | B9III |
| HR1544 | 04:50:36.69 | +08:54:00.7 | 4.36 | A1V |
| G191-B2B | 05:05:30.62 | +52:49:54.0 | 11.78 | DA1 |
| BD+75d325 | 08:10:49.31 | +74:57:57.5 | 9.54 | O5p |
| HR3454 | 08:43:13.46 | +03:23:55.1 | 4.3 | B3V |
| Feige34 | 10:39:36.71 | +43:06:10.1 | 11.18 | DO |
| HD93521 | 10:48:23.51 | +37:34:12.8 | 7.04 | O9Vp |
| HR4468 | 11:36:40.91 | 09:48:08.2 | 4.7 | B9.5V |
| Feige56 | 12:06:47.3 | +11:40:13 | 11.06 | B5p |
| Feige66 | 12:37:23.55 | +25:04:00.3 | 10.50 | sd0 |
| HR4936 | 13:09:56.96 | 05:32:20.5 | 4.38 | A1IV |
| HR5501 | 14:45:30.25 | +00:43:02.7 | 5.68 | B9.5V |
| BD+33d2642 | 15:51:59.86 | +32:56:54.8 | 10.81 | B2IV |
| HR7001 | 18:36:56.33 | +38:47:01.1 | 0.00 | A0V |
| HR7596 | 19:54:44.80 | +00:16:24.6 | 5.62 | A0III |
| HR7950 | 20:47:40.55 | 09:29:44.7 | 3.78 | A1V |
| BD+28d4211 | 21:51:11.07 | +28:51:51.8 | 10.51 | Op |
| BD+25d4655 | 21:59:42.02 | +26:25:58.1 | 9.76 | O |
| HR8634 | 22:41:27.64 | +10:49:53.2 | 3.40 | B8V |
| Feige110 | 23:19:58.39 | 05:09:55.8 | 11.82 | DOp |
3.5 Combining blue and red spectra
| Library | Wavelength coverage (Å) | FWHM Resolution (Å) | Number of stars | Comments |
|---|---|---|---|---|
| MILES | 3525-7500 | 2.5 | 985 | Long-slit spectra with good flux-calibration |
| ELODIE | 4100-6800 | 0.5 | 1347 | Echelle spectra |
| CaT | 8348-9020 | 1.5 | 706 | Long-slit spectra with good flux-calibration |
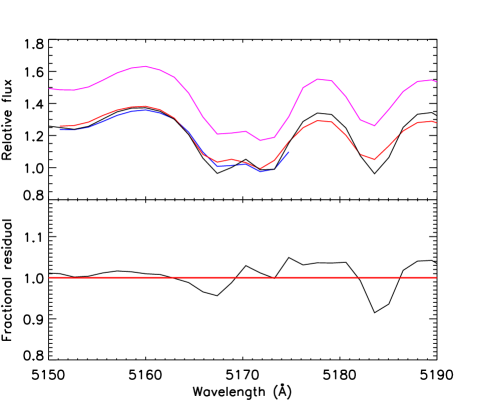
Finally, the blue and red spectra of each star are combined to produce a well flux-calibrated spectrum covering almost the whole optical wavelength range of 3800–9000. The blue spectra are broadened to match the resolution of the red spectra. Given that blue spectra often have a higher SNR and are better calibrated than the red ones in their overlapping region from 5150 to 5180 Å, the blue spectra are used for the combined spectra. Mg1 and Mg2 lines are located in the overlapping region, we check their profiles by comparing with the MILES spectra. Fig. 9 shows an example of combining the red and blue spectra for the overlapping wavelength range 5150–5190 Å. The LEMONY and MILES spectra are convolved with gaussians to a resolution of FWHM 3.6 Å in order to achieve the comparison. The Mg1 and Mg2 line profiles given by the MILES spectrum and by our the final combined spectrum match quite well, with fractional differences smaller than 10 per cent. As discussed in Section 4.2, the differences of Lick indices deduced are also very small.
4 Data access
The spectra are available online222link to be added once the paper has been accepted for publication for retrieval at http://lamost973.pku.edu.cn/site/data. The spectra are in FITS format. Note that spectra without correcting for the systematic errors in wavelength calibration are also included. Catalogues containing information of the template stars are also provided, again in FITS format. The information includes the star name, coordinates, SNRs of the blue and red spectra, spectral wavelength range, observational instrument used, observational Julian date, stellar parameters, flags of the spectra and the polynomial fit coefficients used to correcting for the systematic errors in wavelength calibration. A Readme file is included with the online data. A detailed description of the catalogue content is presented in Table 4.
| Name | Description |
|---|---|
| name | The name of the star |
| ra | Right ascension of J2000.0 () |
| dec | Declination of J2000.0 () |
| SNR-B | Mean SNR per pixel of blue spectra |
| SNR-R | Mean SNR per pixel of red spectra |
| JD-B | Julian date at the middle time of the first exposure of the blue spectra |
| JD-R | Julian date at the middle time of the first exposure of the red spectra |
| wavelength range | The wavelength range available |
| instruments | The using telescope and spectrograph when observing the star |
| teff | The effective temperature of the star |
| logg | The surface gravity of the star |
| feh | The iron to hydrogen abundance ratio of the star |
| ebv | The adopted |
| a1-B | The zero-order coefficient of the polynomial fits of velocity offsets as a function of wavelength for the blue spectra for the first time correction |
| a2-B | The first-order coefficient of the polynomial fitts of velocity offsets as a function of wavelength for the blue spectra for the first time correction |
| a3-B | The second-order coefficient of the polynomial fits of velocity offsets as a function of wavelength for the blue spectra for the first time correction |
| a4-B | The third-order coefficient of the polynomial fits of velocity offsets as a function of wavelength for the blue spectra for the first time correction |
| a5-B | The fourth-order coefficient of the polynomial fits of velocity offsets as a function of wavelength for the blue spectra for the first time correction |
| b1-B | The zero-order coefficient of the polynomial fits of velocity offsets as a function of wavelength for the blue spectra for the second time correction |
| b2-B | The first-order coefficient of the polynomial fits of velocity offsets as a function of wavelength for the blue spectra for the second time correction |
| b3-B | The second-order coefficient of the polynomial fits of velocity offsets as a function of wavelength for the blue spectra for the second time correction |
| b4-B | The third-order coefficient of the polynomial fits of velocity offsets as a function of wavelength for the blue spectra for the second time correction |
| b5-B | The fourth-order coefficient of the polynomial fits of velocity offsets as a function of wavelength for the blue spectra for the second time correction |
| a1-R | The zero-order coefficient of the polynomial fits of velocity offsets as a function of wavelength for the red spectra for the first time correction |
| a2-R | The first-order coefficient of the polynomial fits of velocity offsets as a function of wavelength for the red spectra for the first time correction |
| a3-R | The second-order coefficient of the polynomial fits of velocity offsets as a function of wavelength for the red spectra for the first time correction |
| a4-R | The third-order coefficient of the polynomial fits of velocity offsets as a function of wavelength for the red spectra for the first time correction |
| b1-R | The zero-order coefficient of the polynomial fits of velocity offsets as a function of wavelength for the red spectra for the second time correction |
| b2-R | The first-order coefficient of the polynomial fits of velocity offsets as a function of wavelength for the red spectra for the second time correction |
| b3-R | The second-order coefficient of the polynomial fits of velocity offsets as a function of wavelength for the red spectra for the second time correction |
| b4-R | The third-order coefficient of the polynomial fits of velocity offsets as a function of wavelength for the red spectra for the second time correction |
| flag-s a | Mark the observational status |
| flag-f b | Mark whether the red spectrum is affected by interference fringing |
| flag-t c | Mark whether the red spectrum is affected by telluric absorption |
| flag-v d | Mark whether the star is a variable star |
-
1
flag-s a mark the observational status. 0 mean that the star only has blue spectrum. 1 mean that the star only has red spectrum. 2 mean that the star has both blue and red spectra.
-
2
flag-f b mark whether the red spectrum is affected by interference fringing strongly. 0 mean that the red spectrum id affected by interference fringing strongly. 1 mean that the effects of interference fringing on the red spectrum are negligible.
-
3
flag-t c mark whether the red spectrum is affected by telluric absorption strongly. 0 mean that the red spectrum is affected by telluric absorption strongly. 1 mean that the effects of telluric absorption on the red spectrum are negligible.
-
4
flag-v d mark whether the star is a variable star. ’y’ mean that the star is a variable star. ’n’ mean that the star is not a variable star.
5 SPECTRAL QUALITY
In this Section, we assess the quality of the LEMONY spectra. In order to examine the SED accuracy, we make two comparisons: 1) Comparison of broad band colors calculated from our spectra with those calculated from MILES spectra and the photometric measurements in the literature; 2) Direct comparison between the LEMONY and those in the MILES and CaT (Worthey & Ottaviani, 1997) libraries for the common targets in the overlapping spectral regions. To check the strengths of spectral features, we compare the Lick/IDS indices as defined in Worthey & Ottaviani (1997) derived from our spectra with those deduced from the spectra in the MILES and ELODIE libraries for the common targets. We also compare the values of a new set of the near-IR indices (CaT⋆, CaT and PaT) defined by Cenarro et al. (2001) deduced from our and CaT spectra for the common objects. Table 3 summarize the information of the three libraries used for the above comparisons. The spectra from all the libraries are broadened to match the poorest spectral resolution (average resolution FWHM of 3.6 Å for the LEMONY red spectra) of these libraries, and binned to a common linear dispersion of 1.0 Å .
5.1 SEDs
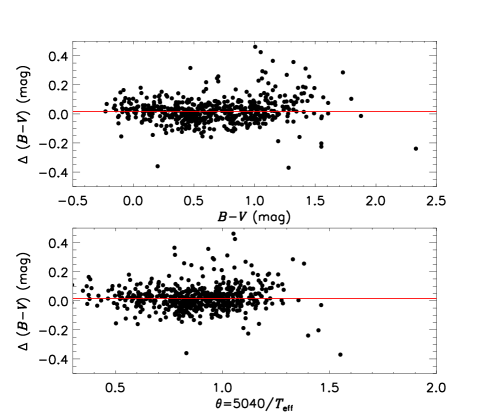
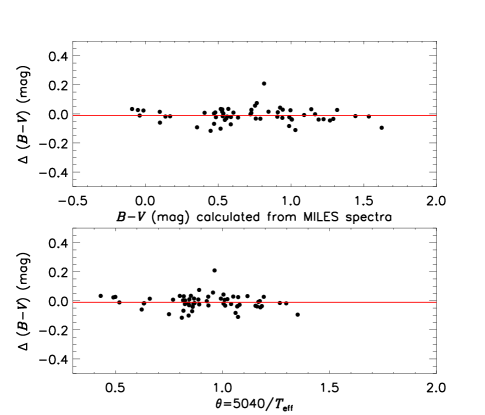
From the 628 combined observed spectra (without the interstellar reddening corrections), we calculate the values of broad band color using the filter transmission curves of Johnson & Morgan (1953). The results are compared with values taken from the Lausanne photometric database (Mermilliod, Weidmann & Hauck, 1996). The results are shown in Fig. 10. The differences are essentially smaller than 0.2 mag. Some red stars (with large values of ) have differences larger than 0.3 mag, but the relative differences remain small. The average difference is mag. The small offset sets an upper limit on the systematic uncertainties of our spectral flux-calibration for the spectral range up to 6000 Å. The standard deviation of the difference is of 0.07 mag. For the 60 common targets, we compare the values of broad band colours calculated from the combined observed spectra and from the MILES spectra. The results are shown in Fig. 11. The differences are essentially smaller than 0.1 mag with one star of a difference 0.2 mag. The average difference is mag, with a standard deviation of 0.043 mag. Both the comparisons suggest an accuracy of relative flux calibration of a few per cent.
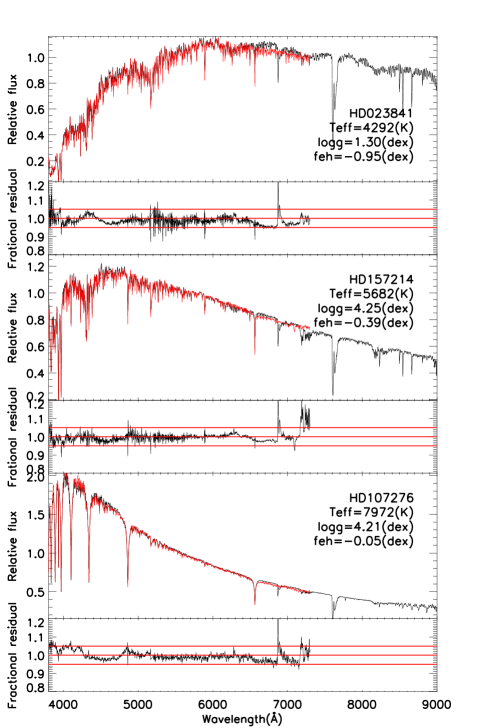
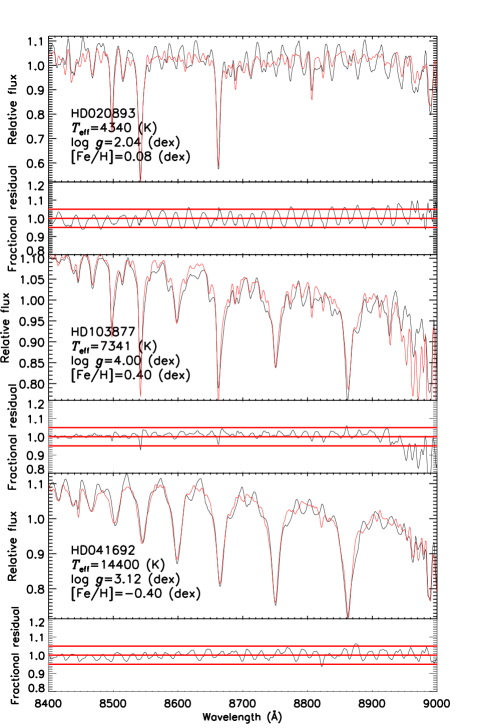
In Fig. 12 we make a direct comparison of our spectra with those from the MILES library for three common targets. In all cases, the fractional differences have a mean and a standard deviation ranging from 1 to 4 per cent. Fig. 13 compares our spectra with those from the CaT library for three common objects for the common wavelength range 8400–9000 Å. Again the agreement is very good, with fractional differences of just a few per cent. Considering the uncertainties of flux-calibration of the MILES and CaT spectra, the telluric absorption features as well as the CCD interference fringing in the far red, the comparisons shown in Fig. 12 and Fig. 13 indicate that our flux-calibration is likely to be much better than 5 per cent.
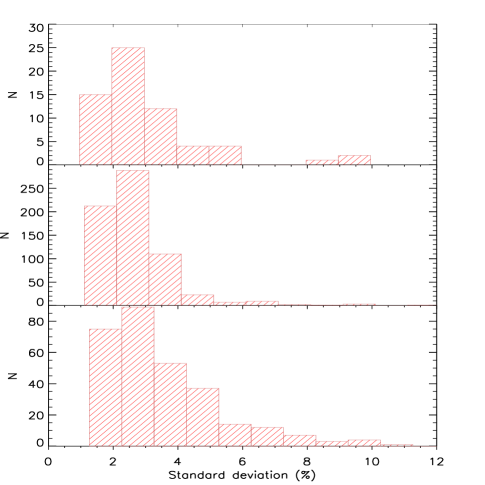
The standard deviations of fractional differences from three comparisons are also caculated: 1) A comparison between our blue spectra and those from the MILES library for 63 common targets for the common wavelength range 3800–5150; 2) A comparison between our red spectra and those from the MILES library for 667 common targets for the common wavelength range 5200–7400; 3) A comparison between our red spectra and those from the CaT library for 296 common stars for the common wavelength range 8400–9000. Fig. 14 shows the standard deviation distributions of the three comparisons. In all comparisons the fractional differences are by dividing the LEMONY spectra and the MILES library or the CaT library. The resultant fractional standard deviations are essentially all smaller than 10 per cent.
In conclusion, the relative flux-calibration of the spectra in the LEMONY library is likely to be better than 5 per cent.
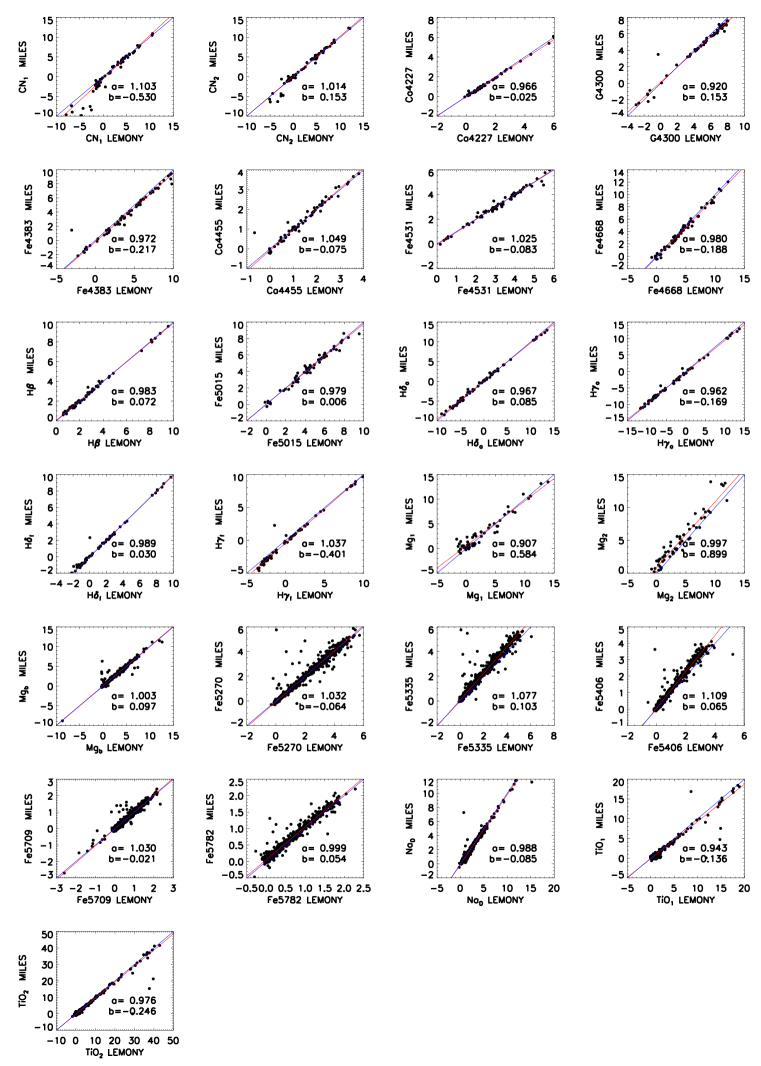
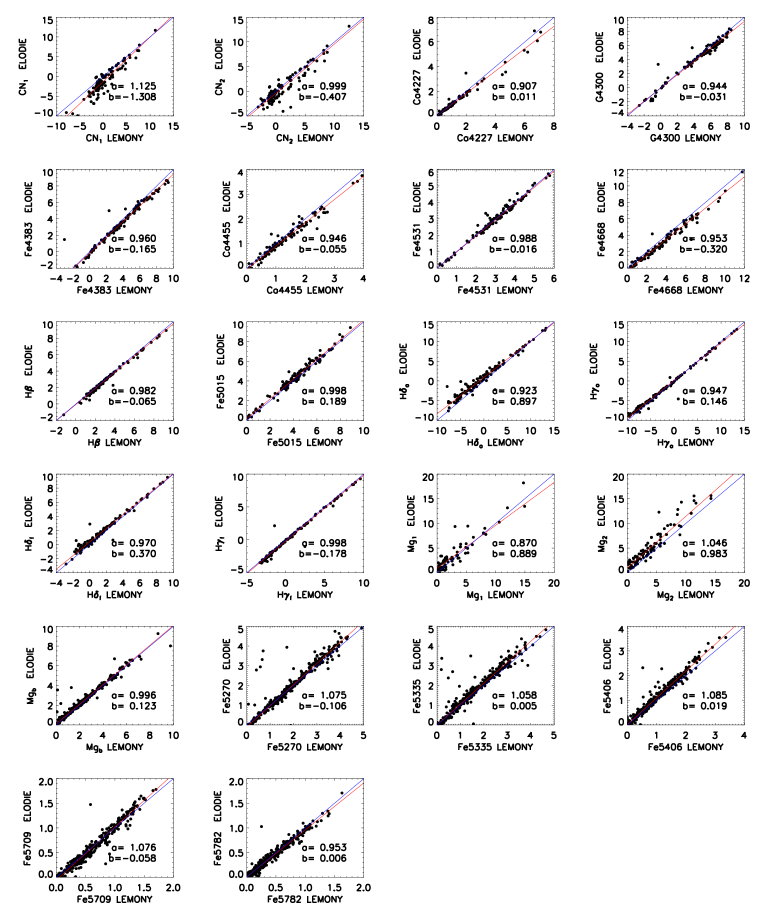
5.2 Lick/IDS and the near-IR indices
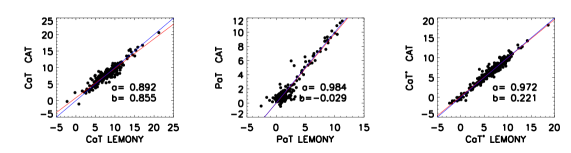
The Lick/IDS indices are derived from the LEMONY spectra and from spectra in the MILES and ELODIE libraries for common objects. The results are compared in Figs. 15 and 16. The near-IR indices are derived from the LEMONY spectra and from those in the CaT library for common stars. A comparison between the near-IR indices derived from the LEMONY spectra and those deduced from spectra in the CaT library for common stars is presented in Fig. 17. The agreement is very good in all cases. There are several stars show large differences in Lick/IDS indices Fe5270, Fe5335, and . We find that almost all of them are variable stars including two S stars (many of them are long period variable stars). Linear fit for the individual indices compared, are also overplotted in the three Figures. The slopes (), intercepts () of the individual linear fits are also marked in the panels. The values of the slope, intercept and RMS of residuals are also listed in Table 5. As the Table shows, all slopes have a value close to unity, except when comparing with the CaT library, where the slopes are always smaller than 1, implying some systematic differences. The interferometric fringing remaining in the LEMONY spectra may be partly responsible for these differences. The small non-zero intercepts seen in some indices also suggest the presences of some systematic differences between the libraries.
| MILES | ELODIE | CAT | |||||||
|---|---|---|---|---|---|---|---|---|---|
| Slope | Intercept | RMS | Slope | Intercept | RMS | Slope | Intercept | RMS | |
| CN1 | 1.103 | -0.530 | 0.527 | 1.125 | -1.308 | 1.106 | |||
| CN2 | 1.014 | 0.153 | 0.351 | 0.999 | -0.407 | 0.981 | |||
| Ca4227 | 0.966 | -0.025 | 0.066 | 0.907 | 0.011 | 0.062 | |||
| G4300 | 0.920 | 0.153 | 0.133 | 0.944 | -0.031 | 0.275 | |||
| Fe4383 | 0.972 | -0.217 | 0.205 | 0.960 | -0.165 | 0.197 | |||
| Ca4455 | 1.049 | -0.075 | 0.115 | 0.946 | -0.055 | 0.109 | |||
| Fe4531 | 1.025 | -0.083 | 0.143 | 0.988 | -0.016 | 0.117 | |||
| Fe4668 | 0.980 | -0.188 | 0.356 | 0.953 | -0.320 | 0.271 | |||
| H | 0.983 | 0.072 | 0.119 | 0.982 | -0.065 | 0.105 | |||
| Fe5015 | 0.979 | 0.006 | 0.308 | 0.998 | 0.189 | 0.269 | |||
| H | 0.967 | 0.085 | 0.284 | 0.923 | 0.897 | 0.596 | |||
| H | 0.962 | -0.169 | 0.276 | 0.947 | 0.146 | 0.254 | |||
| H | 0.989 | 0.030 | 0.109 | 0.970 | 0.370 | 0.223 | |||
| H | 1.037 | -0.401 | 0.183 | 0.998 | -0.178 | 0.110 | |||
| Mg1 | 0.907 | 0.584 | 0.899 | 0.870 | 0.889 | 0.901 | |||
| Mg2 | 0.997 | 0.899 | 0.917 | 1.046 | 0.983 | 1.002 | |||
| Mgb | 1.003 | 0.097 | 0.145 | 0.996 | 0.123 | 0.128 | |||
| Fe5270 | 1.032 | -0.064 | 0.146 | 1.075 | -0.106 | 0.118 | |||
| Fe5335 | 1.077 | 0.103 | 0.171 | 1.058 | 0.005 | 0.142 | |||
| Fe5406 | 1.109 | 0.065 | 0.105 | 1.085 | 0.019 | 0.099 | |||
| Fe5709 | 1.030 | -0.021 | 0.087 | 1.076 | -0.058 | 0.073 | |||
| Fe5782 | 0.999 | 0.054 | 0.074 | 0.953 | 0.006 | 0.055 | |||
| Na5849 | 0.988 | -0.085 | 0.180 | ||||||
| TiO1 | 0.943 | -0.136 | 0.327 | ||||||
| TiO2 | 0.976 | -0.246 | 0.371 | ||||||
| CaT | 0.892 | 0.855 | 0.867 | ||||||
| PaT | 0.984 | -0.029 | 0.568 | ||||||
| CaT∗ | 0.972 | 0.221 | 0.648 |
6 Improvements of LSP3 using the LEMONY library
The LEMONY spectra will be added to the empirical template spectral library that LSP3 uses to estimate stellar atmospheric parameters from the LAMOST spectra by template matching. We expect this will improve LSP3 in at least two aspects. Firstly, the new spectra will expand the coverage and improve the homogeneity of the distribution of the MILES template stars in the parameter space, reducing the systematic errors in the derived stellar atmospheric parameters. Secondly, the 1,324 LEMONY red spectra can be used as templates to estimate stellar atmospheric parameters from the LAMOST red-arm spectra. There are 30 per cent LAMOST spectra having a SNR better than 10 in the red but much worse in blue. For these stars, their stellar atmospheric parameters are expected to be determined using the LAMOST red-arm spectra. To test this, we have carried out a simple test to validate the feasibility of deriving stellar atmospheric parameters using the LAMOST red-arm spectra by template matching with our red spectra.
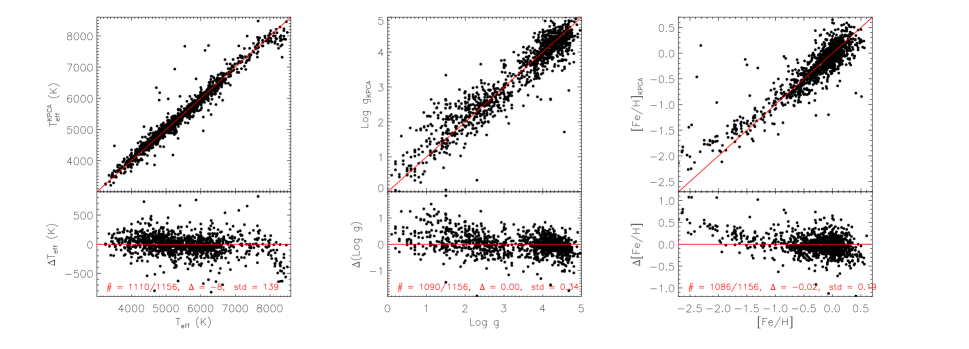
We estimate the atmospheric stellar parameters using spectral segments of wavelength range 5800–9000 with a machine learning method based on Kernel-based principle component analysis (KPCA), as described in Xiang et al. (2017). We select stars of 3,000 K, [Fe/H] dex and dex in the LEMONY library as the training set, which contains 1,156 stars in total. We adopt 100 principle components (PCs) in fitting the atmospheric parameters with a multi-dimensional linear function. The residuals of the fits are shown in Fig. 18. The Figure shows that the residuals of atmospheric parameters of 95 per cent of the total 1,156 stars are within three standard deviations from a mean. The residuals have a dispersion of 139 K, 0.34 dex and 0.19 dex for , log and [Fe/H] after 3- clipping, respectively.
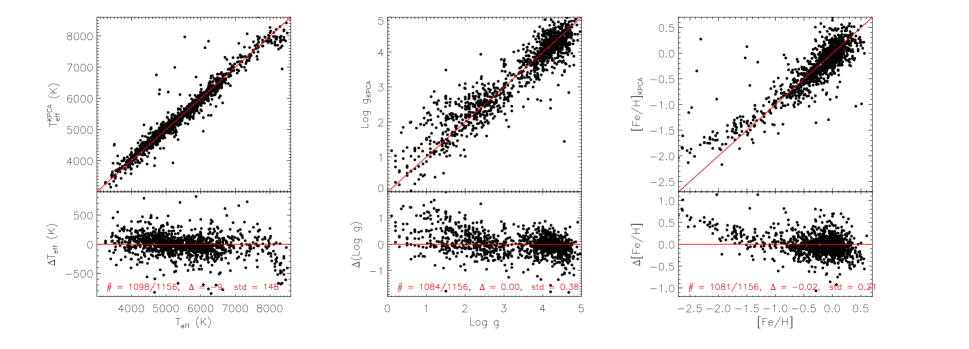
In order to examine whether the small dispersions of residuals are caused by over-fitting, we have carried out an analysis with the so-called leave-one-out approach. We select one star as the test sample, the other remaining 1,155 stars as the training set, and then estimate the atmospheric parameters of the test star. The exercise is repeated 1,156 times, each time with a different test star. Fig. 19 shows a comparison of the atmospheric parameters thus deduced with the KPCA method and those from PASTEL catalogue. Again the Figure shows that the residuals of atmospheric parameters of 95 per cent of the total 1,156 stars are within three standard deviations from a mean. The differences in , log and [Fe/H] are K, dex and dex after 3- clipping, respectively. The dispersions are thus comparable to those of the fitting residuals of the training set shown in Fig. 18. The exercise eliminates the possibility that we have significantly overfitted of the data.
We have also estimated the atmospheric parameters with the leave-one-out approach using the spectral segments of wavelength range 5800–7400 of the 763 MILES spectra. Fig. 20 shows a comparison of the atmospheric parameters deduced with the KPCA method and those from the MILES library. The Figure shows that the residuals of atmospheric parameters of only 77 per cent of the total 763 stars are within three standard deviations from a mean. The differences in , log and [Fe/H] are K, dex and dex after 3- clipping, respectively. The dispersion of differences in log is much larger than that derived using the LEMONY red spectra as the templates.
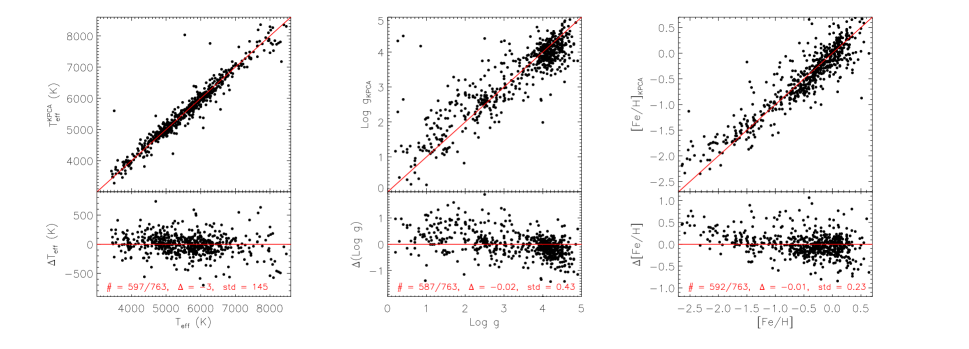
In conclusion, when deriving the stellar atmospheric parameters using the LAMOST red-arm spectra, template matching with the LEMONY red spectra yields much results than template matching with the MILES spectra. On the other hand, more tests of the method are needed before applying it to the whole LAMOST data set, considering most of the LAMOST spectra have much lower SNRs than those of the template stars.
7 SUMMARY
In this work we built a new stellar spectral library, LEMONY, based on the observations using the OMR long-slit spectrograph mounted on the NAOC 2.16 m telescope and the YFOSC long-slit spectrograph mounted on the YNAO 2.4 m telescope. The coverage in the parameter space is originally based on MILES, but expanded through selecting targets from PASTEL catalogue in order to improve the coverage and homogeneity of the distribution of the MILES template stars. The wavelength coverage of the template spectra is also extended to the far red beyond the Ca ii triplet.
Hitherto, 822 OMR (blue) and 1,324 YFOSC (red) spectra, covering respectively wavelength ranges 3800–5180 and 5150–9000, have been observed and reduced. The spectra has a FWHM resolution of about 3.3 Å, and a mean SNR higher than 100 per pixel for essentically all of them. An accuracy of Å and per cent have been achieved for the wavelength- and flux-calibration. The wavelength-calibration is further improved to an accuracy of km s -1 after corrected for the systematic errors in the spectral dispersion relations derived from the arc spectra. Comparison of broad band () colours calculated from the LEMONY spectra with those calculated from the MILES spectra and the photometric measurements from the Lausanne photometric database, and comparison between the LEMONY spectra with those from the MILES and CaT libraries for the common stars, all suggest that a flux-calibration accuracy of the LEMONY spectra of 5 per cent. The Lick/IDS and the near-IR indices derived from the LEMONY spectra are also consistent with those derived from the spectra in the MILES, ELODIE and CaT libraries. Currently, the LEMONY library contains 822 blue and 1,324 red spectra. Together with the MILES spectra, one now has 1,731, 1,542, 1,324 and 1,273 stars with high quality spectra covering respectively wavelength ranges 3800–5180, 3800–7500, 5150–9000 and 3800–9000. Compared with the MILES library, the coverage and homogeneity of the distribution of the template stars in the LEMONY library in the parameter space are much improved. In addition, a significant fraction of the stars have red spectra extending in wavelength beyond the Ca ii triplet.
The LEMONY library is expected to reduce the systematic errors of atmospheric parameters deduced with LSP3. The 1,324 LEMONY red spectra will be used as template spectra to estimate atmospheric parameters from the LAMOST red-arm spectra, for stars either intrinsically red (i.e. of late spectral types) or heavily reddened by the interstellar dust grains, increasing the number of stars surveyed by LAMOST with atmospheric parameters determined by 30 per cent. The LEMONY library should also be useful for stellar population syntheses of galaxies and clusters in a wide wavelength coverage. Of course, it should also benefit other studies, such as the spectral classification of stars, tests of the stellar atmospheric models,etc.
ACKNOWLEDGEMENTS
We appreciate the helpful comments from the anonymous referee.This work was supported by National Key Basic Research Program of China 2014CB845700 and by the National Natural Science Foundation of China U1531244 and 11473001. We acknowledge the support of the staff of the YNAO 2.4 m telescope. Funding for the telescope has been provided by Chinese Academy of Sciences and the People’s Government of Yunnan Province. This work was partially Supported by the Open Project Program of the Key Laboratory of Optical Astronomy, National Astronomical Observatories, Chinese Academy of Sciences.
References
- Adelman-McCarthy et al. (2008) Adelman-McCarthy J. K. et al., 2008, ApJS, 175, 297
- Barbuy et al. (2003) Barbuy B., Perrin M.-N., Katz D., Coelho P., Cayrel R., Spite M., Van’t Veer-Menneret C., 2003, A&A, 404, 661
- Boeche et al. (2011) Boeche C. et al., 2011, AJ, 142, 193
- Bruzual & Charlot (2003) Bruzual G., Charlot S., 2003, MNRAS, 344, 1000
- Buzzoni (1989) Buzzoni A., 1989, ApJS, 71, 817
- Cenarro et al. (2001) Cenarro A. J., Cardiel N., Gorgas J., Peletier R. F., Vazdekis A., Prada F., 2001, MNRAS, 326, 959
- Chen et al. (2014) Chen Y.-P., Trager S. C., Peletier R. F., Lançon A., Vazdekis A., Prugniel P., Silva D. R., Gonneau A., 2014, A&A, 565, A117
- Coelho et al. (2005) Coelho P., Barbuy B., Meléndez J., Schiavon R. P., Castilho B. V., 2005, A&A, 443, 735
- Deng et al. (2012) Deng L.-C. et al., 2012, Research in Astronomy and Astrophysics, 12, 735
- Falcón-Barroso et al. (2011) Falcón-Barroso J., Sánchez-Blázquez P., Vazdekis A., Ricciardelli E., Cardiel N., Cenarro A. J., Gorgas J., Peletier R. F., 2011, A&A, 532, A95
- Fitzpatrick (1999) Fitzpatrick E. L., 1999, PASP, 111, 63
- Gontcharov (2006) Gontcharov G. A., 2006, Astronomy Letters, 32, 759
- Guiderdoni & Rocca-Volmerange (1987) Guiderdoni B., Rocca-Volmerange B., 1987, A&A, 186, 1
- Heap & Lindler (2007) Heap S. R., Lindler D. J., 2007, in Astronomical Society of the Pacific Conference Series, Vol. 374, From Stars to Galaxies: Building the Pieces to Build Up the Universe, Vallenari A., Tantalo R., Portinari L., Moretti A., eds., p. 409
- Huang et al. (2015) Huang Y., Liu X.-W., Yuan H.-B., Xiang M.-S., Chen B.-Q., Zhang H.-W., 2015, MNRAS, 454, 2863
- Jofré et al. (2015) Jofré P. et al., 2015, A&A, 582, A81
- Johnson & Morgan (1953) Johnson H. L., Morgan W. W., 1953, ApJ, 117, 313
- Jones (1999) Jones L.-A., 1999, PhD Thesis, Univ. of North Carolina, Chapel Hill
- Kharchenko et al. (2007) Kharchenko N. V., Scholz R.-D., Piskunov A. E., Roeser S., Schilbach E., 2007, VizieR Online Data Catalog, 3254, 0
- Lastennet et al. (2002) Lastennet E., Lejeune T., Oblak E., Westera P., Buser R., 2002, APSS, 280, 83
- Le Borgne et al. (2003) Le Borgne J.-F. et al., 2003, A&A, 402, 433
- Lee et al. (2008) Lee Y. S. et al., 2008, AJ, 136, 2022
- Leitherer et al. (1996) Leitherer C. et al., 1996, PASP, 108, 996
- Leitherer et al. (2010) Leitherer C., Ortiz Otálvaro P. A., Bresolin F., Kudritzki R.-P., Lo Faro B., Pauldrach A. W. A., Pettini M., Rix S. A., 2010, ApJS, 189, 309
- Liu et al. (2014) Liu X.-W. et al., 2014, in IAU Symposium, Vol. 298, IAU Symposium, Feltzing S., Zhao G., Walton N. A., Whitelock P., eds., pp. 310–321
- Liu, Zhao & Hou (2015) Liu X.-W., Zhao G., Hou J.-L., 2015, Research in Astronomy and Astrophysics, 15, 1089
- Luo et al. (2015) Luo A.-L. et al., 2015, ArXiv e-prints
- Majewski (2012) Majewski S., 2012, in Chemical Evolution of the Milky Way, p. 24
- Martins & Coelho (2007) Martins L. P., Coelho P., 2007, MNRAS, 381, 1329
- Martins et al. (2005) Martins L. P., González Delgado R. M., Leitherer C., Cerviño M., Hauschildt P., 2005, MNRAS, 358, 49
- Mermilliod, Weidmann & Hauck (1996) Mermilliod J.-C., Weidmann N., Hauck B., 1996, Baltic Astronomy, 5, 413
- Milone et al. (2014) Milone A. d. C., Sansom A., Vazdekis A., Sánchez-Blázquez P., Allende Prieto C., Falcón-Barroso J., da Silva R., 2014, in Revista Mexicana de Astronomia y Astrofisica Conference Series, Vol. 44, Revista Mexicana de Astronomia y Astrofisica Conference Series, pp. 49–49
- Munari et al. (2005a) Munari U., Sordo R., Castelli F., Zwitter T., 2005a, A&A, 442, 1127
- Munari et al. (2005b) Munari U., Sordo R., Castelli F., Zwitter T., 2005b, A&A, 442, 1127
- Murphy & Meiksin (2004) Murphy T., Meiksin A., 2004, MNRAS, 351, 1430
- Perryman et al. (1997) Perryman M. A. C. et al., 1997, A&A, 323, L49
- Prugniel & Soubiran (2001) Prugniel P., Soubiran C., 2001, A&A, 369, 1048
- Röck et al. (2016) Röck B., Vazdekis A., Ricciardelli E., Peletier R. F., Knapen J. H., Falcón-Barroso J., 2016, A&A, 589, A73
- Sánchez-Blázquez et al. (2006) Sánchez-Blázquez P. et al., 2006, MNRAS, 371, 703
- Soubiran et al. (2010) Soubiran C., Le Campion J.-F., Cayrel de Strobel G., Caillo A., 2010, A&A, 515, A111
- Steinmetz et al. (2006) Steinmetz M. et al., 2006, AJ, 132, 1645
- Valdes et al. (2004) Valdes F., Gupta R., Rose J. A., Singh H. P., Bell D. J., 2004, ApJS, 152, 251
- Vazdekis (1999) Vazdekis A., 1999, ApJ, 513, 224
- Vazdekis et al. (2012) Vazdekis A., Ricciardelli E., Cenarro A. J., Rivero-González J. G., Díaz-García L. A., Falcón-Barroso J., 2012, MNRAS, 424, 157
- Worthey (1994) Worthey G., 1994, ApJS, 95, 107
- Worthey & Ottaviani (1997) Worthey G., Ottaviani D. L., 1997, ApJS, 111, 377
- Wu et al. (2011) Wu Y. et al., 2011, Research in Astronomy and Astrophysics, 11, 924
- Xiang et al. (2017) Xiang M.-S. et al., 2017, MNRAS, 464, 3657
- Xiang et al. (2015) Xiang M. S. et al., 2015, MNRAS, 448, 822
- Yanny et al. (2009) Yanny B. et al., 2009, AJ, 137, 4377
- Yuan et al. (2015) Yuan H.-B. et al., 2015, MNRAS, 448, 855
- Yuan, Liu & Xiang (2013) Yuan H. B., Liu X. W., Xiang M. S., 2013, MNRAS, 430, 2188
- Zhao et al. (2012) Zhao G., Zhao Y.-H., Chu Y.-Q., Jing Y.-P., Deng L.-C., 2012, Research in Astronomy and Astrophysics, 12, 723