Light-echoes from the plateau in Eta Carinae’s Great Eruption reveal a two-stage shock-powered event††thanks: This paper includes data gathered with the 6.5 meter Magellan Telescopes located at Las Campanas Observatory, Chile.
Abstract
We present multi-epoch photometry and spectroscopy of a light echo from Carinae’s 19th century Great Eruption. This echo shows a steady decline over a decade, sampling the 1850s plateau of the eruption. Spectra show the bulk outflow speed increasing from 150 km s-1 at early times, up to 600 km s-1 in the plateau. Later phases also develop remarkably broad emission wings indicating mass accelerated to more than 10,000 km s-1. Together with other clues, this provides direct evidence for an explosive ejection. This is accompanied by a transition from a narrow absorption line spectrum to emission lines, often with broad or asymmetric P Cygni profiles. These changes imply that the pre-1845 luminosity spikes are distinct from the 1850s plateau. The key reason for this change may be that shock interaction with circumstellar material (CSM) dominates the plateau. The spectral evolution of Car closely resembles that of the decade-long eruption of UGC 2773-OT, which had clear signatures of shock interaction. We propose a 2-stage scenario for Car’s eruption: (1) a slow outflow in the decades before the eruption, probably driven by binary interaction that produced a dense equatorial outflow, followed by (2) explosive energy injection that drove CSM interaction, powering the plateau and sweeping slower CSM into a fast shell that became the Homunculus. We discuss how this sequence could arise from a stellar merger in a triple system, leaving behind the eccentric binary seen today. This gives a self-consistent scenario that may explain interacting transients across a wide range of initial mass.
keywords:
circumstellar matter — stars: evolution — stars: winds, outflows1 INTRODUCTION
The underlying physical mechanism for Car’s astounding brightness variation and prodigious mass ejection has been the central mystery associated with this object since John Herschel first drew attention to its erratic flashes and relapses in the mid-19th century (Herschel, 1847). Because an extremely luminous and massive star appears to have survived this event, it has been discussed as a prototype for a growing and diverse class of non-terminal eruptive transients seen in external galaxies that have luminosities between traditional novae and supernovae (SNe), often referred to as giant eruptions of luminous blue variables (LBVs) or “SN impostors” (see Smith et al. 2011; Van Dyk & Matheson 2012).
Unlike these extragalactic transients, though, Car is nearby enough that it affords us the opportunity to dissect the properties of its spatially resolved bipolar “Homunculus” nebula (Gaviola, 1950) that was ejected in the event (Currie et al., 1996; Morse et al., 2001; Smith & Gehrz, 1998; Smith, 2017). There is a vast literature concerning multiwavelength observational details of the Homunculus (see a recent review by Smith 2012), but the main ingredients to note here are its high ejected mass of about 15 (Smith et al., 2003b; Smith & Ferland, 2007), its high expansion speeds that also imply a large kinetic energy (Smith, 2006a), and that the majority of the mass is concentrated in very thin walls of the mostly hollow bipolar shell (Smith, 2006a). Such extreme mass loss suggests that brief eruptions may be important in the evolution of massive stars (Smith & Owocki, 2006).
There are also complex ejecta outside the Homunculus, called the Outer Ejecta (Thackeray, 1950; Walborn, 1976), which have elevated N abundances (Davidson et al., 1982, 1986; Smith & Morse, 2004). Some of these Outer Ejecta have very fast expansion speeds of 3000-5000 km s-1 indicating an origin in the 19th century Great Eruption (Smith, 2008), while the majority are slower and implicate at least two major mass-loss eruptions 300-600 years before the 19th century event (Kiminki et al., 2016). Were it not for this last point of recurring major eruptions, the one-time merger of a binary system (discussed several times; Gallagher 1989; Iben 1999a; Portegies Zwart & van den Heuvel 2016; Smith et al. 2016b) might seem like a natural explanation for the energy and mass ejection of the Great Eruption. The system is still a close and highly eccentric binary system today (Damineli, 1996; Damineli et al., 1997), which requires a triple system initially in any merger model. The orbital parameters of the surviving binary are constrained surpisingly well (Madura et al., 2012), considering that we have not yet detected the secondary star. The high eccentricity dictates that the two stars come very close to one another at periastron and may even collide or exchange mass during an eruption (Soker, 2001, 2004; Kashi & Soker, 2009; Smith, 2011), adding complexity to any binary model. Indeed, brief luminosity spikes in the historical light curve of Car are seen to coincide with times of periastron passage (Smith & Frew, 2011). Binary interaction is likely to be very important in the physics of Car’s eruption and in other SN impostors, but the details of a working scenario are still a matter of much debate; our main interest in this paper is to characterize the observed properties of the mass loss during the eruption to help guide our understanding of how so much mass left the system in such a short time.
Two qualitatively different models have emerged for the driving physics of Car’s mass-loss that can be summarized plainly as either a wind or an explosion, although perhaps neither is quite so simple. The eruptive mass loss exhibited by Car occupies a grey area between winds and explosions — it is either a heavily mass-loaded and energy starved wind, or a relatively weak explosion that only unbinds the outer envelope. This is between the opposite extremes of either a line-driven wind or a core-collapse SN explosion.
The more traditional interpretation (traditional in the sense that it has been around longer and is more developed) involves a strong radiative luminosity that pushes the star above the classical Eddington limit and initiates a strong outflow of matter. This is interpreted in the context of the theory for continuum-driven super-Eddington winds (Owocki et al., 2004, 2017; Owocki & Shaviv, 2016; Quataert et al., 2016; Shaviv, 2000; Smith & Owocki, 2006; van Marle et al., 2008). In this picture, the outflow is a result of the increased radiative luminosity, and the emitting surface is expected to be a relatively cool pseudo-photosphere in the outflowing wind (Davidson, 1987; Humphreys & Davidson, 1994; Davidson & Humphreys, 1997; Owocki & Shaviv, 2016). Consequently, the roughly 20-year duration of the eruption indicates that the star was exceeding its classical electron-scattering Eddington limit by about a factor of 5 the entire time.
The other type of scenario for the Great Eruption mass loss is primarily as a hydrodynamic explosion (Smith, 2013). This picture is different from the previous one in the sense that in the former, it is the momentum of escaping photons that accelerates the outflowing material. In an explosion model, the radiation we observe is largely a byproduct of heating by the shock interaction between fast explosively ejected matter that overtakes slower circumstellar material (CSM). This scenario is generally referred to as “CSM interaction”, and is similar to the standard model for CSM interaction in SNe IIn, but with a non-terminal and lower-energy explosion. A key point is that in the CSM interaction model, we avoid the puzzle of how a star’s envelope can persist in a strongly super-Eddington state for 20 years, because here the emitting material is not bound. Instead, the primary source of luminosity during the plateau of the eruption resides in the shock itself as it plows through the dense CSM. A simple 1-D model shows that one can account for the observed decade-long plateau of Car’s eruption while also matching the present-day observed properties of the massive shell nebula (Smith, 2013).
Both types of models have the shortcoming that they lack a clear explanation for the ultimate source of the energy. In the super-Eddington wind model, the star’s radiative luminosity is assumed to increase temporarily and then decrease as dictated by the observed light curve, and is the primary agent driving the mass loss. The source of this extra luminosity is unknown. In the CSM interaction scenario, the power source is the relatively sudden deposition of energy deep inside the star for some unknown reason, and the radiation is a byproduct. That energy source may be from binary orbital energy, as mentioned above, or from nuclear burning instabilities akin to those that have been suggested in eruptive SN progenitors (Quataert & Shiode, 2012; Shiode & Quataert, 2014; Smith & Arnett, 2014; Woosley, 2017). The wind model may have problems accounting for several aspects of the observed nebula (see below), whereas the CSM interaction requires us to invoke some slow pre-existing CSM for the fast ejecta to collide with. Both models can potentially account for the bipolar shape if we invoke either rapid rotation (Dwarkadas & Owocki, 2002; Owocki & Gayley, 1997; Smith & Townsend, 2007) or equatorial CSM (Frank et al., 1995; Langer et al., 1999). A key ongoing challenge is to understand how a merger or some other physical model might provide the required energy on the appropriate timescale, in a way that yields the observed results.
Primary sources of empirical information that have guided these two mass-loss scenarios involve the historical visible-wavelength light curve (Smith & Frew, 2011) and the physical parameters of the remnant of the explosion - the “Homunculus Nebula” and its surrounding debris, which can be studied in exhaustive detail. The historical record provides the observed fact that the object’s luminosity did exceed the Eddington limit for the star’s presumed mass for more than a decade, motivating the wind model. On the other hand, continued study of the present-day nebula gives several clues that together point strongly toward a hydrodynamic explosion. These are: (1) the large mass of 12-20 in the Homunculus combined with its fast expansion speeds gives a large kinetic energy of order 1050 ergs (Smith et al., 2003b; Smith, 2006a), which exceeds the radiative energy budget of 1049 ergs. This low ratio of luminious to kinetic energy is more characteristic of radiation from expanding and cooling SN envelopes than of stellar winds (although winds with extreme photon tiring might also achieve this; Owocki et al. 2004). (2) Observations of material outside the Homunculus indicate very high expansion speeds reaching 5000 km s-1, which is easier to explain with shock acceleration (Smith, 2008). This outer fast material also raises the total kinetic energy budget of the event even more. (3) Most of the mass in the Homunculus resides in the extremely thin walls of the bipolar lobes, which points to compression in a radiative shock (Smith, 2006a, 2013). Other details of the structure in the nebula also point toward a shock rather than a steady wind (see discussion in Smith 2013).
Recent studies have added significantly to the already tremendous repository of observational information about Car. Namely, the discovery111Historical aside: Light echoes from Car have been reported previously. Walborn & Liller (1977) discovered that clouds in the Keyhole nebula were reflecting the peculiar spectrum of Car. Elliott (1979) obtained spectra of these features as well, but interpreted the relatively broad line wings as evidence that the Keyhole was a supernova remnant. Additional spectra of these reflected echoes were also obtained and interpreted as echoes with minor spectral variability over time (Lopez & Meaburn, 1984, 1986; Boumis et al., 1998). However, these were not strongly variable echoes of the Great Eruption, but rather, reflected light from the star in its modern post-eruption state. Interestingly, though, Walborn & Liller (1977) pointed out that if these nearby clouds are scattering light from the star today, then this may explain why drawings of the Keyhole by Herschel (1847) look different from its appearance today (Gratton, 1963). If so, then John Herschel was arguably the first to record light echoes from the Great Eruption. of light echoes from Car’s Great Eruption (Rest et al., 2012) and the evolution of light echo brightness and spectra over time (Prieto et al., 2014) allow us to probe deeper, providing a unique and crucial link between the historical brightness record, the kinematics and structure of the nebula, and potential similarity to modern extragalactic analogs. Rest et al. (2012) showed that light echo spectra near the peak of the eruption showed a characteristic temperature that was significantly cooler (G-type) than published expectations for pseudo-photospheres of LBV eruptions (Davidson, 1987) and observed spectra of LBV eruptions (Humphreys & Davidson, 1994). This sparked a debate. Davidson & Humphreys (2012) argued that if one were to extrapolate the published pseudo-photosphere models of Davidson (1987) in the appropriate way, the wind photosphere might be consistent with temperatures as cool as observed. Owocki & Shaviv (2016) noted inconsistencies in the analysis by Davidson (1987), but also showed that by properly accounting for opacities in radiative equilibrium, wind mass-loss rates of the order of that inferred for Car’s Great Eruption are compatible with temperatures around 5000 K after all. In any case, spectroscopy of the subsequent fading of that same echo (Prieto et al., 2014) showed that the temperature became cooler still, dropping to 4000-4500 K and forming molecular bands commonly seen in extremely cool carbon stars. This behavior with time contradicts simple expectations for a pseudo-photosphere model, where the apparent temperature should increase as the photosphere recedes to deeper wind layers (Davidson, 1987).
The development of such cool temperatures and molecular features in the spectra presented by Prieto et al. (2014) correspond to one of the brief luminosity spikes (e.g., 1843, 1838, etc.) observed in the early stages of the eruption (Smith & Frew, 2011). As described in this paper, the temporal evolution of echo spectra shows clear disagreement with a wind pseudo-photosphere interpretation of the eruption, but gives unambiguous evidence of an explosive component to the mass loss. There are a number of important implications for the nature of the Great Eruption and the evolutionary history of the Car system.
2 OBSERVATIONS
In this paper, we investigate the spectral and photometric evolution of an echo from Carinae that is different from the echoes discussed in our previous papers (Rest et al., 2012; Prieto et al., 2014). The new echo, which we designate EC2 (EC1 was the group of echoes discussed by Rest et al. 2012), is located at (J2000) = 10:44:28.80, (J2000) 60:15:30, and was discovered in the same difference imaging that we used to discover other echoes; see Rest et al. (2012) for details. EC2 arises on the surface of a cometary shaped dust cloud. This echo is somewhat brighter than the other echoes we’ve studied previously, but is especially distinct in that it fades much more slowly and shows different spectral characteristics. EC2 is unique among the echoes we found in that it was brighter in the first-epoch 2003 image and has faded steadily since then. All other echoes have brightened compared to 2003. As we detail below, EC2 likely corresponds to the main 1845-1858 plateau in the Great Eruption, rather than the initial pre-1845 luminosity spikes. It therefore provides unique new information about the physics and evolution of the Great Eruption.
2.1 Emission-line and IR Imaging
For context in understanding the location, geometry, environment, and nearby background emission associated with the light echo studied in this paper, we include an analysis of multiwavelength images of the Carina Nebula. EC2 is located in the southern part of the Carina Nebula, about 2′ away (or about 1.3 pc in projection) from the EC1 group of light echoes discussed in our previous papers (Rest et al., 2012; Prieto et al., 2014), which sample earlier times in the Great Eruption than the light being reflected now by EC2. EC1 and EC2 echoes trace roughly the same viewing angle to the star.
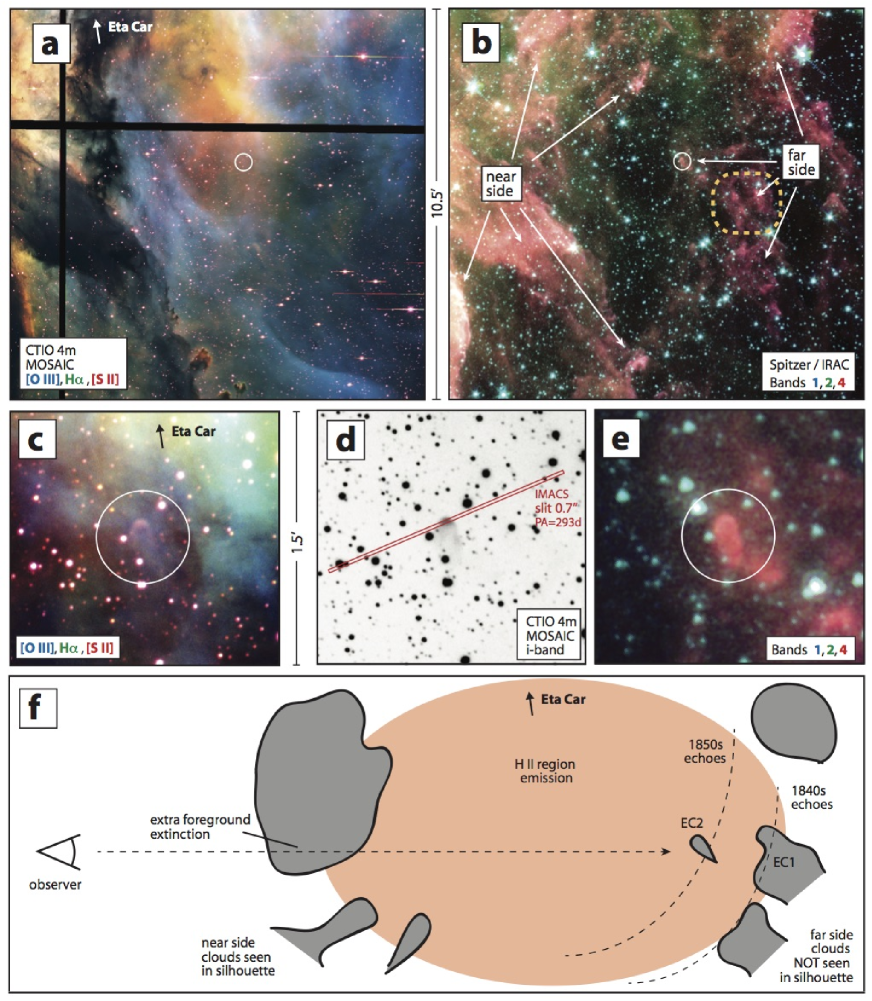
Relatively wide-field (105105) color composite images of this region are shown in Figure 1. Figure 1a shows an image in visible-wavelength emission lines of [O iii] 5007 (blue), H (green), and [S ii] 6717,6731 (red) that are commonly used to image H ii regions. These were obtained in 2003 March with the MOSIAC2 camera Cerro Tololo Inter-American Observatory (CTIO) 4m Blanco telescope, which uses a 24 array of 20484096 pixel CCDs giving a roughly half-degree field of view with small chip gaps. A portion of these images is shown in Figure 1a. The reduction and analysis of the images have been described elsewhere in previous papers that used these same data (Smith et al., 2003a, 2004a, 2005a). Figure1b shows the same field of view in the infrared (IR) in images obtained with the Spizer Space Telescope in 2005 January using the Infrared Array Camera (IRAC). The reduction and analysis of these images were presented in a previous paper (Smith et al., 2010a). The color image shown here combines Band 1 (3.6 m) in blue, mostly containing stellar photospheric light and polycyclic aromatic hydrocarbon (PAH) emission, Band 2 (4.5 m) in green, containing starlight, Br, and some hot dust emission, and Band 4 (8.0 m) in red, dominated by PAH emission from the surfaces of molecular clouds illuminated by UV radiation. PAH emission from clouds appears pink or magenta in this image, while stars appear blue/green. The location of EC2 is circled, and the clouds that give rise to the echoes we have studied previously are in the dashed yellow box in Figure 1b.
Figures 1c, 1d, and 1e show a zoomed-in (1515) region around EC2, where the color schemes in Panels 1c and 1e are the same as the larger field images. Figure 1d is a negative greyscale image of the -band MOSAIC2 image also taken in 2003 March, which is dominated by reflected continuum starlight. This -band image has served as our first-epoch template image that we initially used to make difference images to discover light echoes around Car (Rest et al., 2012). These zoomed images clearly show a small comet-shaped dust cloud, the near surface of which gives rise to the light echo discussed in this paper. The bright end of this cloud spans about 5, or roughly 0.2 ly across. This is important when considering possible smearing of the echo signal by light travel time.
The bottom panel in Figure 1f shows a sketch of our interpretation for the viewing geometry for the EC2 light echo. The rationale for this geometry is explained later in Section 3.1.

| Instrument | g | r | i | z |
|---|---|---|---|---|
| CTIO 4m Mosaic II | … | … | 5 | … |
| CTIO 4m DECam | 29 | 30 | 67 | 36 |
| LCO-2 2m FTS | 2 | 1 | 24 | … |
| LCO-1 Swope | … | … | 19 | … |
2.2 Broadband Imaging
The images from which we measured the broadband photometric lightcurves were obtained with several different telescopes and instruments: MOSAIC II and DECam (Flaugher et al., 2015) wide-field cameras (4 and 69 epochs respectively) mounted on the Blanco 4 m telescope at CTIO, the direct CCD camera mounted on the Swope 1 m telescope at Las Campanas Observatory (LCO-1), and the Spectral CCD camera mounted on the 2 m Faulkes Telescope South (FTS; Brown et al. 2013) at the Las Cumbres Observatory (LCO-2) Siding Spring site. These totaled 31, 31, 115, and 36 epochs in , , , bands, respectively, with details given in Table 1. Standard image reduction was performed on all the images, including bias/overscan subtraction and flat-fielding using skyflats and domeflats.
The photometric data were processed with the photpipe pipeline (Rest et al., 2005a), which is the same pipeline that has been used to discover and analyze the light echoes of historical SNe (e.g., Rest et al. 2005b, 2008) and other echoes of Car (Rest et al., 2012; Prieto et al., 2014). Images are kernel- and flux-matched, aligned, and swarped (Bertin et al., 2002), to match a template, then pairs of images are subtracted to create difference images, and bright stars are masked. This process produces clean images that contain, ideally, only the light echo flux. Most of our sampling was obtained in SDSS band. The -band lightcurve was processed using a CTIO Blanco telescope image from 2003 as a reference template (Smith et al., 2003a). The SDSS imaging campaign did not begin until 2012. DECam images from 2012 are used as reference templates for and , and from 2013 for band.
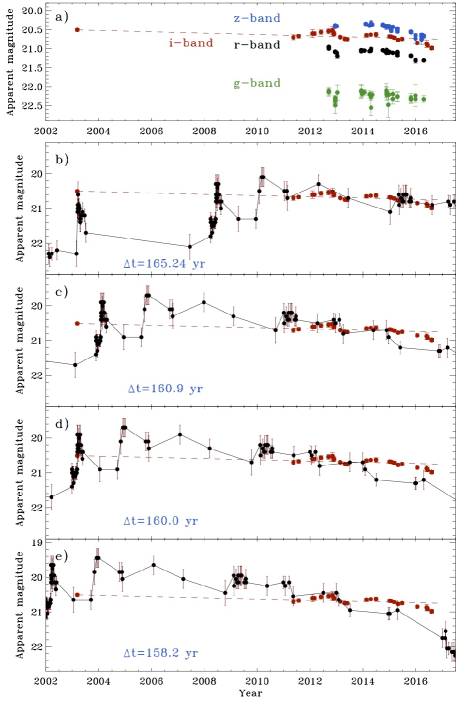
Five 33 pixel regions are selected along the light echo, and away from bright stars. We sample multiple regions in order to decrease noise. The flux from these regions is averaged, and compared to standard star photometry to produce the lightcurve shown in Figure 2. While sampling the flux in 5 locations increases the number of data points, thus decreasing the noise, it samples the event at slightly different epochs, due to the slightly different distance between each dust region observed and the event source (i.e. light travel time across the reflecting cloud). However, photometry generated from a single region centered where the spectroscopic slit is centered (a 33 pixel region at (J2000) = 10:44:28.80, (J2000) -60:15:30) produces a lightcurve with identical time evolution within the errors. The total light travel time across the reflecting cloud is small - only 0.2 yr. The fluxes thus obtained were transformed into the DECam AB magnitude system using observations of SDSS standards obtained in 2014 January. We compare this light curve to the historical light curve (Smith & Frew, 2011) with various shifts in time corresponding to times during the Great Eruption (Figure 2) and the Lesser Eruption in the 1890s (Figure 3).
| UT Date | Tel./Intr. | grating | slit | PA |
|---|---|---|---|---|
| 2011 Dec 23 | Baade/IMACS f2 | 200 | 09 | 270∘ |
| 2012 Mar 18 | Baade/IMACS f2 | 200 | 09 | 270∘ |
| 2012 Jun 26 | Baade/IMACS f2 | 200 | 09 | 270∘ |
| 2012 Oct 14 | Baade/IMACS f4 | 300 | 12 | 340∘ |
| 2013 Jan 07 | Clay/MagE | ech. | 10 | 240∘ |
| 2013 Apr 05 | Baade/IMACS f4 | 300 | 07 | 270∘ |
| 2014 Jan 07 | Clay/MagE | ech. | 10 | 240∘ |
| 2014 Feb 05 | Baade/IMACS f4 | 1200 | 09 | 293∘ |
| 2014 Feb 06 | Baade/IMACS f4 | 300 | 09 | 293∘ |
| 2014 May 19 | Baade/IMACS f4 | 1200 | 07 | 293∘ |
| 2014 Nov 03 | Gemini/GMOS | R400 | 10 | 293∘ |
| 2015 Jan 20 | Baade/IMACS f4 | 1200 | 07 | 293∘ |
| 2015 Jan 20 | Baade/IMACS f4 | 300 | 07 | 293∘ |
| 2016 Mar 04 | Baade/IMACS f4 | 1200 | 07 | 293∘ |
| 2016 Mar 05 | Baade/IMACS f2 | 300 | 07 | 293∘ |
| 2016 Mar 25 | Clay/MagE | ech. | 10 | 240∘ |
2.3 Optical Spectroscopy
Following the discovery of light echoes from Carinae (Rest et al., 2012), we initiated a followup campaign to study the spectral evolution of these echoes. So far in previous papers, we have discussed the initial spectra and spectral evolution of the EC1 group of echoes that are thought to arise from pre-1845 peaks in the light curve (Rest et al., 2012; Prieto et al., 2014), but we have monitored a number of other echo systems as well. EC2 is among the brightest of these targets, which allowed us to obtain some observations with higher dispersion than we could use for fainter echoes.
We obtained low- or moderate-resolution spectra of EC2 on a number of dates from 2011 to the present, as listed in Table 2. Many of our spectra were obtained using the Inamori-Magellan Areal Camera and Spectrograph (IMACS; Dressler et al. 2011) mounted on the 6.5m Baade telescope of the Magellan Observatory located at LCO-1. The chosen slit width depended on seeing conditions and trade-offs between signal and resolution, but was usually between 07 and 1. With IMACS in f/2 mode, we used the 300 lpm grating to obtain a single spectrum across the full optical wavelength range of 3900-9500 Å at a low resolution of . With the f/4 camera, we used either the 300 lpm grating to sample a wider wavelength range at moderate resolution, or the 1200 lpm grating to sample a smaller wavelength range with higher resolution of . Usually the 1200 lpm grating was centered on H, but we also obtained some 1200 lpm spectra of the Ca ii infrared triplet. The 2-D spectra were reduced and extracted using routines in the IMACS package, and also standard spectral reduction routines in IRAF.222IRAF is distributed by the National Optical Astronomy Observatory, which is operated by the Association of Universities for Research in Astronomy, Inc., under cooperative agreement with the National Science Foundation.
We also obtained a relatively high-resolution echellette spectrum of EC2 using the Magellan Echellette spectrograph (MagE; Marshall et al. 2008) mounted on the Clay 6.5-m telescope at LCO-1. These echellette spectra are listed as “ech.” for the grating name in the third column of Table 2. The spectra were obtained with a 1 slit, which yielded a resolution , and covered the full optical wavelength range ( Å), although with lower signal-to-noise than most of the IMACS 1200 lpm spectra. The spectra were reduced, combined, and extracted using the Carnegie pipeline written by D. Kelson.
We obtained a low-resolution spectrum of EC2 on 2014 Nov 13 using the Gemini Multi-Objects Spectrograph (Hook et al., 2002) at Gemini South on Cerro Pachon. Nod-and-shuffle techniques (Glazebrook & Bland-Hawthorn, 2001) were used with GMOS to improve sky subtraction. Standard CCD processing and spectrum extraction were accomplished with IRAF. The spectrum covers the range Å with a resolution of Å. We used an optimized version333https://github.com/cmccully/lacosmicx of the LA Cosmic algorithm (van Dokkum, 2001) to eliminate cosmic rays. We extracted the spectrum using the optimal extraction algorithm of Horne (1986). Low-order polynomial fits to calibration-lamp spectra were used to establish the wavelength scale. Small adjustments derived from night-sky lines in the object frames were applied. We employed our own IDL routines to flux calibrate the data using the well-exposed continua of the spectrophotometric standards (Wade & Horne, 1988; Matheson et al., 2000).
3 RESULTS
3.1 Environment
The EC2 light echo, as well as the echoes we have discussed previously in the literature (Rest et al., 2012; Prieto et al., 2014) are seen in the southern part of the Carina Nebula among the so-called “South Pillars” (Smith et al., 2000) region. This is a region of active ongoing star formation in clouds exposed to feedback from the massive O-type stars that have formed in the region, with this feedback shaping the clouds into elongated globules and dust pillars. The structure of these clouds and dust pillars can be seen in mid-IR PAH emission from the photodissociation regions on their surfaces in wide-field IR imaging of the region (Smith et al., 2000, 2010a), as well as the image in Figure 1b. It is the surfaces of these dense star-forming clouds in the Carina Nebula that are illuminated by light from the eruption of Car and scattered toward us (Rest et al., 2012). This is different from the thin dust sheets in the ISM that produce light echoes observed from a number of SNe (Rest et al., 2005a, b, 2008). This region has spatially varying line emission from the ionization fronts and diffuse gas inside the H ii region, as well as very patchy and highly variable line-of-sight extinction through the nebula, which is larger on average than the extinction toward the central clusters Tr14 and Tr16 (Smith & Brooks, 2007).
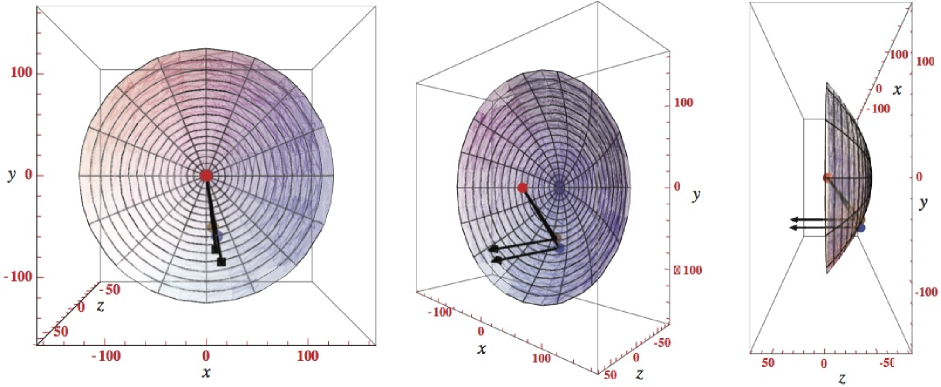
With knowledge of EC2’s position on the sky relative to Car, combined with the constraints on its most likely delay time from Section 3.2, we can use the understood behavior of a light echo parabola to constrain its 3D geometry and viewing angle relative to Car using the same method explained in our previous paper (Rest et al. 2012; and references therein). Figure 4 shows resulting plots of the 3D geometry of EC2 and previously studied EC1 echoes (Rest et al., 2012; Prieto et al., 2014) relative to Car, similar to the plots presented in our earlier papers. The two echoes both view Car from a similar direction that is near (probably within 20∘ of) the equatorial plane of the Homunculus, but EC2 is closer to Car and therefore sees more recently emitted light (in other words, it lies along a slightly smaller light echo paraboloid, tracing a later epoch in the eruption). With the same definitions for spatial coordinates as in Rest et al. (2012), and as defined here in the caption to Figure 4, we find that the scattering dust is at a position (,,)=(10,77,61) ly for EC2 and (,,)=(14,78,66) ly for the EC1 echoes (Rest et al., 2012).
These coordinates indicate that the scattering dust associated with EC2 is on the far side of the Carina Nebula, well behind the plane of the sky running through Car itself. This has two important implications. First, it makes sense in terms of EC2’s surroundings as seen in images. Second, it will introduce more line-of-sight extinction and contamination from diffuse nebular emission than for some other parts of the Carina Nebula or Car itself. These two considerations are discussed below.
A cartoon depicting the global geometry involved is shown in Figure 1f. An Earth-based observer is to the left, looking through the cold clouds on the near side of the nebula, which appear dark in optical images and glow in PAH emission in the IR. They are seen in silhouette against the bright screen of H ii region emission that fills the interior of the nebula. These dark clouds can be seen as patchy extinction in the optical emission-line images shown in Figure 1a and in PAH emission in the IR (Figure 1b). Cold clouds on the far side are also seen in PAH emission in the IR (Figure 1b), but they cannot be seen in silhouette at visible wavelengths, because they are behind the diffuse visible line emission within the H ii region. This is the case for EC2, as well as the EC1 echoes discussed previously. Dashed curves in Figure 1f denote the rough locations of the light echo parabolas corresponding to the light curve peaks in the 1830s-1840s, as well as the 1850s plateau (not to scale). This agreement between the geometry inferred from the light echo parabola and from imaging of the environment gives an independent indication that the delay time adopted is roughly correct (i.e. during the Great Eruption). If the light echoes were from a later time in Car’s history, such as the 1890s eruption, the younger paraboloid would place them on the near side of the nebula, and the scattering dust would be seen in extinction. There are other reasons why EC2 cannot be associated with the 1890 eruption as well, as mentioned later (Section 3.2).
Located on the far side of the nebula, our line of sight to EC2 passes all the way through the interior of the Carina Nebula, which provides a long (50 pc) path length of diffuse ionized gas that contaminates the spectrum. This adds to the difficulty of interpreting light echo spectra. Fortunately, most of the diffuse emission can be subtracted (with large residuals for the brightest lines like H, [N ii], and [O iii]) by carefully sampling the adjacent emission along the long-slit aperture. This H ii region emission is more of a problem than sky lines.
The large path length through the nebula may also add a great deal of extra line-of-sight extinction. In Figure 1a, one can see evidence of patchy diffuse extinction within the Carina Nebula. It is therefore likely that the required extinction correction for EC2 is larger than the value of =0.47 mag that is usually adopted, derived from the average for O-type stars in the central Carina Nebula (Walborn, 1995). Since the extinction is lowest toward the center of the nebula, mag is a minimum value; below we adopt mag to deredden all our spectra of EC2. This value (within roughly 0.2 mag, dominated by the noise in the blue wavelength range) brings the continuum shape in spectra into agreement with the apparent temperature deduced from spectral features (see Rest et al. 2012). The true value of the line-of-sight extinction could be even higher, but is also mitigated because of scattering by dust that tends to make the light bluer. Note also that this dust within the Carina Nebula has a different reddening law than the average ISM value, with (Smith, 2002), rather than the usually assumed value of 3.1.

3.2 Light Curve of the EC2 Echo
As noted earlier, EC2 is so-far unique among the set of light echoes we have discovered in the Carina Nebula in the sense that it was brighter in our template 2003 images, and it has stayed bright while fading only slightly over more than a decade since then. (In our initial difference images of 20102003, it was the only echo candidate to have a negative subtraction residual because it was brighter in the reference template.) It also has a relatively high surface brightness among echoes discovered so far. Despite the slow changes, initial and continued spectroscopy of this feature (see below) confirm that it is indeed an echo from Car’s giant eruption, since broad emission-line wings are seen, and the spectrum changes significantly even though the brightness fades slowly.
We can use imaging photometry of EC2 to constrain the most likely time period that it samples during the Great Eruption. The historical light curve (Smith & Frew, 2011) shows a few brief luminosity spikes in 1843 and before that time, seeming to occur every 5.5 years, and possibly coinciding with grazing collisions or more violent interaction events at periastron passage in the highly eccentric binary system (Smith, 2011; Smith & Frew, 2011). Other echoes discussed so far (Rest et al., 2012; Prieto et al., 2014) brighten and fade on a 1 yr timescale, and most likely correspond to some of these 1843 luminosity spikes. The complicated effects of time delays introduced by the geometry and thickness of the reflecting dust layer and how they influence the light curve shape of an echo will be discussed in a forthcoming paper (Bianco et al., in prep.). Two of these brief events were clearly observed in 1843 and 1838 and were well timed for extrapolated periastron passages (Smith, 2011). There is also potentially one earlier event that was poorly sampled in 1827, and which would also correspond to a time of periastron. The available historical record cannot rule out the possibility that there were many such events occuring in the decades before the eruption, and that these contribute to the light echoes we are finding. One might expect these events to increase in violence as the instability of the system grows leading up to the 1840s event.
EC2, however, fades at a much slower rate than any of these brief luminosity spikes. It has stayed consistently bright for over a decade, as shown in Figure 2, ruling out an association with these brief early interaction events. Moreover, in the lead-up to the Great Eruption, Car was slowly brightening in the intervening quiescent time periods between these brief spikes, culminating in the 1845 peak of the eruption. EC2 slowly and steadily fades, so it cannot be associated with the pre-1845 time period.
Figure 2 compares the observed light curve of EC2 to the historical visual light curve (Smith & Frew, 2011), exploring the feasibility of various potential time delays between the two. Even though there is a large gap in our observations between the first epoch in 2003 and our light echo hunt that began in 2010, it is clear that EC2 has faded, probably ruling out the time delay shown in panel (c), where the initial 2003 epoch occurs before 1843. The options that are feasible are that our first 2003 epoch corresponds fortuitously with either the brief 1838 luminosity spike (=165 yr; Figure 2b), the 1843 spike (=160 yr; Figure 2d), or later, with time delays of 158.2 yr as in panel (e). Since we don’t have spectra in 2003, and we don’t have suitable images in the intervening time period, we can’t choose confidently between panels (b), (d), or (e).
In any case, the main result is the same: we can be confident that the light from EC2 that we have been observing since our campaign began samples the main 1850s plateau phase of the Great Eruption. The fact that this echo is brighter and that its spectra are qualitatively different from other echoes has important physical implications for the mechanism of the eruption.
Could the EC2 echo be reflecting light from the so-called “Lesser Eruption” (Humphreys, Davidson, & Smith , 1999) in the 1890s? This is very unlikely for several reasons. (1) Although the 1890 eruption is also a long-duration plateau, it is not long enough. Figure 3 shows the observed light curve of EC2 compared to the historical light curve from Smith & Frew (2011) shifted so that the 1890s eruption overlaps in time. If we match the 1890s eruption to photometry of EC2 at the present epoch, we see that EC2 was far too bright in our first epoch in 2003, which would correspond to echo light from before the Lesser Eruption began. This rules out an association with light from the 1890s eruption. This was unlikely anyway because: (2) EC2 is the brightest echo we detect, while the 1890s eruption was several magnitudes fainter than the peak of the Great Eruption, (3) images of the environment suggest that EC2 is on the far side of the nebula (in very close proximity to echoes that trace the pre-1845 peaks; Rest et al. 2012), making the path length and delay time too long, and (4) historical spectra of the 1890s eruption discussed by Walborn & Liller (1977) show a cooler effective temperature and (more definitively) slower velocities than the slowest speeds we observe in our spectra of EC2 (discussed below). Together, these factors rule out the possibility that EC2 is an echo of the 1890 eruption. Henceforth, we assume an approximate time delay of 160 yr for EC2, tracing the light emitted by Carinae during its 1850s plateau phase.
The light curve is admittedly not a perfect match to the historical light curve in the 1850s either. Aside from possible large uncertainties in the various transformations applied to the historical accounts (Smith & Frew, 2011) or to actual observer error, there are three key reasons why the echo light curve might differ from the historical account:
1. Light travel time will smear out a reflected light curve. As noted above, however, EC2 has a size of 5″, or only 0.2 ly. This may smooth-out sharp peaks in the light curve, but will not drastically change the fading rate.
2. The historical light curve is visual eye estimates (mostly blue/yellow wavelengths) by multiple observers, whereas the standard -band is much redder, so there may be significant color differences.
3. There may be real viewing angle differences. EC2 views Car from a vantage point close to the equator. Since the ejection speed and density varies strongly with latitude, it is plausible that different latitudes could actually see a different light curve than we see in the historical record from our vantage point, which traces a latitude of about 40∘ (Smith, 2006a). With latitude-dependent ejecta speeds and densities, dust could form at a range of delay times from one latitude to the next, and so extinction could vary substantially with time and viewing angle. This could cause the light curve to fade from one direction while remaining bright for a longer time as seen from another direction, and different directions may have different reddening, related to point (2) above. In that case, the “excess” luminosity from EC2 seen in 2015 (Figure 2), as compared to the more rapidly fading historical curve, may not be a significant discrepancy.
3.3 EC2’s Apparent Color
While EC2’s photometric variability in a given filter is highly reliable and informative, interpreting the photometric color of a light echo is somewhat complicated and less reliable as a diagnostic of the source. This is because the light emitted by Car may suffer various amounts of reddening on its way to the reflecting cloud, it may get bluer due to the wavelength dependence of scattering, and then it suffers additional reddening again as it traverses the Carina Nebula and then passes through the ISM between Carina and Earth. Moreover, broadband filters are contaminated by very bright nebular emission lines from the Carina Nebula itself, making the absolute colors somewhat suspect for such a faint echo.
EC2 has a red color of (0.2) mag in 2015 (Figure 2a). This is similar to the apparent color of =1.4 mag for a different echo in a similar region of the nebula (Prieto et al., 2014). Since that echo at peak had spectral signatures indicating a temperature and intrinsic color similar to the Sun, it is likely that most of this color is attributable to extinction by dust along the light path. The color of EC2 in broadband filters shows little change from 2012-2016, consistent with the similar continuum slope seen in spectra. In our analysis of spectra below, we correct all EC2 spectra for =1.0 mag. Since the minumum for the line of sight to Carina is already =0.47 mag, as noted above, this includes a small amount of additional extinction. (It is clear from examining images that the patchy extinction toward the South Pillar region may be considerable; Figure 1a.) This is a convenient correction, since it causes the continuum shape of the 1843 echo to roughly match 5000-5500 K as indicated by the spectral diagnostics (see Rest et al. 2012), and this same amount causes the EC2 continuum shapes in spectra to approximately match a 6000 K blackbody shape. Given the similarity between EC2 and spectra of UGC 2773-OT (see discussion below), this seems reasonable. Since we concentrate our analysis mostly on line strength variability and velocity structure, this choice has little impact on our main results.
3.4 Spectral Morphology
3.4.1 Background Subtraction
The fact that the reflecting dust resides in clouds or dust pillars embedded within the Carina Nebula, rather than a cold and thin dust sheet in the ISM (as for many other SN echoes detected so far), presents an added difficulty for spectroscopy of Car’s echoes. Although the echoes are brighter than many SN light echoes (EC2 has a surface brightness of 20.5 mag arcsec-2), they reside in a region with extremely bright, spatially extended, narrow nebular emission lines from the H ii region. The reflecting dust is on the surface of an opaque cloud, which has its own nebular emission from the ionization front on its surface. Therefore, even if the diffuse background H ii region emission and sky emission is well subtracted (sampled from adjacent regions and interpolated), there may still be remaining intrinsic narrow nebular emission from the reflecting cloud surface itself. Moreover, the reflecting cloud may have its own photoionized photoevaporative flow (see, e.g., Smith et al. 2004b), so accurately sampling the adjacent background emission might lead us to oversubtract any nebular lines that are bright in the photoevaporative flow. This becomes a tricky process of how much to scale the sampled background that is subtracted, in order to get rid of the narrow nebular emission that contaminates the echo. For this reason, our analysis mostly ignores the very narrow emission or absorption associated with lines that are bright in the H ii region.
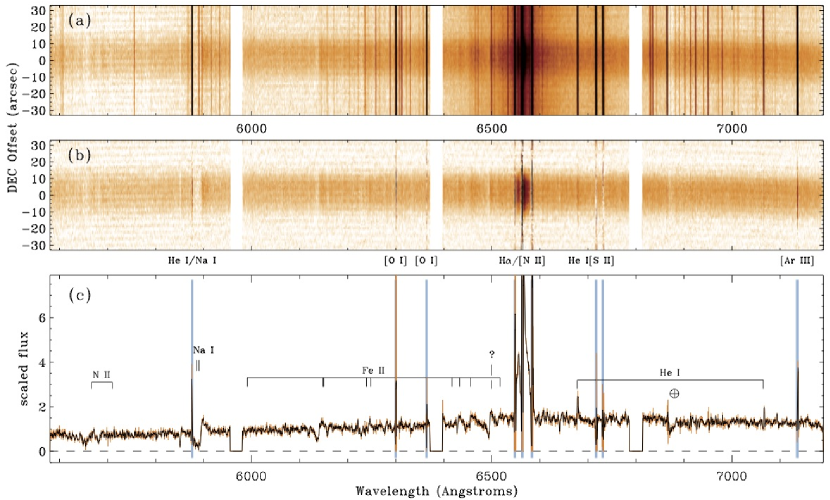
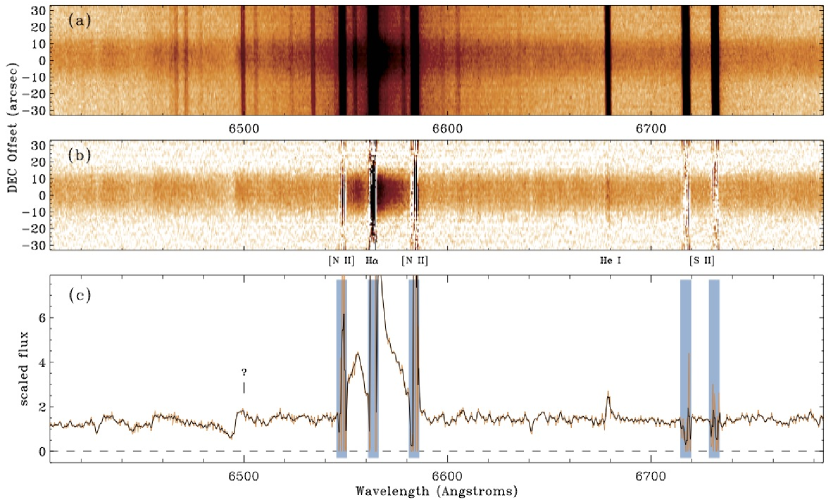
Figures 5, 6, and 7 show examples of 2D spectra before and after subtraction of the sky and diffuse H ii region emission, as well as the corresponding 1-D extraction for each. These correspond to examples of lower-resolution spectra with broad wavelength coverage, and higher resolution spectra focussed on the region around H (Figure 7 is exactly the same as 6, but zoomed-in on H to show differences between broader reflected line profiles and narrow nebular emission). The most important H ii region lines are marked in the figures: H, H, [N ii] 6548,6584, [S ii] 6717,6731, [Ar iii] 7136, and [O i] 6300,6364. There is also narrow emission from He i lines at 5876, 6680, and 7065 Å, although some of this may also be in the echo (see below). For each of these, the dominant residual emission is from nebular emission on the globule itself, and not from noise in the subtraction of diffuse H ii region lines. The sky emission, which is uniform across the slit, is cleanly subtracted in all our data.

3.4.2 Low-resolution Spectra
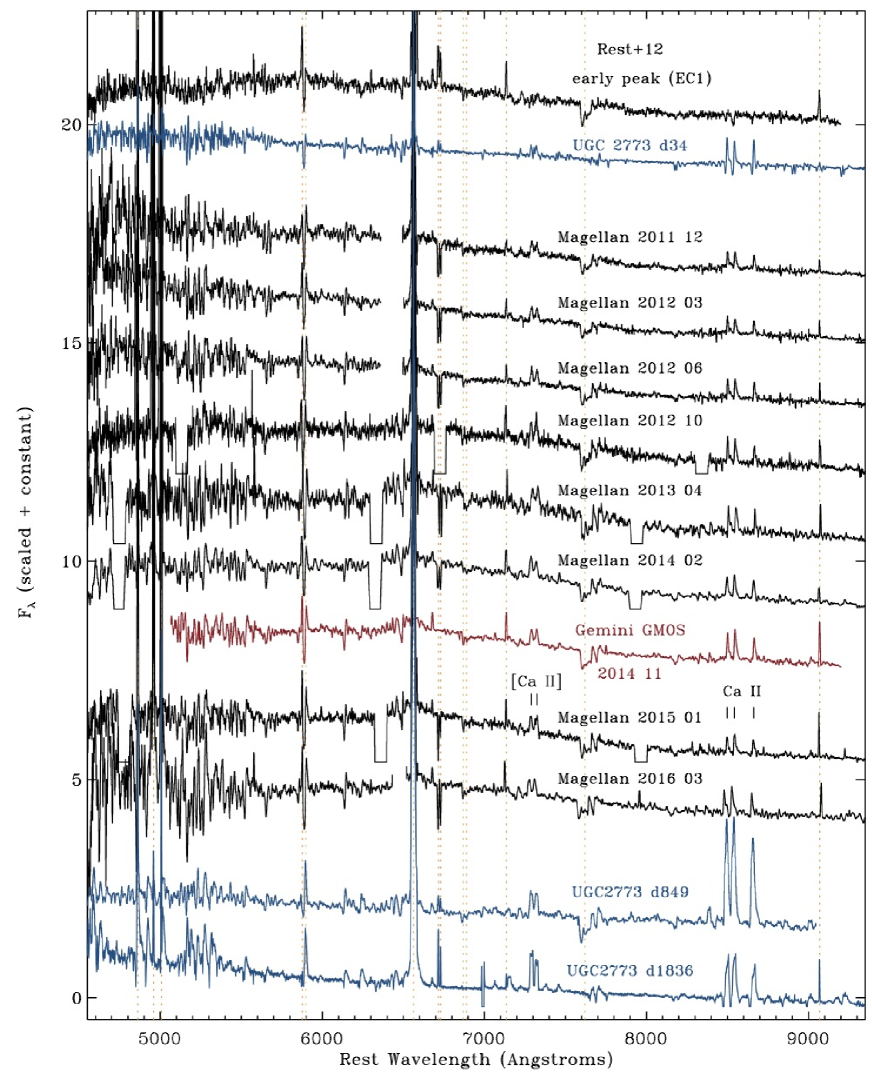
Figure 8 shows a time series of low-resolution spectra of the EC2 echo, extracted from the 2-D spectra as in Figure 5, but also flux calibrated and corrected for reddening adopting =1.0 mag. These trace the spectrum of Car in the late 1840s (upper) through the mid 1850s (lower). For comparison, Figure 8 also includes a spectrum of an early peak in the Great Eruption (1843 or 1838) from the EC1 echo discussed previously by (Rest et al., 2012). Except for the Gemini spectrum (red), all the echo spectra of Car (black) were obtained with IMACS. Also for comparison, Figure 8 shows the early and late phase spectra of the SN impostor UGC 2773-OT (blue) from Smith et al. (2016a), which is thought to be a close analog of Car.
Through the duration of our observations of EC2, the continuum slope remains roughly constant. It is, however, somewhat bluer than the earlier epoch in the eruption. Rest et al. (2012) found that the spectral signatures were best matched by a G spectral type and an effective temperature around 5000 K. When we deredden this spectrum by =1.0 mag, the continuum slope is consistent with a blackbody temperature of 5,000-5,500 K. The spectra of EC2 with the same reddening correction have only slightly warmer temperatures around 6,000 K. Inferring a reliable temperature from the continuum slope is difficult, however, because of the forest of absorption/emission lines in the blue, and because the blue end of the spectrum has relatively poor signal to noise.
EC2 shows interesting differences compared to the EC1 echo that traces an early 1838/1843 peak in the eruption. That spectrum was dominated by a forest of narrow absorption lines in the blue. Many of these change from pure absorption into emission, or into P Cygni profiles (Figure 8). In the red part of the spectrum, for example, the Ca ii IR triplet was seen in pure absorption in the early peak, but shows strong emission with a P Cygni profile in the EC2 echo. Similarly, the [Ca ii] 7291,7324 doublet was absent in the earlier peak (Rest et al., 2012), but is strongly in emission in all epochs of EC2. Prieto et al. (2014) presented a time series of spectra of the EC1 echo. As that echo faded from peak over the subsequent 1-2 yr, it showed a gradual change from absorption to emission in the [Ca ii] doublet and the Ca ii IR triplet, with an end state somewhat similar to that seen in EC2. A key difference, though, is that this occurred as the continuum faded significantly, unlike EC2. Moreover, this change from absorption to emission in the Ca lines was accompanied by the appearance of strong molecular absorption bands of CN and a further drop in effective temperature to 4000-4500 K (Prieto et al., 2014). These properties are definitely not seen in EC2 during the time of our observations. Whereas the changes seen in the EC1 echo may have been due to a shell ejection with a rapid drop in optical depth and a cooling of the shell, the EC2 echo appears to trace a significantly different physical scenario.
All epochs of EC2 spectra show narrow emission of He i 5876, 6678, and 7065 that remains after background subtraction. This is interesting, because He i emission requires relatively high ionization and should not be seen from a 6,000 K atmosphere. The 2-D spectra in Figures 5, 6, and 7 show that the background H ii region emission from He i is cleanly subtracted from the echo spectra. However, some residual may remain from intrinsic He i emission that arises on the ionization front or photopevaporative flow associated with the globule itself, which is exposed to ionizing UV radiation from the O stars in the Carina Nebula. Indeed, some residual emission of [O iii] and [Ar iii] is also seen from the globule. It would be tempting to dismiss the residual He i as arising on the surface of the globule except for three facts.
First, the He i lines are slightly broader (150 km s-1) than the resolution limit of our 1200 lpm spectra with IMACS, and they show a subtle asymmetric profile shape, with a hint of a P Cygni profile. This can be seen in the He i 6678 emission in Figure 7, for example.
Second, the dereddened flux ratio of the He i lines 5876:6678:7065 in EC2 (roughly 2:1:0.5) is different from the same ratio in the Carina Nebula H ii region (roughly 3:1:0.75; Smith et al. 2004b), such that He i 6678 is relatively stronger than the other lines in the echo. Among the three lines, He i 6678 also has the clearest P Cyg profile.
Third, similar narrow He i emission was seen in spectra of UGC 2773-OT in its later phases dominated by CSM interaction (Smith et al., 2016a). The He i emission was much narrower (about 100 km s-1) than H and other lines (600-1000 km s-1), very much like the case here. In that extragalactic Car analog, there is no echo, and the He i emission is not due to H ii region contamination, because it is seen to change substantially in strength while the brightness of the transient remained roughly constant (i.e. the He i emission is absent at early times). In UGC 2773-OT, the He i emission is thought to arise in the pre-shock CSM, photoionized by X-rays from the shock front (Smith et al., 2016a), and this may be the case for some of the He i emission in Car’s echo as well.
We suspect that the narrow residual He i emission seen in spectra of EC2 is a mix of intrinsic narrow emission from Car and emission from the photoionized surface of the globule. It is difficult to confidently disentangle these two with available data, but it will be possible if a spectrum of EC2’s position can be obtained at late times after the echo has faded. This may take another decade, however.
In the dereddened low-resolution spectra, the flux ratio of the [Ca ii] doublet (F1 + F2) to the Ca ii IR triplet (XYZ), where their flux ratio is denoted as F1+F1 / XYZ in the standard nomenclature (Shine & Linsky, 1974), is 0.46 (varying by 20% in various spectra of EC2). This implies an electron density of cm-3 (Ferland & Persson, 1989). This density is higher than the density implied by the ratio of He i 5876/7065. These lines would be roughly equal in strength for densities of 109.5 cm-3, as seen in some SNe Ibn events (Matheson et al., 2000), so the He i lines must come from more distant and lower density ejecta, if they are intrinsic to Car.
Rest et al. (2012) noted that the spectrum of UGC 2773-OT from Smith et al. (2010b) was the closest match to the properties seen in the EC1 spectrum. This comparison is shown again in the top two spectra in Figure 8. That comparison was based on an early spectrum shortly after discovery of UGC 2773-OT (day 34 in Smith et al. 2010b), but the spectrum changed as UGC 2773-OT evolved over subsequent years. While maintaining a roughly constant continuum slope and fading very slowly, UGC 2773-OT’s spectrum morphed from a forest of narrow absorption lines to much stronger emission lines throughout the spectrum, including many Fe ii lines (Smith et al., 2016a). Later epochs of UGC 2773-OT are shown at the bottom of Figure 8 for comparison. It developed very strong and increasingly broad emission from H and Ca ii, and also showed increasing strength of narrow He i emission as noted above. Remarkably, echo spectra of Car show very similar changes from the early EC1 spectrum discussed by Rest et al. (2012) to the sequence of EC2 spectra in Figure 8, also occurring while the continuum luminosity faded only slightly. Although the Ca ii IR triplet in EC2 is not as strong as in UGC 2773-OT, the transition from absorption to emission with P Cyg profiles is qualitatively similar. As we discuss below (Section 3.4.4), the similarity to UGC 2773-OT also extends to the detailed behavior of line profile shapes. We discuss the overall similarity between Car and UGC 2773-OT later in Secion 4.2.
3.4.3 Broad H Wings
Perhaps the most surprising discovery in our study of the EC2 echo spectrum is the presence of extremely broad emission wings of the H line. To our knowledge, these are the fastest outflow velocities seen in any eruptive transient, reaching 10,000 km s-1 to the blue, and roughly 15,000 to 20,000 km s-1 on the red wing (the red wing is strongly affected by atmospheric B-band absorption). In our previous paper (Smith et al., 2018b) we demonstrated that when corrected for telluric absorption in the B-band, there is clear excess emission above the continuum in a red wing that extends to at least +20,000 km s-1.
The interpretation and significance of these broad wings is discussed in more depth in a separate paper (Smith et al., 2018b). Briefly, the high velocities are not an instrumental artifact and they are inconsistent with electron scattering wings. Because EC2 views Car from near the equator, these broad wings are also inconsistent with an origin in a fast bipolar jet that might arise from accretion onto companion star, if such a jet is invoked to explain the bipolar Homunculus (Soker, 2001; Kashi & Soker, 2009). Velocities of the broad wings are much faster than any expected escape velocity in the Car system. Combined with the presence of fast polar ejecta seen in the Outer Ejecta (Smith, 2008), the broad wings instead suggest the presence of a wide-angle explosive outflow during the Great Eruption. The broad wings are relatively faint, and may correspond to a small fraction of the total outflowing mass accelerated to high speeds. This is reminiscent of the high speeds seen in SN 2009ip in the precursor outbursts before its 2012 SN event (Smith et al., 2010b; Foley et al., 2011; Pastorello et al., 2013).
Here we detail the time dependence of this broad emission. Figure 9 shows a sequence of spectra similar to Figure 8, but zoomed-in on the region around H. This includes the EC1 echo spectrum of an early peak in the eruption (probably the 1838 or 1843 peak), discussed already (Rest et al., 2012; Prieto et al., 2014). The broad emission is not present or much weaker in the EC1 spectrum. The other spectra are the EC2 echo taken over several years, all of which show the broad wings at various strengths. The broad emission component appears to strengthen and then fade as time progresses, with a maximum in 2013-2015, corresponding roughly to the mid 1850s.
Figure 9 shows a composite Gaussian curve overplotted on the Gemini spectrum on 2014 Nov. This has two components: one with a FWHM of 14,000 km s-1 centered at 2,000 km s-1, and the other with FWHM of 12,000 km s-1 centered at 10,000 km s-1 (with about 40% of the strength of the main component). The total emission equivalent width of this broad emission is 190 Å. The same composite Gaussian is plotted against the 2012 spectrum with about 50% of the strength, and over the later 2016 spectrum with 70% of the strength (as compared to 2014/2015). If it did reach its peak strength in 2014/2015, it will be interesting to see if this broad component in the EC2 echo continues to fade or moves to slower velocities as time proceeds.

3.4.4 H Line Profiles (narrow component)
A majority of the H line flux is contained in the narrow component, and this is the emission that most directly traces the formation of the Homunculus with speeds of several 102 km s-1. In our spectroscopy of Car’s echoes (especially in the higher-resolution 1200 lpm grating spectra with IMACS and with MagE), the narrow component is resolved outside the regions of the spectrum that are heavily contaminated by nebular emission residuals. It shows growing strength and changes in line profile shape with time.
Figure 10 shows a time series of the H line profile seen in echoes, zooming in on the narrow component. We have blocked-out regions of the spectrum within 50 km s-1 of the narrow nebular lines of H and adjacent [N ii] emission, because these are heavily contaminated by subtraction residuals (or over subtraction) of the narrow nebular emission that is much brighter than the echo. The most interesting information about the echo light is therefore the region in between H and the [N ii] lines. Most of the spectra in Figure 10 show the evolution of the EC2 echo, but for comparison, we also include the EC1 spectrum of an early peak in the light curve (presumably 1838 or 1843) from Rest et al. (2012), and also a few spectra of the extragalactic Car analog UGC 2773-OT (plotted in blue), from Smith et al. (2016a). (UGC 2773-OT is not affected by a light echo, so we do not block the narrow emission in this spectrum.)
There are a few notable changes to the narrow H line that occur with time. First, the line gets much stronger and broader with time, moving from the 1840s through the 1850s plateau phase. Second, the line profile changes from being fairly narrow and symmetric to being broad and asymmetric, with a prominent blue bump, a more subtle red bump, and a central partially resolved component becoming more clear at late times. At early phases, the narrow component has a width of only about 200-250 km s-1 and does not show clear P Cygni absorption. At later times, the line emission spreads to around 1000 km s-1 with clear blueshifted absorption. It is interesting that the changes to a broader profile and the appearance of strong asymmetry in the line profile shape occur over a time period when the very broad wings grow in strength. These may be related, as discussed later.
Examining Figure 10, it may be clear why we have included the comparison to the spectral evolution of UGC 2773-OT. The changes in the H line strength and profile shape are almost identical in these two objects. The similarity is uncanny; a minor difference is that the blue bump and blueshifted absorption, as well as the wings of the line (the wings of the narrow component, at least), are at somewhat higher speeds in UGC 2773-OT. This may, of course, be attributed to a viewing angle effect. This further emphasizes the similarity of these two objects (Smith et al., 2016a), perhaps suggesting that we can use the observed properties of UGC 2773-OT to fill in some of the remaining gaps in Car.
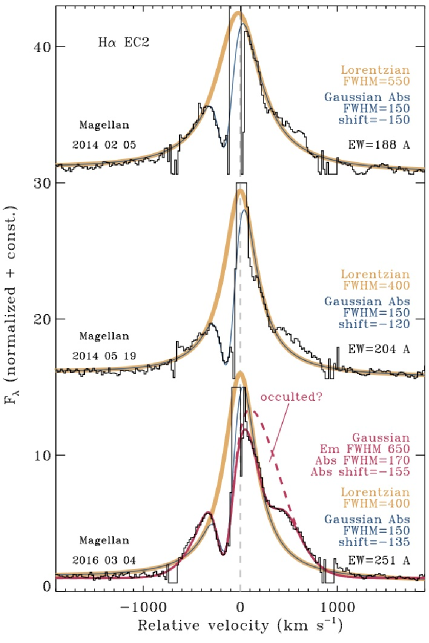
At early phases, when no P Cygni absorption is seen, the line profile can be approximated within the noise with either a symmetric Lorentzian or multiple Gaussians. The emission gets broader with time, suggesting outflow speeds increasing from 200 km s-1 at the earliest times (Rest et al., 2012; Prieto et al., 2014), to about 500 km s-1 in 2013/2014. After 2013/2014, P Cygni absorption strengthens and the emission components become asymmetric. Figure 11 shows some examples of simple fits to the line shape of the narrow H component in EC2. As the P Cygni absorption appears (first seen clearly in our high-resolution spectrum in 2014 Feb; Figure 11, top), the line profile can be matched fairly well by a symmetric Lorentzian with a width of 550 km s-1 (shown in orange) and a blueshifted Gaussian absorption at 150 km s-1 (the total of Gaussian absorption subtracted from the Lorentzian emission shown in blue). Interestingly, this 550 km s-1 Lorentzian emission is identical in strength and width to the H line in early spectra of SN 2009ip (see Smith et al. 2010b; their Figure 10), although that object did not show the narrow 150 km s-1 absorption (which, again, could potentially be a viewing angle effect).
Over the subsequent couple of years, however, a symmetric Lorentzian becomes a poorer description of the emission-line shape. In the 2014 May spectrum (Figure 11, middle), the observed electron scattering wings at 1000 km s-1 become weaker than the Lorentzian profile, there is a deficit of flux in the narrow component at 100 km s-1, and there is a red bump of excess emission at 300 to 900 km s-1 compared to the Lorentzian. The narrow absorption is similar, however, with only a slight change in velocity.
By the third epoch of 2016 March (Figure 11, bottom), a Lorentzian is a clearly inadequate approximation of the line shape. The faint blue wing is gone, and the red emission excess is even stronger. A better description of the line shape is a Gaussian with FWHM of 650 km s-1, which has its centroid shifted 170 km s-1 to the red, and with a similar 155 km s-1 P Cygni absorption component as before. Even this, however, overestimates the red side of the center of the line (dashed magenta curve). Could this be redshifted gas at low velocities that is occulted by the expanding photosphere? We can account for the missing flux by subtracting another Gaussian with FWHM 250 km s-1 centered at 260 km s-1 (solid magenta curve). Or, on the other hand, is this indicative of a very asymmetric or bipolar outflow that is better matched by simply adding several Gaussian emission components? The latter appears to be the case in UGC 2773-OT (Smith et al., 2016a). Clearly there is justification for assuming a bipolar outflow in the case of Car. The point here is that a symmetric emission component becomes an increasingly poor description of the line shape; this is a case where detailed radiative transfer models may lead to a better understanding of the origin of the line profile (Dessart et al., 2015).
This change in the emission profile shape from a Lorentzian to a Gaussian (or asymmetric multi-component Gaussian), is physically significant, and reminiscent of changes seen commonly in SNe IIn (Smith et al., 2008). In the case of SNe IIn, the interpretation is that the change corresponds to two different stages in the course of CSM interaction. At early times, the shock is buried inside dense CSM, so X-rays and far-UV radiation from the shock propagate ahead to make a photoionized precursor in the slow pre-shock CSM. The resulting narrow H line photons must scatter out through high optical depths in the wind, producing strong electron scattering wings and a symmetric Lorentzian shape. At later times, as the shock marches outward and begins to emerge from the CSM, reaching outer radii with lower optical depths, line photons from the accelerated post-shock gas can escape directly, so the Lorentzian wings fade and intermediate-width Gaussian line shapes (sometimes highly asymmetric) emerge. The similar behavior in line profiles from Car’s echoes are probably telling us that a similar CSM interaction scenario is important (Smith, 2013). This is discussed below.
The fits to the line shape allow a way to quantify the increasing H strength (since measuring it directly from the data requires one to interpolate over the residuals from imperfect H ii region subtraction). The equivalent width (EW) of narrow component fits is about 200 Å (Figure 11), but increasing with time through epochs corresponding to the mid 1850s (this EW value is relative to the true underlying continuum, not to the adjacent apparent continuum level, which is actually the very broad emission in H; see Figure 9). Interestingly, an EW of about 200 Å (emission EW is positive here) is very similar to SN2009ip during its precursor event in 2009, and also similar to the H EW in the main 2012b peak powered by CSM interaction. In fact, this EW is similar to most SNe IIn shortly after peak luminosity (see Figure 7 in Smith, Mauerhan, & Prieto 2014).

3.4.5 Other Lines
The Ca ii IR triplet is seen in emission at all epochs in the EC2 echo at low resolution (Figure 8), and we also obtained a few epochs of higher resolution spectra with MagE and IMACS, shown in Figure 12. These lines provide important tracers of the outflow. The IR triplet was present in the echo spectra of an early peak, but was seen in pure absorption blueshifted by 200 km s-1 (Rest et al., 2012), consistent with the narrower H emission at this epoch, and similar to the P Cygni absorption seen at later epochs. This early EC1 spectrum is shown in Figure 12. As that echo from an early peak faded over the next 1-2 years, the IR triplet changed into emission with weak P Cygni absorption (moving to somewhat slower velocities), and then to pure emission (Prieto et al., 2014). In the EC2 echo, the Ca ii IR triplet shows a somewhat different behavior, first becoming stronger with time in pure emission and a broader profile, and then continuing to strengthen and broaden in its emission, while also developing strong P Cygni absorption (Figure 12). By the latest spectrum (corresponding to the mid-1850s), the Ca ii IR triplet lines show pronounced blueshifted absorption, with a slow component at around 150 to 200 km s-1 as before, but also showing absorption out to 650 km s-1 (Figure 12).
Unfortunately, the [Ca ii] 7291,7324 doublet was not included in the wavelength range of our higher resolution 1200 lpm spectra with IMACS. We did trace these [Ca ii] lines with MagE at moderate resolution at early epochs. Although noisy, the lines have a resolved width of about 500 km/s, similar to the Ca ii IR triplet. On average, the two lines have roughly equal intensity within the signal to noise. The spectra do not have sufficient signal to noise to determine if the [Ca ii] 7291,7324 doublet shows the interesting slanted asymmetric profile shapes that are seen in later stages of UGC 2773-OT (Smith et al., 2016a).
The Na i D doublet provides a sensitive tracer of absorption along the line of sight. Its evolution is less clear, however, because our echo spectra generally have lower signal to noise at shorter wavelengths. At early epochs in the EC1 echo of the 1843 peak and even in early spectra of EC2, the Na i line is only weakly in absorption and narrow if present at all in the echo light (Galactic absorption and residuals from subtraction of sky emission make it unclear). At later epochs, however, the Na i feature becomes much stronger, showing a P Cygni profile with saturated absorption out to 650 km s-1, and a moderately strong broad emission component (Figure 12). This can also be seen clearly in the 2-D spectrum in Figure 6. (Note that Na i D is a doublet; Figure 12 is plotted as a function of velocity for the 5889 line, and so some of that line’s emission near zero velocity is absorbed by the P Cygni trough of the 5896 line. The difference in velocity between the two lines is about 350 km s-1.) In any case, this shows clear evidence for a dense outflow of 650 km s-1 along the line of sight in the equator. This is interesting, since material in the pinched waist of the equator of the Homunculus is moving much more slowly as seen today (Smith, 2006a). Some features in the Outer Ejecta in the equator are moving faster along the path seen by EC2. Perhaps the Na i D absorption is tracing this outer material in the so-called “S Condensation”, or perhaps this fast material seen in the mid-1850s has yet to be decelerated.
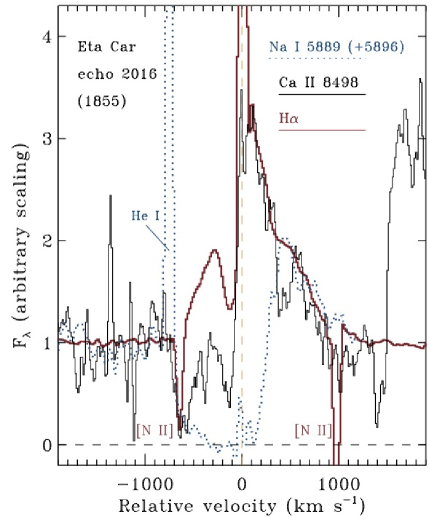
Figure 13 shows a comparison between the line profiles of H, Ca ii 8498, and Na i D. The three lines have been scaled arbitrarily to compare the line shape (i.e. they are not normalized the same way). The emission components on the red side of the line are basically the same for H and Ca ii (and also Na i where it is not absorbed by the other line in the doublet). The blue side of each line differs markedly. Whereas Na i D shows basically saturated absorption all the way out to 650 km s-1, H shows emission out to the same velocity and only shows a relatively narrow absorption notch at 150 km s-1. Ca ii is in between with absorption at 650 and 150 km s-1 that is filled-in with extra emission between those two components. This comparison points to simultaneous multiple velocities along the same line of sight near the equator. Strong absorption at 150 km s-1 is present in all lines, perhaps suggesting that it originates at the outermost radii. Altogether, this adds weight to a view where fast material is expanding and crashing into slower material at larger radii along the same direction. We will return to such implications in the discussion below.
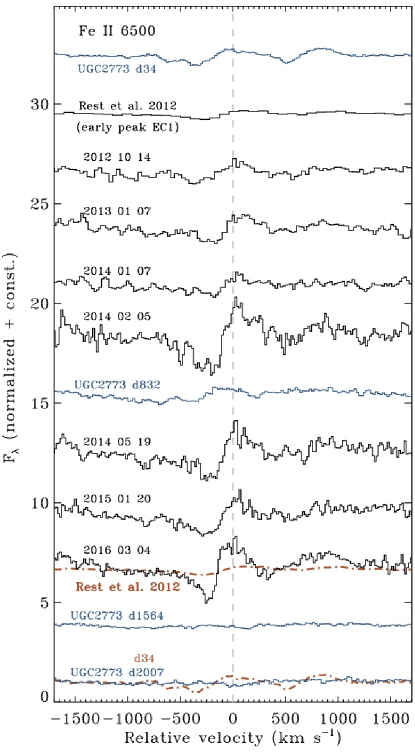
Finally, the echo spectra show a number of weaker lines in the spectrum that exhibit increasing emission strength and P Cygni profiles at later epochs (Figure 8). Many of these are Fe ii lines typical of warm supergiant LBV winds. One line that is fairly bright and exhibits this typical behavior is at 6500 Å, which can be seen clearly in the 2D spectra in Figures 5, 6, and 7. This line at 6500 Å is also seen in the present-day spectrum of Car’s wind (Hillier et al., 2001), although interestingly, it is weak and has no secure identification. Hillier et al. (2001) suggest that it may be an Fe ii line, and we proceed with the same assumption here. Figure 14 shows the time evolution of this line, which changes from a very weak line (if present at all) in the EC1 echo, to having a clear and strengthening P Cygni profile. The absorption trough indicates outflow speeds around 250 km s-1, which is in between the slow absorption at 150 km s-1 seen in H and the Ca ii IR triplet, and the faster absorption at 650 km s-1 in the Ca ii triplet and Na i. This is the same range of blueshifted velocities where H and Ca ii are in emission, but Na i is fully in absorption. Interestingly, this line appears to be absent or weak in all epochs of spectra for UGC 2773-OT (Figure 14). While the line is present but weak from Car in the central star’s spectrum today, it is much stronger in the spectrum of HDE 316285, which is otherwise similar to the spectrum of Car (Hillier et al., 2001). Without a secure ID for the carrier of this line, it is difficult to draw significance from this intriguing trend.

4 DISCUSSION
4.1 Overview
A key result from the observed spectral evolution of the EC2 echo combined with Carinae’s other light echoes is that the basic character of the spectrum changes considerably during the decade-long 19th century eruption. These changes are indicative of a line of sight that views Carinae’s Great Eruption from a vantage point at low latitudes near the equator, and might not be indicative of all viewing angles.
While there are a number of complicated changes that occur (including rapid changes during fading from bright peaks), the underlying evolution is gradual and can be summarized as basically a 2 stage event: 1) A preperatory wind phase in the lead up to the Great Eruption during the early 1840s (and perhaps for decades before that), which may be strongly influenced by binary interaction, and 2) an explosive event with fast outflow speeds and sustained high luminosity. These two stages are annotated in Figure 15.
Stage 1 (1845 and preceding decade or two): This initial phase has slower outflow velocity (150200 km s-1) in the equator, and the overall appearance of the spectrum is dominated by narrow absorption lines with little or no emission at luminosity peaks, except perhaps narrow H wind emission that may be contaminted by unresolved nebular emission (Rest et al., 2012). It has somewhat cooler apparent temperatures of 50005500 K near peaks (Rest et al., 2012), and cooler temperatures of 4,000 K and evidence of molecule formation in the fading after peaks (Prieto et al., 2014), with increasing emission-line strength as it fades. From this viewing direction, the bulk of outflowing material (traced by the absorption trough) is moving at about 200 km s-1 at times that likely correspond to the 1830s to the early 1840s (although there may be some faster material at lower density indicated by the absorption line wings extending out to several hundred km s-1). There may be faster material at other latitudes as well.
Stage 2 (late 1840s - 1850s plateau): While the overall continuum shape is similar to earlier phases (a slight increase in the apparent temperature to 6000 K), there are distinct changes in line properties that trace the outflowing material. The 1850s plateau as viewed in EC2 spectra developes broader line widths and increasing emission strength in the narrow components indicating an increase in the bulk outflow speed to 600 km s-1, which is much faster than the 50200 km s-1 speed of the Homunculus at low latitudes near the equator (Smith, 2006a). This time period also shows much stronger emission lines in general, a decrease of line blanketing absorption strength at shorter wavelengths, P Cygni profiles instead of pure emission in many lines, and signs of higher excitation (including possible He i emission). Most remarkably, epochs corresponding to the mid-1850s show the appearance and strengthening of very broad emission wings from 10,000 to 20,000 km s-1. Narrow absorption components at 150 km s-1 persist from Stage 1, suggesting that this is slower, previously ejected material along the line of sight at a somewhat larger radius. A key point is that at least three very different expansion speeds are seen simultaneously in Stage 2.
A major implication for the nature of Car’s eruption is that the observed changes show that a steady state wind is clearly not a good approximation. The bulk outflow speed increases dramatically over a time period of a few years, and the fastest material in Stage 2 is two orders of magnitude faster than in Stage 1 (and far exceeds the escape speed). Line strengths increase while the apparent continuum temperature and luminosity stay relatively constant; this probably signifies an increase in density and strong departures from LTE that may be indicative of shock excitation.
The increasing velocity along the same line of sight also has important physical implications. It requires that fast ejecta follows after much slower material in the same direction, making it inevitable that fast material will catch slow material and will collide in a strong shock. The fact that the outflow speed changes with time (increasing from slow to fast) is therefore direct evidence supporting earlier claims, based on multiple lines of circumstantial evidence, of a strong CSM interaction component that helps power the visible luminosity of the event (Smith, 2013, 2008; Smith et al., 2003b).
Another interesting outcome, noted in Figure 15, is that the ejection date of the Homunculus from its measured kinematic age is solidly in between Stage 1 and Stage 2. From a recent study of available archival HST imaging over more than a decade, the proper motion expansion of the Homunculus gives a fairly precise date of origin for the Homunculus (extrapolating from linear motion observed today) of 1847.1 0.8 yr (Smith, 2017). Of course, if there was strong CSM interaction that accelerated slow pre-shock material and decelerated the fast ejecta, as in a Type IIn supernova, the true ejection date might be slightly different (most likely a short time after this). Alternatively, if the material was ejected over a longer period (for example, a more gradually increasing ouflow speed over many years as opposed to an instantaneous pulse), then this is a mass-weighted average ejection date. In any case, it is remarkable that the Homunculus date of origin lies in between the slow material and fast material seen in our echo spectra. This strongly supports a picture wherein fast ejecta swept up and shocked slower material, making a radiative shock that cooled rapidly to form the thin walls of the Homunculus (Smith, 2013). We consider the physical interpretation of the 2 Stage event in more detail below.
4.2 Comparison with UGC 2773-OT
The relatively nearby LBV-like transient in the dwarf galaxy UGC 2773, named UGC 2773-OT (Smith et al., 2010b; Foley et al., 2011; Smith et al., 2016a), has been compared with Car’s Great Eruption before. Rest et al. (2012) showed that early spectra of UGC 2773-OT at peak luminosity (soon after discovery) were quite similar to light echo spectra of Car that correspond to early peaks in the Great Eruption light curve (EC1). Smith et al. (2016a) showed that after several years had passed, UGC 2773-OT faded very slowly, sustaining a high luminosity for a decade, very similar to the slow light curve evolution of Car during its 1850s plateau.
Smith et al. (2016a) presented a series of spectra of UGC 2773-OT that document its spectral evolution over several years. Light echo spectroscopy of EC2 spanning several years now allows us to extend the comparison. The evolution of EC2 spectra shows remarkable similarity to the spectral evolution of UGC 2773-OT, further supporting the case that they are close analogs. As seen in Figures 8 and 10 (a more densely sampled series of UGC 2773-OT spectra can be seen in Smith et al. 2016a), the evolution of the overall low-resolution spectrum and of velocities and excitation is very similar between the two objects. They have similar continuum temperatures, both increasing a small amount as they evolve. They show many of the same lines, which show mostly narrow absorption at early times, transitioning into stronger emission at later times. Both show narrow emission from [Ca ii] 7291,7324, which is seen in a subset of SN impostors. Similarities in H are particularly remarkable: In both Car and UGC 2773-OT, the H emission line profile starts out as a weak and narrow P Cygni profile but then gets stronger and broader (from around 100-200 km s-1 initially up to 600-1000 km s-1 at later times), with a very similar asymmetric emission line profile (Figure 10).
The spectral similarity is interesting because these two also have similar light curves. If they are close analogs, perhaps UGC 2773-OT can help us fill-in gaps in our knowledge due to limitations of light echo spectra. The most significant limitations of the echo spectra are relatively low signal to noise because they are faint, a lack of access to other wavelengths, and contamination from narrow nebular line emission from the Carina Nebula. Data for UGC 2773-OT do not present the same limitations.
For example, from light echo spectoscopy alone, it is ambiguous if the residual narrow He i emission (Figure 7) comes from Car itself, or if it is narrow nebular He i emission arising on the globule’s surface that is exposed to radiation from O-type stars in the Carina Nebula. The He i 6678 line shows an asymmetric and possibly P Cygni profile, but it is narrow and weak, so this profile could potentially arise from background subtraction. It is therefore extremely interesting that UGC 2773-OT shows very similar narrow He i emission, which is absent at first and then grows with time while the eruption has almost constant luminosity and temperature (it is not H ii region contamination). In UGC 2773-OT, the He i emission is also much narrower than the H line, qualitatively very similar to Car. In the case of UGC 2773-OT, the narrow He i must be intrinsic to the object, arising from slow pre-shock gas that is photoionized by a shock (it must be a shock, since radiative excitation from a 6000 K photosphere would not produce strong He i emission). This gives a possible indication that the narrow He i emission in Car arises in a similar fashion.
The very strong contamination from H in the Carina Nebula (intrinsically narrow and unresolved in our spectra) makes it impossible to say anything conclusive about narrow H emission in echoes, and hence about narrow H emission from pre-shock gas in the eruption. UGC 2773-OT does not have the same ambiguity, and narrow emission is present. Some of this arises from a surrounding H ii region, but high-resolution echelle spectra show resolved widths of 50 km s-1, indicating that expanding CSM is partly responsible for this narrow emission (Smith et al., 2010b). Perhaps UGC 2773-OT hosts extended expanding nebulosity, similar to the Outer Ejecta of Car (Kiminki et al., 2016; Mehner et al., 2016).
The light echoes of Car are faint and require a significant allocation of time on large telescopes in the southern hemisphere; for practical reasons, this has limited our cadence to roughly 1–2 observations per year. Moreover, different echoes trace different epochs in the Great Erupton, adding uncertainty to the exact time evolution. The time sampling of spectra for UGC 2773-OT is better and more clearly understood. UGC 2773-OT exhibits a quite gradual transition over a few years from Stage 1 to Stage 2. This is an important clue; the changes in the spectrum (notably the presence of broader and stronger emission lines) was not a sudden change on a dynamical timescale, but rather, the transition happened gradually. Either the star is changing slowly, or optical depth effects govern the slow emergence of radiation from faster material deeper in the expanding envelope.
A limitation of the light echo spectra is that they become very noisy in the blue part of the spectrum, due to a combination of ISM reddening and detector/grating efficiency. This makes it difficult to study the spectrum at blue wavelengths, while the UV range of the spectrum is not available to us. The extreme faintness of the echoes combined with bright background emission from the surrounding star-forming region make it difficult to study the echo spectra in the IR.
For all these similarites, though, UGC 2773-OT is not an identical twin of Car’s eruption. A few interesting differences between the spectral evolution of these two objects are:
1) UGC 2773-OT has no brief spikes in its light curve, which in Car have been attributed to periaston interactions as noted above. Evidently UGC 2773-OT did not experience these sorts of interactions with a wide companion, but suffered a similar decade-long outburst anyway. This provides another indirect suggestion that interactions with this wide companion were not critical in powering Car’s event.
2) UGC 2773-OT has no 6500 Å (presumably Fe ii) line exhibiting a P Cygni profile that develops at late times (Figure 14). The significance of this difference is unclear, since UGC 2773-OT does show other Fe ii lines with similar P Cyg profiles. Since this line is absent at some epochs for Car, but then appears at epochs when the broad emission is seen, this line deserves a closer look.
3) The Ca ii IR triplet lines grow in strength at late times much more than seen in Car’s echo spectra. This is probably an optical depth effect at late times, and it will be interesting to see how the echo spectra continue to develop.
4) UGC 2773-OT does not show the absurdly broad emission wings of H that are seen in Car. We do not yet know if this is a viewing angle effect, a timing issue (the broad lines appear late in Car’s spectra, and begin to fade after 1-2 yr), an optical depth effect, or a fundamental difference in shock ejection in the two events. Examining echoes that view Car from other latitudes will help clarify any angle dependence of the fast ejecta.
4.3 Transitioning between two stages of the eruption: Winds vs. Explosions
Continued monitoring of the spectral evolution of Car’s light echoes has demonstrated clearly that observed spectra from later in the eruption show fundamental differences compared to earlier spectra. Among the major differences are a faster bulk outflow speed, the appearance of extremely fast ejecta, stronger emission lines, and weaker absorption. This transition occurs well after the eruption was already underway, and coincides roughly with the ejection date imprinted on the expanding nebula as measured from its proper motion expansion (Fig. 15). This points to a dramatic change in the physical state of the star’s envelope after the peak of the eruption in 1845. A critical question for interpreting Car’s eruption is what caused this transition from Stage 1 to Stage 2. Before examining that, we first consider the basic transition of outflow properties in the two stages as deduced from available light echo spectra.
The simple fact that a major transition in physical state occured mid-way through the eruption is an important physical clue. This change clearly indicates that a single physical mechanism does not govern the mass loss throughout the whole eruption. For example, the traditional picture of the star increasing its luminosity above the Eddington limit and driving a strong wind cannot adequately explain both the precursor luminosity spikes (in 1838 and 1843) and also the long 1850s plateau, since these two phases clearly have fundamentally different outflow properties at roughly the same luminosity. Similarly, the observed transition occurring after a time when the eruption was already underway indicates that the origin of the eruption was not as simple as a single, instantaneous deposition of energy that blasted off the star’s envelope on a dynamical timescale in 1847. Instead, there was a long preparation phase (years to decades) leading up to the peak of the eruption, perhaps due to a building instability inside the envelope, or perhaps due to increasing intensity of binary interaction as the orbital parameters changed before a merger (see below). We must therefore seek a physical explanation for the eruption that naturally accounts for both of these observed phases and the transition from one physical regime to the next in the correct order.
Regardless of the underlying physical trigger of the eruption, the plain fact that slow outflow velocities observed at earlier epochs were followed by faster outflow velocities at later epochs along the same direction (i.e., echoes probing essentially the same line of sight) necessarily requires that CSM interaction play an important role in the event. Fast material must overtake the slower previously ejected material and shock. In doing so, some kinetic energy of the fast material is thermalized and converted to luminosity.
4.3.1 Stage 2 as an explosion
The observed spectra in Stage 2 show at least three different outflow speeds simultaneously (slow 200 km s-1; intermediate 500-1000 km s-1; and very fast 10,000-20,000 km s-1). This fact is not easily explained by a steady wind. It is, however, a commonly observed trait of standard SNe IIn powered by an explosion crashing into dense CSM. Thus, the two-stage empirical description of the eruption from light echoes outlined above is remarkably compatible with the CSM interaction scenario proposed earlier by Smith (2013). This model envisioned Stage 1 as a relatively slow (200 km s-1) super Eddington wind, which is quite similar to the value observed in light echoes (note that the absorption speed in light echoes is seen from the equator; outflow speeds are probably higher at other latitudes, and some of this could cause the more extended absorption wings). This was followed in Stage 2 by an explosive energy injection of roughly 1050 erg, and Smith (2013) showed that the ensuing CSM interaction luminosity could in principle account for the 1850s plateau in the historical light curve of the Great Eruption. The changes seen in light echo spectra therefore provide direct confirmation of a CSM interaction model like that of Smith (2013).
As noted by Smith (2013), these numbers are somewhat malleable, though, and can be adjusted depending on the desired level of complexity. The Homunculus nebula of course dictates that there must be a range of speeds and densities at various latitudes (Smith, 2006a), while the Smith (2013) model was a simple 1-D estimate. Even in 1-D, one can adjust the time dependence of physical parameters to achieve a similar end result that fits the light curve. In particular, different choices for the relative amount of mass and speeds of the outflows in Stage 1 and Stage 2 can lead to similar CSM interaction luminosities. Light echoes combined with observations of the present-day nebulosity help constrain possible values. For example, light echoes provide strong evidence that the outflow speed in Stage 1 was indeed roughly 150 km s-1. A signifficant difference compared to the values adopted by Smith (2013), however, is that the speed of the fast material appears to be even higher than assumed. In a CSM interaction scenario, the dominant observed outflow speed of 600 km s-1 arises from the cold dense shell, where fast ejecta and shocked CSM pile up in a thin cooled layer. This also corresponds well to the final coasting velocity of the Homunculus nebula (Smith, 2006a). The very high speeds seen in light echoes give more freedom in this type of model, since we don’t know a priori what fraction of the Stage 2 mass loss is contained in the fastest outflowing material. If Stage 2 is characterized by outflow speeds of 10,000 - 20,000 km s-1, then it is easy to have a situation where most of the mass is ejected at slow speeds in Stage 1, while most of the kinetic energy and momentum is supplied by a fast wind with much lower mass-loss rate.
The maximum mass in the fastest ejecta can be derived by assuming that most of the mass is supplied in the slow Stage 1 wind, whereas the fast ejecta in Stage 2 provide essentially all the kinetic energy that powered the event. Under this limiting assumption, the total mass contained in the fastest ejecta can be expressed as
where is the total energy of the event in units of 1050 erg, and is the speed of the fast ejecta or wind in units of 104 km s-1. This is similar to but slightly smaller than the mass of the extremely fast Outer Ejecta estimated by Smith (2008). Thus, the fast material seen in the broad wings in light echoes must represent a small fraction of the total mass budget of the Great Eruption, unless the total energy of the event is much higher than generally believed. The radiated energy inferred from the historical light curve (with zero bolometric correction) is only about 21049 erg (Smith et al., 2011), the kinetic energy of the Homunculus is almost 1050 erg (Smith et al., 2003b), and the fast Outer Ejecta (Smith, 2008) are thought to contain a similar amount of kinetic energy as the Homunculus. Significantly increasing the total energy would require either hotter temperatures (and hence, a larger bolometric correction) during the event, which seems incompatible with the relatively cool apparent temperatures seen in light echoes (Rest et al., 2012; Prieto et al., 2014), or instead, a much larger amount of invisible mass in the fast ejecta outside the Homunculus.
There must be some additional mass ejected in Stage 2 at lower speeds, however, in order to account for the final momentum of the Homunculus. For example, with 10 ejected in the slow Stage 1 wind at 150 km s-1 and only 0.1 M⊙ ejected in Stage 2 at 104 km s-1, the final coasting speed of the Homunculus would only be 250 km s-1. In any case, the significant changes seen in light echoes are highly constraining for any model of the event. While Stage 1 can be explained quite well with existing models of a quasi-steady, continuum-driven super-Eddington wind (Owocki et al., 2004; van Marle et al., 2008, 2009; Owocki & Shaviv, 2016), the transition to Stage 2 requires time-dependent energy input well beyond this.
4.3.2 Stage 2 as a time-dependent wind
Rather than a slow wind followed by a single hydrodynamic explosion, as in a Type IIn supernova, the observed properties of the Great Eruption might be accounted for with a more complicated, time-dependent wind with slow outflow transitioning to a faster wind. This has been predicted in models that include super-Eddington energy deposition below the surface of a massive star (Quataert et al., 2016). In this sort of model, the observed differences between an explosion and a wind become less obvious. Much of the radiated energy arises from internal shocks in the wind, and the photosphere can reside in the compressed post-shock zone itself (Quataert et al., 2016; Owocki et al., 2017), which is qualitatively similar to the prediction of the explosion plus CSM interaction model. If one envisions a fast wind rather than a hydrodynamic explosion, then light echoes require that the fast wind must be able to achieve extremely high speeds of 104 km s-1 and a mass-loss rate (spread over the 3-4 year duration of the broad wings seen in light echo spectra) of M⊙ yr-1. The corresponding mechanical luminosity of such a wind is at least 2108 L⊙, or about =40.
4.3.3 Grey area
The central question of whether Stage 2 is better described as a wind or an explosion ventures into muddy waters. Limiting cases of these two are well defined. An explosion will result if energy deposition occurs faster than the dynamical timescale with a total energy well exceeding the gravitational binding energy of layers above. A strong wind will result when energy is carried efficiently through the star’s envelope by convection, and photon diffusion at the surface can power a steady radiatively driven wind.
Observational estimates, however, clearly place the Great Eruption of Car precariously between these two extremes. This is in an interesting regime similar to that discussed by Ro & Matzner (2017), where the energy that eventually emerges from the star’s surface as kinetic energy or radiation must be transported through the envelope by acoustic waves that steepen to shocks, and may dissipate their energy in the outer envelope (see also Piro, 2011). Light echoes paint a picture where Car was relatively stable at first, but then underwent a transition past some critical point where the outflow changed dramatically. One can imagine a physical scenario where the rate of energy deposition grows with time to exceed a critical limit, or where there is a sudden change in the deposition rate or depth in the envelope.
Regardless of specific mechanism, it is tempting to ascribe the two stages to (1) an early phase that is trans-Eddington, where radiative damping or weak shock dissipation is sufficient to inhibit strong shock formation, depositing energy in the outer envelope at a rate that can can be carried away by radiation, thus driving a strong super-Eddington wind, and (2) later phases that exceed the critical wave luminosity, where radiative damping and shock dissipation are no longer able to suppress strong shock formation, and shocks grow in strength, removing mass from the surface of the star hydrodynamically. Thus, Car is probably an object where we have directly witnessed the transition from a quasi-steady wind to explosive mass loss. This motivates continued theoretical investigation of time-dependent energy deposition in massive star envelopes, in order to ultimately reconcile the observed physical parameters with the central engine that caused the outburst.
The energy deposition required in this picture could in principle arise from one of multiple possible physical causes, including: inspiral of a companion during a stellar merger, runaway instability in shell burning, wave driving, or the pulsational pair instability (Quataert & Shiode, 2012; Shiode & Quataert, 2014; Smith & Arnett, 2014; Smith et al., 2011; Woosley, 2017). A number of observational facts (but perhaps most importantly the axisymmetry of the Homunculus nebula and the decade-long duration of the ramping-up of luminosity in Stage 1) suggest that a binary merger event is a plausible explanation for the Great Eruption, although not all the others are necessarily implausible. A general model for such a merger with CSM interaction is discussed in Section 4.6, followed in Section 4.7 by a discussion of details pertaining specifically to Car.
4.4 Origin of the Fast outflow?
The biggest surprise in our study of Car’s light echoes has been the discovery of extremely fast ejecta indicated by the broad H line wings extending from 10,000 to 20,000 km s-1. This is discussed more in a companion paper (Smith et al., 2018b), so the reader is referred to that paper for additional observational details. So far, no model proposed for Car or stellar mergers in general predicts such extreme outflow velocities that produce a SN-like blast wave.
A speed of 20,000 km s-1 is much faster than any escape speed envisioned in the Car system; it is even 10 times faster than the wind of a WR star. Super-Eddington winds that drive strong mass loss are generally expected to have relatively slow outflow speeds comparable to the escape speed at large radii where the wind originates (Owocki et al., 2004; Quataert et al., 2016; van Marle et al., 2008, 2009). Binary mass loss from L2 predicts relatively slow outflow speeds no more than several hundred km s-1, even at very high luminosities (Pejcha et al., 2016a). Bipolar jets driven by accretion onto a companion (Kashi & Soker, 2009) would be expected to be no more than a few times the surface escape speed of the accreting star, and one would not expect to see a fast outflow from bipolar jets in the equator (especially if those same bipolar jets are invoked to shape the Homunculus). Clearly, the fast speeds place important fundamental constraints on the nature of the event.
If the outflow traces a steady flow, the extremely high speed would imply an outflow from a massive compact object, such as a jet from an accreting neutron star or black hole. These are the only objects with such high escape speeds. The presence of such a companion in the 1850s might be reconciled with a lack of any such companion seen in data at the present epoch if the compact object is the thing that merged with a companion star in the Great Eruption, making the present-day primary star a Thorne-ytkow object (TO). This would open a direction of inquiry far beyond the scope of this paper, and would be a departure from current ideas about Car — but it is interesting to note that a TO might be consistent with reports of unusual lines seen in one particular equatorial region in the nebula that shows very strong emission from species such as Sr, Y, and Zr, plus Sc, Ti, V, Cr, Mn, Fe, Co, Ni, etc (Hartman et al., 2004; Bautista et al., 2006, 2009). This is the so-called “Strontium Filament” in the equatorial ejecta. A bipolar jet from a compact object is not, however, a very satisfying explanation for the origin of the fast material because of geometrical reasons. Namely, such a jet is expected to be highly collimated and bipolar, as in the case of SS 433 (Paragia et al., 1999). Yet, the light echo in which the very fast material is seen views Car from near the equator of the Homunculus. Such a jet could therefore have had little impact on shaping the bipolar Homunculus nebula (which has an orthogonal orientation), and we would need to invoke some other explanation for the very fast ejecta with speeds of 5,000 km s-1 in the polar regions of the Outer Ejecta seen at the present epoch (Smith, 2008).
Instead of relatively steady mechanisms including jets, the extremely fast ejecta seen in light echoes of Car more naturally point to a wide-angle explosive outflow driven by strong shock acceleration, which is not necessarily expected to be close to any escape speed in a system (providing that it exceeds the escape speed) because it is determined mainly by the energy in the shock and the density gradient where the shock acceleration occurs. What could be the origin of such a shock? Energy deposition deep in the stellar envelope, by whatever mechanism, will be transported outward by waves and will steepen to a shock if the energy deposition rate exceeds the steady stellar luminosity (Ro & Matzner, 2017). When such strong shocks exit the star, they will accelerate a small amount of mass to very high speeds. So then the question is shifted to what the source of this energy deposition would be.
One mechanism that can most likely be ruled out here is energy deposition by wave driving from core convection in late evolutionary phases (Quataert & Shiode, 2012; Shiode & Quataert, 2014; Quataert et al., 2016; Fuller, 2017). The reason it doesn’t work in the particular case of Car is because of timescales. While this is an efficient way to suddenly dump energy into the stellar envelope, it is only expected to be significant in the latest Ne and O core burning phases (Quataert & Shiode, 2012), which last just a couple years. It has been 170 years since the Homunculus was ejected, and Car has apparently not yet undergone core collapse.
A mechanism that is harder to rule out, and which may indeed be a plausible explanation, is sudden energy deposition via the pulsational pair instability (PPI). This is explored more in Section 4.5.
Another possibility is that the Great Eruption of Car was a stellar merger event, which is an attractive hypothesis for several reasons, as noted earlier and discussed further in Section 4.6. If the lead-up to the eruption corresponds to the inspiral and L2 mass loss phase, and the decades-long eruption is the common envelope ejection phase with CSM interaction, then what specifically launches a small fraction of the total mass to extremely high speeds while most of the mass is ejected at only 600 km s-1? How does a stellar merger eject material at speeds much faster than the escape velocity of either star? This is a central question for models of massive star mergers that remain unanswered.
One speculative possibility is that the energy deposition arises from unsteady nuclear burning as fresh fuel is mixed to deeper shell burning layers, leading to an outburst (Smith & Arnett, 2014). Explosive common envelope ejection was discussed in a very different scenario (merger of a post-He core burning star with a low-mass companion) by Podsiadlowski et al. (2010), but perhaps something similar might happen when the cores of the two stars merge, mixing unburned fuel into the core. Perhaps such a mechanism could lead to explosive energy deposition that travels outward through the star and steepens to a shock, mimicking a scenario like a PPI eruption. While it is still uncertain how this would work, observations seem to require that some violent process like this must be an ingredient of any merger model for Car in order to explain the extremely fast ejecta seen in light echoes.
An even more speculative origin for the fast ejecta involves an external mechanism. Namely, any binary merger model for the Great Eruption of Car must involve a hierarchical triple system, since a wide and eccentric binary remains today. The current companion on its eccentric orbit would have plunged into the bloated star or common envelope during the event (Smith, 2011), and perhaps that violent collision led to the ejection of a small amount of material to high speeds in certain directions. Whether this could provide enough energy to power the fast ejecta seen in light echoes is uncertain. This is discussed more in our companion paper on the fast ejecta (Smith et al., 2018b).
A related point has to do with the influence of the shock breaking out of the star. Broad emission lines in light echoes reveal that a small amount of material appears to have been accelerated to very high speeds by a shock. If a strong shock with 1050 ergs breaks out of the surface of the star or the outer boundary of the common envelope, it coud be accompanied by a UV flash from the shock breakout itself. It would be interesting to search for observational evidence of this in future data, either by high-ionization nebular lines in echo spectra, or in blue light curves of echoes — especially in echoes that view the eruption from polar directions that do not need to peer through dense equatorial CSM. One could also search for signals of a UV flash from shock breakout in extragralactic SN impostors.
Note, however, that the broad H wings that are seen in echo spectra probably do not arise from direct emission by the fast ejecta immediately after ejection, because in that case the high velocities would be seen for only an extremely brief window of time. It is more likely that the broad emission wings arise as the fastest freely expanding ejecta approach the reverse shock in CSM interaction, consistent with their more persistent appearance in Stage 2 of the eruption. This fast material will either be excited radiatively by inward propagating X-rays from the shock front, or collisionally as it crosses the reverse shock. This is commonly observed in late phases of CSM interaction in SNe IIn, and is the explanation for the very broad H wings still remaining in the spectrum of SN 1987A, more than a decade after explosion (Smith et al., 2005b; Heng et al., 2006).
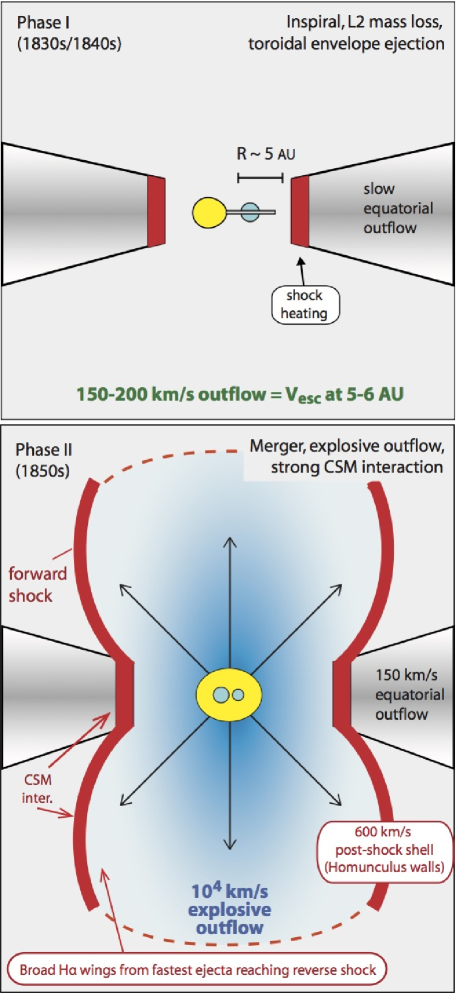
4.5 Pulsational Pair Instability Eruption
As noted in the previous section, one potential explanation for the energy deposition required to power the fast ejecta (and for the global energetics of the event) is a pulsational pair instability (PPI) eruption. Recently this has been discussed in detail – including applying it to the specific case of Carinae – by Woosley (2017). Very massive stars that approach the ends of their lives with He core masses above about 30 will encounter the pair instability during the latest nuclear burning phases (Fowler & Hoyle, 1964; Barkat et al., 1967; Rakavy & Shaviv, 1967). The core then implodes and triggers explosive burning, which may lead to a diverse range of outcomes. When the explosive burning exceeds the core binding energy, a terminal pair instability supernova (PISN) destroys the star (Bond et al., 1984; Heger & Woosley, 2002).
In the lower range of final He core masses (about 30-60 ), the energy depositon from explosive burning may not be energetic enough to completely unbind the star. Instead, a repeating cycle occurs where explosive burning expands the core, which cools, and eventually contracts again to reignite explosive burning. As a result, a series of repeated pulsations occur that cause severe eruptive mass loss before the star finally collapses to a black hole (Heger & Woosley, 2002; Woosley, 2017). The mass ejected, energy, and recurrence timescales for these eruptions are diverse. A comprehensive overview of PPI eruptions has recently been discussed by Woosley (2017). We will not repeat that discussion here, except to note some pros and cons of PPI eruptions as an explanation for Car, specifically informed by clues in our new light echo spectroscopy.
Pro: A key argument in favor of the PPI eruption mechanism to explain Car’s Great Eruption is that this is a well-established fundamental mechanism that is predicted to occur in very massive stars – even single massive stars. Indeed, Car is a very massive star whose likely initial mass, based on its current luminosity, is in the right ballpark to experience PPI eruptions (Woosley, 2017). Moreover, the total mass lost (Smith et al., 2003b), total kinetic plus radiated energy of the Great Eruption (Smith et al., 2003b; Smith, 2006a, 2008), shock driven mass loss and the presence of CSM interaction (Smith, 2013), and repeated eruptions over centuries (Kiminki et al., 2016), fall nicely within the range of expectations for PPI eruptions (Woosley, 2017). The usual assumption that the PPI and PISN are resticted to low metallicity (because line-driven winds reduce the star’s mass too much at ) may not be such a concern, since mass-loss rates adopted in most stellar evolution models are too high anyway (Smith, 2014), and since other effects such as rotational mixing or binary interaction can influence the mapping of initial mass to final He core mass (Chatzopoulos & Wheeler, 2012). Particularly well-matched to evidence from light echo spectrosopy and the nebulosity around Car is that the PPI eruptions may produce strong shocks with fast explosive outflows, giving a natural explanation for the broad wings we observe in light echo spectra (this work) and fast Outer Ejecta (Smith, 2008), but there may also be a wide range of outflow speeds. Moreover, the recurring nature of the PPI eruptions allows faster material to overtake previous eruptions and power a transient with strong CSM interaction (Woosley et al., 2007), as inferred for Car (Smith, 2013), and seems consistent with Car’s eruptive history (Kiminki et al., 2016).
Con: One potential objection arises because the PPI is generally expected, over most of the applicable initial mass range, to occur only within a few years before the star’s final collapse to a black hole (Woosley et al., 2007). Yet, it has been 170 yr since the Great Eruption and Car doesn’t seem to have collapsed to a black hole yet; moreover, Car appears to have suffered previous major eruptions 300-600 yr before the Great Eruption (Kiminki et al., 2016), so its delay between pulsations would need to be quite long. As noted by Woosley (2017), however, the expected outcomes of the PPI are diverse, and the delay between pulsations can in some cases be much longer – up to centuries or even millennia. These longer delays occur at the highest part of the initial mass range just below the threshold for true PISNe, where the PPI flashes are not energetic enough to fully unbind the massive core – but they almost do it, leading to very long recovery times as the expanded and cooled core undergoes Kelvin-Helmholtz contraction. Here we run into a potential snag, though, because applying these long PPI delays to Car may be problematic in two ways. (1) The longest delays occur for a fairly narrow range of mass at the highest masses (He core masses of roughly 60-64 for low metallicity models; Woosley 2017). This would make Car’s eruption an extremely rare event, which is in itself perhaps not a debilitating objection. However, the requirement that this long delay occurs for the highest part of the mass range exacerbates the difficulty mentioned above with reaching this end at roughly . Getting massive stars at into the lower end of the PPI range despite mass loss is difficult enough, but getting them to reach their end with the most massive He cores seems unlikely. (2) By necessity, the PPI flashes that are almost energetic enough to unbind the star, thereby achieving a long delay before the next pulse, also produce explosive events with high energy exceeding 1051 erg (Woosley, 2017). The kinetic plus radiative energy budget of Car’s 19th century Great Eruption can accomodate about 1050 erg (Smith et al., 2003b), but a total energy exceeding 1051 erg seems difficult to reconcile with observational estimates.
A different counterargument to the PPI for Carinae has to do with the properties of its nebula and companion star. First, the Homunculus nebula is highly bipolar in shape, with a tightly pinched waist. The PPI doesn’t give a clear explanation for this geometry. Instead, this suggests either a strong influence of shaping by interaction with a close companion star, or perhaps very rapid rotation (rapid rotation late in life despite already having suffered extreme mass loss may also require interaction with a companion). Moreover, previous major mass-loss events had a different geometry (Kiminki et al., 2016), which seems hard to reconcile with a single rapid rotator. Second, the PPI model gives no explanation for why Car’s current companion star is so unusual, with a highly eccentric wide orbit and having an extremely strong and fast wind. As discussed in the final section of this paper, these properties would seem to require violent binary interaction of some sort. (Although it adds complexity, there is no clear reason to rule out a PPI event occuring in a binary system.) However, it is worthwhile to ask if a binary or multiple system interaction could account for the Great Eruption on its own, even without a PPI event.
4.6 A generic model for eruptive transients: Binary merger with CSM interaction
The Car system, its surrounding nebula, its historical record, and light echoes represent one of the most observationally rich objects in massive star research. Any model for Car must face a daunting gauntlet of observational constraints. This may act to repel conservative theorists, or to prematurely quash potentially interesting models. To any proposed simple theory applied to Car, one can usually respond with “Yes, but what about… [insert obscure observational detail here]?” For now, we momentarily stow such objections in order to discuss a general scenario, and we will return to specific complexities of Car later in Section 4.7. The two stages of the event described above (in Section 4.3) arose from an empirical description of the spectral evolution and historical light curve, but we can also attempt to ascribe a physical cause to these observed changes. Here we discuss a promising physical model to account for the properties of Car’s Great Eruption: a massive star merger event.
A merger of two massive stars provides an attractive model for the trigger and the energy supply of the Great Eruption, and has been discussed before (see the Introduction). However, the merger model has never been reconciled with detailed observational constraints for Car, and there have been significant unanswered problems with a simple merger as proposed in previous models. Here we describe how a merger model may indeed be reconciled with many of the observed properties of the Great Eruption. The model described below differs from previously proposed merger models for Car in that it adopts the hypothesis that CSM interaction is a main engine for producing the observed radiative luminosity. This provides a self-consistent explanation for the two observed phases of the event and their properties. In a simplified scenario involving a binary merger, these two phases may be understood basically as:
Phase 1 (1840s and before): This is the inspiral phase with mass transfer and/or common envelope, when mass and angular momentum are shed from the L2 point, allowing the orbit to degrade and for the binary to eventually merge. This creates a relatively slow outflowing disk or torus (Fig. 16; top). In this phase, the mass shed in an equatorial spiral from L2 quickly catches and shock heats previous L2 mass loss as the spiral winds up. The shock heating of this torus may make a considerable contribution to the total luminosity, and gradually rises as the stars move closer together. A such, the “photosphere” in this phase may be a composite of the two stellar photospheres plus optically thick shock-heated material in the circumbinary disk. This inspiral phase and the associated luminosity has been discussed in detail for lower-mass stellar mergers (Pejcha et al., 2014, 2016a, 2016b).
Phase 2 (1850s plateau): Relatively sudden energy deposition from a final merger event (i.e. the merging of the two stellar cores inside the common envelope) steepens to a strong shock in the bloated envelope, and triggers an explosive outflow or very strong fast wind. As noted in previous sections, a large deposition of energy deep inside the star’s extended envelope is likely to steepen to a strong shock (Ro & Matzner, 2017), and we suppose that this is the driving mechanism of the fastest ejecta in Car. The fast ejecta from this explosive outflow or fast wind then overtake and shock the slower outflow from Phase 1 (Fig. 16; bottom). This sudden ejection will naturally lead to a sustained phase of high luminosity that could last for years, because the fast ejecta take time to expand through the previous mass loss as in a scaled-down version of a Type IIn supernova (Smith, 2013). This is the plateau phase of the Great Eruption, when Car was thought to have exceeded its own classical Eddington limit for about a decade. A key point, however, is that in the model proposed here, the observed “super-Eddington” light comes largely from CSM interaction (Smith, 2013), and not from stellar luminosity diffusing out through a bound stellar atmosphere as in super-Eddington wind models (Owocki et al., 2004, 2017; Owocki & Shaviv, 2016; Quataert et al., 2016).444Note, however, that the super-Eddington model discussed by Quataert et al. (2016) is somewhere in between, where much of the emergent radiation has been processed by internal shocks as the fast super-Eddington wind overtakes slower outflowing material upstream, similar to that described here. An interesting direction for future work on this model would be to determine if a super-Eddington wind with such internal shocks could achieve the extremely fast speeds observed in our light echo spectra. A few key attributes make a simple model like this plausible:
First, it is self consistent, in the sense that the initial inspiral during Phase I must shed mass and angular momentum in order for the orbit to degrade and for a merger to proceed, but in doing so, it also naturally provides the CSM required for the interaction that will occur in Phase II. We do not need to invoke a different mechanism or a previous outburst to provide the CSM into which the shock expands. Lost from the L2 point, this Phase I mass loss should be relatively slow and concentrated in the equator. CSM interaction where a fast outflow overtakes a slow and dense equatorially concetrated outflow (i.e. a torus) may naturally lead to a bipolar shape in the resulting nebula (Frank et al., 1995; Langer et al., 1999).
Second, CSM interaction is an extremely efficient engine for converting outflow kinetic energy into radiation. Whereas a recombination plateau may typically tap only 1% or less of the available kinetic energy, CSM interaction is much more efficient, typically converting 50% or more of the available kinetic energy into light. The conversion is most efficient when a fast and relatively low-mass explosion collides with slow and massive CSM. Thus, for a given explosion or eruption energy, transients with CSM interaction will be much more luminous than those where the radiation is powered by a recombining H envelope. This is a key way to get super-luminous SNe II from normal core-collapse energy (Smith & McCray, 2007), and it is what converts kinetic energy to radiation in PPI eruptions (Woosley, 2017). Similarly, it will allow events with modest kinetic energy to achieve substantial outburst luminosity. In any magnitude-limited sample of transients found in nearby galaxies, then, the ones powered by CSM interaction are likely to make a dominant contribution simply because they tend to be brighter than those without interaction for the same explosion energy.
Third, this two-phase merger scenario is qualitatively consistent with the time sequence of outflow velocities seen in light echo spectra of Car, which initially show a slow velocity of 150-200 km s-1. As time proceeds, extremely fast material appears, while simultaneously the “narrow” emission component broadens from 200 to about 600 km/s, as if it is being accelerated by a shock. Some slower velocities (150 km/s) are still seen in absorption along this line of sight, even at later times when the broad emission appears, requiring the simultaneous presence of slow moving CSM outside much faster ejecta. It would be difficult to avoid strong CSM interaction, based on this observational evidence alone. As noted by Smith (2013), the radiative shock that forms will lead to a very thin post-shock layer as in models of SNe IIn (van Marle et al., 2010; Chugai et al., 2004), which explains many attributes of the structure of the Homunculus around Car that are harder to explain with wind mass loss.
While the Car system has additional complexities that will be discussed below, this basic sort of merger plus CSM interaction model may be widely applicable to other non-terminal transients. Smith (2013) proposed that CSM interaction may be responsible for a wide range of non-terminal transients besides Car, including other LBV giant eruptions, SN impostors, SN 2008S-like events, pre-SN eruptions, infrared transients, so-called luminous red novae, or other events. All these objects have quite similar spectra at peak resembling SNe IIn, although they exhibit a wide range of outflow speed and luminosity (Adams et al., 2016; Kochanek, 2011; Prieto et al., 2009; Smith et al., 2011). A similar model with CSM interaction was applied recently to luminous red novae like V1309 Sco as well (Metzger & Pejcha, 2017).
In this physical scenario, Car’s Great Eruption can be seen as one of the most energetic examples of stellar merger events that span a wide range of initial masses for massive stars, extending to similar transients that have been associated with mergers from low-mass stars. These include clear mergers like the spectacular example of V1309 Sco (Tylenda et al., 2011; Pejcha et al., 2014), and may include other suspected mergers like V838 Mon (Bond et al., 2003). Dusty transients like SN 2008S, NGC 300-OT, and their kin have been discussed variously as terminal events like electron capture SNe, eruptive transients, or possibly mergers as well (Prieto, 2008; Prieto et al., 2008; Berger et al., 2009; Bond et al., 2009; Botticella et al., 2009; Thompson et al., 2009; Smith et al., 2009, 2011). Kochanek et al. (2014) estimated rates and argued that merger events from low-mass binaries are common, with the rate falling toward higher initial mass, and they noted that the peak luminosity is a steep function of the initial mass. Smith et al. (2016b) discussed ways that Car and the recent transient in NGC 4490 seem to be an extension of stellar merger transients to higher initial mass, and noted that the duration of the bright transient may also depend on initial mass. Smith et al. (2016b) noted that these objects can show quite similar spectra at various times in their evolution. Blagorodnova et al. (2017) suggested that the recent transient in M101 may be a massive star merger that fits with this scenario as well.
Although the common envelope phase and stellar mergers are still far from being well understood, theoretical models of low-mass events are able to reproduce some aspects of the observed transients, in most cases with the mass ejection and luminosity powered by recombination (Ivanova et al., 2013; Nandez et al., 2014). For the case of Car, the high speed outflow suggests strong shock excitation, the decade-long plateau seems too long to be powered by recombination, and the thin walls of the resulting nebula appear to have been compressed in a radiative shock (Smith, 2013), so a merger model with CSM interaction would seem more appropriate for Car, closer to the models for V1309 Sco discussed by Pejcha and collaborators (see above). In fact, one might argue that a merger model where CSM interaction does not constitute a significant fraction of the luminosity could be problematic; the inspiral must eject mass and angular momentum in order for a merger to occur, so an ejected envelope will likely collide with it unless the final ejecta are very slow. Even in some low-mass meger events like V1309 Sco, some evidence of relatively high speed outflow is seen (Mason et al., 2010), making CSM interaction seem likely (although the speeds are not as extreme as seen in echoes of Car).
In the specific case of Car, a merger scenario as described above is quantitatively plausible in terms of the energy budget of the event and the resulting nebula. Smith (2013) already showed that the luminous plateau phase of the Great Eruption (1845-1860) can be powered by CSM interaction with a 1050 erg explosion running into previous mass loss. This energy can easily be supplied by a massive-star merger event. The gravitational potential energy of two massive stars (say 60 each) that are about to merge (separated by roughly 100 , which is roughly the present-day radius of the primary star; Hillier et al. 2001) would be about 1.41050 erg. This is independent of the source of energy for that explosive outflow (i.e. a PPI event works as well, as noted above). However, a merger scenario provides a natural explanation for why the Car primary seen today, which would be a merger product, appears to still be a very rapid rotator, rotating at a substantial fraction of its expected critial rotation rate (Dwarkadas & Owocki, 2002; Smith, 2002, 2006a; Smith & Townsend, 2007; Smith et al., 2003a). An explanation for the high current rotation and for the bipolar nebula is harder to find in any single-star model (including the PPI model), because the primary has expanded significantly from its ZAMS radius and it has already shed huge amounts of mass and angular momentum.
One difference indicated by our light echo spectroscopy, as compared to the simple CSM interaction model in Smith (2013), is that the post-1843 mass-loss rate may be lower and its bulk outflow speed is higher. Radiative transfer models of the light echo spectra are needed for quantitative estimates of how much mass is contained in the outflow responsible for the broad H wings we observe, but with more kinetic energy per unit mass in the fast outflow, this may suggest that more of the mass in the Homunculus was provided by the slow L2 mass loss in Phase 1, while most of its kinetic energy came from the explosive event in Phase 2. It will be interesting to see if future numerical simulations of an explosive outflow expanding into a compact torus similar to the one formed by L2 mass loss in lower-mass models (Pejcha et al., 2016a, b) can explain observed structures in the nebula of Car, such as the apparent “holes” in the polar caps (Smith, 2006a; Smith et al., 2003b). Gonzalez (2018) recently simulated the shaping of the Homunculus via an explosion with shock interaction following the scenario proposed by Smith (2013), finding that it could indeed explain structural features of the Homunculus. With the adopted parameters, the Homunculus simulated by Gonzalez (2018) was expanding too quickly, and so that author favored a super-Eddington wind scenario. The adapted pre-explosion mass loss and the explosion parameters are not tightly constrained, however, and a different ratio of mass-loss rates in Stage 1 and Stage 2 can change the resulting final speed of the Homunculus. The fast ejecta speeds reported here, indeed, alter the expected explosion parameters one might adopt and point directly to an explosive outflow.
Overall, this simplified two-phase merger scenario therefore gives a somewhat satisfactory (although incomplete) explanation for the evolution of observed light echo spectra of the Great Eruption, basic energetics of the event, and basic structural properties and kinematics of the Homunculus seen today. It does not, however, resolve questions of greater complexities in the presently observed system, including the unusual surviving companion star, a history of previous outbursts, and some of the more detailed structures in the nebula. These are discussed below.
4.7 Can we reconcile this generic binary merger picture with the complexity of Eta Car and its wide companion?
In a standard picture of a stellar merger event, guided by spectacular recent examples such as V1309 Sco, one envisions a relatively long (many orbits) inspiral phase with L2 mass loss shedding both mass and angular mementum, followed by a relatively brief plunge-in (common envelope) phase that may give rise to a sudden but one-off transient event. The end product should be a (potentially dust-obscured) rapid rotator surrounded by a toroidal nebula. As such, this type of scenario provides a plausible origin for the unusual properties of LBVs and B[e] supergiants (Justham et al., 2014; Podsiadlowski et al., 2010), both of which have blue-straggler environments that are more isolated from O-type stars than expected in single-star evolution (Smith & Tombleson, 2015). Mergers may also help account for LBVs as immediate SN progenitors (Justham et al., 2014).
In some basic respects, Car seems to fit this general two-phase merger picture, as noted above, and there are attractive aspects of a merger model for Car as noted previously by several authors (Gallagher, 1989; Iben, 1999a; Podsiadlowski et al., 2010; Portegies Zwart & van den Heuvel, 2016; Justham et al., 2014; Smith et al., 2016a). It is the most luminous star in its birth cluster Trumper 16 (Smith, 2006b), consistent with being a blue straggler (even though the lifetimes are all similarly short for such massive stars), and there are clues that it is currently a rapid rotator (Smith, 2002; Smith et al., 2003c; Dwarkadas & Owocki, 2002).
However, Car also has a lot of observational “baggage”. There are several apparent contradictions between simplified merger models and the vast amount of observational data for Car, which requires that the situation is more complicated if indeed a stellar merger is the correct physical description. To reconcile a merger model with the specific observed case of Car, the most critical problems posed by observations are that: (1) the system is still a binary (and the surviving companion star is weird), and (2) the Great Eruption was not a one-off event, because the star suffered major mass-loss eruptions at least twice before. There are a number of other complexities as well. These challenges are discussed below. We warn the reader that the following sections are speculative; it is not our goal here to provide the final word, but to contemplate how many pieces of the complex puzzle fit together.
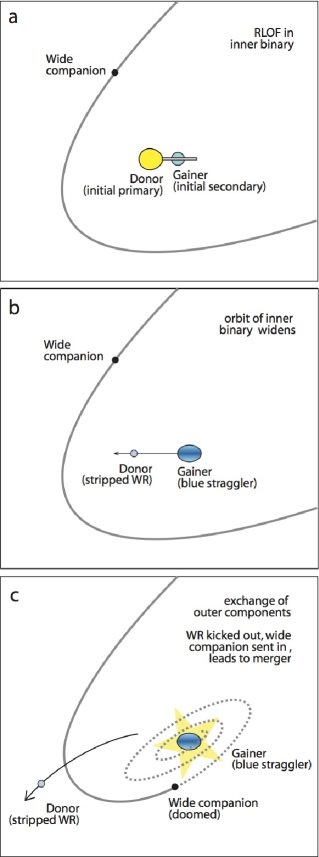
4.7.1 But what about the weird surviving companion?
In its presently observed state 170 yr after the Great Eruption, Car is known to be a binary system with a roughly 5.5 yr period and a highly eccentric () orbit (Damineli, 1996; Damineli et al., 1997; Madura et al., 2012). Thus, if the Great Eruption was powered by a stellar merger event, then its persisting binarity requires that the eruption must have occurred in a hierarchical triple system.
Explaining Car’s eruption as binary merger in a triple system was proposed about two decades ago (Iben, 1999a), although it is now amusing to note that Iben described such a model as “preposterous”. In that model, the wide tertiary (now binary) companion was essentially an innocent bystander that is a relatively inert main sequence O-type star. However the surviving companion is probably not a normal main sequence O-type star (see below).
More recently, Portegies Zwart & van den Heuvel (2016) proposed a conceptually similar model of a binary merger in a triple system, although this time with the surviving companion playing a more active role by helping to initiate the merger of the inner binary via the Kozai-Lidov effect (Kozai, 1962; Lidov, 1962). This model, however, has discrepancies with observational parameters. For instance, because of the precarious nature of the original triple system, a merger or collision is triggered by the Kozai-Lidov mechanism after only 0.1-1 Myr (Portegies Zwart & van den Heuvel, 2016), which is in tension with the 3-4 Myr age of the Tr16 cluster, and also at odds with the fact that the strong enrichment of nitrogen in Car’s ejecta requires that it is a 3 Myr old (post-main-sequence) object (Davidson et al., 1982, 1986; Smith & Morse, 2004). This model doesn’t explain why the orbit of the wide tertiary that survives today as the eccentric binary companion would be aligned with the equatorial plane of the Homunculus (presumably the plane of the binary merger), since the Kozai-Lidov torque is most effective when the two orbits are misaligned (indeed, Portegies Zwart & van den Heuvel 2016 adopted a relative inclination between the inner and outer orbital planes of about 90∘). Moreover, in this model Portegies Zwart & van den Heuvel (2016) explained the ejection of the Homunculus via an enhanced wind caused by tidal heating several decades before the 1840s with the final merger occuring in 1838; this is ruled out by the 1847.1 (0.8 yr) ejection date from proper motions (Smith, 2017), and the radiatively driven wind of 500 km s-1 in their model provides no explanation for the fast Outer Ejecta (Smith, 2008), the very fast ejecta seen in light echoes, the extremely thin walls of the bipolar Homunculus, multiple major eruptions, or the very luminous 1850s plateau in the light curve. In this model as well, the surviving companion should be a normal main sequence O-type star, which it is probably not (see below). Nevertheless, it is interesting to pursue the model of a merger in a triple system, to find a satisfying scenario that is in agreement with available observational constraints. Smith et al. (2016b) showed that, at least observationally, the light curve and spectra of Car’s eruption have similarities with other transients that have been proposed as mergers.
Any model that aims to explain the Great Eruption as a merger event needs to account not only for the highly eccentric orbit of Car’s surviving companion seen today, which is in the same plane as the equator of the Homunculus, but also its unusual nature and likely evolutionary state. Previous models assumed that the companion was a main sequence star, but this seems inconsistent with its observed wind properties.
The inferred physical properties of the surviving companion star in the Car system indicate that it was probably a more active player than previously suggested. In particular, estimates of the companion’s wind indicate extreme physical parameters. Typical values for the mass-loss rate and wind speed of Car’s companion derived by comparing models of the colliding winds with observed X-ray emission are =(1-2)10-5 yr-1 and 3000 km s-1, respectively (Parkin et al., 2011, 2009; Corcoran et al., 2010; Corcoran, 2005; Pittard & Corcoran, 2002; Okazaki et al., 2008; Russell et al., 2016; Hamaguchi et al., 2016). This is a much denser and faster wind than any normal main-sequence O-type star, especially when considering constraints on the companion’s luminosity and ionizing flux that would point to an initially 30 star or less (Mehner et al., 2010; Teodoro et al., 2008; Verner et al., 2005). A typical 30 main sequence star, by contrast, would have = 10-7 yr-1 and =1000 km s-1 (Smith, 2014). Instead of a main-sequence companion, then, the extreme wind properties of Car’s companion are much more consistent with it being a fairly typical hydrogen-poor early-type Wolf-Rayet (WR) star.
The surprising strength and speed of the companion’s wind, as well as its possible similarity to those of WR stars, has been noted several times before, but to our knowledge the rather profound evolutionary implications have so far not been discussed in the literature. Namely, finding that Car’s surviving companion is likely a WR star forces us to rethink the interaction history of this system. If the primary star were an extremely massive single star of or so, or even if it is a merger product from two 60-80 stars, then its short main-sequence lifetime should prohibit its lower-mass companion (currently the secondary) from being a WR star already as a consequence of its own unaltered evolution with mass loss. More massive stars have shorter lifetimes, and there is not enough time for this to have happened if the companion has evolved effectively as a single star. Indeed, a 30 star that has made it to the WR phase already would be older than the 3 Myr stellar population in the Carina Nebula (Smith, 2006b), so one would need to invoke the unlikely scenario that a wandering star ejected from another cluster was captured to make the Car multiple system. A companion star of should still be midway through its main-sequence H-burning phase, and it certainly would not yet have shed its H envelope — especially when its much more massive companion is still an LBV that has retained its H envelope.
At this point we must resign ourselves to the fact that something fairly complicated has happened to Car. We have what appears to be an initially 30 star that has reached its He core burning phase as a compact fast-winded WR star, while orbiting around one of the most luminous blue supergiant stars in the Milky Way that still retains its H envelope and has presumably just finished its core H-burning evolution. How can this be? Without the assistance of time travel, we conclude that the surviving wide secondary must have participated in close binary evolution in order to alter the masses and lifetimes of the system components that have been inferred. This requires previous close interaction and mass exchange, followed by dramatic orbital evolution.
Here is a scenario that appears plausible, given observational constraints, although it is admittedly speculative and probably not a unique explanation.
-
•
Suppose that the Carinae system was originally a high-mass hierarchical triple system (Figure 17a). Toward the end of its main sequence, the initially most massive star in the inner close binary initiates stable mass transfer, being stripped of its H envelope in the process, and donating that envelope to its mass-gainer companion.
-
•
This mass transfer produces a stripped-envelope WR star (initially the primary, now the wide secondary), and makes the mass gainer into a rapidly rotating, overluminous, N-enriched, blue supergiant or LBV that is now the most massive star in the system (Figure 17b).
-
•
Up until this point in the evolution of the system, the wide tertiary has been inert. However, after mass transfer and reversal of the mass ratio, the inner binary system’s orbit widens (Paczynski, 1971). With the center of mass closer to the more massive LBV-like mass gainer, it is the stripped WR star who moves outward (Figure 17b).
-
•
The speculative part about this scenario is that this widening of the orbit may then trigger a violent 3-body interaction, wherein the stripped WR star and the outer tertiary companion (still a main sequence O-type star) exchange places. This interaction kicks the WR star out on a wide and highly eccentric orbit (as observed today), while kicking the previously inert tertiary star inward to interact and eventually merge with the mass gainer (Figure 17c).
-
•
The orbital evolution of the inner binary may then be pushed to a merger by Kozai cycles, by grazing collisions with the bloated mass-gainer, and/or by interaction with a disk that still surrounds the mass gainer.
-
•
This final merger, potentially preceded by a few violent grazing collisions, eventually culminates in the Great Eruption.
Is this type of model really so far-fetched? For earthling astronomers accustomed to orbiting a single star, stellar binary and triple systems often seem exotic. However, observed statistics indicate that for massive stars, binary interaction is the norm, and hierarchical triple systems are common rather than a rare exception (Moe & Di Stefano, 2017; Chini et al., 2012; Kiminki et al., 2012; Kiminki & Kobulnicky, 2012; Sana et al., 2012; Eggleton et al., 2007; Kobulnicky & Fryer, 2007). Mass loss and mass transfer in the inner binary in triple systems can have dramatic effects in tandem with Kozai cycles and tides (Naoz, 2016; Shappee & Thompson, 2013; Michaely & Perets, 2014; Kiseleva et al., 1998), and companions can exchange places (Kiseleva et al., 1994b, a; Perets & Kratter, 2012). Perets & Kratter (2012) have discussed in detail how mass loss and interaction from the inner binary in a hierachical triple system can lead to chaotic orbital evolution, including collisions, exchanging places, and the formation of highly eccentric systems, in an instability they refer to as the triple evolution dynamical instability (TEDI). The present configuration of the Car system seems to naturally fit expectations from TEDI. Triple systems have been invoked to help explain the observed fraction of close binaries (Tokovinin et al., 2006; Moe & Di Stefano, 2017), and mergers in triples akin to the scenario above may be necessary to explain the origin of blue stragglers (Perets & Fabrycky, 2009; Iben, 1999b; Perets & Kratter, 2012). This may be particularly relevant to LBVs, since the observed environments of LBVs suggest that they are indeed massive blue stragglers (Smith & Tombleson, 2015). Interestingly, a triple-system encounter that led to an exchange of the original wide tertiary and an inner companion was already suggested for Car (Livio & Pringle, 1998), although not in the context of triggering a merger.
While the scenario outlined above is admittedly somewhat ad hoc and in need of further quantitative exploration to assess its probability, the basic picture is self consistent and provides a single plausible explanation for a large number of pecularities of the Car system: The exchange of partners explains the highly eccentric and aligned orbit of the secondary, it accounts for the apparent age discrepancy where a lower-luminosity WR star is at a more advanced evolutionary stage than the more luminous H-rich primary, and the exchange of partners is the event that sent one of the stars inward to trigger the merger that powered the Great Eruption. It may also shed some light on the previous eruptions (discussed in the next subsection). We have a plausible explanation for why this event occured at the 3-4 Myr age of the Tr16 cluster and not sooner, which is that the process began as a result of mass transfer when the initial primary finished its main sequence evolution; the widening orbital evolution following mass transfer is what initiated the 3-body interaction in a hierachical system that had been relatively stable during the main sequence. Without having mass transfer and an exchange of partners that kicked out the stripped envelope star (originally the primary), it is almost unfathomable that we could have a WR star that has a significantly lower presumed initial mass while being in a more advanced stage of evolution than its more luminous primary star, and also in a highly eccentric orbit. Capturing an unrelated star from the host cluster might explain the high eccentricity, but would still conflict with the apparently advanced evolutionary state of a star whose H-burning lifetime is longer than the Tr16 cluster. We encourage quantitative studies of the 3-body parameter space that might lead to the current observed properties of the Car system in the qualitative scenario that we described, but such an exploration is well beyond the scope of our current paper.
4.7.2 But what about the previous eruptions?
Another key challenge for any merger model of the Great Eruption is that a binary system merging into one star should be a singular event, whereas observational evidence indicates that Car has erupted repeatly. Proper motions of the Outer Ejecta around Carinae reveal that it suffered at least two major eruptive mass-loss episodes prior to the 19th century Great Eruption; these occurred aproximately 300 and 600 yr before (Kiminki et al., 2016). These precursor eruptions also had a different geometry than the 19th century eruption, with the first being almost entirely one-sided (to the northeast and blueshifted) and the second sending material in a few different directions, but with neither sharing the axisymmetry or orientation of the bipolar Homunculus (Kiminki et al., 2016).
In the scenario discussed above, where a triple-system exchange leads to a stellar merger, one might envision the multiple eruptions as a consequence of several “near misses” or grazing collisions before the final stellar merger event. This is an expected outcome of the TEDI instability described above. After the exchange of partners that kicks out the WR star and kicks in the original tertiary, the inner binary will likely be eccentric and its orbital evolution can be influenced by Kozai cycles as noted above. This may drive the binary to closer periastron distances such that they eventually have a near miss or their outer envelopes collide, leading to significantly asymmetric mass ejection from the primary star’s loosely bound envelope. Additionally, the companion may interact with a remnant disk or bloated envelope around the rapidly rotating mass gainer (Muñoz et al., 2015). The tidal or dynamical friction of these grazing collisions may degrade the orbit enough that that the binary finally merges together after a few violent encounters (Perets & Kratter, 2012). (Collisions resulting from the TEDI instability were originally discussed in the context of enlarged red giant envelopes in lower mass stars, but the bloated envelope of a massive LBV also has a very large radius.) Since the first pass is likely to be the most eccentric, this might be an interesting explanation for why the first of the three historical eruptions sent ejecta in largely one direction (Kiminki et al., 2016). The final event (the actual merger of the two stars) produced strong mass loss that was, by contrast, highly axisymmetric (the Homunculus).
If a significant fraction of the primary star’s outer envelope is ejected in these repeating eruptions, there may be a physical mechanism for the delay between eruptions. Namely, the star’s envelope may recover and re-establish equilibrium on a thermal timescale (centuries for the mass of the outer envelope). When the envelope reaches a radius comparable to the periastron separation, this may trigger the next grazing collision. The outer companion star seen today shares the same orbital plane as the equator of the Homunculus, whereas the previous eruptions did not share the same geometry. One might also then envision this series of grazing collisions or failed mergers as a process by which the merging stars exchanged angular momentum, so that the inner orbits became aligned with the primary star’s rotation and the orientation of the outer binary. This is admittedly speculative and unrefined, but at least it gives some plaubile explanation for the differing geometry in subsequent historical eruption events. This is lacking from any other model for Car’s eruption discussed so far, and is a fruitful topic for numerical simulations.
4.7.3 But what about the structure of the equatorial skirt and the Strontium Filament?
The structure of Car’s highly non-spherical ejecta provide important clues about its recent violent mass-loss history, as noted previously (see, e.g., Smith 2012, 2013). The detailed structure of the material in the equatorial plane has particular relevance to any merger model, since the inspiral phase leading to a merger should shed a large amount of mass through L2 (Pejcha et al., 2016a).
The ragged spray of debris referred to as the Equatorial Skirt is a particularly recognizable feature of the Homunculus (Morse et al., 1998), and the so-called “Strontium filament” is one particular location in the equatorial skirt with unusually strong emission lines from [Sr ii] and a number of other low-ionization metals (Hartman et al., 2004). Most of the equatorial skirt has the same age as the rest of the Homunculus (Morse et al., 2001), but some features appear to have been ejected decades before or afterward (Smith, 2017). One expects these features to have some satisfactory explanation in a model of the Great Eruption.
At the pinched waist of the Homunculus Nebula, multiwavelength observations (especially in the infrared) have revealed the existence of a complicated toroidal structure. This torus has been discussed by numerous authors, the history of which is summarized by Smith (2012). More recently, high-resolution observations of 12CO 2–1 with the Atacama Large Millimeter Array (ALMA) have revealed new clues to the structure of the equatorial ejecta (Smith et al., 2018a). The CO emission shows a toroidal structure with a size similar to previous IR data, but the density structure of the CO torus departs strongly from azimuthal symmetry. In particular, the torus is a series of clumps, with higher density on the far southest side and an opening on the northwest side. It basically shows a “C” shape, with the gap in the “C” pointing toward us (i.e. the near side of the equator to the northwest direction).
The connection to any model for the Great Eruption is evident when we consider the relative orientation of the torus compared to the currently observed eccentric binary system. Namely, the direction of apastron in the eccentric binary seen today is also to the northwest (Madura et al., 2012), toward the middle of the gap in the torus (Smith et al., 2018a). This suggests that the wide eccentric companion seen today had roughly the same orbital orientation during the lead up to the Great Eruption (i.e. the inspiral or Phase 1 as discussed above), which it maintained as the equatorial ejecta expanded past it. This is consistent with the notion that the orbital period did not change by more than a few percent before and after the Great Eruption (Smith, 2011). In other words, the wide secondary star we study today was not a major source of energy to power the Great Eruption. It may be that periastron encounters were able to enhance the mass loss toward the far side of the nebula, whereas equatorial material ejected toward us (i.e. toward apastron) by the central binary may have been diverted or disrupted by the eccentric companion after being shed by the inner binary. This is an area where hydrodynamic simulations could be very useful to understand the interaction. It is interesting to note, however, that the polar lobes of the Homunculus do not depart so strongly from azimuthal symmetry. In any case, the resulting density structure of the torus helps explain why the currently observed equatorial skirt appears as a ragged spray of streamers in optical images. Namely, the equatorial skirt is illuminated by scattered light that escapes preferentially through holes and gaps between clumps in the inner torus. Because of the azimuthal asymmetry, more light escapes in the direction of apastron, which is why the equatorial skirt is seen mostly on our side of the Homunculus. The fast post-eruption wind from the secondary can also escape more easily through the gaps in the torus, influencing structures on the near side of the equatorial ejecta. See Smith et al. (2018a) for a more detailed discussion.
The peculiar nature of the Sr filament may have less to do with the Great Eruption. As discussed recently by Smith et al. (2018a), the Sr filament is downstream from the dense inner clumps known as the “Weigelt knots”, and its pecular low ionization may arise because it is shadowed by them. The Weigelt knots appear to have been ejected later, probably in the 1890 eruption or afterward (Dorland et al., 2004; Smith et al., 2004c), but they are clearly in the direction of apastron in the equatorial plane. The asymmetry of the mass ejection during 1890 is beyond the scope of our paper.
4.7.4 But what about the S Condensation and NN jet?
Further outside the Homunculus, emission line images reveal a spectacular array of clumpy nebular structures known as the Outer Ejecta (Walborn, 1976). Most of these are from older eruptions centuries before the Great Eruption (Kiminki et al., 2016). Prominent among the Outer Ejecta are the so-called “NN Jet” and “S Condensation”, which resemble collimated outflows in the equatorial plane (Walborn, 1976, 1995; Kiminki et al., 2016; Mehner et al., 2016). The S Condensation and NN Jet have proper motions that indicate they were either ejected in the Great Eruption or in the decades leading up to it, but not in the eruptive events 300 and 600 years before (Kiminki et al., 2016). While detailed study of the kinematics has revealed that they are ballistic ejections rather than true hydrodynamic jets (Meaburn et al., 1993; Glover et al., 1997; Morse et al., 2001; Kiminki et al., 2016; Mehner et al., 2016), one may still wonder how Car managed to simultaneously send two large bullets out in opposing directions in its equatorial plane in an event that was otherwise highly axisymmetric.
Here, again, it is likely that the wide eccentric secondary plays an important role in this non-axisymmetric structure. As noted by Smith (2011), the apparent magnitude in the historical light curve and apparent color in the years leading up to the Great Eruption peak dictate that the emitting photosphere was larger than the periastron separation of the current binary, and that as such, some sort of violent interaction like a collision must have occurred at times of periastron. This remains true whether this photosphere was a true hydrodynamic surface of the star, or (more likely) the photosphere of a common envelope or the emitting radius of the shock heated circumbinary disk during the inspiral phase of a merger. These periastron collisions have been interpreted as causing the brief luminosity spikes seen in the historical light curve in 1838 and 1843 (Smith, 2011). The wide companion must have plunged into one side of the dense envelope around the star and popped out the other side, possibly multiple times. This is discussed in more detail in our companion paper on the fast ejecta seen in Car’s light echoes (Smith et al., 2018b), where we point out that with the known orbital geometry from Madura et al. (2012), the S Condensation roughly matches the direction of ingress and the NN Jet roughly matches the trajectory of egress in this collision. The wide companion may have left a tunnel in its wake as it drilled its way through the extended toroidal envelope, through which fast ejecta from the Great Eruption may have been able to squirt. We noted earlier that the known echo geometry of EC2 indicates that it views Car roughly in the equatorial plane, and its position angle is within 10-20 deg of the S Condensation’s trajectory (also in the equatorial plane). In other words, if the S Condensation is a bullet of fast ejecta, then the EC2 echo seems to be looking nearly down the barrel of the gun. This is probably related to the very broad wings of H seen in the EC2 echo reported here.
4.7.5 But what about the brief 1838 and 1843 luminosity spikes?
Following the scenario discussed in the previous two subsections, the star that we now see as the wide secondary was orbiting around a close binary in the process of merging, as it ejected substantial amounts of material in the equator. In addition to profoundly influencing the structure of the outflowing ejecta seen today around Car, the close periaston encounters may have played an important secondary role in the light curve. These periaston passes were not enough to power the total kinetic and radiated energy of the whole 1050 erg event. However, shock heating from the companion ripping through the L2 mass loss disk or plunging into the bloated common envelope of the merger may have powered the brief luminosity spikes in the light curve (Smith, 2011; Smith & Frew, 2011). In this view, the main 1850s plateau and the brief 1838 and 1843 precursor spikes have two different specific physical causes, even though they both stem from the same merger event. This may help explain why similar brief luminosity spikes are absent in UGC 2773-OT, even though the light curve and spectral evolution of its plateau phase are almost identical to Car’s (i.e. the outer tertiary may have been on a wider orbit that didn’t cause periastron collisions in the case of UGC 2773-OT, or it may have simply been a merger not in a triple system). Even if we are restricted to merger events in triple systems, the influence of periastron encounters by the outer companion could cause significant diversity from one merger event to the next, depending on the configuration of the outer orbit and the mass of that companion. This may be related to the tremendous diversity in extragalactic SN impostors (Van Dyk & Matheson, 2012; Smith et al., 2011; Pastorello et al., 2010).
4.7.6 But what about the age of the Homunculus?
In the two-stage merger scenario proposed above, the ejected mass that constitutes the Homunculus Nebula actually leaves the star over a time period of several decades or more. The single, well-constrained apparent ejection date for the Homunculus of 1847.1 0.8 yr from proper motions (Smith, 2017; Morse et al., 2001) arises because a strong shock from an explosive event sweeps up this previously ejected material into a thin cooled shell with a single dynamical age. The shock cooling, which provides the luminosity of the plateau, also allows this swept up material to collapse to a very thin layer as seen today in the walls of the Homunculus (Smith, 2006a, 2013). This shock essentially erases the previous mass-loss history and creates the illusion, when we measure its proper motion expansion, that the whole nebula was ejected instantaneously (Smith, 2017). Doppler velocities seen in light echoes, on the other hand, show that strong mass loss was occurring over several years, but that the fastest material appeared after 1847. We have associated the fast, explosive outflow with a shock that results from energy deposition due to the final stellar merger event, whereas the slower 150-200 km s-1 outflow seen prior to 1847 was due primarily to mass loss associated with the inspiral phase of the merger.
4.7.7 But what about…?
Admittedly, there are remaining open questions associated with Car and its nebula that are not close to being settled by the speculation in this final part of the paper. The general scenario outlined above certainly is a challenge for quantitative models to match, but light echoes combined with the properties of Car’s ejecta narrow the range of possible configurations and free parameters considerably. While it may be fun to entertain even more complicated scenarios (multiple mergers, precessing jets, exotic compact object interactions, a TO, etc.), the triple-interaction scenario described above with an exchange of partners leading to a merger seems like the minimum level of complexity needed to simultaneously account for a WR-like companion in a wide eccentric orbit around a much more massive and more luminous rapidly rotating primary that still retains its hydrogen envelope, which can, moreover, achieve disk plus bipolar geometry, heavily nuclear-processed ejecta, and multiple eruptions with one of those being a 1050 erg explosive ejection event that accounts for the spectroscopic evolution seen in light echoes.
5 Summary and Future Work
In this paper we have analyzed photometry and spectroscopy of a light echo EC2 that we argue reflects light from the decade-long plateau of the Great Eruption of Carinae. This echo views the star from a vantage point that is near the equatorial plane of the Homunculus Nebula. Combined with another echo (EC1) that we reported previously (Rest et al., 2012; Prieto et al., 2014), which reflects light from an earlier epoch along roughly the same direction, this provides the first long-term spectroscopic time series of the main part of Car’s 19th century eruption. Briefly, some of the main results are as follows:
1. Echo spectroscopy gives a time series of outflow velocity and line strength that indicate a two-phase eruption, with a slow 150-200 km s-1 outflow at early times, followed by a faster (600 km s-1) bulk outflow at later times. The division between these two phases coincides with the measured dynamical age of the Homunculus.
2. Spectra also reveal, for the first time, expansion speeds as high as 10,000-20,000 km s-1 in later stages of the eruption. We suspect that these are associated with the fastest nebular material seen today in the Outer Ejecta (Smith, 2008). These are the fastest speeds so far reported in any non-terminal SN impostor or LBV-like eruption. They clearly indicate an explosive component to the eruption.
3. The relatively slow outflow followed in time by a fast outflow make it highly likely that the plateau of Car’s eruption was indeed powered largely by shock luminosity in CSM interaction, qualitatively similar to a scaled down version of a Type IIn supernova (Smith, 2013).
4. We interpret the two-phases of the observations (slow vs. fast outflow) in a physical picture that corresponds to a two-stage stellar merger event, with (1) inspiral and L2 mass loss (Pejcha et al., 2016a), and (2) explosive outflow and CSM interaction (Smith, 2013). We attribute the persistent broad H line wings in Stage 2 to the fastest explosive ejecta crossing the reverse shock, as commonly seen in later phases of SNe IIn.
5. In order to reconcile this simple binary merger picture with the eccentric colliding wind binary system and Car’s complex nebula seen today, we propose a qualitative model involving an exchange of partners in a hierachical triple system that led to the merger, kicking out the original primary as a stripped-envelope WR star on a wide eccentric orbit. This invokes the TEDI instability discussed for lower-mass triple systems. While mergers and triple systems have been discussed before in the context of Car, this new scenario differs in several key ways that are more easily reconciled with observational constraints, as we describe in the text (Section 4.6). As such, Car would add a relatively extreme example of blue stragglers formed in triple systems.
We plan to continue monitoring the evolution of the EC2 echo, since it is expected to fade significantly over the next several years. If it does, this will confirm that it was an echo from the plateau of the Great Eruption, and it may provide important clues about dust formation in the Homunculus. For instance, if the fading after 1858 was caused by dust formation, we may see the red sides of strong emission lines fade as newly formed dust blocks receding parts of the ejecta as in some SNe and novae. We may also witness signatures of the formation of molecules that are pathways to the dust formation (Prieto et al., 2014). After EC2 fades, we can obtain a spectrum of the reflecting surface of its cloud to serve as a template to subtract from our earlier spectra, to clearly delineate narrow emission features that come from the surface of the cloud and to determine which, if any, narrow emission features (such as He i lines) were in fact part of the echo light. Other echoes along similar lines of sight tracing the pre-1845 peaks (Rest et al., 2012; Prieto et al., 2014) should brighten again in next 5-10 years and eventually show a spectrum similar to EC2. This will definitively confirm that EC2 was light from the 1850s plateau.
So far we have only analyzed a time series of light echo spectra as viewed from a single vantage point near the equator. Given the present day Homunculus, the outflow and CSM interaction must have been highly latitude dependent, so we might expect strong differences in both the light curve and spectra of the Great Eruption as viewed from the poles or intermediate latitudes. The evolution of velocities and excitation with time may be very different, not to mention the possible formation of dust at different times along various lines of sight.
If any of the ideas outlined in this paper are on the right track, then Carinae is a gold mine for understanding the recovery of a massive-star merger product in the centuries after the event. This is something we cannot address in the near term with extragalactic SN impostors, whereas the tight observational constraints on the physical parameters of Car’s eruption and its spatially resolved nebula provide fertile ground for theoretical work. We now have a detailed record of observations during the aftermath over a timeline of 170 years since the Great Eruption, spectroscopy and photometry of the event itself, constraints on previous eruptions that occurred 300-600 years before the putative merger, plus the remnant binary star system and nebula. If Car’s eruption really was a merger, this opens a new field of inquiry for investigating mergers in the most massive stars, the formation of massive blue stragglers, non-terminal explosions, and the progenitors of some extreme types of SNe.
Acknowledgements
We thank an anonymous referee for a careful reading of the manuscript. We benefitted from numerous sisyphean conversations about the grey area between explosions and winds with Stan Owocki, Dave Arnett, Eliot Quataert, and Chris Matzner, and informative conversations about binary L2 mass loss and mergers with Ondrej Pejcha, Stephen Justham, Kaitlin Kratter, and Philipp Podsiadlowski. We have also discussed binary evolution, on occasion, with Selma de Mink. N.S.’s research on Eta Carinae’s light echoes and eruptive transients was supported by National Science Foundation (NSF) grants AST-1312221 and AST-1515559. Partial support for this work was provided by NASA grants AR-12618, AR-14586, and GO-13390 from the Space Telescope Science Institute, which is operated by the Association of Universities for Research in Astronomy, Inc. under NASA contract NAS 5-26555. Support for JLP is provided in part by FONDECYT through the grant 1151445 and by the Ministry of Economy, Development, and Tourism’s Millennium Science Initiative through grant IC120009, awarded to The Millennium Institute of Astrophysics, MAS. DJJ gratefully acknowledges support from the NSF through award AST-1440254.
This paper includes data gathered with the 6.5m Magellan Telescopes located at Las Campanas Observatory, Chile. This project used data obtained with the Dark Energy Camera (DECam), which was constructed by the Dark Energy Survey (DES) collaborating institutions. Funding for DES, including DECam, has been provided by the U.S. DoE, NSF, MECD (Spain), STFC (UK), HEFCE (England), NCSA, KICP, FINEP, FAPERJ, CNPq (Brazil), the GRF-sponsored cluster of excellence “Origin and Structure of the Universe” and the DES collaborating institutions. This work makes use of observations from the LCO network. Based, in part, on observations obtained at the Gemini Observatory, which is operated by the Association of Universities for Research in Astronomy, Inc., under a cooperative agreement with the NSF on behalf of the Gemini partnership: the National Science Foundation (United States), the National Research Council (Canada), CONICYT (Chile), Ministerio de Ciencia, Tecnología e Innovación Productiva (Argentina), and Ministério da Ciência, Tecnologia e Inovação (Brazil) (Program GS-2014B-Q-24).
References
- Adams et al. (2016) Adams SM, Kochanek CS, Prieto JL, Dai X, Shappee BJ, Stanek KZ. 2016, MNRAS, 460, 1645
- Barkat et al. (1967) Barkat Z, Rakavy G, Sack N. 1967, Phys. Rev. Let., 18, 379
- Bautista et al. (2009) Bautista MA, Ballance C, Gull TR, Hartman H, Lodders K, Martínez M, Melendez M. 2009, MNRAS, 393, 1503
- Bautista et al. (2006) Bautista MA, Hartman H, Gull TR, Smith N, Lodders K. 2006, MNRAS, 370, 1991
- Berger et al. (2009) Berger E, et al. 2009, ApJ, 699, 1850
- Bertin et al. (2002) Bertin E, Mellier Y, Radovich M, Missonnier G, Didelon P, Morin B. 2002, ASP Conf. Ser., 281, 228
- Blagorodnova et al. (2017) Blagorodnova N, et al. 2017, ApJ, 834, 107
- Bond et al. (2003) Bond HE, et al. 2003, Nature, 422, 405
- Bond et al. (2009) Bond H, Bedin LR, Bonanos AZ, Humphreys RM, Monard LAGB, Prieto JL, Walter FM. 2009, ApJ, 695, L154
- Bond et al. (1984) Bond JR, Arnett WD, Carr BJ. 1984, ApJ 280, 825
- Botticella et al. (2009) Botticella MT, Pastorello A, Smartt SJ, et al. 2009, MNRAS, 398, 1041
- Boumis et al. (1998) Boumis P, Meaburn J, Bryce M, Lopez JA. 1998, MNRAS, 294, 61
- Brown et al. (2013) Brown TM, et al. 2013, PASP, 125, 1031
- Chatzopoulos & Wheeler (2012) Chatzopoulos E, Wheeler JC. 2012, ApJ, 748, 42
- Chini et al. (2012) Chini R, Hoffmeister VH, Nasseri A, Stahl O, Zinnecker H. 2012, MNRAS, 424, 1925
- Chugai et al. (2004) Chugai NN, et al., 2004, MNRAS, 352, 1213
- Corcoran (2005) Corcoran MF. 2005, AJ, 129, 2018
- Corcoran et al. (2010) Corcoran MF, Hamaguchi K, Pittard JM, Russell CMP, Owocki SP, Parkin ER, Okazaki A. 2010, ApJ, 725, 1528
- Couderc (1939) Couderc P. 1939, Annales d’Astrophysique, 2, 271
- Currie et al. (1996) Currie DG, et al. 1996, AJ, 112, 1115
- Damineli (1996) Damineli A. 1996, ApJ, 460, L49
- Damineli et al. (1997) Damineli A, Conti PS, Lopes DF. 1997, New Astron., 2, 107
- Davidson (1987) Davidson K. 1987, ApJ, 317, 760
- Davidson & Humphreys (1997) Davidson K, Humphreys RM. 1997, ARAA, 35, 1
- Davidson & Humphreys (2012) Davidson K, Humphreys RM. 2012, Nature, 486, E1
- Davidson et al. (1982) Davidson K, Walborn NR, Gull TR. 1982, ApJ, 254, L47
- Davidson et al. (1986) Davidson K, et al. 1986, ApJ, 305, 867
- Dessart et al. (2015) Dessart L, Audi E, Hillier DJ. 2015, MNRAS, 449, 4304
- Dorland et al. (2004) Dorland BN, Currie DG, Hajian AR. 2004, AJ, 127, 1052
- Dressler et al. (2011) Dressler A, Bigelow B, Hare T, et al. 2011, PASP, 123, 288
- Dwarkadas & Owocki (2002) Dwarkadas VV, Owocki SP. 2002, ApJ, 581, 1337
- Elliott (1979) Elliot KH. 1979, MNRAS, 186, P9
- Eggleton et al. (2007) Eggleton PP, Kisseleva-Eggleton L, Dearborn X. 2007, in IAU Symp. 240, Binary Stars as Critical Tools & Tests in Contemporary Astrophysics, ed. W. I. Hartkopf, P. Harmanec, & E. F. Guinan (Cambridge: Cambridge Univ. Press), 347
- Ferland & Persson (1989) Ferland GJ, Persson SE. 1989, ApJ, 347, 656
- Flaugher et al. (2015) Flaugher B, Diehl HT, Honscheid K, et al. 2015, AJ, 150, 150
- Foley et al. (2011) Foley RJ, Berger E, Fox O, et al. 2011, ApJ, 732, 32
- Fowler & Hoyle (1964) Fowler WA, Hoyle F. 1964, ApJS, 9, 201
- Frank et al. (1995) Frank A, Balick B, Davidson K. 1995, ApJ, 441, L77
- Fuller (2017) Fuller J. 2017, MNRAS, 470, 1642
- Gaviola (1950) Gaviola E. 1950, ApJ, 111, 408
- Gallagher (1989) Gallagher JS, 1989, in Davidson K, Moffat AFJ, Lamers HJGLM, eds, Astrophysics and Space Science Library, Vol. 157. IAU Colloq. 113: Physics of Luminous Blue Variables. Kluwer, Dordrecht, p. 185
- Glazebrook & Bland-Hawthorn (2001) Glazebrook K, Bland-Hawthorn J. 2001, PASP, 113, 197
- Glover et al. (1997) Glover TW, Dufour RJ, Hester JJ, Currie DG, van Orsow D, Walter DK. 1997, ASP Conf. Ser. 120, 296
- Gratton (1963) Gratton L. 1963, Proc. Internat. School Phys., Course 28 (New York: Academic Press), 297
- Gonzalez (2018) Gonzalez RF. 2018, AA&A, 609, A69
- Hamaguchi et al. (2016) Hamaguchi K, et al. 2016, ApJ, 817, 23
- Hartman et al. (2004) Hartman H, Gull T, Johansson S, Smith N, HST Eta Carinae Treasury Project Team 2004, A&A, 419, 215
- Heger & Woosley (2002) Heger A, Woosley SE. 2002, ApJ, 567, 532
- Heng et al. (2006) Heng K, McCray R, Zhekov SA, Challis PM, Chevalier RA, Crotts APS, Fransson C, Garnavich P, Kirshner RP, Lawrence SS, Lunqvist P,Panagia N, Pun CSJ, Smith N, Sollerman J, Wang L. 2006, ApJ, 644, 959
- Herschel (1847) Herschel JFW. 1847, Results of Astronomical Observations Made during the Years 1834, 5, 6, 7, 8 at the Cape of Good Hope (London: Smith, Elder & Co.)
- Hillier et al. (2001) Hillier DJ, Davidson K, Ishibashi K, Gull TR. 2001, ApJ, 553, 837
- Hook et al. (2002) Hook I, et al. 2002, SPIE, 4841
- Horne (1986) Horne K. 1986, PASP, 98, 609
- Humphreys & Davidson (1994) Humphreys RM, Davidson K. 1994, PASP, 106, 1025
- Humphreys, Davidson, & Smith (1999) Humphreys RM, Davidson K, Smith N. 1999, PASP, 111, 1124
- Iben (1999a) Iben I. 1999a, in Eta Carinae at the Millenium, ASP Conf. Ser. 179 (San Francisco: ASP), 367
- Iben (1999b) Iben I. 1999b, in 11th European Workshop on White Dwarfs, ASP Conf. Ser. 169 (San Francisco: ASP), 432
- Ivanova et al. (2013) Ivanova N, Justham S, Avendano Nandez JL, Lombardi JC. 2013, Science, 339, 433
- Justham et al. (2014) Justham S, Podsiadlowski P, Vink JS. 2014, ApJ, 796, 121
- Kashi & Soker (2009) Kashi A, Soker N. 2009, New Astron., 14, 11
- Kiminki & Kobulnicky (2012) Kiminki DC, Kobulnicky HA. 2012, ApJ, 751, 4
- Kiminki et al. (2012) Kiminki DC, Kobulnicky HA, Erwig I, et al. 2012, ApJ, 747, 41
- Kiminki et al. (2016) Kiminki MM, Reiter M, Smith N. 2016, MNRAS, 463, 845
- Kiseleva et al. (1994a) Kiseleva LG, Eggleton PP, Orlov VV. 1994a, MNRAS, 270, 936
- Kiseleva et al. (1994b) Kiseleva LG, Eggleton PP, Anosova JP. 1994b, MNRAS, 267, 161
- Kiseleva et al. (1998) Kiseleva LG, Eggleton PP, Mikkola S. 1998, MNRAS, 300, 292
- Kobulnicky & Fryer (2007) Kobulnicky HA, Fryer CL. 2007, ApJ, 670, 747
- Kochanek (2011) Kochanek CS. 2011, ApJ, 743, 73
- Kochanek et al. (2014) Kochanek CS, Adams SM, Belczynski K. 2014, MNRAS, 443, 1319
- Kozai (1962) Kozai Y. 1962, AJ, 67, 591
- Langer et al. (1999) Langer N, Garcia-Segura G, MacLow MM. 1999, ApJ, 520, L49
- Lidov (1962) Lidov ML. 1962, P&SS, 9, 719
- Livio & Pringle (1998) Livio M, Pringle JE. 1998, MNRAS, 295. L59
- Lopez & Meaburn (1984) Lopez JA, Meaburn J. 1984, Rev. Mex. Astron. Astrophys., 9, 119
- Lopez & Meaburn (1986) Lopez JA, Meaburn J. 1986, Rev. Mex. Astron. Astrophys., 13, 27
- Madura et al. (2012) Madura TI, et al. 2012, MNRAS, 420, 2064
- Marshall et al. (2008) Marshall JL, Burles S, Thompson IB, et al. 2008, Proc. SPIE, 7014, 701454
- Mason et al. (2010) Mason E, Diaz M, Williams RE, Preston G, Bensby T. 2010, A&A, 516, A108
- Matheson et al. (2000) Matheson T, Filippenko AV, Ho LC, Barth AJ, Leonard DC. 2000, AJ, 120, 1499
- Meaburn et al. (1993) Meaburn J, Gehring G, Walsh JR, Palmer JW, Lopez JA, Bryce M, Raga AC. 1993, A&A, 276, L21
- Mehner et al. (2010) Mehner A, Davidson K, Gull TR, Humphreys RM. 2010, ApJ, 710, 729
- Mehner et al. (2016) Mehner A, Steffen W, Groh JH, et al. 2016, A&A, 595, A120
- Metzger & Pejcha (2017) Metzger BD, Pejcha O. 2017, MNRAS, 471, 3200
- Michaely & Perets (2014) Michaely E, Perets HB. 2014, ApJ, 794, 122
- Moe & Di Stefano (2017) Moe M, Di Stefano R. 2017, ApJS, 230, 15
- Morse et al. (1998) Morse, JA, et al. 1998, AJ, 116, 2443
- Morse et al. (2001) Morse JA, Kellogg JR, Bally J, Davidson K, Balick B, Ebbets D. 2001, ApJ, 548, L207
- Muñoz et al. (2015) Muñoz DJ, Kratter K, Vogelsberger M, Hernquist L, Springel V. 2015, MNRAS, 446, 2010
- Nandez et al. (2014) Nandez JLA, Ivanova N, Lombardi JC, Jr. 2014, ApJ, 786, 39
- Naoz (2016) Naoz S. 2016, ARA&A, 54, 441
- Okazaki et al. (2008) Okazaki AT, Owocki SP, Russell CMP, Corcoran MF. 2008, MNRAS, 388, L39
- Owocki & Gayley (1997) Owocki SP, Gayley KG. 1997, in ASP Conf. Ser. 120, Luminous Blue Variables: Massive Stars in Transition, ed. A Nota & HJGLM Lamers (San Francisco: ASP), 121
- Owocki & Shaviv (2016) Owocki SP, Shaviv NJ. 2016, MNRAS, 462, 345
- Owocki et al. (2004) Owocki SP, Gayley KG, Shaviv NJ. 2004, ApJ, 616, 525
- Owocki et al. (2017) Owocki SP, Townsend RHD, Quataert E. 2017, MNRAS, 472, 3749
- Paczynski (1971) Paczynski B. 1971, Acta Astron., 17, 355
- Paragia et al. (1999) Paragia Z, Vermeulenb RC, Fejesa I, Schilizzic RT, Spencerd RE, Stirlingd AM. 1999, New Ast. Rev., 42, 641
- Parkin et al. (2009) Parkin ER., Pittard JM, Corcoran MF, Hamaguchi K, Stevens IR. 2009, MNRAS, 394, 1758
- Parkin et al. (2011) Parkin ER, Pittard JM, Corcoran MF, Hamaguchi K. 2011, ApJ, 726, 105
- Pastorello et al. (2010) Pastorello A, et al. 2010, MNRAS, 408, 191
- Pastorello et al. (2013) Pastorello A, et al., 2013, ApJ, 767, 1
- Pejcha et al. (2014) Pejcha O. 2014, ApJ, 788, 22
- Pejcha et al. (2016a) Pejcha O, Metzger BD, Tomida K. 2016, MNRAS, 455, 4351
- Pejcha et al. (2016b) Pejcha O, Metzger BD, Tomida K. 2016, MNRAS, 461, 2527
- Pejcha et al. (2017) Pejcha O, Metzger BD, Tyles JG, Tomida K. 2017, preprint
- Perets & Fabrycky (2009) Perets HB, Fabrycky DC. 2009, ApJ, 697, 1048
- Perets & Kratter (2012) Perets HB, Kratter K. 2012, ApJ, 760, 99
- Piro (2011) Piro A. 2011, ApJ, 738, L5
- Pittard & Corcoran (2002) Pittard JM, Corcoran MF. 2002, A&A, 383, 636
- Podsiadlowski et al. (2010) Podsiadlowski P, Ivanova N, Justham S, Rappaport S. 2010, MNRAS, 406, 840
- Portegies Zwart & van den Heuvel (2016) Portegies Zwart SF, van den Heuvel EPJ. 2016, MNRAS, 456, 3401
- Prieto (2008) Prieto JL. 2008, ATel, 1550, 1
- Prieto et al. (2008) Prieto JL, et al. 2008, ApJ, 681, L9
- Prieto et al. (2009) Prieto JL, Sellgren K, Thompson TA, Kochanek CS. 2009, ApJ, 705, 1425
- Prieto et al. (2014) Prieto JL, et al. 2014, ApJ, 787, 8
- Quataert & Shiode (2012) Quataert E, Shiode J. 2012, MNRAS, 423, L92
- Quataert et al. (2016) Quataert E, Fernandez R, Kasen D, Klion H, Paxton B. 2016, MNRAS, 458, 1214
- Rakavy & Shaviv (1967) Rakavy G, Shaviv G. 1967, ApJ, 148, 803
- Rest et al. (2012) Rest A, et al. 2012, Nature, 482, 375
- Rest et al. (2005a) Rest A, Stubbs C, Becker AC, et al. 2005a, ApJ, 634, 1103
- Rest et al. (2005b) Rest A, Suntzeff NB, Olsen K, et al. 2005b, Nature, 438, 1132
- Rest et al. (2008) Rest A, Welch DL, Suntzeff NB, et al. 2008, ApJL, 681, L81
- Ro & Matzner (2017) Ro S, Matzner CD. 2017, ApJ, 849, 9
- Russell et al. (2016) Russell CMP, Corcoran MF, Hamaguchi K, Madura TI, Owocki SP, Hillier DJ. 2016, MNRAS, 458, 2275
- Sana et al. (2012) Sana H, de Mink SE, de Koter A, et al. 2012, Sci, 337, 444
- Shappee & Thompson (2013) Shappee BJ, Thompson TA. 2013, ApJ, 766, 64
- Shaviv (2000) Shaviv NJ. 2000, ApJ Letters, 532, L137
- Shine & Linsky (1974) Shine RA, Linski JL. 1974, Sol. Phys., 39, 49
- Shiode & Quataert (2014) Shiode JH, Quataert E. 2014, ApJ, 780, 96
- Smith (2002) Smith N. 2002, MNRAS, 331, 7
- Smith (2006a) Smith N. 2006a, ApJ, 644, 1151
- Smith (2006b) Smith N. 2006b, MNRAS, 367, 763
- Smith (2008) Smith N. 2008, Nature, 455, 201
- Smith (2011) Smith N. 2011, MNRAS, 415, 2020
- Smith (2012) Smith N. 2012, in Humphreys R. M., Davidson K., eds, Eta Carinae and the Supernova Impostors. Springer, Berlin, 145
- Smith (2013) Smith N. 2013, MNRAS, 429, 2366
- Smith (2014) Smith N. 2014, ARAA, 52, 487
- Smith (2017) Smith N. 2017, MNRAS, 471, 4465
- Smith & Arnett (2014) Smith N, Arnett WD. 2014, ApJ, 785, 82
- Smith & Brooks (2007) Smith N, Brooks KJ. 2007, MNRAS, 379, 1279
- Smith & Gehrz (1998) Smith N, Gehrz RD. 1998, AJ, 116, 823
- Smith & Ferland (2007) Smith N, Ferland GJ. 2007, ApJ, 655, 911
- Smith & Frew (2011) Smith N, Frew D. 2011, MNRAS, 415, 2009
- Smith & Morse (2004) Smith N, Morse JA. 2004, ApJ, 605, 854
- Smith & Owocki (2006) Smith N, Owocki SP. 2006, ApJ, 645, L45
- Smith & Townsend (2007) Smith N, Townsend RHD. 2007, ApJ, 666, 967
- Smith & Tombleson (2015) Smith N, Tombleson R. 2015, MNRAS, 602, 621
- Smith & McCray (2007) Smith N, McCray R. 2007, ApJ, 671, L17
- Smith et al. (2000) Smith N, et al. 2000, ApJ, 532, L145
- Smith et al. (2003a) Smith N, Bally J, Morse, JA. 2003a, ApJ, 587, L105
- Smith et al. (2003b) Smith N, Gehrz RD, Hinz PM, Hoffmann WF, Hora JL, Mamajek EE, Meyer MR. 2003b, AJ, 125, 1458
- Smith et al. (2003c) Smith N, Davidson, Gull TR, Ishibashi K, Hillier DJ. 2003c, ApJ, 586, 432
- Smith et al. (2004a) Smith N, Bally J, Brooks KJ. 2004a, AJ, 127, 2793
- Smith et al. (2004b) Smith N, Barba RH, Walborn NR. 2004b, MNRAS, 351, 1457
- Smith et al. (2004c) Smith N, et al. 2004c, ApJ, 605, 405
- Smith et al. (2005a) Smith N, Stassun KG, Bally J. 2005a, AJ, 129, 888
- Smith et al. (2005b) Smith N, Zhekov SA, Heng K, McCray R, Morse JA, Gladders M. 2005b, ApJ, 635, L41
- Smith et al. (2008) Smith N, Chornock R, Li W, et al. 2008, ApJ, 686, 467
- Smith et al. (2009) Smith N, Ganeshalingam M, Chornock R, et al. 2009b, ApJ, 697, L49
- Smith et al. (2010a) Smith N, et al. 2010a, MNRAS, 406, 952
- Smith et al. (2010b) Smith N, Miller A, Li W, et al. 2010b, AJ, 139, 1451
- Smith et al. (2011) Smith N, et al. 2011, MNRAS, 415, 773
- Smith, Mauerhan, & Prieto (2014) Smith N, Mauerhan JC, Prieto JL. 2014, MNRAS, 438, 1191
- Smith et al. (2016a) Smith N, et al. 2016a, MNRAS, 455, 3546
- Smith et al. (2016b) Smith N, Andrews JE, Van Dyk SD, et al. 2016b, MNRAS, 458, 950
- Smith et al. (2018a) Smith N, Ginsburg A, Bally J. 2018a, MNRAS, 474, 4988
- Smith et al. (2018b) Smith N, Rest A, Andrews JE, et al. 2018b, MNRAS, in press
- Soker (2001) Soker N, 2001, MNRAS, 325, 584
- Soker (2004) Soker N, 2004, ApJ, 612, 1060
- Teodoro et al. (2008) Teodoro M, Damineli A, Sharp RG, Groh JH, Barbosa CL. 2008, MNRAS, 387, 564
- Thackeray (1950) Thackeray AD. 1950, MNRAS, 110, 524
- Thompson et al. (2009) Thompson TA, Prieto JL, Stanek KZ, Kistler MD, Beacom JF, Kochanek CS. 2009, ApJ, 705, 1364
- Tokovinin et al. (2006) Tokovinin AA, Thomas S, Sterzik M, Udry S. 2006, A&A, 450, 681
- Tylenda et al. (2011) Tylenda R, et al., 2011, A&A, 528, A114
- van Dokkum (2001) van Dokkum, PG. 2001, PASP, 113, 1420
- Van Dyk & Matheson (2012) Van Dyk SD, Matheson T, 2012, in Humphreys RM, Davidson K, eds, Eta Carinae and the Supernova Impostors. Springer, Berlin, 249
- van Marle et al. (2008) van Marle AJ, Owocki SP, Shaviv NJ. 2008, MNRAS, 389, 1353
- van Marle et al. (2009) van Marle AJ, Owocki SP, Shaviv NJ. 2009, MNRAS, 394, 595
- van Marle et al. (2010) van Marle AJ, Smith N, Owocki SP, van Veelen B. 2010, MNRAS, 407, 2305
- Verner et al. (2005) Verner E, Bruhweiler F, Gull T. 2005, ApJ, 624, 973
- Wade & Horne (1988) Wade RA, Horne KD. 1988, ApJ, 324, 411
- Walborn (1976) Walborn NR. 1976, ApJ, 204, L17
- Walborn (1995) Walborn NR. 1995, Rev. Mexicana Astron. Astrofis. Ser. Conf., 2, 51
- Walborn & Liller (1977) Walborn NR, Liller MH. 1977, ApJ, 211, 181
- Woosley (2017) Woosley SE. 2017, ApJ, 836, 244
- Woosley et al. (2007) Woosley SE, Blinnikov S, Heger A. 2007, Nature, 450, 390