Spectral Purification of Microwave Signals with Disciplined Dissipative Kerr Solitons
Abstract
Continuous-wave-driven Kerr nonlinear microresonators give rise to self-organization in terms of dissipative Kerr solitons, which constitute optical frequency combs that can be used to generate low-noise microwave signals. Here, by applying either amplitude or phase modulation to the driving laser we create an intracavity potential trap to discipline the repetition rate of the solitons. We demonstrate that this effect gives rise to a novel spectral purification mechanism of the external microwave signal frequency, leading to reduced phase noise of the output signal. We experimentally observe that the microwave signal generated from disciplined solitons is injection-locked by the external drive at long time scales, but exhibits an unexpected suppression of the fast timing jitter. Counter-intuitively, this filtering takes place for frequencies that are substantially lower than the cavity decay rate. As a result, while the long-time-scale stability of the Kerr frequency comb’s repetition rate is improved by more than 4 orders of magnitude, the purified microwave signal shows a reduction of the phase noise by 30 dB at offset frequencies above 10 kHz.
pacs:
Valid PACS appear hereIntroduction.—Low-noise microwave signals play a vital role in a wide range of industrial and scientific applications, including telecommunication networks Pozar (2001), radar/LIDAR systems Maleki (2011) as well as in fundamental research such as long baseline interferometry Grop et al. (2010a) and tests of fundamental constants Stanwix et al. (2005); Nagel et al. (2015). Traditionally, the microwave signals with the best spectral purity were provided by cryogenic microwave oscillators Grop et al. (2010b); Hartnett et al. (2012). Owing to the advancement of mode-locked-laser frequency combs and optoelectronics, new photonic-based ways of generating ultralow-noise microwaves have been proposed and demonstrated, such as optical frequency division Fortier et al. (2011); Quinlan et al. (2013); Xie et al. (2017), electro-optical frequency division Li et al. (2014), or Brillouin lasing in microresonators Li et al. (2013); Loh et al. (2016).
Recently, dissipative Kerr solitons (DKS) in optical microresonators Herr et al. (2014); Akhmediev and Ankiewicz (2005) have been attracting surging interests thanks to their self-organizing mechanism that results from the double-balance between nonlinearity and anomalous dispersion, as well as between parametric gain and cavity loss. DKS offer high coherence, broad bandwidth and microwave-repetition rate frequency combs (also referred to as soliton microcombs Kippenberg et al. (2018)), and have been applied successfully to ultrafast ranging Trocha et al. (2018); Suh and Vahala (2018), dual-comb spectroscopy Suh et al. (2016); Pavlov et al. (2017); Dutt et al. (2018), calibrating astrophysical spectrometer Obrzud et al. (2019); Suh et al. (2019), as well as optical frequency synthesis Spencer et al. (2018). Like mode-locked-laser frequency combs, soliton microcombs can function as a frequency link between the microwave/radio-frequency (RF) domain and the optical domain Papp et al. (2014); Del’Haye et al. (2016). In particular, microcomb-based microwave oscillators hold great promise of providing a robust, portable and power-efficient way to synthesize pure microwave tones Liang et al. (2015). In contrast to microresonator-based approaches of generating microwave signals using Brillouin lasers, the frequency of the generated signal is mainly determined by the cavity free spectral range (FSR), rather than the host material property of the resonator, thus offering control over the microwave center frequency. However, this flexibility comes at a price: reaching a good longterm stability requires the ability to control the comb repetition rate () and the carrier-envelope offset () and discipline them to optical references or RF clocks. To obtain such ability most previous efforts focused on using active feedback to correct thermal drifts and noises Jost et al. (2015); Huang et al. (2016) and utilizing sophisticated structure design for appropriate actuation Papp et al. (2013a); Del’Haye et al. (2016); Lim et al. (2017).
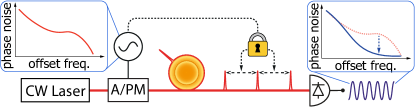
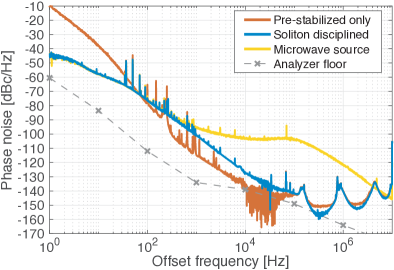
In this work, we use DKS in a crystalline microresonator to purify a 14.09 GHz microwave signal. The phase noise of the purified signal approaches -130 dBc/Hz at 10 kHz offset frequency, which is at the level achieved by the state-of-the-art microresonator-based optoelectronic oscillators and the previously reported best results obtained with undisciplined DKS and narrowband RF filter Maleki (2011); Liang et al. (2015). We adapt the microwave injection-locking technique that was previously used to stabilize modulation-instability (MI) combs Papp et al. (2013b, 2014) to discipline the soliton stream by creating intracavity potential gradient that traps the solitons. This mechanism not only relies on linear cavity filtering, but exploits further the dynamics of DKS, and allows to reduce substantially the phase noise of an external microwave drive. Owing to the dynamical attractor of the soliton state, the stability of the disciplined solitons exhibits strong robustness against incoherent perturbations contained in the injected signals Leo et al. (2010), thus efficiently dissipating noises in a coherent system. This self-purifying mechanism leads to the reduction of the injected microwave phase noise, allowing the nonlinear cavity in the soliton state to act as a passive spectral purifier that can improve the performance of an external off-the-shelf electronic oscillators. As depicted in Fig. 1, the disciplined-DKS-based microwave purifier constitutes in itself a -stabilized frequency comb and a spectrally pure microwave generator into a single device.
Experiment.—The experimental setup is shown in Fig. 2 (a). A 1555-nm laser is amplified by an Erbium-doped fiber amplifier (EDFA) and 200 mW optical power is coupled into a z-cut magnesium fluoride (MgF2) whispering-gallery-mode resonator with a FSR of GHz via a tapered fiber. A single-soliton-state DKS comb is generated by scanning the laser over a resonance with a loaded quality-factor () of to reach the step-like range where solitons are formed Herr et al. (2014). To stabilize the effective laser detuning with respect to the cavity resonance, we apply phase modulation to the laser with an electro-optic modulator (EOM) to generate Pound-Drever-Hall (PDH) error signals. The laser frequency is locked to the high-frequency PDH sideband by setting the lock point of the servo to the center of the sideband resonance which is indicated in Fig. 2 (e). The frequency of the laser is then compared with a tooth of a stabilized fiber-laser-based comb, and the frequency difference is stabilized at 20 MHz through a slow thermal actuation on the cavity by active control of the pump power with an acousto-optic modulator (AOM). As illustrated in Fig. 2 (c), with the two servos this “pre-stabilization” scheme stabilizes both the pump laser frequency and the pump-cavity detuning. As a result, the stability of is improved by up to 2 orders of magnitude at time scales of s (see Fig. 2 (f)), allowing the time-consuming measurement of phase noise via cross correlation to be carried out properly. One should note that the fiber-laser-based comb can be replaced with a laser stabilized by a reference cavity Matei et al. (2017) or an atomic vapor cell Liang et al. (2017), and that with improved thermal isolation Liang et al. (2015) or self-referenced stabilization Weng et al. (2015) the entire setup can be more compact.
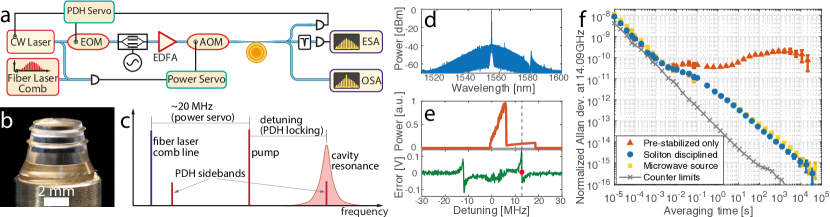
The injection locking of the soliton repetition rate is implemented by applying amplitude modulation (AM) or phase modulation (PM) on the pump laser, at a frequency close to the FSR. Intuitive illustrations of how the injection locking works are presented in Fig. 3 (a) and (b). From a frequency domain perspective, the modulation frequency defines through parametric four-wave-mixing. In the time domain, a modulated CW field traps solitons and disciplines correspondingly. In this proof-of-principle experiment we use a synthesizer to drive the AM/PM modulator but the input microwave signal could be derived from a frequency-multiplied clock oscillator or a voltage-controlled oscillator (VCO). The modulation frequency is swept around the free-running ( GHz) and we observe that is injection-locked by the input microwave signal. Fig. 3 (c) shows the evolution of the microwave spectrum of the DKS as we slowly swept the AM . When the difference between and the free-running is larger than Hz, multiple spectral components including (the strongest), (the second strongest) and multiple harmonics are observed in the spectra, indicating an absence of injection locking. As is approaching the free-running , the spectrum displays typical frequency-pulling effect as is pulled towards Razavi (2004). When the difference between and free-running is less than Hz all the spectral components merge into a major one, indicating that the is synchronized to , i.e. the soliton stream is locked to the external drive. We measured the frequency instabilities of the injected-locked against , which is also presented in Fig. 2 (f). The Allan deviation shows that at time scales of s the fluctuations of has been suppressed significantly – up to more than 4 orders of magnitude at averaging time of 1000 s, indicating that the disciplined DKS tightly follow the injected microwave frequency.
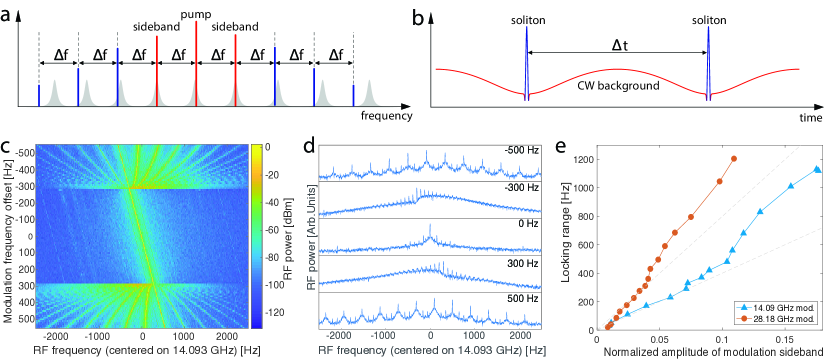
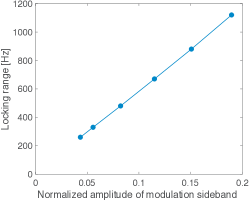
We acquire the locking range from the evolution of the RF spectrum, and repeat the measurement with varied modulation strength. As shown in Fig. 3 (e), with the normalized amplitude of the modulation sideband below 0.07, the locking range rises monotonically with almost perfect linearity as the modulation strength increases. With stronger modulation the slope of the locking range scaling increases, which is attributed to the appearance of higher-order modulation sidebands that increase the gradient of the potential and trap the solitons more effectively Taheri et al. (2017, 2015); Jang et al. (2015); Lobanov et al. (2015). For the same reason, we observe that the locking range increases by nearly a factor of 2 when we measure the locking range with around ( GHz).
Spectral purification effect.—To characterize the spectral purity at , the out-coupled soliton stream is filtered by fiber Bragg grating filters (FBG) to suppress the pump light and then amplified by an EDFA and subsequently attenuated to mW before being registered by a fast photodetector. We use a phase noise analyzer to measure the phase noise of the 14.09 GHz signal output by the photodetector. Fig. 4 presents the single-sideband (SSB) phase noise level when PM injection locking was performed. One should note that very similar results were also observed with AM injection locking. At low offset frequencies between 1 – 100 Hz the injection-locked DKS show improved noise level that is in agreement with the phase noise level of the input RF tone due to the better long-term frequency stability provided by the injected microwave signal, as confirmed by the Allan deviations. This result shows that the soliton stream is strictly disciplined by the potential trap at low frequency ranges. Remarkably, at offset above 100 Hz the spectrum of the injection-locked mostly maintains the intrinsic high quality, which is several orders of magnitude lower than the input microwave in terms of phase noise level. We note that this purifying effect cannot be explained by the cavity filtering since the frequency range where the purification is observed is orders of magnitude lower than the loaded cavity resonance bandwidth ( kHz). At offset frequencies above 30 kHz a reduction of the input microwave phase noise level by 30 dB is achieved, showing the exceptional spectral purifying ability of the disciplined DKS.
Simulation of soliton spectral purification.—In order to study the mechanism of the observed spectral purification, we performed simulations of PM-to-PM transfer function based on the Lugiato-Lefever equation (LLE) Lugiato and Lefever (1987). The model is similar to the one described in Guo et al. (2017), which is expressed as:
| (1) |
where and are the spectral and temporal envelopes of DKS respectively (related via ), is the cavity loss rate, is the single photon induced Kerr frequency shift, is the coupling rate and denotes the power of the laser pumping the central mode, is the Kronecker delta, and represents the ’th frequency component of the Fourier series. We include third oder dispersion in . A pair of PM sidebands are included in the last term of the equation, where indicates the amplitude of the modulation sidebands, and is the frequency difference between the FSR and the input microwave signal.
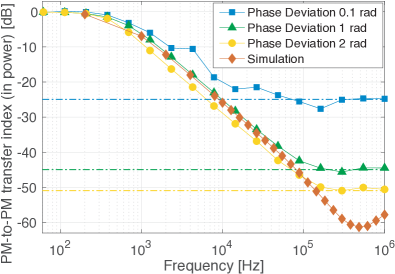
Adapting the technique used in Matsko and Maleki (2015), we introduce phase modulation on the microwave signal with phase deviation of 0.1 radian and varied modulation frequencies from 200 Hz to 1 MHz. The phases of the purified microwave signal can be derived from the comb spectra with
| (2) |
where is the frequency of the input microwave signal. We use pump power of 200 mW and for the numerical simulation SI . The results are presented in Fig. 5. The simulated transfer function follows a typical first-order lowpass filtering effect, showing a magnitude that is close to unity at low frequency (200 Hz). For higher offset frequencies the magnitude decreases with a slope of -20 dB/decade, reaching a minimum of dB around 500 kHz, thus revealing a significant phase noise suppression in the soliton state. To verify the simulated results, we apply PM with varied phase deviation on the injected microwave signal and record the resulting phase deviation on the soliton repetition rate with an in-phase-and-quadrature (IQ) demodulator SI . The experimentally measured transfer functions are plotted in the same figure. From the comparison we see that at low frequencies the experimental results and the simulation are in satisfactory agreement. However, at frequencies above kHz the experimental curves show flat floors, which are attributed to the detection noise floor introduced by the analyzer we use to perform the measurement. This instrumental noise floor is confirmed by increasing the modulation strength, which improves the dynamic range of our measurement.
Conclusion.—We have experimentally and numerically demonstrated a novel phase noise purifying mechanism by disciplining dissipative solitons with potential traps. The comb repetition rate drift, which is a major limitation in microcavities, was thereby suppressed, while this parameter was stabilized to a reference oscillator. The high frequency noise of the trapping signal was self-purified, at frequency offsets well below the cavity resonance bandwidth. Our technique reveals the unique dynamical stability of the self-organized temporal solitons. The exceptional phase noise level achieved with the purified microwaves shows that disciplined DKS are competitive with other state-of-the-art optical-microresonator-based microwave oscillators in terms of generating low-noise microwave signals with miniaturized device. It could also facilitate the application of microcombs in coherently averaged dual-comb spectroscopy Coddington et al. (2016) and coherent optical telecommunication Marin-Palomo et al. (2017).
This publication was supported by Contract D18AC00032 (Driven and Nonequilibrium Quantum Systems, DRINQS) from the Defense Advanced Research Projects Agency (DARPA), Defense Sciences Office (DSO) and funding from the Swiss National Science Foundation under grant agreement no. 163864 and no. 165933, and by the Russian Foundation for Basic Research under project 17-02-00522. W.W. acknowledges support by funding from the European Union’s Horizon 2020 research and innovation programme under Marie Sklodowska-Curie IF grant agreement no. 753749 (SOLISYNTH).
References
- Pozar (2001) D. M. Pozar, Microwave and RF design of wireless systems (Wiley New York, 2001).
- Maleki (2011) L. Maleki, Nature Photonics 5, 728 (2011).
- Grop et al. (2010a) S. Grop, P. Bourgeois, N. Bazin, Y. Kersalé, E. Rubiola, C. Langham, M. Oxborrow, D. Clapton, S. Walker, J. De Vicente, et al., Review of Scientific Instruments 81, 025102 (2010a).
- Stanwix et al. (2005) P. L. Stanwix, M. E. Tobar, P. Wolf, M. Susli, C. R. Locke, E. N. Ivanov, J. Winterflood, and F. van Kann, Physical review letters 95, 040404 (2005).
- Nagel et al. (2015) M. Nagel, S. R. Parker, E. V. Kovalchuk, P. L. Stanwix, J. G. Hartnett, E. N. Ivanov, A. Peters, and M. E. Tobar, Nature communications 6, 8174 (2015).
- Grop et al. (2010b) S. Grop, P.-Y. Bourgeois, R. Boudot, Y. Kersalé, E. Rubiola, and V. Giordano, Electronics Letters 46, 420 (2010b).
- Hartnett et al. (2012) J. G. Hartnett, N. R. Nand, and C. Lu, Applied Physics Letters 100, 183501 (2012).
- Fortier et al. (2011) T. M. Fortier, M. S. Kirchner, F. Quinlan, J. Taylor, J. Bergquist, T. Rosenband, N. Lemke, A. Ludlow, Y. Jiang, C. Oates, et al., Nature Photonics 5, 425 (2011).
- Quinlan et al. (2013) F. Quinlan, T. M. Fortier, H. Jiang, A. Hati, C. Nelson, Y. Fu, J. C. Campbell, and S. A. Diddams, Nature Photonics 7, 290 EP (2013).
- Xie et al. (2017) X. Xie, R. Bouchand, D. Nicolodi, M. Giunta, W. Hänsel, M. Lezius, A. Joshi, S. Datta, C. Alexandre, M. Lours, et al., Nature Photonics 11, 44 (2017).
- Li et al. (2014) J. Li, X. Yi, H. Lee, S. A. Diddams, and K. J. Vahala, Science 345, 309 (2014).
- Li et al. (2013) J. Li, H. Lee, and K. J. Vahala, Nature communications 4, 2097 (2013).
- Loh et al. (2016) W. Loh, J. Becker, D. C. Cole, A. Coillet, F. N. Baynes, S. B. Papp, and S. A. Diddams, New Journal of Physics 18, 045001 (2016).
- Herr et al. (2014) T. Herr, V. Brasch, J. Jost, C. Wang, N. Kondratiev, M. Gorodetsky, and T. Kippenberg, Nature Photonics 8, 145 (2014).
- Akhmediev and Ankiewicz (2005) N. Akhmediev and A. Ankiewicz, in Dissipative solitons (Springer, 2005) pp. 1–17.
- Kippenberg et al. (2018) T. J. Kippenberg, A. L. Gaeta, M. Lipson, and M. L. Gorodetsky, Science 361, eaan8083 (2018).
- Trocha et al. (2018) P. Trocha, M. Karpov, D. Ganin, M. H. Pfeiffer, A. Kordts, S. Wolf, J. Krockenberger, P. Marin-Palomo, C. Weimann, S. Randel, et al., Science 359, 887 (2018).
- Suh and Vahala (2018) M.-G. Suh and K. J. Vahala, Science 359, 884 (2018).
- Suh et al. (2016) M.-G. Suh, Q.-F. Yang, K. Y. Yang, X. Yi, and K. J. Vahala, Science 354, 600 (2016).
- Pavlov et al. (2017) N. Pavlov, G. Lihachev, S. Koptyaev, E. Lucas, M. Karpov, N. Kondratiev, I. Bilenko, T. Kippenberg, and M. Gorodetsky, Optics Letters 42, 514 (2017).
- Dutt et al. (2018) A. Dutt, C. Joshi, X. Ji, J. Cardenas, Y. Okawachi, K. Luke, A. L. Gaeta, and M. Lipson, Science advances 4, e1701858 (2018).
- Obrzud et al. (2019) E. Obrzud, M. Rainer, A. Harutyunyan, M. H. Anderson, J. Liu, M. Geiselmann, B. Chazelas, S. Kundermann, S. Lecomte, M. Cecconi, A. Ghedina, E. Molinari, F. Pepe, F. Wildi, F. Bouchy, T. J. Kippenberg, and T. Herr, Nature Photonics 13, 31 (2019).
- Suh et al. (2019) M.-G. Suh, X. Yi, Y.-H. Lai, S. Leifer, I. S. Grudinin, G. Vasisht, E. C. Martin, M. P. Fitzgerald, G. Doppmann, J. Wang, D. Mawet, S. B. Papp, S. A. Diddams, C. Beichman, and K. Vahala, Nature Photonics 13, 25 (2019).
- Spencer et al. (2018) D. T. Spencer, T. Drake, T. C. Briles, J. Stone, L. C. Sinclair, C. Fredrick, Q. Li, D. Westly, B. R. Ilic, A. Bluestone, et al., Nature 557, 81 (2018).
- Papp et al. (2014) S. B. Papp, K. Beha, P. Del’Haye, F. Quinlan, H. Lee, K. J. Vahala, and S. A. Diddams, Optica 1, 10 (2014).
- Del’Haye et al. (2016) P. Del’Haye, A. Coillet, T. Fortier, K. Beha, D. C. Cole, K. Y. Yang, H. Lee, K. J. Vahala, S. B. Papp, and S. A. Diddams, Nature Photonics 10, 516 (2016).
- Liang et al. (2015) W. Liang, D. Eliyahu, V. S. Ilchenko, A. A. Savchenkov, A. B. Matsko, D. Seidel, and L. Maleki, Nature communications 6, 7957 (2015).
- Jost et al. (2015) J. Jost, E. Lucas, T. Herr, C. Lecaplain, V. Brasch, M. Pfeiffer, and T. Kippenberg, Optics letters 40, 4723 (2015).
- Huang et al. (2016) S.-W. Huang, J. Yang, M. Yu, B. H. McGuyer, D.-L. Kwong, T. Zelevinsky, and C. W. Wong, Science advances 2, e1501489 (2016).
- Papp et al. (2013a) S. B. Papp, P. Del’Haye, and S. A. Diddams, Physical Review X 3, 031003 (2013a).
- Lim et al. (2017) J. Lim, A. A. Savchenkov, E. Dale, W. Liang, D. Eliyahu, V. Ilchenko, A. B. Matsko, L. Maleki, and C. W. Wong, Nature Communications 8, 8 (2017).
- Papp et al. (2013b) S. B. Papp, P. Del’Haye, and S. A. Diddams, Optics Express 21, 17615 (2013b).
- Leo et al. (2010) F. Leo, S. Coen, P. Kockaert, S.-P. Gorza, P. Emplit, and M. Haelterman, Nature Photonics 4, 471 (2010).
- Matei et al. (2017) D. G. Matei, T. Legero, S. Häfner, C. Grebing, R. Weyrich, W. Zhang, L. Sonderhouse, J. M. Robinson, J. Ye, F. Riehle, and U. Sterr, Phys. Rev. Lett. 118, 263202 (2017).
- Liang et al. (2017) W. Liang, A. A. Savchenkov, V. S. Ilchenko, D. Eliyahu, A. B. Matsko, and L. Maleki, IEEE Photonics Journal 9, 1 (2017).
- Weng et al. (2015) W. Weng, J. D. Anstie, P. Abbott, B. Fan, T. M. Stace, and A. N. Luiten, Physical Review A 91, 063801 (2015).
- Razavi (2004) B. Razavi, IEEE Journal of Solid-State Circuits 39, 1415 (2004).
- Taheri et al. (2017) H. Taheri, A. B. Matsko, and L. Maleki, The European Physical Journal D 71, 153 (2017).
- Taheri et al. (2015) H. Taheri, A. A. Eftekhar, K. Wiesenfeld, A. Adibi, et al., IEEE Photon. J. 7 (2015).
- Jang et al. (2015) J. K. Jang, M. Erkintalo, S. Coen, and S. G. Murdoch, Nature communications 6, 7370 (2015).
- Lobanov et al. (2015) V. E. Lobanov, G. Lihachev, and M. L. Gorodetsky, EPL (Europhysics Letters) 112, 54008 (2015).
- Lugiato and Lefever (1987) L. A. Lugiato and R. Lefever, Physical review letters 58, 2209 (1987).
- Guo et al. (2017) H. Guo, E. Lucas, M. H. P. Pfeiffer, M. Karpov, M. Anderson, J. Liu, M. Geiselmann, J. D. Jost, and T. J. Kippenberg, Physical Review X 7, 041055 (2017).
- Matsko and Maleki (2015) A. B. Matsko and L. Maleki, JOSA B 32, 232 (2015).
- (45) See Supplementary Material for details, which includes Refs. [48-50].
- Coddington et al. (2016) I. Coddington, N. Newbury, and W. Swann, Optica 3, 414 (2016).
- Marin-Palomo et al. (2017) P. Marin-Palomo, J. N. Kemal, M. Karpov, A. Kordts, J. Pfeifle, M. H. Pfeiffer, P. Trocha, S. Wolf, V. Brasch, M. H. Anderson, et al., Nature 546, 274 (2017).
- Yi et al. (2017) X. Yi, Q.-F. Yang, X. Zhang, K. Y. Yang, X. Li, and K. Vahala, Nature Communications 8, 14869 EP (2017).
- Wang et al. (2017) Y. Wang, F. Leo, J. Fatome, M. Erkintalo, S. G. Murdoch, and S. Coen, Optica 4, 855 (2017).
- Lucas et al. (2017) E. Lucas, H. Guo, J. D. Jost, M. Karpov, and T. J. Kippenberg, Phys. Rev. A 95, 043822 (2017).
Supplementary material for “Spectral purification of microwave signals with disciplined dissipative Kerr solitons”
I Locking range measurement with PM injection locking
In the main text we show the measured locking ranges with AM applied to the pump laser. We also measure the locking ranges with PM scheme and with varied PM strength, which are presented in Fig. 6. We note that the locking range can be influenced by mode coupling between different mode families (see the next section), and that the resulting effect on the locking range can vary with temperature and fiber-resonator coupling condition. However, the results show the similar linear dependence of the locking range on the modulation strength with relatively small PM strength.
II Mode crossings’ effect on the locking range
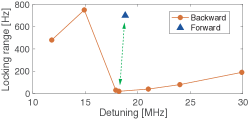
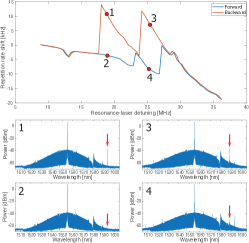
We apply PM injection locking by modulating the pump laser with frequencies close to the cavity FSR (14.09 GHz) with an EOM. We measure the locking ranges at different laser-resonance detunings but with the same PM strength. For the measurement the laser-resonance detuning is tuned from high frequency (30 MHz) to low frequency (11.8 MHz), which we referred to as backward tuning. We observe that the locking ranges change dramatically and erratically as the detuning changes, as presented in Fig. 7. Then we tune the detuning back to high frequency (forward tuning) and measure the locking range at detuning of 18.8 MHz, which is also presented in the same figure. From this comparison we observe strong bistability of the locking range at the almost same detuned positions, as indicated by the green double-arrow.
We suspect that such behavior is induced by the mode coupling between different mode families Guo et al. (2017), which can produce strong single-mode dispersive waves Yi et al. (2017) that can modulate the CW background and trap the solitons Wang et al. (2017) and consequently nullify the injection locking. To verify our speculation, we measure the DKS and the comb spectrum continuously as we tune the detuning backward and then forward. Fig. 8 shows the experimental results. Indeed, bistability of the repetition rate shows with different tuning directions, due to the appearance and disappearance of the single-mode dispersive waves that can shift through soliton recoil Lucas et al. (2017).
III Numerical simulation of PM-to-PM transfer function
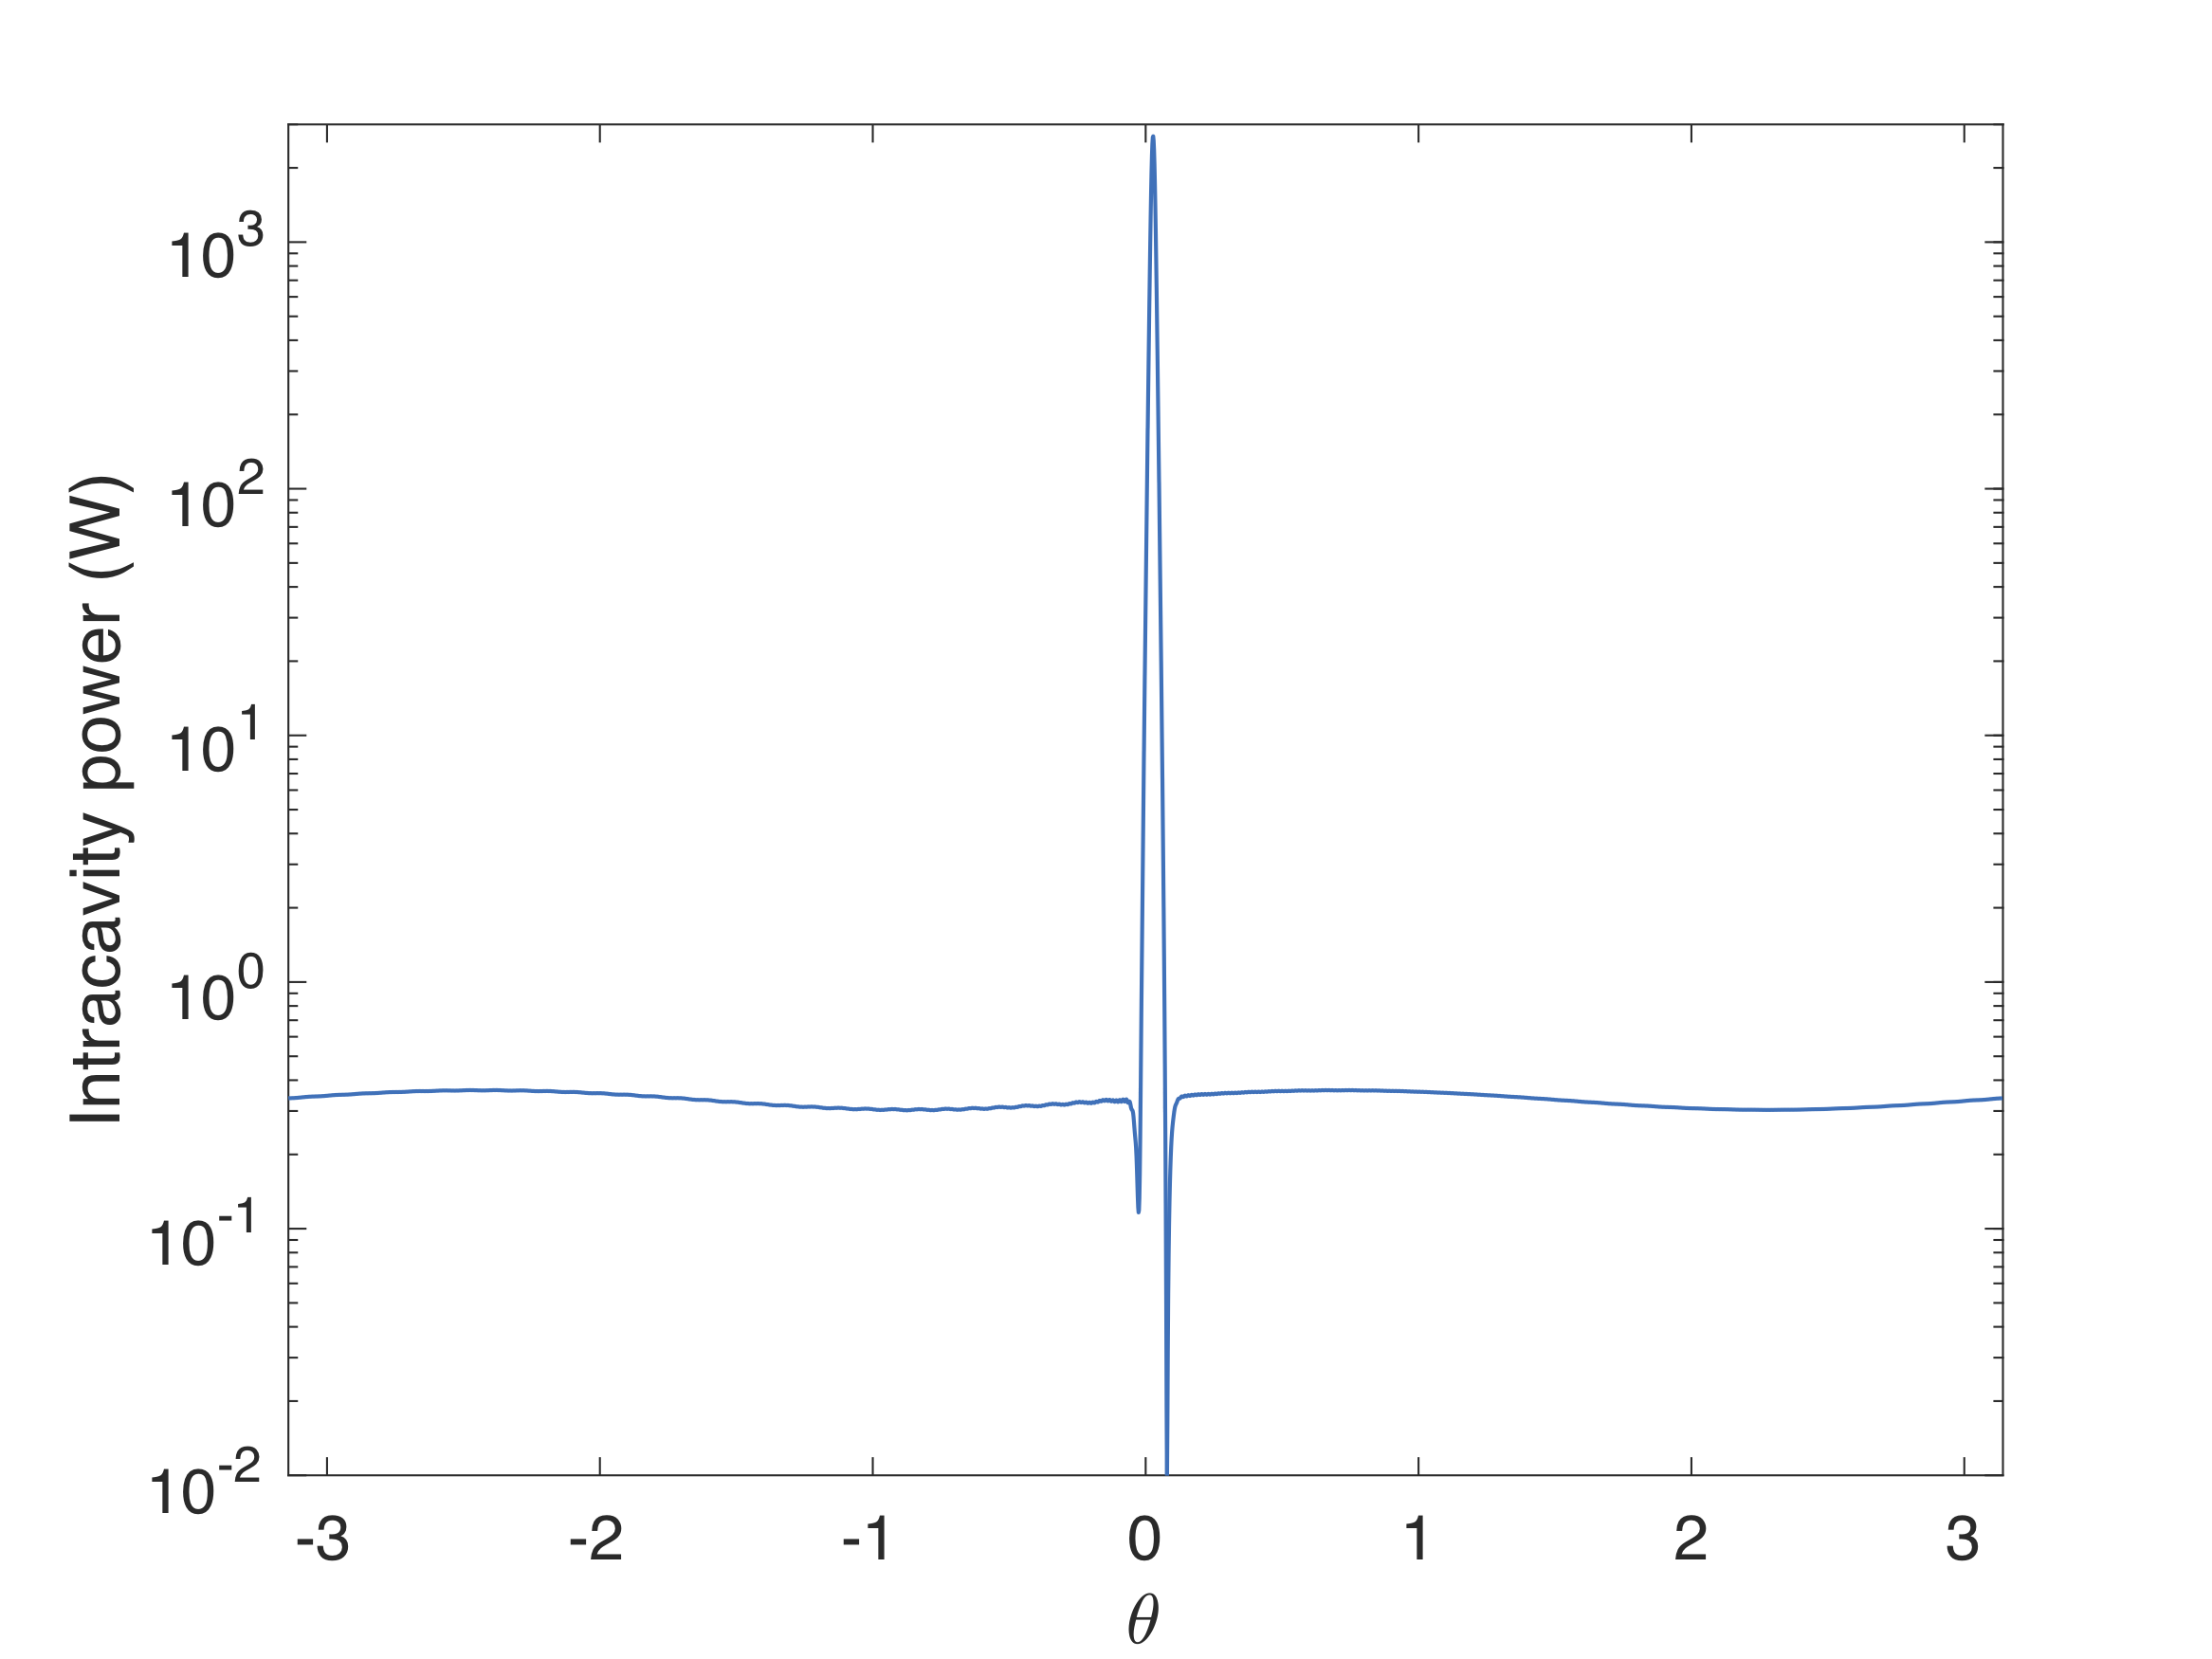
LLE-like model described in Guo et al. (2017) is used to perform the simulation with adaptive Runge-Kutta method. We include both the second-order dispersion ( kHz) and third-order dispersion ( Hz) in . Due to the high-order dispersion effect, the soliton repetition rate displays a frequency shift of kHz with respect to the cavity FSR (14 GHz). We set the input microwave signal () to match the repetition rate so the solitons can be trapped by the modulated intracavity background. The central pump power is 200 mW and the PM sideband power is set to be 10 mW, which corresponds to . After tens of photon decay time the position of the soliton with respect to the modulated background does not change anymore, indicating that is injection-locked. In Fig. 9 we plot the trapped soliton and the modulated intracavity background.
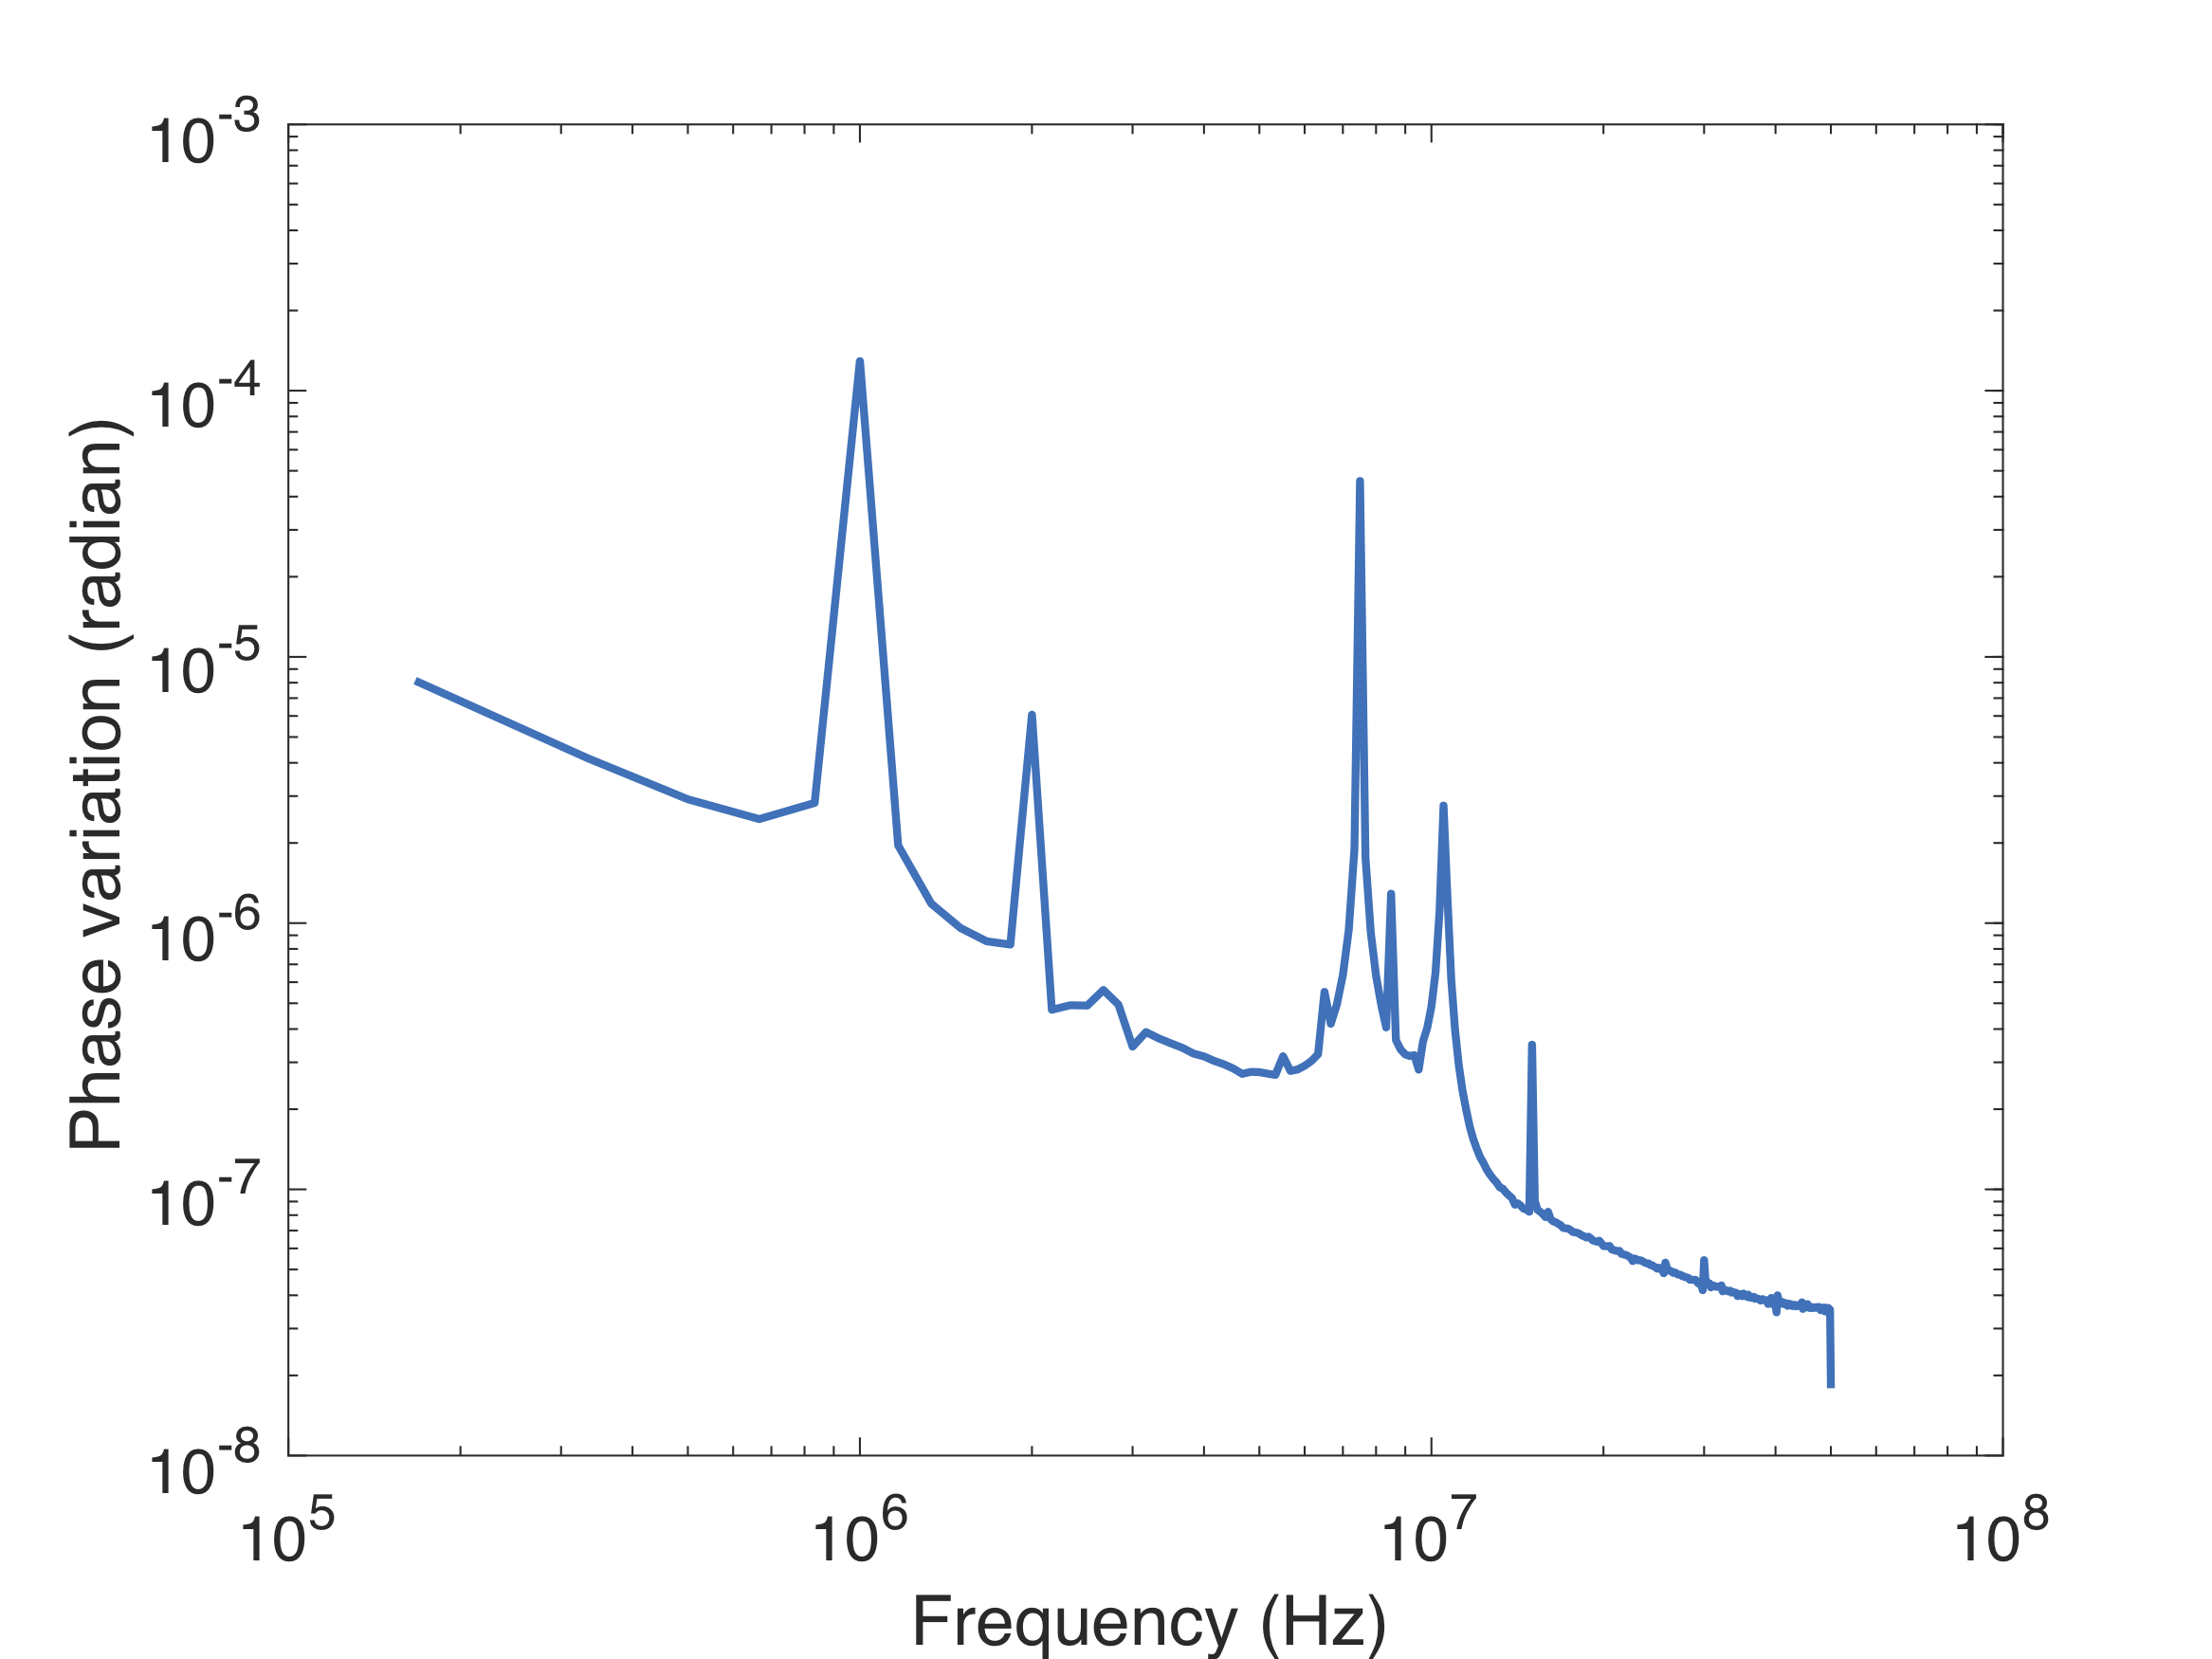
After the soliton is trapped, we apply PM on the injected microwave signal. This modulation is directly converted into PM on the optical modulation sidebands. We choose the modulation amplitude (PM deviation) to be 0.1 radian and let the simulation run for 8 – 20 modulation periods. The phase response of the disciplined soliton repetition rate is derived with Eq. 2 in the main text. Then we apply fast Fourier transform (FFT) on the phase response in the time domain to obtain the spectrum of the phase variation Matsko and Maleki (2015). Fig. 10 shows the spectrum of the phase variation of the injection-locked as PM at 1 MHz is applied to the optical modulation sidebands.
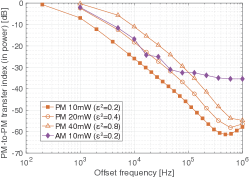
With the phase response spectrum we can calculate the PM-to-PM transfer indices at particular PM frequencies. We choose discrete PM frequencies from 200 Hz to 1 MHz to simulate the transfer function shown in the main text. For comparison, we also carry out simulations of PM injection locking with larger and AM injection locking. The simulated results are summarized in Fig. 11. As the modulation strength increases, the transfer function amplitude rises, showing that the soliton trapping bandwidth is enhanced. Moreover, AM injection locking exhibits higher transfer indices at offset frequencies higher than kHz.
IV Experimental measurement of PM-to-PM transfer function
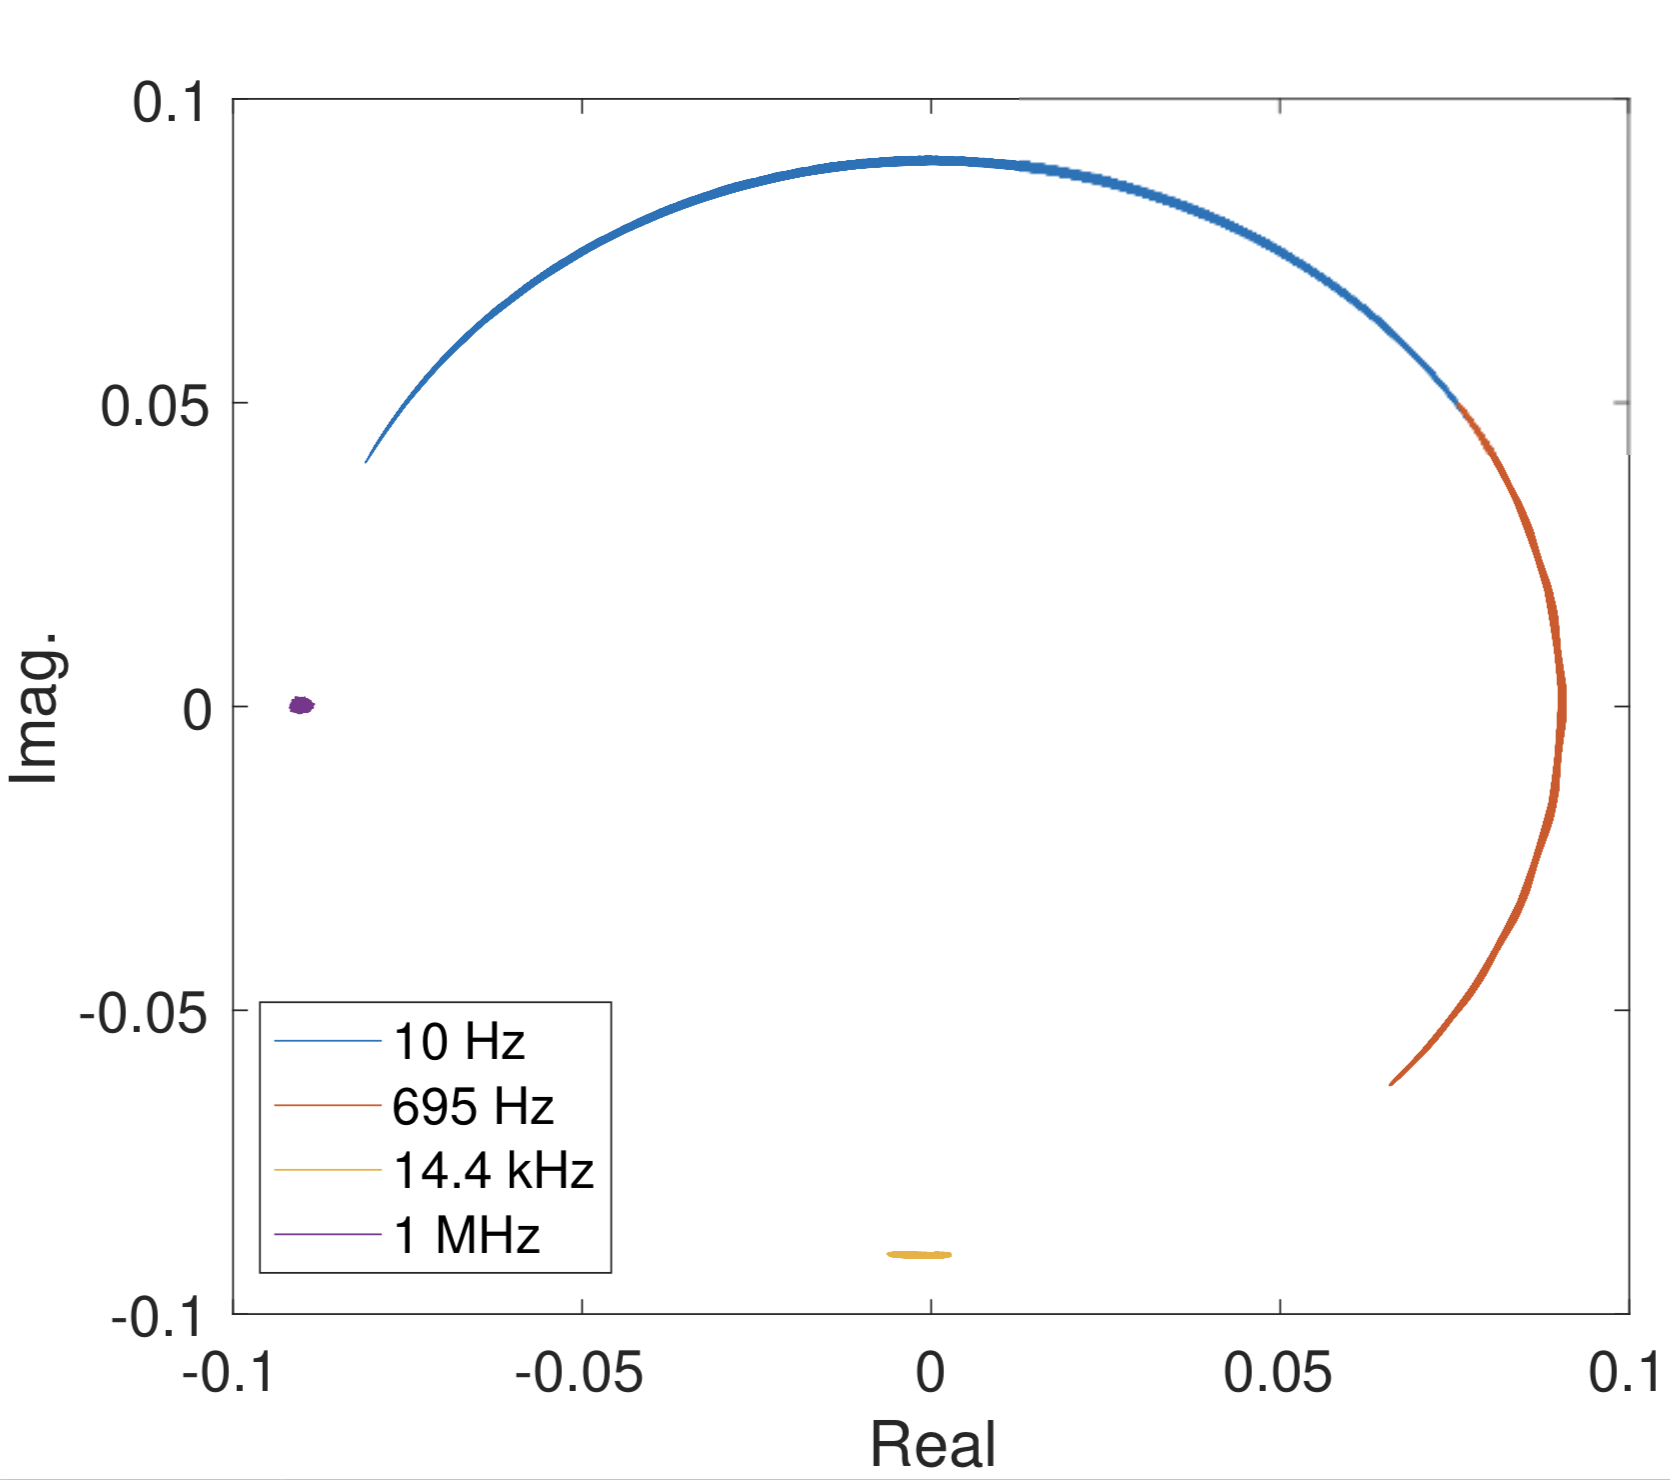
To verify the simulated PM-to-PM noise transfer function, we implement PM on the input microwave signals via internal function of the synthesizer that is used to drive the optical phase modulator. The PM amplitude is set to be 0.1 radian, 1 radian and 2 radian respectively. After the soliton repetition rate is injection locked, the PM on the microwave signals is activated, and the in-phase-and-quadrature (IQ) demodulation function of the spectrum analyzer is utilized to measure the phase and amplitude responses of the microwave signals generated by the fast photodetector that detects the DKS repetition rate. The demodulation frequency on the analyzer is set equal to the synthesizer frequency and both devices are referenced to a common clock oscillator. In Fig. 12 we plot the measured results of the IQ phasors at 4 different PM frequencies shown in the complex plane when the PM phase deviation is 0.1 radian. We note that the approach can also be used to measure the PM-to-AM noise transfer function.
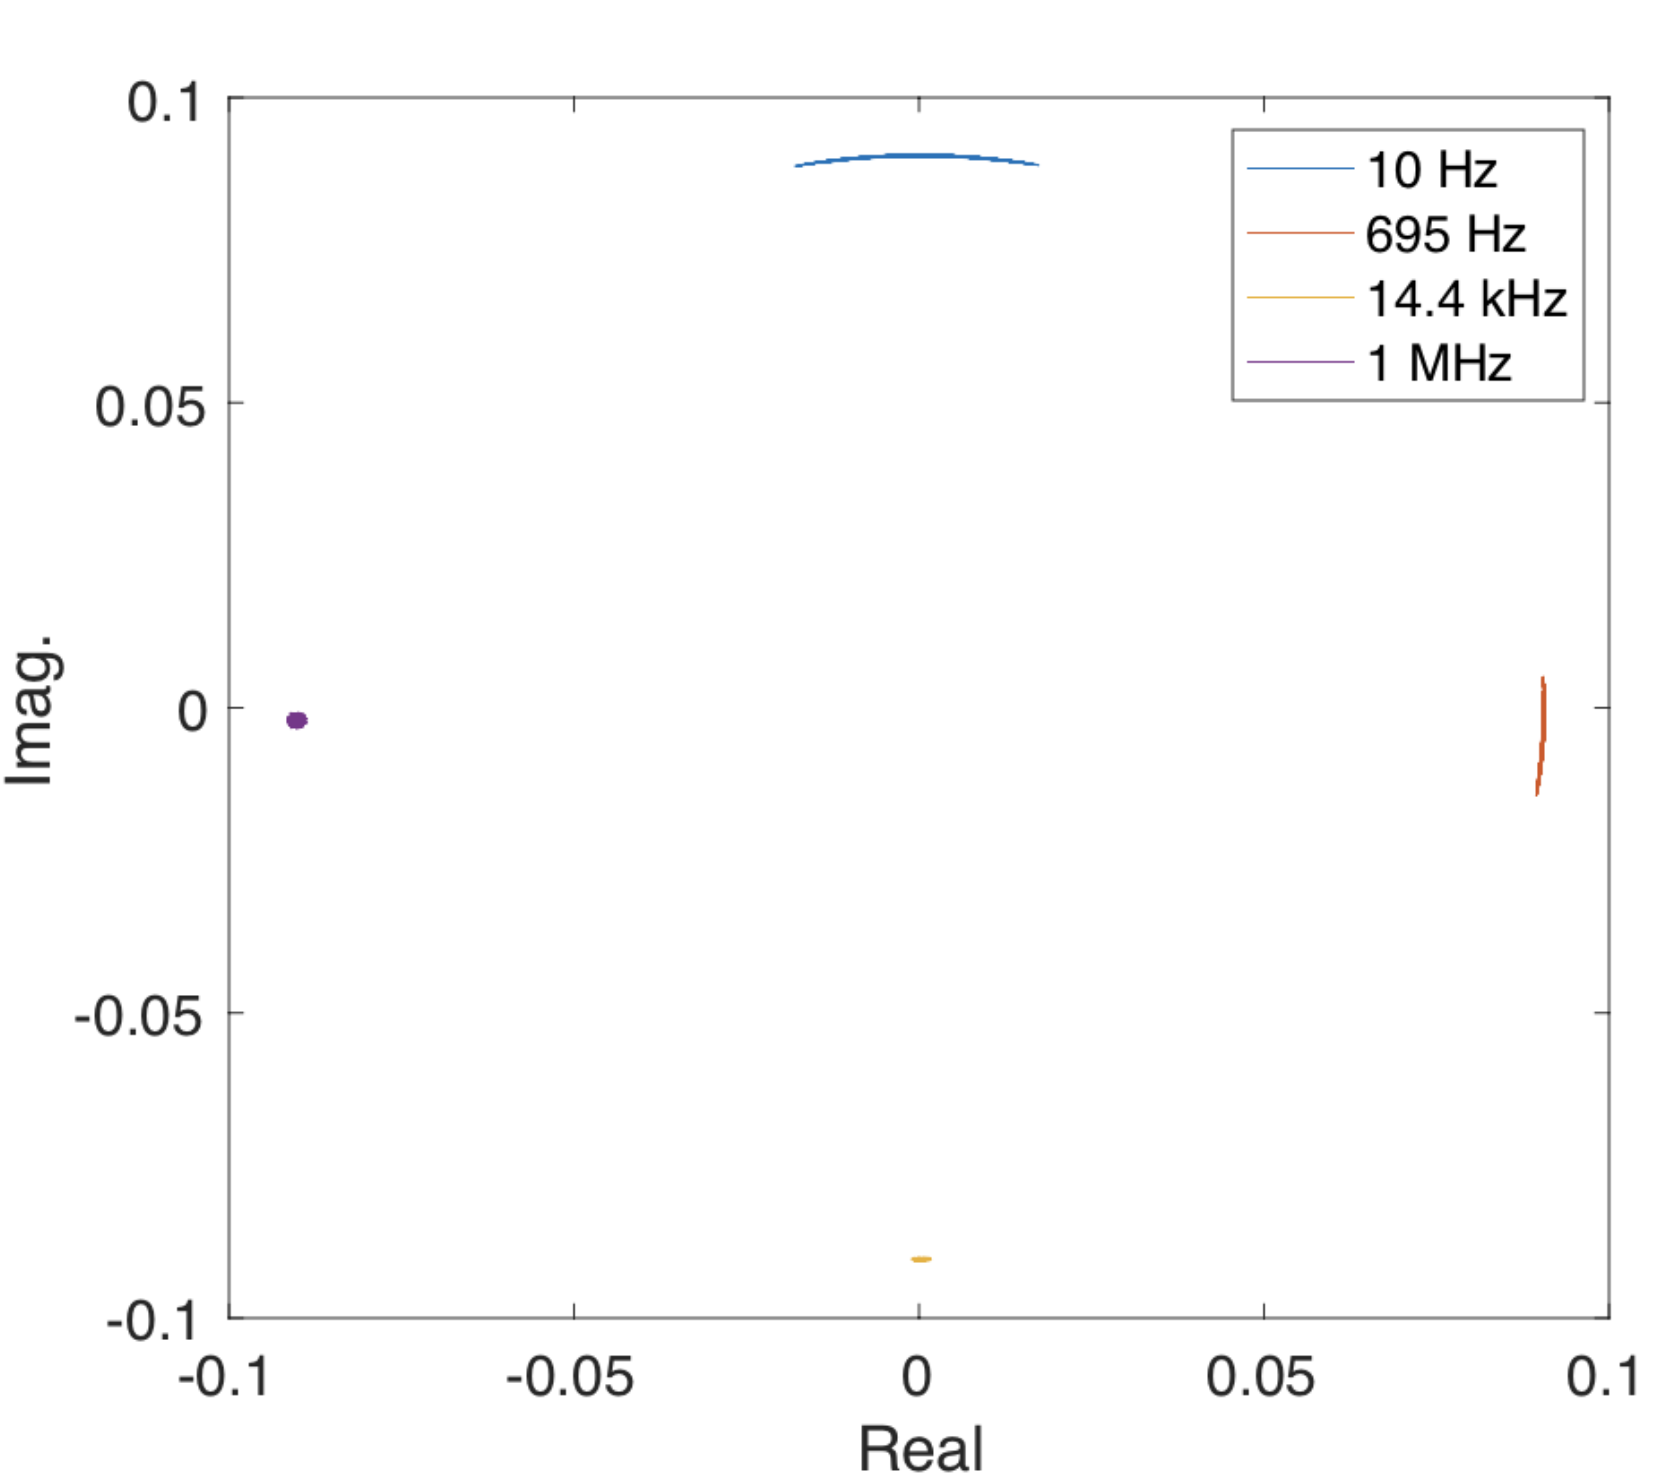
As shown in the main text, as the PM frequency on the input microwave signal increases, the phase deviation of the purified signal decreases. To quantify this effect, the phase deviation is extracted from the IQ measurement and the transfer function is obtained as . Eventually, the response amplitude is below the instrumental noise floor of the phase noise analyzer, which is evidently displayed as the flat floor on the transfer function at high frequencies. To increase the dynamical range of the measurement, the measurement is repeated with larger phase deviations (1 radian and 2 radians) on the modulation and re-take the IQ measurement. Fig. 13 shows 4 sets of measured results at 4 different PM frequencies. We see that at very high PM frequency (1 MHz) the response is limited to the same instrumental noise floor. However, because of the larger input phase deviation, the noise floor level of the transfer function decreases, as shown by Fig. 5 in the main text.