GeV-TeV -ray energy spectral break of BL Lac objects
Abstract
In this paper, we compile the very-high-energy and high-energy spectral indices of 43 BL Lac objects from the literature. Based on a simple math model, , we present evidence for the origin of an observed spectral break that is denoted by the difference between the observed very-high-energy and high-energy spectral indices, . We find by linear regression analysis that and . These results suggest that the extragalactic background light attenuation and the intrinsic curvature dominate on the GeV-TeV -ray energy spectral break of BL Lac objects. We argue that the extragalactic background light attenuation is an exclusive explanation for the redshift evolution of the observed spectral break.
Keywords BL Lacertae objects: general; radiation mechanisms: non-thermal; methods: statistical.
1 Introduction
BL Lac objects show that continuum emission, arising from the jet emission taking place in an AGN whose jet axis is closely aligned with the observer’s line of the sight, is dominated by non-thermal emission, as well as rapid and large amplitude variability. Their spectral energy distributions (SEDs) are characterized by two distinct broad bumps, implying two emission components (e.g., Paggi 2009). It is widely believed that the first bump is produced by electron synchrotron radiation. The second bump is probably produced by inverse Compton scattering off the relativistic electrons, either on the synchrotron photons (Maraschi et al., 1992) or on some other photon populations(Dermer et al. 1993; Sikora et al. 1994). These processes should result in a smooth spectrum in the -ray band. However, the SED shows a tendency with steepening toward higher energies (Costamante 2013; Dwek and Krennrich 2013). This tendency indicates a spectral break in different bands.
Extragalactic background light (EBL) is the diffuse and isotropic radiation fields from ultraviolet to far-infrared wavelengths (Hauser and Dwek, 2001). It plays an important role in the formation and evolution of stellar objects and galaxies. Since the very-high-energy (VHE, 100 GeV E 10TeV) -ray photons propagate through cosmic space, they can interact with EBL photons producing the electron-positron pairs (i.e., , e.g., Stecker et al. 1992; Stecker and
Jager 1998; Stecker
et al. 2006; Franceschini
et al. 2008), which will steepen the observed spectrum (Ackermann and Ajello 2012;
Sanchez et al. 2013). If the -ray radiation from BL Lacs cannot be attenuated by either the secondary cascade (Essey and Kusenko 2012; Zheng and Kang 2013; Zheng et al. 2016) or the axion-like particle conversion(Horns and Meyer 2012), we should expect a distinctive EBL attenuation characteristic (e.g., Kneiske
et al. 2004; Stecker
et al. 2006;
Imran and
Krennrich 2008; Franceschini
et al. 2008; Tavecchio and
Mazin 2009) at high energies in gamma-ray sources. Taking the EBL attenuation into account during the -ray propagation, we expect a difference in the observed high energy (HE, 100 MeV E 300GeV) and VHE spectrum of BL Lacs.
In order to determine the spectral break,
Domínguez and
Ajello (2015) selected 128 extragalactic sources from the second catalog of Fermi-LAT sources (2FHL), which is observed in HE bands extending in energy from 50 GeV to 2 TeV. Nevertheless, the study of the spectral break mechanism with the 2FHL catalog cannot explain the spectrum detected with energies higher than 2 TeV. Owing to the MAGIC, HESS, and VERITAS broadening of the 2FHL spectra (Funk 2012), we can study the relativistic particle acceleration (Holder 2012) and the spectral energy break. Additionally, the sources of the 2FHL catalog used by Domínguez and
Ajello (2015) included the flat spectrum radio quasars (FSRQs), whose GeV-TeV spectrum would be contributed by the photon populations of the broad line region (BLR) or of the accretion disk (Poutanen and Stern 2010; Ackermann and Ajello 2012). This results from without a significant EBL attenuation in the SED of FSRQs. Therefore, we focus on the spectra of BL Lacs.
In order to clarify the spectral break mechanism, in this paper we focus on the analysis of the GeV-TeV energy spectral index of the BL Lac objects. Our goal is to determine whether the EBL attenuation is the exclusive origin of the energy spectral break of the BL Lac objects. Since the observed spectrum is attenuated by EBL, we should obtain the absorption-corrected spectrum. In Section 2, we describe the sample; in Section 3, we compare the observed spectrum and intrinsic spectrum; in Section 4, we analyze the origin of spectral break; and in Section 5, we provide our conclusions and a discussion.
2 Sample Description
We compile the sources from the TeV catalog 111http://tevcat.uchicago.edu and Fermi LAT third source Catalog (3FGL)222http://www.asdc.asi.it/fermi3fgl/ to determine the spectral break. The TeV catalog provides the observed VHE spectral indices (Holder 2012), and the 3FGL Catalog provides the observed HE spectral indices. Since the intrinsic spectral indices (unattenuated by the EBL) cannot be obtained directly, we should correct to the observed VHE spectrum.
Generally, the observed VHE spectrum could be described by and the observed VHE spectrum could be described by , where , is the observed spectral index in the HE and VHE regimes, respectively. In most cases, the distinct attenuation signature on the spectrum appears above 100 GeV (Zheng and Kang 2013; Zheng et al. 2016), so it indicates that the observed HE spectral index is equivalent to the intrinsic HE spectral index (i.e.,). Compared to the observed VHE spectrum, the intrinsic VHE spectrum is an EBL-corrected spectrum, which could be obtained by the following equation (Albert et al. 2007, Raue and Mazin 2008):
| (1) |
where is the EBL absorption depth for a photon with energy traveling from a source at redshift . We use the average EBL model of Dwek and Krennrich (2005) to calculate and then obtain the intrinsic VHE spectral index.
Table 1 lists 43 observed and intrinsic VHE spectral indices (i.e., and ) and 43 HE spectral indices (i.e., ) that are associated with the VHE spectrum. According to the synchronous peak frequency, one of all sources is low-frequency-peaked BL Lacs (LBL, ), five sources are intermediate-frequency-peaked BL Lacs (IBL, ), and the other sources are high-frequency-peaked BL Lacs (HBL, ).
3 Comparing Observed Spectrum and Intrinsic Spectrum
In Figure 1 we show the distribution of the intrinsic spectral indices and observed spectral indices. It can be seen that the distributions of intrinsic spectral indices are concentrated in the region of a smaller index. We use the likelihood methodology described by Venters and Pavlidou (2007) to estimate the mean and spread of distributions. We find that the mean observed and intrinsic indices are and , respectively. These signatures are the certain results of EBL corrections. Since the value of the mean intrinsic index is less than the mean observed index, we thus believe that the intrinsic spectrum is a hard spectrum.
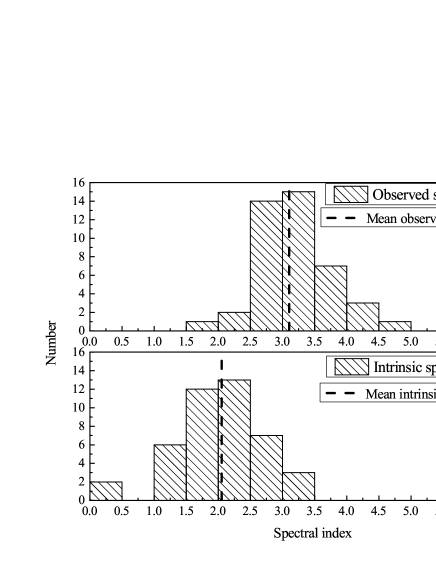
The spreads of the observed and intrinsic indices are and , respectively, and is obviously less than . In this case, we use a simple mathematical calculation to recalculate their spread, and the results are listed as follows: (1) for all of BL Lacs, and ; (2) for HBL objects, and .
We can see that the difference between and for HBL objects is small, while it is large for the case of all BL Lacs, which could also be applied to the case of maximum-likelihood spread. This indicates that the intrinsic property of the synchrotron peak may influence the variance of all BL Lacs. Additionally, the simulation of the intrinsic spectral index with different EBL models will bring some errors to the maximum-likelihood spread. If the above effects are not regarded, the differences between the observed and intrinsic likelihood spreads will be negligible, and it would also imply a similar confidence level for our work.
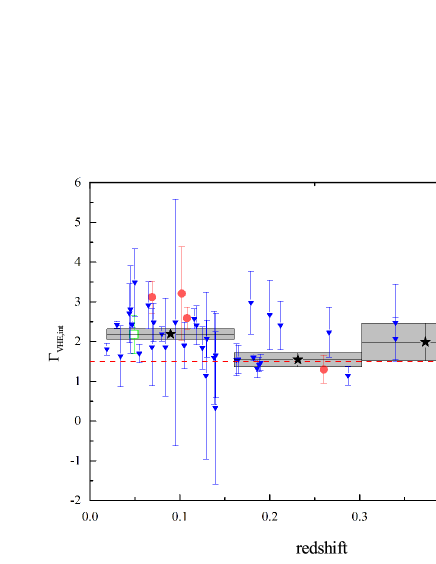
The redshift evolution of the intrinsic VHE spectral indices is shown in Figure 2. We can see the intrinsic spectral indices do not change with redshift. The median indices (black pentagrams) are in three redshift bins with their uncertainties, which are obtained by the distribution of sources in each redshift bin. The median cannot affect the distribution of the VHE intrinsic index. The intrinsic spectral index is obtained by the correction of the EBL, which would be expected to be softer than 1.5 (i.e., ), which directly links the intrinsic spectra with the observed spectra (Gilmore et al. 2012, Aharonian et al. 2006). Thus, we can see most of the sources are within 1 and their indices are above the horizontal line graphed with , which is typically taken as the hardest spectrum.
4 Analyzing Spectral Break
As first suggested by Stecker and Scully (2006); Stecker and Scully (2010), we employ the simple linear relation for determining the effect of EBL absorption on the observed spectral break. We then use a statistical analysis based on data from the Fermi and TeV catalogs of BL Lac objects to determine the parameters and . Based on the four power-law indices above (i.e., , , , and ), we analyze the difference between the observed and intrinsic indices; that is, the spectral break between the VHEs and HEs. Since the VHE -ray photons could be absorbed by the EBL, we should expect that any significant break in the measured spectrum is the result of EBL absorption (e.g., Sanchez et al. 2013). This results from the relations both and . Obviously, the EBL-induced break should increase linearly with the redshift , and we could expect a relationship with .
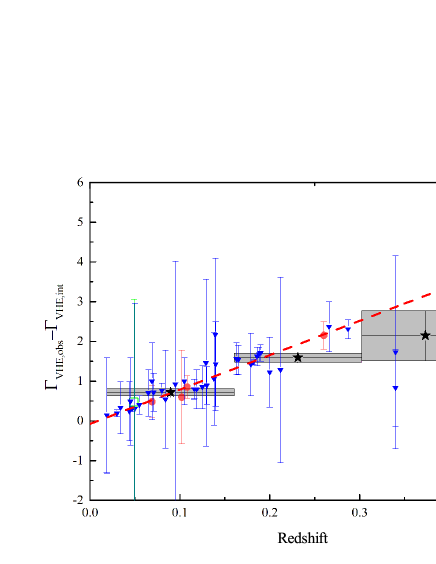
We now confirm the relationship between the EBL attenuation and redshift [i.e., ] using the observed results. The EBL attenuation can be represented as the difference between the observed and intrinsic VHE spectral index, e.g., . Figure 3 plots the evolution of the EBL attenuation with redshift (the red dotted line), which is compatible with the result of linear regression; that is, with a correlation coefficient . The influence of EBL attenuation cannot be removed due to , but that from other physical properties that are independent of redshift is negligible due to . This conclusion satisfies the correlation .
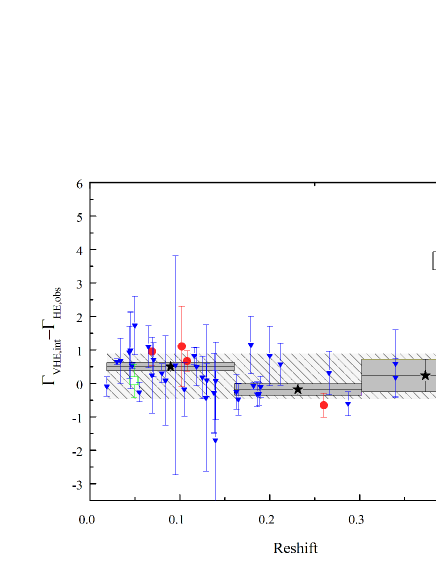
The observed spectral break could be represented as the difference between the observed VHE and HE spectral indices; that is, . Similarly, the intrinsic spectral break could be represented as the difference between the intrinsic VHE and HE spectral index; that is, . Therefore, we can obtain a relation of the observed spectral break and redshift; that is, , where we expect and is related to the intrinsic curvature (Stecker and Scully 2010; Domínguez and Ajello 2015). Corresponding to the relation of observed spectral break with redshift, we derived the best-fitting line (Figure 4, red dotted line) of the sample and its correlation coefficient, e.g., and . Since the the expression of the simulation shows that and , the observed spectral break is determined by EBL attenuation and intrinsic curvature. This conclusion also indicates why the correlation coefficient in Figure 4 is smaller than that in Figure 3.
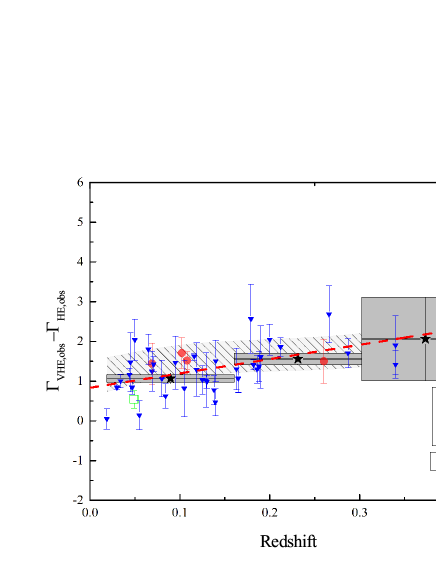
In this mathematical model, the value of relates to the intrinsic curvature that could be represented as the difference between the spectral index before and after the peak frequency(Chen 2014). Based on the above analysis, we must obtain the relationship between the observed spectral break and redshift using theoretical models. Using a synchronous self-Compton (SSC) model with a broken-power-law electron-energy distribution that can account for the intrinsic curvature (Paggi 2009) to simulate the SEDs of all BL Lacs, we calculate the model spectral break (Albert et al. 2007 and Aharonian et al. 2007a). We show the model results in a confidence level as a gray-shadow band in Figure 4. It can be seen that the evolution of the observed spectral break with redshift can be explained by the EBL attenuation.
The result of the evolution of the intrinsic spectral break (i.e., ) with redshift is shown in Figure 5. The intrinsic spectral break has not suffered from the affect of EBL since the intrinsic spectrum is an EBL unattenuated spectrum. As seen in Figure 5, the intrinsic spectral break is largely independent of redshift, and the distribution of the median also cannot affect this research. Then, we employ the SSC model to calculate the gray-shadow band, and this gray-shadow band is consistent with the relation . Combined with these methods, we find and , indicating that the EBL attenuation cannot affect the intrinsic spectral break, except for some physical processes (intrinsic curvature).
5 Conclusions and Discussion
In this paper, we compile the GeV-TeV energy spectral indices of 43 BL Lac objects to analyze the scatter of the -ray observed spectra and intrinsic spectra. We found that the mean observed index is significantly higher than the mean intrinsic index (i.e., for observed spectrum and for the intrinsic spectrum), implying that the intrinsic spectrum is a hard spectrum. It was also proved that the observed spectrum is attenuated by EBL, which would reduce the mean spectral index.
We focus on a relationship, , between the observed spectral break and redshift. Three cases exist for this mathematical model, as follows:
-
1.
When and , the equation can be replaced by the relationship between EBL attenuation and redshift, , which is not in accord with the observed spectral break. This shows that the EBL attenuation will change with redshift, especially for the high-redshift spectrum.
-
2.
When and , the origin of the observed spectral break can be affirmed by linear regression and the simulation of theoretical models (i.e., SSC and EBL models). The observed spectral break is determined by the EBL attenuation and the intrinsic curvature (some blazar physics processes) due to the facts that and .
-
3.
When and , the equation relates to the difference between the the intrinsic spectral index at VHEs and spectral index at HEs (intrinsic spectral break), . In this case, we only study the evolution of the intrinsic spectral break with redshift. The EBL attenuation is removed due to the property of the intrinsic spectral break. From the distribution of intrinsic break and the simulation, the intrinsic curvatures play a crucial role in the intrinsic spectral break, and they cannot evolve with redshift.
Owing to the statistical results, and , it is suggested that the observed spectral break is dominated by EBL attenuation and the intrinsic curvature (some blazar physics processes). This confirms that EBL attenuation is an origin for the observed spectral break that has evolved with redshift.
Although we have verified that the EBL attenuation is an origin for the observed spectral break of the BL Lac objects, according to the statistical results the study of will become indispensable. Some different methods can be used to simulate the spectrum, Tramacere et al. (2011) employed the log-parabolic-law (log-parabolic-law electron-energy distribution) SSC model to obtain the intrinsic curvature. However, our research employed the broken-power law SSC model to obtain it. Different methods will lead to different electron spectra, which could affect the intrinsic curvature. Additionally, the intrinsic curvature also can be interpreted by the Klein-Nishina suppression (emission effects) or a turnover in the distribution of the underlying emitting particles (acceleration effects, e.g., Sanchez et al. 2013.) The redshift evolution of the observed spectral break can be explained solely by EBL attenuation (without the secondary cascades or axion-like particle conversion), and there is also no evidence of evolution with redshift of the physics that drives the photon emission (Domínguez and Ajello 2015).
Acknowledgement We thank the anonymous referee for valuable comments and suggestions. This work is partially supported by the National Natural Science Foundation of China under grants 11463007, 11673060 and the Natural Science Foundation of Yunnan Province grants 2017FD072.
References
- Abramowski et al. (2013) Abramowski, A., Acero, F., Aharonian, F.: Astronomy & Astrophysics 554(3), 72 (2013)
- Abramowski et al. (2012a) Abramowski, A., Acero, F., Aharonian, F., Akhperjanian, A.G., Anton, G., Balzer, A.: Astronomy & Astrophysics 538, 103 (2012a)
- Abramowski et al. (2012b) Abramowski, A., Acero, F., Aharonian, F., Akhperjanian, A.G., Anton, G., Balzer, A., Barnacka, A., Becherini, Y., Becker, J.: Astronomy & Astrophysics 542, 94 (2012b)
- Abramowski et al. (2013a) Abramowski, A., Acero, F., Akhperjanian, A.G., Anton, G., Balenderan, S., Balzer, A.: Astronomy & Astrophysics 552(4), 118 (2013a)
- Abramowski et al. (2013b) Abramowski, A., Acero, F., Aharonian, F., Ait Benkhali, F., Akhperjanian, A.G., Ang ner, E., Anton, G., Balenderan, S., Balzer, A.: Astronomy & Astrophysics 559, 136 (2013b)
- Abramowski et al. (2013c) Abramowski, A., Acero, F., Aharonian, F., Akhperjanian, A.G., Ang ner, E., Anton, G., Balenderan, S., Balzer, A., Barnacka, A.: Monthly Notices of the Royal Astronomical Society 434(3), 1889 (2013c)
- Abramowski et al. (2015) Abramowski, A., Aharonian, F., Benkhali, F.A., Akhperjanian, A.G., Ang ner, E.: Astronomy & Astrophysics 573, 31 (2015)
- Acciari et al. (2008) Acciari, V.A., Aliu, E., Beilicke, M., Benbow, W., Boettcher, M., Bradbury, S.M., Buckley, J.H., Bugaev, V., Butt, Y., Celik, O.: The Astrophysical Journal Letters 684(2), 73 (2008)
- Acciari et al. (2009) Acciari, V.A., Aliu, E., Arlen, T., Beilicke, M., Benbow, W., Bottcher, M., Bradbury, S.M., Buckley, J.H., Bugaev, V.: The Astrophysical Journal Letters 721(2), 203 (2009)
- Acciari et al. (2010a) Acciari, V.A., Aliu, E., Arlen, T., Aune, T., Bautista, M., Beilicke, M., Benbow, W., Bottcher, M., Boltuch, D., Bradbury, S.M.: The Astrophysical Journal Letters 715(1), 49 (2010a)
- Acciari et al. (2010b) Acciari, V.A., Aliu, E., Beilicke, M., Benbow, W., Boltuch, D.: The Astrophysical Journal Letters 709(2), 163 (2010b)
- Acciari et al. (2010c) Acciari, V.A., Aliu, E., Arlen, T., Aune, T., Bautista, M., Beilicke, M., Benbow, W.: The Astrophysical Journal Letters 708(2), 100 (2010c)
- Acciari et al. (2011) Acciari, V.A., Aliu, E., Arlen, T., Aune, T., Beilicke, M., Benbow, W., Boltuch, D., Bradbury, S.M., Buckley, J.H., Bugaev, V.: Physics 738(1), 25 (2011)
- Acero et al. (2010) Acero, F., Aharonian, F., Akhperjanian, A.G., Anton, G., De Almeida, U.B.: Astronomy & Astrophysics 511, 52 (2010)
- Ackermann and Ajello (2012) Ackermann, M., Ajello, A. M.and Allafort: Science 338(6111), 1190 (2012)
- Aharonian et al. (2006) Aharonian, F., Akhperjanian, A.G., Bazer-Bachi, A.R.: Astronomy & Astrophysics 455(3), 461 (2006)
- Aharonian et al. (2007) Aharonian, F., Akhperjanian, A.G., Bazerbachi, A.R.: Astronomy & Astrophysics 470(2), 475 (2007)
- Aharonian et al. (2005) Aharonian, F., Akhperjanian, A.G., Bazer-Bachi, A.R., Beilicke, M., Benbow, W., Berge, D., Bernl?hr, K., Boisson, C., Bolz, V. O.; Borrel, coauthors, .: Astronomy & Astrophysics 442(3), 895 (2005)
- Aharonian et al. (2006) Aharonian, F., Akhperjanian, A.G., Bazer-Bachi, A.R., Beilicke, M., Benbow, W., Berge, D., Bernlhr, K., Boisson, C., Bolz, O., Borrel, V.: Nature 440(7087), 1018 (2006)
- Aharonian et al. (2007a) Aharonian, F., Akhperjanian, A.G., De Almeida, U.B., Bazer-Bachi, A.R., Behera, B., Beilicke, M.: Astronomy & Astrophysics 473(3), 25 (2007a)
- Aharonian et al. (2007b) Aharonian, F., Akhperjanian, A.G., De Almeida, U.B., Bazer-Bachi, A.R., Behera, B., Beilicke, M.: Astronomy & Astrophysics 477(2), 481 (2007b)
- Aharonian et al. (2007c) Aharonian, F., Akhperjanian, A.G., Almeida, U.B.D., Bazerbachi, A.R., Behera, B., Beilicke, M., Benbow, W., Bernlhr, K., Boisson, C., Bolz, O.: Astronomy & Astrophysics 475(2), 9 (2007c)
- Aharonian et al. (2008) Aharonian, F., Akhperjanian, A.G., de Almeida, U.B., Bazer-Bachi, A.R., Behera, B., Beilicke, M.: Astronomy& Astrophysics 481(3), 103 (2008)
- Aharonian et al. (2010) Aharonian, F., Akhperjanian, A.G., Anton, G., Almeida, U.B.D., Bazer-Bachi, A.R., Becherini, Y., Behera, B., Benbow, W.: Astronomy & Astrophysics 521, 69 (2010)
- Ahnen et al. (2016) Ahnen, M.L., Ansoldi, S., Antonelli, L.A., Antoranz, P., Babic, A., Banerjee, B., Bangale, P., Barres, U. de Almeida, Barrio, J.A., Becerra Gonz lez, J.: Monthly Notices of the Royal Astronomical Society 459(3), 3271 (2016)
- Ahnen et al. (2017) Ahnen, M.L., Ansoldi, S., Antonelli, L.A., Antoranz, P., Arcaro, C., Babic, A., Banerjee, B., Bangale, P., Almeida, U.B.D.: Monthly Notices of the Royal Astronomical Society 468(2), 1534 (2017)
- Albert et al. (2007) Albert, J., Aliu, E., Anderhub, H.: The Astrophysical Journal 662(2), 892 (2007)
- Albert et al. (2006a) Albert, J., Aliu, E., Anderhub, H., Antoranz, P., Armada, A.: The Astrophysical Journal Letters 648(2), 105 (2006a)
- Albert et al. (2006b) Albert, J., Aliu, E., Anderhub, H., Antoranz, P., Armada, A., Baixeras, C.: The Astrophysical Journal 662(2), 892 (2006b)
- Albert et al. (2007) Albert, J., Aliu, E., Anderhub, H., Antoranz, P.: The Astrophysical Journal 667(1), 21 (2007)
- Aleksić et al. (2012a) Aleksić, J., Alvarez, E.A., Antonelli, L.A., Antoranz, P., Asensio, M., Backes, M.: Astronomy & Astrophysics, 539, 118 (2012a)
- Aleksić et al. (2012b) Aleksić, J., Alvarez, E.A., Antonelli, L.A., Antoranz, P., Ansoldi, S., Asensio, M., Backes, M., Barres de Almeida, U., Barrio, J.A., Bastieri, D., coauthors, .: Astronomy & Astrophysics 544, 142 (2012b)
- Aleksić et al. (2014a) Aleksić, J., Ansoldi, S., Antonelli, L.A., Antoranz, P., Babic, A., Bangale, P., Almeida, U.B.D., Barrio, J.A., Gonz lez, J.B., Bednarek, W.: Astronomy & Astrophysics 563(3), 90 (2014a)
- Aleksić et al. (2014b) Aleksić, J., Antonelli, L.A., Antoranz, P., Babic, A., Almeida, U.B.D., Barrio, J.A., Gonz lez, J.B., Bednarek, W., Berger, K.: Astronomy & Astrophysics 563(1), 91 (2014b)
- Aleksić et al. (2016) Aleksić, J., Ansoldi, S., Antonelli, L.A., Antoranz, P., Arcaro, C., Babic, A., Bangale, P., Barres de Almeida, U., Barrio, J.A., Becerra Gonz lez, J., coauthors, .: Astronomy & Astrophysics 591, 10 (2016)
- Aliu et al. (2012) Aliu, E., Archambault, S., Arlen, T., Aune, T., Beilicke, M.: The Astrophysical Journal 750(2), 94 (2012)
- Anderhub et al. (2009) Anderhub, H., Antonelli, L.A., Antoranz, P., Backes, M., Baixeras, C.: The Astrophysical Journal Letters, 704(2), 129 (2009)
- Archambault et al. (2013) Archambault, S., Arlen, T., Aune, T., Beilicke, M., Benbow, W., Bird, R., Bouvier, A., Buckley, J.H., Bugaev, V.: The Astrophysical Journal 776(2), 69 (2013)
- Archambault et al. (2015) Archambault, S., Archer, A., Beilicke, M., Benbow, W., Bird, R., Biteau, J., Bouvier, A., Bugaev, V., Cardenzana, J.V., Cerruti, M.: The Astrophysical Journal 808(2), 110 (2015)
- Archambault et al. (2016) Archambault, S., Archer, A., Barnacka, A., Behera, B., Beilicke, M., Benbow, W., Berger, K., Bird, R., Bttcher, M., Buckley, J.H.: Monthly Notices of the Royal Astronomical Society 461(1), 202 (2016)
- Chen (2014) Chen, L.: The Astrophysical Journal 788(2), 179 (2014)
- Costamante (2013) Costamante, L.: International Journal of Modern Physics D 22(13), 1330025 (2013)
- Dermer et al. (1993) Dermer, Charles, D., Schlickeiser, Reinhard: The Astrophysical Journal 416(2), 458 (1993)
- Domínguez and Ajello (2015) Domínguez, A., Ajello, M.: The Astrophysical Journal Letters 813(2), 34 (2015)
- Dwek and Krennrich (2013) Dwek, E., Krennrich, F.: Astroparticle Physics 43, 112 (2013)
- Dwek and Krennrich (2005) Dwek, E., Krennrich, F.: The Astrophysical Journal 618(2), 657 (2005)
- Errando (2011) Errando, M.: arXiv preprint arXiv:1111.1209 (2011)
- Essey and Kusenko (2012) Essey, W., Kusenko, A.: The Astrophysical Journal Letters 751(1), 11 (2012)
- Franceschini et al. (2008) Franceschini, A., Rodighiero, G., Vaccari, M.: Astronomy & Astrophysics 487(3), 837 (2008)
- Funk (2012) Funk, S.: arXiv preprint arXiv:1204.4529 (2012)
- Gilmore et al. (2012) Gilmore, R.C., Somerville, R.S., Primack, J.R., Domínguez, A.: Monthly Notices of the Royal Astronomical Society 422(4), 3189 (2012)
- Hauser and Dwek (2001) Hauser, M.G., Dwek, E.: Annual Review of Astronomy & Astrophysics 39(1), 249 (2001)
- Holder (2012) Holder, J.: Astroparticle Physics 39-40(1), 61 (2012)
- Horns and Meyer (2012) Horns, D., Meyer, M.: Journal of Cosmology and Astroparticle Physics 2012(2), 033 (2012)
- Imran and Krennrich (2008) Imran, A., Krennrich, F.: ICRC 3, 981 (2008)
- Kneiske et al. (2004) Kneiske, T.M., Bretz, T., Mannheim, K., Hartmann, D.H.: Astronomy & Astrophysics 413(3), 807 (2004)
- Maraschi et al. (1992) Maraschi, L., Ghisellini, G., Celotti, A.: The Astrophysical Journal 397(1), 5 (1992)
- Mueller et al. (2011) Mueller, C., Akhter, N., Ball, J., Bramel, D.A., Carson, J., Covault, C.E., Driscoll, D., Fortin, P., Gingrich, D.M., Hanna, D.S.: Astroparticle Physics 34(9), 674 (2011)
- Paggi (2009) Paggi, A.: Flares in blazars. PhD thesis, Roma:degli di Rome Universitá. (2009)
- Poutanen and Stern (2010) Poutanen, J., Stern, B.: The Astrophysical Journal Letters 717(2), 118 (2010)
- Prokoph et al. (2015) Prokoph, H., Becherini, Y., B’́ottcher, M., Boisson, C., Lenain, J.P.: International Cosmic Ray Conference 34, 862 (2015)
- Raue and Mazin (2008) Raue, M., Mazin, D.: International Journal of Modern Physics D 17(09), 1515 (2008)
- Sanchez et al. (2013) Sanchez, D.A., Fegan, S., Giebels, B.: Astronomy & Astrophysics 554, 75 (2013)
- Sikora et al. (1994) Sikora, M., Begelman, M.C., Rees, M.J.: The Astrophysical Journal 421, 153 (1994)
- Stecker and Jager (1998) Stecker, F.W., Jager, O.C.D.: Astronomy & Astrophysics 334, 85 (1998)
- Stecker and Scully (2006) Stecker, F.W., Scully, S.T.: The Astrophysical Journal 652(1), 9 (2006)
- Stecker et al. (1992) Stecker, F.W., De Jager, O.C., Salamon, M.H.: The Astrophysical Journal 390(2), 49 (1992)
- Stecker et al. (2006) Stecker, F.W., Malkan, M.A., Scully, S.T.: The Astrophysical Journal 648(2), 774 (2006)
- Stecker and Scully (2010) Stecker, F.W., Scully, S.T.: The Astrophysical Journal Letters 709(2), 124 (2010)
- Tavecchio and Mazin (2009) Tavecchio, F., Mazin, D.: Monthly Notices of the Royal Astronomical Society Letters 392(1), 40 (2009)
- Tramacere et al. (2011) Tramacere, A., Massaro, E., Taylor, A.M.: The Astrophysical Journal 739(2), 66 (2011)
- Venters and Pavlidou (2007) Venters, T.M., Pavlidou, V.: The spectral index distribution of egret blazars: Prospects for glast, vol. 666, p. 128 (2007)
- Zheng and Kang (2013) Zheng, Y.G., Kang, T.: The Astrophysical Journal 764(2), 113 (2013)
- Zheng et al. (2016) Zheng, Y.G., Yang, C.Y., Kang, S.J.: Astronomy & Astrophysics 585, 8 (2016)
| Name | Telescope | Type | Redshift | Refernce | |||
|---|---|---|---|---|---|---|---|
| 1ES 0033+595 | MAGIC | HBL | 0.34 | 1.90 0.04 | 3.80 0.70 | 2.07 0.53 | Aleksić et al. (2014a) |
| 1ES 0229+200 | HESS | HBL | 0.1396 | 2.03 0.15 | 2.50 0.19 | 0.33 1.92 | Aharonian et al. (2007c) |
| 1ES 0347-121 | HESS | HBL | 0.188 | 1.73 0.16 | 3.10 0.23 | 1.42 0.18 | Aharonian et al. (2007a) |
| 1ES 0414+009 | HESS | HBL | 0.287 | 1.75 0.11 | 3.45 0.25 | 1.14 0.24 | Abramowski et al. (2012a) |
| 1ES 0806+524 | MAGIC | HBL | 0.138 | 1.88 0.02 | 2.65 0.34 | 1.59 1.17 | Aleksić et al. (2016) |
| 1ES 1011+496 | MAGIC | HBL | 0.212 | 1.83 0.02 | 3.69 0.22 | 2.41 0.61 | Aleksić et al. (2016) |
| 1ES 1101-232 | HESS | HBL | 0.186 | 1.64 0.14 | 2.94 0.20 | 1.32 0.23 | Aharonian et al. (2007) |
| 1ES 1215+303 | MAGIC | HBL | 0.13 | 1.97 0.02 | 2.96 0.14 | 2.07 0.47 | Aleksić et al. (2012b) |
| 1ES 1218+304 | VERITAS | HBL | 0.182 | 1.66 0.04 | 3.07 0.09 | 1.59 0.07 | Acciari et al. (2010b) |
| 1ES 1312-423 | HESS | HBL | 0.105 | 2.08 0.21 | 2.90 0.50 | 1.9 0.59 | Abramowski et al. (2013c) |
| 1ES 1440+122 | VERITAS | HBL | 0.163 | 1.80 0.12 | 3.10 0.40 | 1.54 0.4 | Archambault et al. (2016) |
| 1ES 1727+502 | VERITAS | HBL | 0.055 | 1.96 0.06 | 2.10 0.30 | 1.7 0.23 | Archambault et al. (2015) |
| 1ES 1741+196 | MAGIC | HBL | 0.084 | 1.78 0.11 | 2.40 0.20 | 1.86 1.23 | Ahnen et al. (2017) |
| 1ES 1959+650 | MAGIC | HBL | 0.047 | 1.88 0.02 | 2.72 0.14 | 2.42 0.06 | Albert et al. (2006b) |
| 1ES 2344+514 | MAGIC | HBL | 0.044 | 1.78 0.04 | 2.95 0.12 | 2.71 0.74 | Albert et al. (2007) |
| 1RXS J101015.9 | HESS | HBL | 0.14 | 1.58 0.10 | 3.08 0.42 | 1.65 1.06 | Abramowski et al. (2012b) |
| 3C 66A | VERITAS | IBL | 0.444 | 1.88 0.02 | 4.10 0.40 | 0.33 0.10 | Acciari et al. (2009) |
| AP Librae | HESS | LBL | 0.049 | 2.11 0.03 | 2.65 0.19 | 2.18 0.48 | Abramowski et al. (2015) |
| B3 2247+381 | MAGIC | HBL | 0.1187 | 1.91 0.07 | 3.20 0.60 | 2.41 0.49 | Aleksić et al. (2012a) |
| BL Lacertae | MAGIC | IBL | 0.069 | 2.16 0.017 | 3.60 0.50 | 3.12 0.4 | Albert et al. (2007) |
| H 1426+428 | HEGRA | HBL | 0.129 | 1.57 0.09 | 2.60 0.60 | 1.14 2.1 | Mueller et al. (2011) |
| H 1722+119 | MAGIC | HBL | 0.34 | 1.89 0.05 | 3.30 0.30 | 2.47 0.97 | Ahnen et al. (2016) |
| H 2356-309 | HESS | HBL | 0.165 | 2.02 0.12 | 3.09 0.24 | 1.55 0.36 | Aharonian et al. (2006) |
| IC 310 | MAGIC | HBL | 0.0189 | 1.90 0.14 | 1.95 0.12 | 1.81 0.15 | Aleksić et al. (2014b) |
| Markarian 180 | MAGIC | HBL | 0.045 | 1.82 0.05 | 3.30 0.70 | 2.81 1.1 | Albert et al. (2006a) |
| Markarian 421 | MAGIC | HBL | 0.03 | 1.77 0.008 | 2.61 0.03 | 2.42 0.09 | Acciari et al. (2011) |
| Markarian 501 | VERITAS | HBL | 0.034 | 1.72 0.02 | 2.72 0.15 | 2.39 0.65 | TeV Catalogue |
| PG 1553+113 | HESS | HBL | 0.42 | 1.60 0.03 | 4.46 0.34 | 1.9 1.77 | Aharonian et al. (2007b) |
| PKS 0301-243 | HESS | HBL | 0.266 | 1.92 0.03 | 4.60 0.70 | 2.23 0.63 | Abramowski et al. (2013b) |
| PKS 0447-439 | HESS | HBL | 0.20 | 1.85 0.02 | 3.89 0.37 | 2.67 0.88 | Abramowski et al. (2013a) |
| PKS 0548-322 | HESS | HBL | 0.069 | 1.61 0.16 | 2.86 0.34 | 1.86 0.97 | Aharonian et al. (2010) |
| PKS 1424+240 | VERITAS | HBL | 0.05 | 1.76 0.026 | 3.80 0.50 | 3.49 0.85 | Acciari et al. (2010c) |
| PKS 1440-389 | HESS | HBL | 0.065 | 1.81 0.04 | 3.61 0.34 | 2.91 0.59 | Prokoph et al. (2015) |
| PKS 2005-489 | HESS | HBL | 0.071 | 1.77 0.03 | 3.20 0.16 | 2.48 0.48 | Acero et al. (2010) |
| PKS 2155-304 | HESS | HBL | 0.116 | 1.75 0.02 | 3.37 0.07 | 2.57 0.25 | Aharonian et al. (2005) |
| RBS 0413 | VERITAS | HBL | 0.19 | 1.57 0.10 | 3.18 0.68 | 1.47 0.21 | Aliu et al. (2012) |
| RGB J0152+017 | HESS | HBL | 0.08 | 1.89 0.10 | 2.95 0.36 | 2.19 0.18 | Aharonian et al. (2008) |
| RGB J0710+591 | VERITAS | HBL | 0.125 | 1.66 0.09 | 2.69 0.26 | 1.84 0.54 | Acciari et al. (2010a) |
| RX J0648.7+1516 | VERITAS | HBL | 0.179 | 1.83 0.07 | 4.40 0.80 | 2.98 0.79 | Errando (2011) |
| S5 0716+714 | MAGIC | IBL | 0.26 | 1.95 0.01 | 3.45 0.54 | 1.3 0.35 | Anderhub et al. (2009) |
| SHBL J001355.9 | HESS | HBL | 0.095 | 1.94 0.17 | 3.4 0.50 | 2.48 3.10 | Abramowski et al. (2013) |
| -185406 | |||||||
| VER J0521+211 | VERITAS | IBL | 0.108 | 1.92 0.02 | 3.44 0.20 | 2.59 0.28 | Archambault et al. (2013) |
| W Comae | VERITAS | IBL | 0.102 | 2.10 0.03 | 3.81 0.35 | 3.21 1.18 | Acciari et al. (2008) |
Note: The fifth column contains HE observed spectral indices from the 3FGL Catalog. The sixth column contains the VHE observed spectral indices, which are related to the data in the eighth column. The redshift of some sources cannot be ensured, but they are assumed by the references in the eighth column. The seventh column contains the VHE intrinsic spectral break, which we obtain using the average EBL model (Dwek and Krennrich 2005)
.