reception date \Acceptedacception date \Publishedpublication date
stars:abundances — stars:Population II — stars:individual (LAMOST J 2217+2104) — nuclear reactions, nucleosynthesis, abundances
LAMOST J 2217+2104: a new member of carbon-enhanced extremely metal-poor stars with excesses of Mg and Si
Abstract
We report on the elemental abundances of the carbon-enhanced metal-poor (CEMP) star J 2217+2104 discovered by our metal-poor star survey with LAMOST and Subaru. This object is a red giant having extremely low Fe abundance ([Fe/H]=-4.0) and very large enhancement of C, N, and O with excesses of Na, Mg, Al, and Si. This star is a new example of a small group of such CEMP stars identified by previous studies. We find a very similar abundance pattern for O-Zn in this class of objects that shows enhancement of elements up to Si and normal abundance of Ca and Fe-group elements. Whereas the C/N ratio is different among these stars, the (C+N)/O ratio is similar. This suggests that C was also yielded with similar abundance ratios relative to O–Zn in progenitors, and was later affected by the CN-cycle. By contrast, the heavy neutron-capture elements Sr and Ba are deficient in J 2217+2104, compared to the four objects in this class previously studied. This indicates that the neutron-capture process in the early Galaxy, presumably the r-process, has no direct connection to the phenomenon that has formed such CEMP stars. Comparisons of the abundance pattern well determined for such CEMP stars with those of supernova nucleosynthesis models constrain the progenitor mass to be about 25 M⊙, which is not particularly different from typical mass of progenitors expected for extremely metal-poor stars in general.
1 Introduction
Extremely Metal-Poor (EMP) stars ([Fe/H])111[A/B] = , and for elements A and B. in the Milky Way are regarded as old low-mass stars formed in the very early stage of the Galaxy evolution recording the yields of first generations of massive stars (Frebel & Norris, 2015). A remarkable feature found in EMP stars is the high frequency of Carbon-Enhanced Metal-Poor (CEMP) stars ([C/Fe]222We adopt [C/Fe] as the definition of CEMP stars in this paper following the definition of SAGA database (Suda et al., 2008), whereas [C/Fe] is adopted in some other papers.). A large fraction of CEMP stars with [Fe/H] also show excesses of heavy neutron-capture elements like Ba, a signature of contribution by the s-process nucleosynthesis in AGB stars through mass transfer across binary systems (so-called CEMP-s stars). By contrast, CEMP stars with no excess of Ba (CEMP-no stars) are dominant at [Fe/H] (e.g., Aoki et al. (2007)). CEMP stars with such low metallicity could record the nucleosynthesis yields of a kind of supernova that is particularly effective in the early Galaxy. The high frequency of such objects could be also related to the cooling process of star forming clouds. The excess of C, as well as O that is also overabundant in some CEMP stars, could result in efficient gas cooling, which is required for low-mass star formation, even at very low metallicity (Bromm & Loeb, 2003; Norris et al., 2013).
Most of the CEMP-no stars do not show any anomaly in abundance ratios except for the light elements C, N, and O (e.g., Aoki et al. (2007); Ito et al. (2009)). The [C/Fe] values of the CEMP-no stars show a wide distribution, including many objects that have a ratio close to the criterion of CEMP stars ([C/Fe]; Yoon et al. 2016). These observational features could suggest a connection of some fraction of CEMP-no stars with C-normal stars.
There are, however, a small number of CEMP-no stars that show large excesses of some -elements, which well separate them from C-normal EMP stars. The first example of such a star, CS 22949–037, was reported by McWilliam et al. (1995), and was studied in more detail by Norris et al. (2001), Norris et al. (2002) and Depagne et al. (2002). This is a CEMP star with [Fe/H] showing no significant excess of neutron-capture elements, but it exhibits clear excesses of Mg and Si, as well as odd elements with similar atomic mass (Na, Al). Another EMP star having a similar abundance pattern, CS 29498–043 ([Fe/H]), was reported by Aoki et al. (2002), who suggested the existence of a class of CEMP-no stars with significant excesses of Mg and Si in the lowest metallicity range. Two more CEMP-no stars having similarly large excess of Mg and Si have been reported by Cohen et al. (2013) and Yong et al. (2013): HE 1012–1510 ([Fe/H]) and HE 2139–5432 ([Fe/H]). More recently, Bonifacio et al. (2018) report another EMP star, SDSS J 1349+1407, having [Fe/H] and large excesses of C, Na, and Mg, although the number of elements for which abundances are measured is still small for this faint, unevolved object. These stars are well separated from other stars with similar Fe abundances in the /Fe abundance ratios (e.g., [Mg/Fe]; Norris et al. (2013)). Given the fact that -elements are efficiently produced during the evolution of massive stars and their supernova explosions, these CEMP stars could be regarded as a record of nucleosynthesis by the first generation of massive stars.
Large excesses of C, N, O and Mg are also found in the “Hyper Metal-Poor” ([Fe/H]) star HE 1327–2326 (Frebel et al., 2005). Although the over-abundances of C, N, and O are much more significant in this object than those of the above CEMP stars, the overall abundance trend could suggest that these stars have similar origins.
The distributions of abundance ratios for CEMP-no stars were discussed in detail by Norris et al. (2013), in which stars with excesses of Na, Mg and Si are focused. As possible origins of these objects, so-called faint supernovae explained by the “mixing fall-back” models (Umeda & Nomoto, 2003) and mass-loss from rotating massive stars (Meynet et al., 2006) are argued. To discriminate these possibilities, detailed abundance pattern of -elements up to Ti is a key. The sample of such stars is, however, still very limited as mentioned above, even though EMP stars have been intensively searched for in the past two decades. This could be due to the fact that such EMP stars ([Fe/H]) are generally very rare. Taking account of the importance of such objects in the understanding of formation and evolution of the first generations of stars, further searches for new examples and detailed abundance studies are desired.
Here we report on the discovery of an Ultra Metal-Poor ([Fe/H]) star, LAMOST J 221750.59+210437.2 (J 2217+2104), that shows large excesses of -elements as well as C, and discuss the detailed abundance pattern of this class of objects.
2 Observations and measurements
J 2217+2104 was discovered by the medium resolution () spectroscopy with the Large Sky Area Multi-Object Fiber Spectroscopic Telescope (LAMOST) in its regular survey (Cui et al., 2012; Zhao et al., 2012) as a candidate EMP star. The stellar parameters estimated from the LAMOST spectrum indicate that this object is an EMP giant with [Fe/H]. Strong CH molecular bands are identified in the LAMOST spectrum.
High-resolution spectra of this object were obtained with the Subaru Telescope High Dispersion Spectrograph (HDS; Noguchi et al. (2002)) in observing programs for follow-up spectroscopy of metal-poor star candidates found with LAMOST (Li et al. (2015)). The first spectrum was obtained in November 2015 with a short exposure (so-called “snapshot” spectroscopy). High-resolution spectra with longer exposures were obtained in August 2017 with a resolving power of by two wavelength setups, covering 3500-5200 Å and 4030-6800 Å, respectively. Details of the observations are given in table LAMOST J 2217+2104: a new member of carbon-enhanced extremely metal-poor stars with excesses of Mg and Si.
Standard data reduction procedures were carried out with the IRAF echelle package333IRAF is distributed by the National Optical Astronomy Observatories, which is operated by the Association of Universities for Research in Astronomy, Inc. under cooperative agreement with the National Science Foundation.. The wavelength shift due to Earth’s orbital motion is corrected using the IRAF task rvcor.
We measure equivalent widths by fitting a Gaussian profile. Line data for spectral features are taken from previous studies on very metal-poor stars (e.g., Aoki et al. (2013)). The measured equivalent widths are given in table 2, together with the line data used in the abundance analysis.
The Fe I lines for which equivalent widths are measured are also used to measure radial velocities. The heliocentric radial velocities derived from these Fe I lines are given in table LAMOST J 2217+2104: a new member of carbon-enhanced extremely metal-poor stars with excesses of Mg and Si. The random error in the measurement is estimated to be , where is the standard deviation of the derived values from individual lines, and is the number of lines used. The random errors are 0.03–0.04 km s-1. The errors due to the instability of the instrument corresponding to, e.g., temperature variations, are usually larger ( km s-1) than the above errors. The radial velocity obtained from the LAMOST spectrum and the value provided by Gaia DR2 are also given in the table. Given the errors of radial velocity measurements, no signature of radial velocity variation is found in the data currently available.
Photometry data (, , and ) are taken from APASS (Henden et al., 2016) and 2MASS (Cutri et al., 2003). The magnitude of this object indicates that this is the brightest CEMP star with large excess of Mg and Si known to date.
The parallax provided by the Gaia DR2 ( mas) is still uncertain and is not useful to constrain the distance and surface gravity.
3 Abundance analysis and results
We determine the elemental abundances of J 2217+2104 by 1D/LTE standard analysis and spectrum synthesis techniques using model atmospheres of the ATLAS NEWODF grid (Castelli et al. (1997)). To determine the stellar parameters, photometry is also used.
3.1 Stellar parameters and abundance analysis
We estimate the effective temperature () from the colors using the temperature scale of Alonso et al. (1999) for giant stars. We assume [Fe/H] in the calculation of , following Ryan et al. (1999). The reddening () is adopted from Schlafly & Finkbeiner (2011). The derived from is 4494 K, which agrees with those from (4567 K) and from (4615 K) within the uncertainties of the estimates. We adopt K for the abundance analysis, taking account of the sensitivity of to and uncertainty due to errors of photomety data and the temperature scale.
Following the usual abundance analysis procedure, the surface gravity () and micro-turbulent velocity () are determined as the Fe abundances derived from Fe I and Fe II lines are consistent, and as there remains no trend of Fe abundances from individual Fe I lines as a function of the line strengths, respectively. For the analysis, 53 Fe I lines and 4 Fe II lines are used. Errors of the Fe abundance measurements of 0.1 dex results in an uncertainty in of 0.2 dex. The derived and are 0.9 dex and 2.3 km s-1, respectively.
The derived Fe abundances from individual Fe I lines show a correlation with the lower excitation potential ([Fe/H]/ dex/eV). The slope is shallower if the lines with the lowest excitation potential ( eV) are excluded. Such a trend is, however, usually found in the analysis of extremely metal-poor giants adopting estimated from colors (e.g., Frebel et al. (2013)). Hence, we adopt the estimated from the colors with no correction.
We estimate the uncertainties of , , [Fe/H] and to be 100 K, 0.3 dex, 0.3 dex, and 0.3 km s-1, respectively, from the photometry errors and scatter of the Fe abundances derived from individual Fe lines.
3.2 Abundance analysis
The abundances of elements other than C and N listed in table 3 are determined by equivalent widths analysis. For the analysis of the Sc II, Mn I, Co I and Ba II lines, the effect of hyperfine splitting is included, using the wavelengths and the fraction of transition probability of each splitted line in the Kurucz’s line data444http://kurucz.harvard.edu/linelists.html. The isotope ratios of the solar-system r-process component are assumed for Ba. The effect is 0.11 dex in the Mn abundance that is determined by a single line with moderate strength, whereas the effects are minor (0.02 – 0.03 dex) in the abundances of the other three elements.
The C and N abundances are determined by spectrum synthesis technique for the CH 4323 Å and CN 3883 Å bands, using the line lists of Masseron et al. (2014) for CH and Sneden et al. (2014) for CN. The wavelength range of the CH band is shown in figure 1.
The C isotope ratio (12C/13C) is estimated to be 6 from the CH molecular lines around 4000 Å. An example of the spectral feature is depiced in figure 1.
The O abundance is determined from the [O I] absorption line at 6300 Å. The stellar absorption line does not overlap with the telluric features ([O I] emission line and O2 absorption lines; see Aoki et al. (2004)) in the spectrum obtained on August 5, 2017. We measure the [O I] equivalent width with no correction of telluric features.
No Zn I line is detected in the spectrum. The upper limit of Zn abundance ([Zn/Fe]) is estimated from the Zn I 4722 Å line adopting an upper limit of the equivalent width of 3 mÅ at 2 level. We note that the Zn I 4811 Å line is not available in the spectrum due to CCD bad columns.
The results of the abundance measurements are given in table 3. The solar abundances of Asplund et al. (2009) are adopted to calculate the [X/Fe] values. The error of the abundance of each element is also given in the table. The error is obtained by adding in quadrature the random error and errors due to the uncertainties of stellar parameters. The random errors in the measurements are estimated to be , where is the standard deviation of derived abundances from individual lines, and is the number of lines used. The of Fe I () is adopted in the estimates for element X for which the number of lines available in the analysis () is small (i.e. the error is ). The errors due to the uncertainty of the atmospheric parameters are estimated for a giant, for K, , and km s-1. The errors due to uncertainties of stellar parameters are similar to the previous estimates for extremely metal-poor giants (e.g., Aoki et al. (2004)).
4 Discussion
4.1 Overall abundance pattern of CEMP stars with excesses of Mg and Si
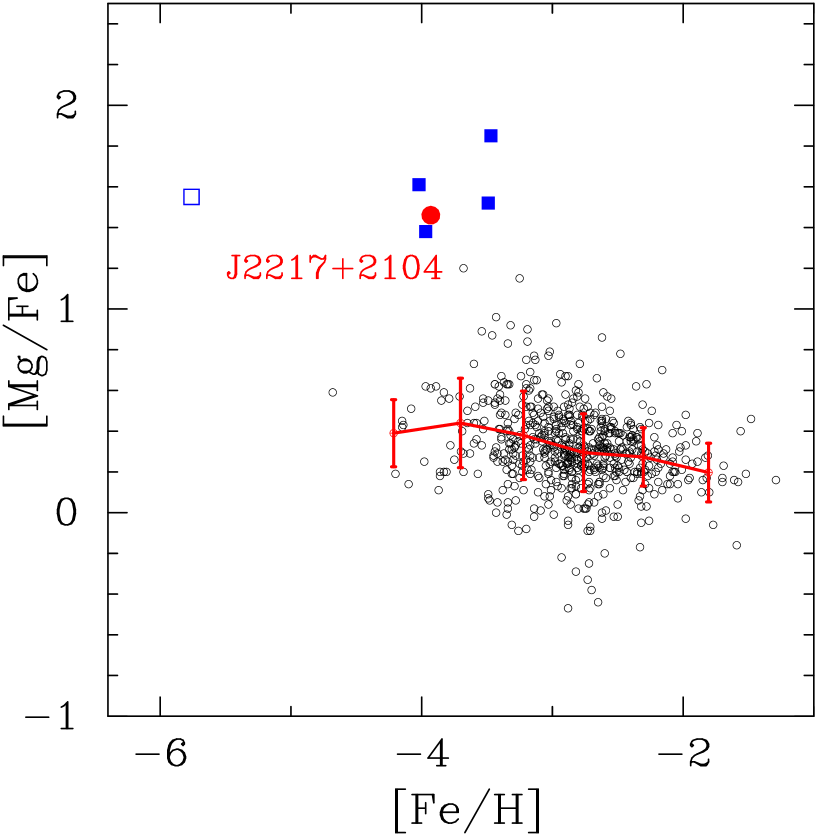
Figure 2 shows the abundance ratios of [Mg/Fe] as a function of [Fe/H]. Abundance data of J 2217+2104 and the other four CEMP stars with Mg excess CS 22949-037, CS 29498-043, HE 1012-1540 and HE 2139-5432 are shown by the red filled circles and blue filled squares, respectively. The abundance data for the four objects are adopted from Norris et al. (2013), who compiled the results obtained by the analysis of Yong et al. (2013). The abundance data of the other stars (small circles) are taken from literature (Cayrel et al., 2004; Honda et al., 2004; Barklem et al., 2005; Lai et al., 2008; Yong et al., 2013; Cohen et al., 2013; Aoki et al., 2013; Jacobson et al., 2015; Hansen et al., 2015) through the SAGA database (Suda et al., 2017). The solid line connects the averages of [Mg/Fe] (and [Fe/H]) of the objects in 0.25 dex bins of [Fe/H], and the bar indicates the standard deviations of the [Mg/Fe] values. In the calculations of the averages and standard deviations, the five CEMP stars with Mg excess are excluded.
Although statistically significant scatter exists in the [Mg/Fe] ratios of EMP stars, the large excess of [Mg/Fe] in the five objects with [Fe/H] is distinct. This demonstrates that the five stars are well separated from the bulk of the EMP stars that have [Mg/Fe] on average.
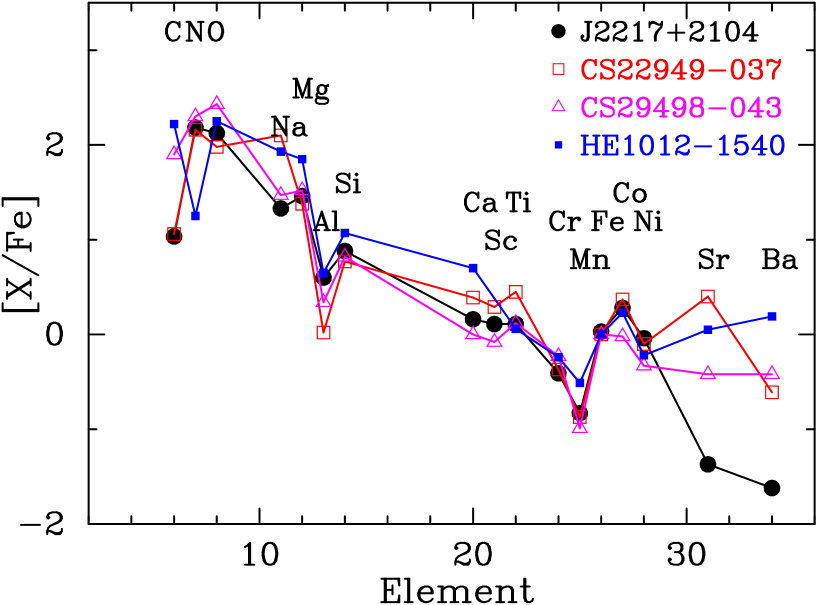
Figure 3 shows the overall abundance pattern of J 2217+2104, and those of other three CEMP stars previously reported. HE 2139-5432 is not included in the plot, because the number of elements for which abundance measurements were reported is relatively small. The figure demonstrates that the abundance patterns of the elements between O and Ni of these four stars are very similar, considering the measurement errors of typically 0.2 dex. The similarity of the abundance patterns suggests that the progenitors of these objects, which are expected to be a specific type of supernova explosions of massive stars, are also similar. Before discussing the possible origin of the abundance pattern of these stars, we inspect the abundances of C and N, as well as the neutron-capture elements Sr and Ba.
4.2 C and N abundances
The five objects that show large excesses of Mg and Si identified in the previous subsection also have very high abundance ratios of C/Fe and N/Fe. The C/N abundance ratios are, however, different between stars. The abundance ratios of related elements are given in table LAMOST J 2217+2104: a new member of carbon-enhanced extremely metal-poor stars with excesses of Mg and Si for the five objects. The data of HE 1327–2326 are also given for comparison purposes. The over-abundance of N is larger than that of C in J 2217+5104, CS 22949–037, and CS 29498–043, whereas the over-abundance of C is larger in the other two stars.
The C and N abundances could be affected by the CN-cycle, but the total abundance of the two elements should be preserved during the process. The total abundance of C and N of all of the five stars are very high ([(C+N)/Fe]) although the carbon abundances of J 2217+2104 and CS 22949–037 ([C/Fe]) are close to the criterion of CEMP stars.
The ratio of the total abundance of C and N with respect to the O abundance (i.e., [(C+N)/O]) is also given in the table. Interestingly, the (C+N)/O ratios in the five objects are very similar. The average and the standard deviations of the ratios are [(C+N)/O] and ([(C+N)/O]), respectively. This suggests that C has been enhanced similarly to O in these objects, and a portion of the enhanced C is transformed into N by the CN-cycle, resulting in a variation between the stars.
The C and N abundances could be affected by the CN-cycle in the progenitors of these objects, which would be massive stars that produced large excesses of Mg and Si. The CN-cycle is, however, also effective in low-mass red giants that we are currently observing. Indeed, a large fraction of highly evolved red giants with very low metallicity show very low C and high N abundances (“mixed stars”; Spite et al. (2005)). The two objects having relatively high C/N ratios among the five objects are warmer ( K) than the other three objects (table LAMOST J 2217+2104: a new member of carbon-enhanced extremely metal-poor stars with excesses of Mg and Si). This suggests that the variation of the C/N ratios could be due to the CN-cycle during the low-mass star evolution. The low 12C/13C ratios in the three cool stars and non-detection of 13C in the others (table LAMOST J 2217+2104: a new member of carbon-enhanced extremely metal-poor stars with excesses of Mg and Si) support this interpretation.
The [C/O] ratios in metal-poor Damped Lyman- systems are similar to the [(C+N)/O] values of CEMP stars studied here. Cooke et al. (2017) argue that the source of the C and O in the systems are supernova explosions of M⊙ based on nucleosynthesis models for first stars and supernova explosions in which the C/O ratio is sensitive to the mass of progenitors (Heger & Woosley, 2010). The constraint on progenitor mass obtained by elemental abundances are discussed in §4.4.
4.3 Neutron-capture elements
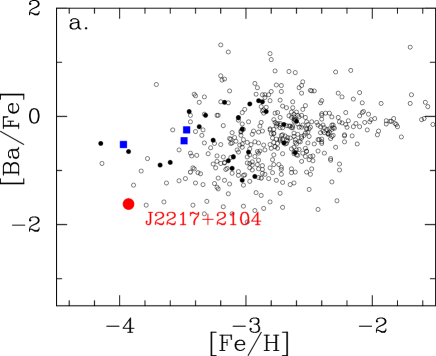
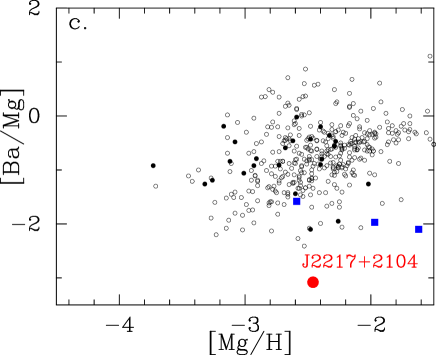
Heavy neutron-capture elements are deficient in EMP stars with [Fe/H] in general, in contrast to the objects with [Fe/H] that show large star-to-star scatter in their abundance ratios (e.g., [Eu/Fe]), including r-process-enhanced stars. In EMP stars with low abundances of neutron-capture elements, measurable neutron-capture elements are only Sr and Ba that have strong resonance lines in the optical range. The [Sr/Fe] and [Ba/Fe] ratios in stars with [Fe/H] are typically (e.g., Yong et al. (2013)). Figure 4a shows [Ba/Fe] as a function of [Fe/H] for metal-poor stars. The [Ba/Fe] values of CEMP stars with excesses of Mg and Si previously reported are not as low as the typical [Ba/Fe] values of other EMP stars with similar Fe abundance. This was discussed by Aoki et al. (2002) for CS 22949–037 and CS 29498–043. J 2217+2104 has, however, very low abundances of Sr and Ba, as found in C-normal stars with [Fe/H]. This indicates that there exists scatter in the abundance ratios of neutron-capture elements in such CEMP stars.
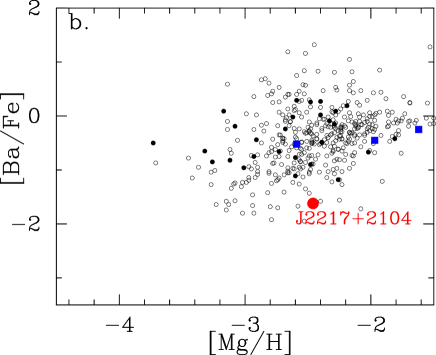
For such CEMP stars, Fe is not necessarily a good indicator of metallicity, because O, Mg, and Si are overabundant with respect to Fe. Figure 4b shows [Ba/Fe] as a function of [Mg/H], adopting Mg as an indicator of metallicity. CEMP-s stars are excluded from this plot. Since the typical value of [Mg/Fe] in metal-poor stars is +0.4, most stars shift to higher values in the horizontal axis compared to the plot for [Fe/H]. The large scatter of [Ba/Fe] appears at [Mg/H] in this diagram, corresponding to the scatter at [Fe/H] in figure 4a. the usual plot. On the other hand, CEMP stars with Mg excess shift by more than 1 dex. The [Ba/Fe] values of the two particularly Mg-rich stars ([Mg/H]) are similar to the typical value in other stars, while the other two stars, including J 2217+2104, are located within the scatter of [Ba/Fe] found in other stars with [Mg/Fe].
This suggests that the neutron-capture elements of CEMP stars with excesses of Mg and Si follow the distribution of neutron-capture elements of other EMP stars showing no C-excess, and there is no direct connection between the origin of excesses of C, N, O, Mg and Si and the event that has produced neutron-capture elements.
We note for completeness that, in the plot of [Ba/Mg] as a function of [Mg/H] shown in figure 4c, the CEMP stars with excesses of Mg and Si are well separated from the other stars, showing very low values of [Ba/Mg]. This is simply due to the large Mg excess.
4.4 Progenitors of CEMP stars with excesses of Mg and Si
The extremely low metallicity (low Fe abundance) of these objects indicates that their elemental abundances would be predominantly determined by the chemical yields of first generation stars. We find 49 objects in the range [Fe/H] in figure 2, among which five are CEMP stars showing large Mg excesses, suggesting that the frequency of such objects is in the order of 10%. Hence, if the chemical compositions of these stars are originated from similar objects, e.g., some specific type of supernovae, they should not be very rare in the early Galaxy. We note that the high fraction of CEMP-no stars at very low metallicity might not only reflect the frequency of their progenitors, but also depend on the efficiency of low-mass star formation that is affected by chemical composition of the gas cloud, as discussed by, e.g., Norris et al. (2013) and Chiaki et al. (2017).
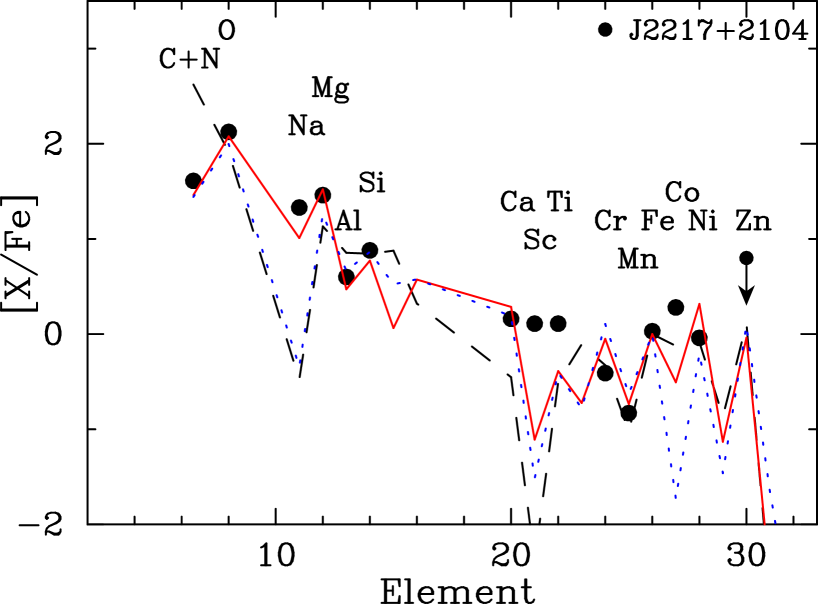
A promising model proposed to explain the abundance patterns of these objects is the so-called mixing-fallback model for supernova explosions (Umeda & Nomoto, 2003). This model assumes significant mixing in the inner region of a massive star during the explosion and unusually large fall-back that results in little ejection of heavier elements including Fe. Abundance patterns predicted by this model have been compared with CEMP stars including CS 22949–037 and CS 29498–043. Recently, Ishigaki et al. (2018) apply the models covering wide ranges of masses and explosion energies to abundance patterns of many EMP stars. They exhibit that the abundance patterns of CEMP stars with excesses of Mg and Si are better explained by the models of 25 M⊙ rather than those of more massive cases. This is in particular constrained by the [Na/Mg] ratios. Figure 5 shows the abundance patterns predicted by models for three different progenitor masses (13, 25 and 40 M⊙) for explosion energy of 1051 erg along with the abundance ratios of J 2217+2104. Here the total abundances of C and N are presented taking account of possible conversion of C to N by the CN-cycle after nucleosynthesis in a massive progenitor. The abundance pattern of J 2217+2104 from C+N to Ca is well reproduced by the model of 25 M⊙, whereas the ratios of (C+N)/Fe and Na/Fe are not explained by the other models.
The Co/Fe ratio is not well reproduced by any models, and is better explained by models assuming large explosion energies (hypernova cases). However, the [Na/Mg] values, as well as [(C+N)/O] values, of the CEMP stars studied here are better explained by models with normal explosion energy ( erg; Ishigaki et al. (2018)). The explosion energy is well constrained by the Zn abundance. The Zn abundance of CS 22949–037 reported by Depagne et al. (2002) is [Zn/Fe], suggesting a large explosion energy, whereas the upper limit derived for CS 29498–043 by Aoki et al. (2004) is relatively low ([Zn/Fe]) and, hence, particularly high explosion energy is not required. The upper-limit of the Zn abundance estimated for J 2217+2104, [Zn/Fe], is still marginal, and further measurements will provide useful constraints. The high Sc and Ti abundances of J 2217+2104 are not reproduced by any models, and the model values are treated as lower limits in the fitting (Ishigaki et al., 2018). The abundances of these two elements, as well as the high Co abundance, could be explained by a jet-induced explosion (Tominaga et al., 2014).
The progenitor mass for these CEMP stars is also estimated to be about 20 M⊙ by supernova models of Heger & Woosley (2010). Placco et al. (2016) compare the models with the abundance pattern of CS 22949–037, which has a similar abundance pattern to J 2217+2104, and concluded that the model for 21.5 M⊙ of Heger & Woosley (2010) provides the best fit. The strongest constraint is also given by the abundance ratios of C(+N), O, Na and Mg.
The initial mass function of first stars is one of the most important issues to understand early structure formation. It has been constrained by comparisons of models with observables like metallicity distribution function of most metal-poor stars and the fraction of CEMP stars (e.g., de Bennassuti et al. (2017)). Estimating mass of progenitor stars for individual metal-poor stars is another approach to this goal. The mass of the progenitors estimated for CEMP stars with excesses of Mg and Si is not particularly different from that expected for C-normal EMP stars, This suggests that, although the progenitors of such CEMP stars produced C-rich material due to some properties of stars (e.g. rotation, binarity), they could represent some important portion of initial mass function of first stars.
Significant mass-loss from first generation (metal-free) massive stars with rapid rotation are also proposed to explain CEMP-no stars, in particular the hyper metal-poor ([Fe/H]) stars showing extremely large excess of C and other light elements (Meynet et al., 2006). Remarkable features predicted by this model are large excesses of odd elements, i.e., N, Na, Al as a result of the CNO-cycle and efficient mixing caused by rapid rotation. The large excesses of N and Na, as well as C and Mg, found in the CEMP stars discussed here support the model. The N excess might be, however, produced during the evolution of low-mass stars we are currently observing, as discussed in §4.2. Another difficulty is the excess of Si, which is not expected in the material ejected from rotating massive stars.
Another model proposed as a possible origin of CEMP-no stars is mass transfer from companion AGB stars in binary systems (Suda et al., 2004). Large enhancements of Na and Mg are predicted by a neutron-capture nucleosynthesis model of very metal-poor AGB stars (Nishimura et al., 2009). The large excess of Si found in the CEMP stars discussed here is, however not explained by this model. The [(C+N)/O] ratios observed for the sample of this work are not as high as the C/O ratios expected from AGB nucleosynthesis models. Hence, at lease according to the current AGB nucleosynthesis models, mass transfer from AGB stars is implausible to be the origin of CEMP-no stars with large excesses of Mg and Si, whereas it could be a possible origin of some portion of other CEMP-no stars.
5 Summary and concluding remarks
The elemental abundances of a newly discovered CEMP star, J 2217+2104, are determined based on high resolution spectroscopy. This is a new example of a class of CEMP stars having excesses of N, O, Na, Mg, Al and Si. The abundance pattern of this class of objects from C to Ni is very similar to each other, suggesting the existence of similar progenitors in the early universe that would be a specific type of supernova explosions. The abundance pattern of C, N, O, Na and Mg of J 2217+2104 and other similar CEMP stars suggests that the progenitor mass is about 25 M⊙, which is not particularly different from typical mass of progenitors expected for EMP stars in general. Hence, the cause of the very different abundance pattern of these CEMP stars from other EMP stars would be some properties of progenitors other than their mass. The difference comes from the parameters of mixing and fallback in the model (Ishigaki et al., 2018), which might be related to the rotation, binarity, or other properties.
The kinematics information of Galactic stars is becoming available by new astrometry data obtained with Gaia. The sample size of this class is still too small to determine their chemical and kinematic properties and their implication in the early nucleosynthesis and star formation. Ongoing and future surveys of very metal-poor stars will be useful to search for EMP/UMP stars including such carbon-enhanced objects.
This work is based on data collected at the Subaru Telescope, which is operated by the National Astronomical Observatory of Japan. Guoshoujing Telescope (the Large Sky Area Multi-Object Fiber Spectroscopic Telescope, LAMOST) is a National Major Scientific Project built by the Chinese Academy of Sciences. Funding for the project has been provided by the National Development and Reform Commission. LAMOST is operated and managed by the National Astronomical Observatories, Chinese Academy of Sciences. This work was supported by JSPS - CAS Joint Research Program. WA and TS were supported by JSPS KAKENHI Grant Numbers 16H02168, 16K05287 and 15HP7004. HL was supported by NSFC grants No. 11573032, 11390371. We thank Dr. M.Y. Fujimoto for useful comments on AGB nucleosynthesis.
References
- Alonso et al. (1999) Alonso, A., Arribas, S., & Martínez-Roger, C. 1999, A&AS, 140, 261
- Aoki et al. (2007) Aoki, W., Beers, T. C., Christlieb, N., et al. 2007, ApJ, 655, 492
- Aoki et al. (2013) Aoki, W., Beers, T. C., Lee, Y. S., et al. 2013, AJ, 145, 13
- Aoki et al. (2002) Aoki, W., Norris, J. E., Ryan, S. G., Beers, T. C., & Ando, H. 2002, ApJ, 576, L141
- Aoki et al. (2004) Aoki, W., Norris, J. E., Ryan, S. G., et al. 2004, ApJ, 608, 971
- Asplund et al. (2009) Asplund, M., Grevesse, N., Sauval, A. J., & Scott, P. 2009, ARA&A, 47, 481
- Barklem et al. (2005) Barklem, P. S., Christlieb, N., Beers, T. C., et al. 2005, A&A, 439, 129
- Bonifacio et al. (2018) Bonifacio, P., Caffau, E., Spite, M., et al. 2018, arXiv:1801.03935
- Bromm & Loeb (2003) Bromm, V., & Loeb, A. 2003, Nature, 425, 812
- Castelli et al. (1997) Castelli, F., Gratton, R. G., & Kurucz, R. L. 1997, A&A, 318, 841
- Cayrel et al. (2004) Cayrel, R., Depagne, E., Spite, M., et al. 2004, A&A, 416, 1117
- Chiaki et al. (2017) Chiaki, G., Tominaga, N., & Nozawa, T. 2017, MNRAS, 472, L115
- Cohen et al. (2013) Cohen, J. G., Christlieb, N., Thompson, I., et al. 2013, ApJ, 778, 56
- Cooke et al. (2017) Cooke, R. J., Pettini, M., & Steidel, C. C. 2017, MNRAS, 467, 802
- Cui et al. (2012) Cui, X.-Q., Zhao, Y.-H., Chu, Y.-Q., et al. 2012, Research in Astronomy and Astrophysics, 12, 1197
- Cutri et al. (2003) Cutri, R. M., Skrutskie, M. F., van Dyk, S., et al. 2003, VizieR Online Data Catalog, 2246,
- de Bennassuti et al. (2017) de Bennassuti, M., Salvadori, S., Schneider, R., Valiante, R., & Omukai, K. 2017, MNRAS, 465, 926
- Depagne et al. (2002) Depagne, E., Hill, V., Spite, M., et al. 2002, A&A, 390, 187
- Frebel et al. (2005) Frebel, A., Aoki, W., Christlieb, N., et al. 2005, Nature, 434, 871
- Frebel et al. (2013) Frebel, A., Casey, A. R., Jacobson, H. R., & Yu, Q. 2013, ApJ, 769, 57
- Frebel & Norris (2015) Frebel, A., & Norris, J. E. 2015, ARA&A, 53, 631
- Heger & Woosley (2010) Heger, A., & Woosley, S. E. 2010, ApJ, 724, 341
- Hansen et al. (2015) Hansen, T., Hansen, C. J., Christlieb, N., et al. 2015, ApJ, 807, 173
- Henden et al. (2016) Henden, A. A., Templeton, M., Terrell, D., et al. 2016, VizieR Online Data Catalog, 2336,
- Honda et al. (2004) Honda, S., Aoki, W., Kajino, T., et al. 2004, ApJ, 607, 474
- Ishigaki et al. (2018) Ishigaki, M. N., Tominaga, N., Kobayashi, C., & Nomoto, K. 2018, ApJ, 857, 46
- Ito et al. (2009) Ito, H., Aoki, W., Honda, S., & Beers, T. C. 2009, ApJ, 698, L37
- Jacobson et al. (2015) Jacobson, H. R., Keller, S., Frebel, A., et al. 2015, ApJ, 807, 171
- Käppeler et al. (2011) Käppeler, F., Gallino, R., Bisterzo, S., & Aoki, W. 2011, Reviews of Modern Physics, 83, 157
- Lai et al. (2008) Lai, D. K., Bolte, M., Johnson, J. A., et al. 2008, ApJ, 681, 1524-1556
- Li et al. (2015) Li, H., Aoki, W., Zhao, G., et al. 2015, PASJ, 67, 84
- Masseron et al. (2014) Masseron, T., Plez, B., Van Eck, S., et al. 2014, A&A, 571, A47
- McWilliam et al. (1995) McWilliam, A., Preston, G. W., Sneden, C., & Searle, L. 1995, AJ, 109, 2757
- Meynet et al. (2006) Meynet, G., Ekström, S., & Maeder, A. 2006, A&A, 447, 623
- Nishimura et al. (2009) Nishimura, T., Aikawa, M., Suda, T., & Fujimoto, M. Y. 2009, PASJ, 61, 909
- Noguchi et al. (2002) Noguchi, K., Aoki, W., Kawanomoto, S., et al. 2002, PASJ, 54, 855
- Norris et al. (2001) Norris, J. E., Ryan, S. G., & Beers, T. C. 2001, ApJ, 561, 1034
- Norris et al. (2002) Norris, J. E., Ryan, S. G., Beers, T. C., Aoki, W., & Ando, H. 2002, ApJ, 569, L107
- Norris et al. (2013) Norris, J. E., Yong, D., Bessell, M. S., et al. 2013, ApJ, 762, 28
- Placco et al. (2016) Placco, V. M., Frebel, A., Beers, T. C., et al. 2016, ApJ, 833, 21
- Ryan et al. (1999) Ryan, S. G., Norris, J. E., & Beers, T. C. 1999, ApJ, 523, 654
- Schlafly & Finkbeiner (2011) Schlafly, E. F., & Finkbeiner, D. P. 2011, ApJ, 737, 103
- Sneden et al. (2014) Sneden, C., Lucatello, S., Ram, R. S., Brooke, J. S. A., & Bernath, P. 2014, ApJS, 214, 26
- Spite et al. (2005) Spite, M., Cayrel, R., Plez, B., et al. 2005, A&A, 430, 655
- Suda et al. (2004) Suda, T., Aikawa, M., Machida, M. N., Fujimoto, M. Y., & Iben, I., Jr. 2004, ApJ, 611, 476
- Suda et al. (2017) Suda, T., Hidaka, J., Aoki, W., et al. 2017, PASJ, 69, 76
- Suda et al. (2008) Suda, T., Katsuta, Y., Yamada, S., et al. 2008, PASJ, 60, 1159
- Tominaga et al. (2014) Tominaga, N., Iwamoto, N., & Nomoto, K. 2014, ApJ, 785, 98
- Umeda & Nomoto (2003) Umeda, H., & Nomoto, K. 2003, Nature, 422, 871
- Yong et al. (2013) Yong, D., Norris, J. E., Bessell, M. S., et al. 2013, ApJ, 762, 26
- Yoon et al. (2016) Yoon, J., Beers, T. C., Placco, V. M., et al. 2016, ApJ, 833, 20
- Zhao et al. (2012) Zhao, G., Zhao, Y.-H., Chu, Y.-Q., Jing, Y.-P., & Deng, L.-C. 2012, Research in Astronomy and Astrophysics, 12, 723
Abundance results Facility (resolving power) Obs. date HJD Wavelengths LAMOST () Oct. 23, 2013 2456588 3800-9000 … Subaru () Nov. 30, 2015 2457356.77 4030-6800 40 Subaru () Aug. 4, 2017 2457970.00 3500-5300 61 Subaru () Aug. 5, 2017 2457971.00 4030-6800 26 Gaia DR2 {tabnote} The errors of LAMOST and Gaia results are 7 km s-1 and 3.3 km s-1, respectively.
lccccc Atomic line data, equivalent widths and derived abundances
Species Wavelength (Å) L.E.P. (eV) (mÅ)
\endhead\endfoot\endlastfootNa I 5889.95 0.000 0.10 173.8 3.68
Na I 5895.92 0.000 -0.20 151.4 3.60
Mg I 4571.10 0.000 -5.69 80.5 5.19
Mg I 4702.99 4.330 -0.44 60.7 4.99
Mg I 5172.68 2.712 -0.45 195.4 5.23
Mg I 5183.60 2.717 -0.24 216.1 5.23
Mg I 5528.40 4.346 -0.50 62.6 5.04
Al I 3961.52 0.014 -0.34 136.7 3.12
Si I 4102.94 1.909 -3.14 48.5 4.46
Ca I 4226.73 0.000 0.24 134.6 2.63
Ca I 4454.78 1.898 0.26 21.3 2.51
Sc II 4246.82a 0.315 0.24 102.8 -0.45
Sc II 4320.75a 0.605 -0.25 35.7 -0.84
Sc II 4415.56a 0.595 -0.67 22.2 -0.73
Ti I 4991.07 0.836 0.45 10.3 1.13
Ti II 4417.72 1.165 -1.19 33.2 1.14
Ti II 4443.80 1.080 -0.71 61.5 1.04
Ti II 4450.48 1.084 -1.52 24.6 1.18
Ti II 4464.45 1.161 -1.81 10.9 1.14
Ti II 4468.49 1.131 -0.63 63.0 1.05
Ti II 4501.27 1.116 -0.77 51.9 0.98
Ti II 4533.97 1.237 -0.77 65.2 1.35
Ti II 4563.77 1.221 -0.96 50.8 1.27
Ti II 4571.97 1.572 -0.31 48.4 1.02
Cr I 4289.72 0.000 -0.37 62.7 1.30
Cr I 5206.04 0.941 0.02 23.2 1.27
Cr I 5208.42 0.941 0.17 33.7 1.34
Mn I 4033.06a 0.000 -0.65 58.6 0.67
Fe I 4063.59 1.558 0.06 104.9 3.29
Fe I 4071.74 1.608 -0.01 104.2 3.40
Fe I 4132.06 1.608 -0.68 85.9 3.58
Fe I 4143.42 3.047 -0.20 15.7 3.37
Fe I 4143.42 3.047 -0.20 15.7 3.51
Fe I 4147.67 1.485 -2.10 22.2 3.53
Fe I 4216.18 0.000 -3.36 70.1 3.84
Fe I 4250.79 1.557 -0.71 72.6 3.21
Fe I 4260.47 2.399 0.08 73.7 3.50
Fe I 4271.76 1.485 -0.17 112.2 3.53
Fe I 4282.40 2.176 -0.78 41.0 3.45
Fe I 4337.05 1.557 -1.70 38.1 3.54
Fe I 4375.93 0.000 -3.02 85.4 3.79
Fe I 4383.54 1.485 0.21 118.5 3.27
Fe I 4404.75 1.557 -0.15 104.6 3.36
Fe I 4415.12 1.608 -0.62 89.1 3.51
Fe I 4427.31 0.052 -2.92 98.8 4.07
Fe I 4442.34 2.198 -1.25 30.4 3.74
Fe I 4459.12 2.176 -1.28 24.2 3.60
Fe I 4461.65 0.087 -3.21 77.8 3.91
Fe I 4489.74 0.121 -3.97 29.0 3.82
Fe I 4494.56 2.198 -1.14 24.5 3.49
Fe I 4528.61 2.176 -0.82 40.7 3.47
Fe I 4531.15 1.485 -2.15 24.8 3.62
Fe I 4602.94 1.485 -2.21 23.4 3.64
Fe I 4871.32 2.865 -0.36 19.4 3.38
Fe I 4890.75 2.876 -0.39 16.2 3.33
Fe I 4891.49 2.851 -0.11 22.9 3.21
Fe I 4918.99 2.865 -0.34 22.3 3.43
Fe I 4920.50 2.833 0.07 43.5 3.41
Fe I 4957.60 2.808 0.23 54.4 3.40
Fe I 4994.13 0.915 -2.96 21.9 3.61
Fe I 5006.12 2.833 -0.61 17.8 3.54
Fe I 5012.07 0.859 -2.64 45.6 3.68
Fe I 5041.07 0.958 -3.09 20.2 3.75
Fe I 5041.76 1.485 -2.20 25.2 3.64
Fe I 5051.63 0.915 -2.80 36.3 3.74
Fe I 5083.34 0.958 -2.96 25.8 3.74
Fe I 5123.72 1.011 -3.07 16.9 3.69
Fe I 5127.36 0.915 -3.31 12.4 3.65
Fe I 5142.93 0.958 -3.08 16.3 3.62
Fe I 5151.91 1.011 -3.32 12.7 3.80
Fe I 5171.60 1.485 -1.79 43.7 3.57
Fe I 5192.34 2.998 -0.42 16.3 3.50
Fe I 5194.94 1.557 -2.09 25.6 3.62
Fe I 5216.27 1.608 -2.15 16.9 3.52
Fe I 5227.19 1.557 -1.23 73.4 3.58
Fe I 5232.94 2.940 -0.06 30.9 3.42
Fe I 5254.96 0.110 -4.76 8.7 3.91
Fe I 5269.54 0.860 -1.32 121.3 3.76
Fe I 5270.36 1.608 -1.51 61.4 3.72
Fe I 5324.18 3.211 -0.10 12.7 3.31
Fe I 5328.04 0.915 -1.47 110.5 3.72
Fe I 5328.04 0.915 -1.47 110.5 3.52
Fe I 5455.61 1.011 -2.10 71.2 3.69
Fe I 5497.52 1.011 -2.85 24.7 3.64
Fe I 5501.46 0.958 -3.05 17.9 3.61
Fe I 5506.78 0.990 -2.80 31.3 3.70
Fe I 5615.64 3.332 0.05 19.8 3.51
Fe I 6230.72 2.559 -1.28 9.9 3.50
Fe II 4522.63 2.844 -2.25 17.2 3.80
Fe II 4923.93 2.891 -1.26 36.6 3.29
Fe II 5018.45 2.891 -1.10 48.4 3.33
Fe II 5234.63 3.221 -2.18 11.8 3.96
Fe II 5316.62 3.153 -1.87 13.8 3.64
Co I 4118.77a 1.049 -0.48 41.2 1.56
Co I 4121.31a 0.922 -0.33 34.1 1.13
Ni I 5476.90 1.826 -0.78 23.0 2.26
Sr II 4077.71 0.000 0.15 53.6 -2.63
Sr II 4215.52 0.000 -0.18 59.6 -2.21
Ba II 4554.04 0.000 0.17 10.4 -2.21
Ba II 4934.09 0.000 -0.16 9.9 -2.21
aThe effect of hyperfine splitting is included in the analysis.
Abundance results obtained for J 2217+2104 [X/Fe] C 5.55 8.43 1.03 0.2 N 6.10 7.83 2.18 0.3 O 6.90 1 8.69 2.12 0.2 Na 3.64 2 6.24 1.33 0.18 Mg 5.14 5 7.60 1.46 0.08 Al 3.12 1 6.45 0.60 0.2 Si 4.46 1 7.51 0.88 0.18 Ca 2.57 2 6.34 0.16 0.15 Sc II 3 3.15 0.11 0.19 Ti I 1.13 1 4.95 0.11 0.19 Ti II 1.13 9 4.95 0.11 0.19 Cr I 1.30 3 5.64 0.11 Mn 0.67 1 5.43 0.19 Fe I 3.57 60 7.50 0.17 Fe II 3.60 5 7.50 0.24 Co 1.35 2 4.99 0.28 0.13 Ni 2.26 1 6.22 0.18 Zn 4.56 Sr -2.42 2 2.87 0.20 Ba -3.36 2 2.18 0.20 12C/13C 3 89 … …
Abundance ratios of C, N, O, Na and Mg [Fe/H] [C/Fe] [N/Fe] [O/Fe] [Na/Fe] [Mg/Fe] [C/N] [(C+N)/O] [Na/Mg] 12C/13C J 2217+2104 4500 0.90 -3.93 1.03 2.18 2.12 1.33 1.46 -1.15 -0.53 -0.13 6 CS 22949–037 4958 1.84 -3.97 1.06 2.16 1.98 2.10 1.38 -1.10 -0.40 0.72 4 CS 29498–043 4639 1.00 -3.49 1.90 2.30 2.43 1.47 1.52 -0.40 -0.42 -0.05 6 HE 1012–1540 5745 3.45 -3.47 2.22 1.25 2.25 1.93 1.85 0.97 -0.12 0.08 … HE 2139–5432 5416 3.04 -4.02 2.59 2.08 3.15 2.15 1.61 0.51 -0.63 -0.06 HE 1327–2326 6180 3.70 -5.76 4.26 4.56 3.70 2.48 1.55 -0.30 0.64 0.93