Tidal deformability and other global parameters of compact stars with strong phase transitions
Abstract
Context. Using parametric equations of state (relativistic polytropes and a simple quark bag model) to model dense-matter phase transitions, we study global, measurable astrophysical parameters of compact stars such as their allowed radii and tidal deformabilities. We also investigate the influence of stiffness of matter before the onset of the phase transitions on the parameters of the possible exotic dense phase.
Aims. The aim of our study is to compare the parameter space of the dense matter equation of state permitting phase transitions to a sub-space compatible with current observational constraints such as the maximum observable mass, tidal deformabilities of neutron star mergers, radii of configurations before the onset of the phase transition, and to give predictions for future observations.
Methods. We studied solutions of the Tolman-Oppenheimer-Volkoff equations for a flexible set of parametric equations of state, constructed using a realistic description of neutron-star crust (up to the nuclear saturation density), and relativistic polytropes connected by a density-jump phase transition to a simple bag model description of deconfined quark matter.
Results. In order to be consistent with recent observations of massive neutron stars, a compact star with a strong high-mass phase transition cannot have a radius smaller than 12 km in the range of masses . We also compare tidal deformabilities of stars with weak and strong phase transitions with the results of the GW170817 neutron star merger. Specifically, we study characteristic phase transition features in the relation, and estimate the deviations of our results from the approximate formulæ for and -compactness proposed in the literature. We find constraints on the hybrid equations of state to produce stable neutron stars on the twin branch. For the exemplary equations of state most of the high-mass twins occur for the minimum values of the density jump ; corresponding values of the square of the speed of sound are . We compare results with observations of gravitational waves and with the theoretical causal limit and find that the minimum radius of a twin branch is between 9.5 and 10.5 km, and depends on the phase transition baryon density. For these solutions the phase transition occurs below 0.56 [fm-3].
Key Words.:
neutron stars – dense matter – phase transitions1 Introduction
The interior composition of neutron stars (NSs) is still not fully known today. Neutron stars are so compact that the density in their central regions exceeds by far the density of the atomic nuclei. At such extreme conditions matter may exist in a form impossible to obtain and study in terrestrial laboratories. One of the possibilities of very dense matter is the deconfinement of quarks.
Astrophysically, we study the dense matter in the interiors of NSs by measuring their parameters (masses, radii, etc.) and compare them to the theoretical models of a structure and equation of state (EOS). The multiple EOS models, which include a deconfined quark-matter segment, were recently proposed in Ranea et al. (2016), Alford & Sedrakian (2017), Kaltenborn et al. (2017), Mellinger et al. (2017), Christian et al. (2018) and Typel & Blaschke (2018) (see e.g. Buballa et al., 2014; Alford & Han, 2016, for a review). A defining characteristic of these EOS is the phase transition between normal matter and quark matter. To be consistent with the observational constraints, all the EOS have to satisfy the maximum mass criterion, which is now established to be approximately (see Antoniadis et al. 2013 for PSR J0348+0432 and Demorest et al. 2010 for PSR J1614-2230, as well as Fonseca et al. 2016 for the re-evaluation of the mass of the latter).
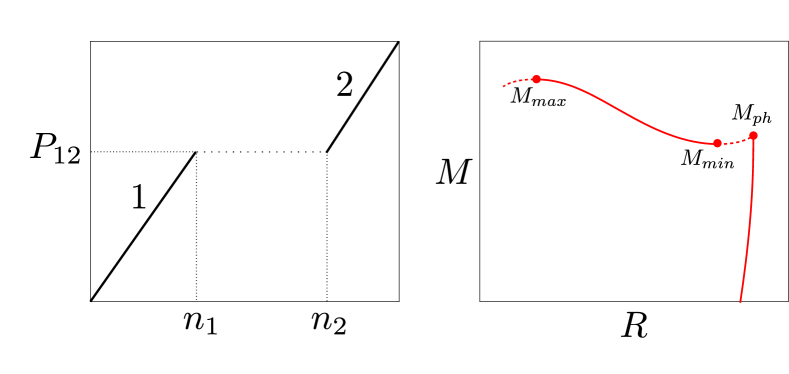
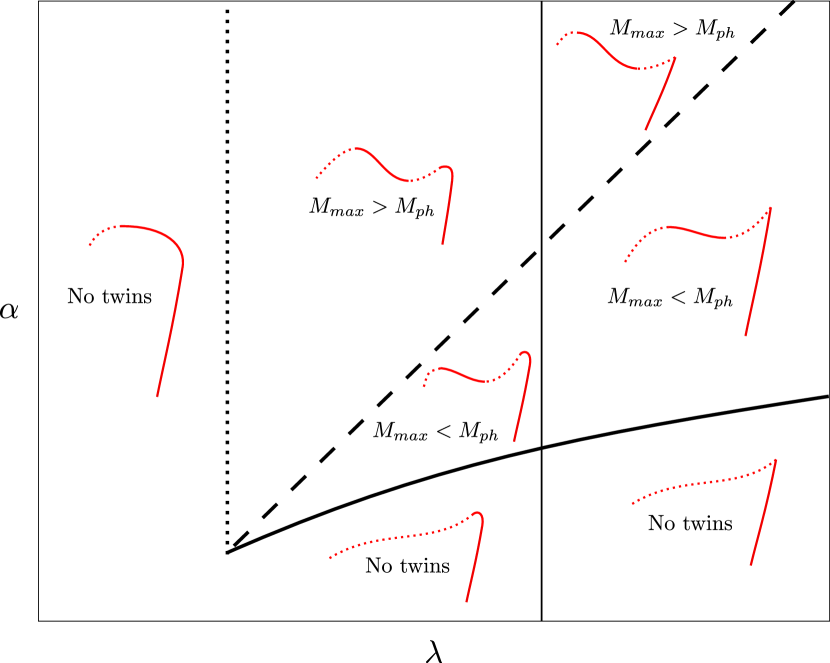
Creation of a new quark phase—the appearance of a new phase core in the centre of a NS—may lead to a destabilisation of a part of the sequence of NS configurations (where the sequence is labelled by a central EOS parameter, such as central pressure, ). If the stability is regained further up the sequence, it is considered a detached (twin) branch of the compact stars (see right panel of Fig. 1 for a schematic depiction of this situation in the plane). In principle, both mass maxima (twin solutions) may exist around the maximum mass , and is called the high-mass twins solutions.
In this article we study the properties related to the twin branch of the NS using a simplified parametric EOS that allows us to analyse the space of NS solutions. Specifically, we study the influence of a strong (destabilising) phase transition on the tidal deformability of the NS, and apply these results to the recent measurements obtained by the LIGO-Virgo Collaborations from the GW170817 event (Abbott et al., 2017a, 2018a, 2018b). For the recent studies concerning the tidal deformability see Annala et al. (2017), Most et al. (2018), Nandi & Char (2018), Paschalidis et al. (2018) and Raithel et al. (2018). We also aim to constrain how the part of the EOS before the phase transition influences the parameters of the EOS after the phase transition. In other words, we aim to put constraints on the observable parameters of the NS (such as the radius that is potentially a measurable parameter) for the masses below that at which the phase transition occurs, and investigate how the shape of the is related to the properties of the twin branch.
The article is composed as follows. In Sect. 2 we describe the parametric EOS and the methods of obtaining the solutions of the hydrostatic equilibrium equations for the NSs. In Sect. 3 we present the properties of NS sequences compatible with existing observational constraints, such as the requirement and the tidal constraints of GW170817. Section 4 contains discussion and summary.
2 Equations of state and methods
In order to survey the space of solutions corresponding to sequences with high-density phase transitions, we employ a conservative approach and use the following simplified, parametric EOS. We assume the knowledge of the low-density part of the EOS and adopt the SLy4 EOS description of Haensel & Pichon (1994) and Douchin & Haensel (2001) up to a baryon density , comparable to and typically larger than the nuclear saturation density (). At a relativistic polytrope (Tooper, 1965) replaces the tabulated SLy4 EOS. The definition of the pressure and the energy-density are standard,
| (1) |
where is the pressure coefficient, is the index of the polytrope, and is the mass of the baryon in this phase. The index is a parameter of choice; consequently, by demanding the chemical and mechanical equilibrium at , and are fixed. The polytrope ends at a density , and is connected to a simple bag EOS (Chodos et al., 1974; Farhi & Jaffe, 1984), characterising the quark matter. We use a linear pressure-density relation of Zdunik (2000),
| (2) |
with denoting square of the speed of sound in a quark matter, and and the energy density and baryon density of this matter at zero pressure, respectively. We assume that at the polytrope/bag boundary matter is softened by the first-order phase transition defined by a density jump . Maxwell construction at this point results in a corresponding mass-energy density jump . The values of determined by the definition of the transition point , together with a given yield, from Eq.2, the values of and . The schematic pressure–density relation for such an EOS is presented in the left panel of Fig. 1. The initial parameter ranges are shown in Table 1.
| min | 0.03 | 2.25 | 0.12 | 1.3 | 0.2 |
| max | 0.30 | 5.50 | 0.65 | 2.2 | 1.0 |
Given the EOS, we solve the equations of hydrostatic equilibrium for a spherically symmetric distribution of mass (Tolman, 1939; Oppenheimer & Volkoff, 1939),
| (3) | |||||
supplied with the equation for one of the metric functions,
| (4) |
for a spherically symmetric metric of the form
| (5) |
and the equation for the total gravitational mass inside the radius :
| (6) |
We solve an additional equation for the tidal deformability of the star, defined as
| (7) |
It represents the reaction of the star on the external tidal field (such as that in a tight binary system; e.g. Abbott et al. 2017a). Influence of the tidal field is obtained in the lowest order approximation, by calculating the second (quadrupole) tidal Love number (Love, 1911)
| (8) |
with the star’s compactness , and the solution of
| (9) |
evaluated at the stellar surface (Flanagan & Hinderer, 2008; Van Oeveren & Friedman, 2017). In the following we use the normalised value of the parameter,
| (10) |
Concerning the current sensitivity of the detectors (Abbott et al., 2017a), what is actually measured is the effective tidal deformability , defined as
| (11) |
with and denoting the component masses. The equations are solved using a Runge-Kutta fourth-order numerical scheme with a variable integration step (see e.g. Press et al. 1992 for details) for a range of central parameters of the EOS (central pressure ) to obtain global parameters of NSs: their masses and radii in the form of the mass-radius sequence.
3 Features of the twin branch
From all the possible sequences resulting from the parameter set presented in Table 1, we select those consistent with the following criteria:
- •
-
•
strong (destabilising) phase transition in the EOS, i.e. an instability near the phase transition point that results in the local minimum in the curve and the presence of the twin branch;
-
•
unless stated otherwise, the maximum mass is located on the twin branch, i.e. (e.g. Sect. 3.3 for twin sequences with );
-
•
the EOS is causal (the speed of sound is smaller than the speed of light in vacuum).
3.1 Mass-radius diagram: minimum radius for the second branch and the tidal deformability
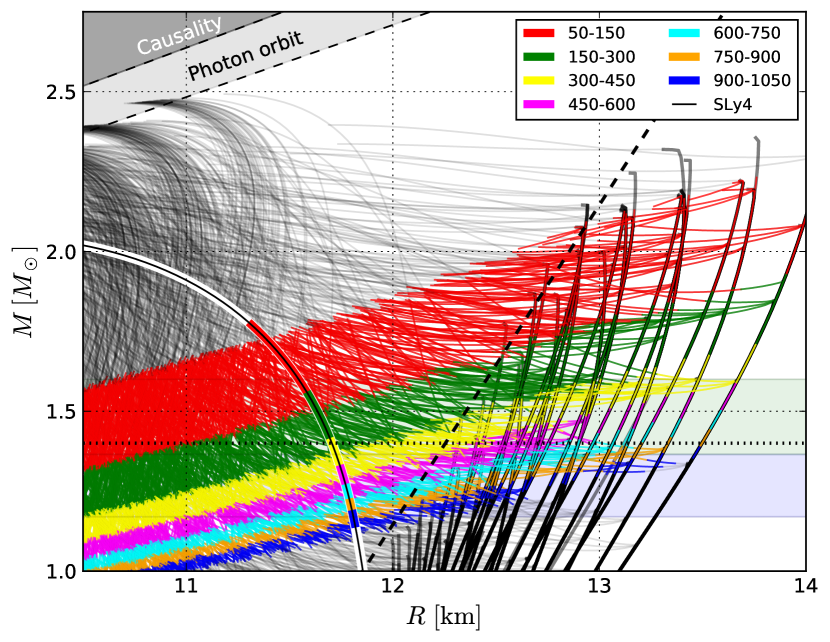
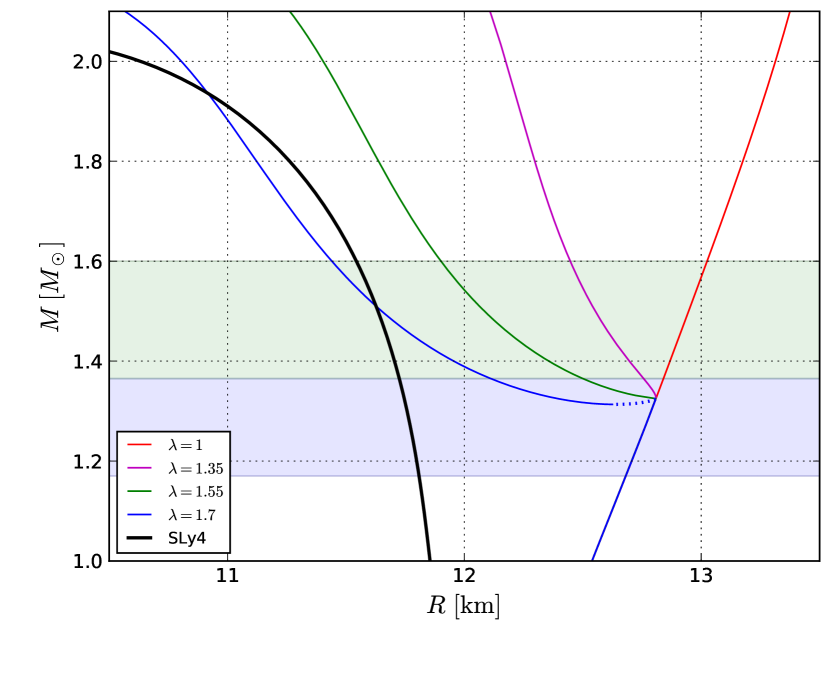
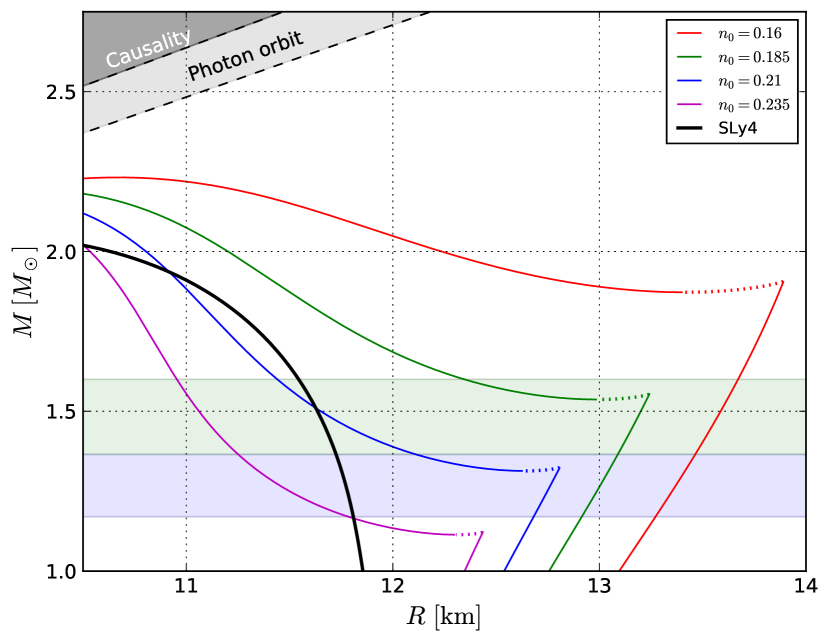
We are interested in establishing a lower limit on the radius at densities below the phase transition point for the EOS compatible with the twin branch scenario. Since it is likely that a large fraction of the NS population has masses below , the future measurements of their radii will be indicative of whether the EOS is able to support a phase transition at higher densities (high-mass twins scenario) in a way compatible with the observations of the massive NSs. In order to obtain the lower bound on the radius, we adopt the parameter in the quark phase equal to its extreme value, . Characteristic shapes of the relations are presented in Fig. 2, where selected regions of the parameters in the plane are also shown. The values of decrease with and increase with thanks to the strong scaling with these values. A limit of 900 corresponds to the lower edge of the orange region. In principle, we can construct a specific EOS corresponding to limiting or still consistent with this bound. We conclude that the minimum radius R on the polytropic branch of the M(R) sequence that still allows for the twin branch scenario cannot be smaller than 12 km with the adopted SLy4 crust, for the astrophysically interesting range of masses (). Softer pre-phase-transition polytropes which give km result either in , or in . In addition to the polytropic index , factors that determine the radius for stars below the high-density twin branch segment are the densities at which the polytrope connects to the SLy4 EOS (low-density SLy4-polytrope connection results in larger radii) and its ending point . This simple exercise shows that the measurements of radii in this range of masses disclose information pertinent to our understanding of the EOS at densities above the nuclear saturation density.
The thick dashed black line in Fig. 2 approximates the minimum radius of the configurations before the phase transition,
| (12) |
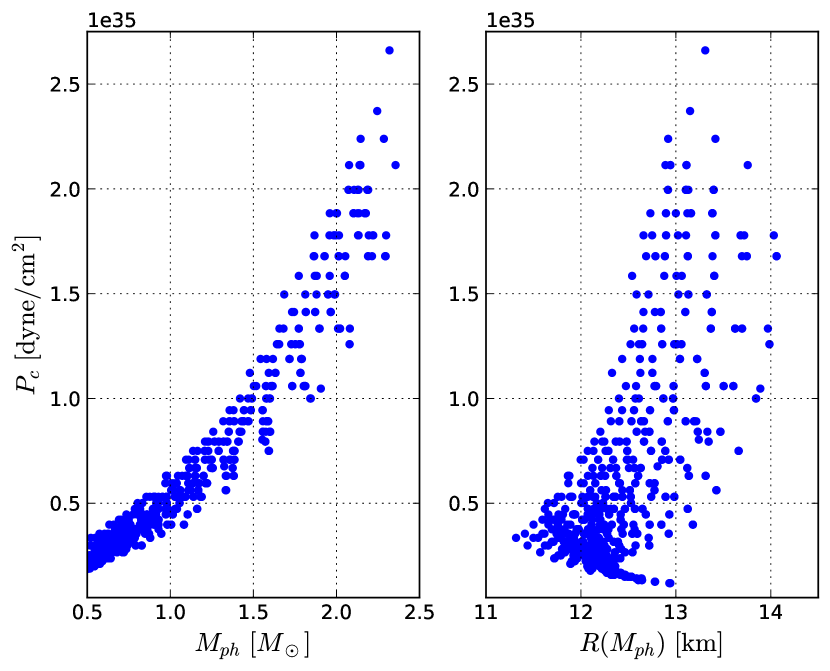
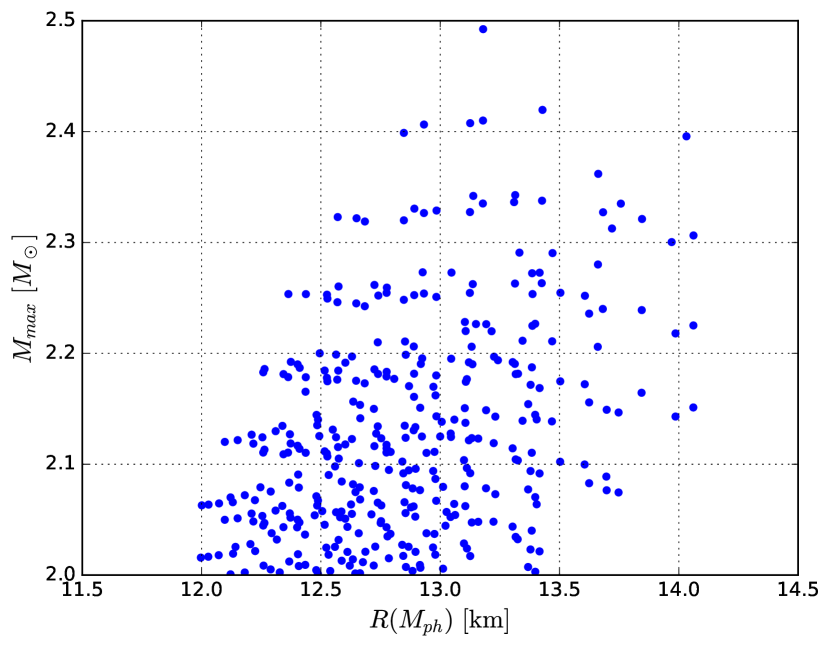
with km. For comparison, we also plot the SLy4 EOS curve, which resides entirely in the quark-core part of the diagram. Figure 5 shows the relation between the central pressure for configurations with and at the end of the polytropic branch; the left-side boundaries of the scatter plots correspond to the minimum radius line in Fig. 2; for example, stars at the polytropic branch with radii smaller than 12 km and corresponding masses smaller than cannot exist with central pressures larger than approximately dyne/cm2. The relation between and is shown in Fig. 6. Small radii at the transition point support lower maximum masses on the twin branch.
3.2 Tidal deformability of stars with weak and strong phase transitions
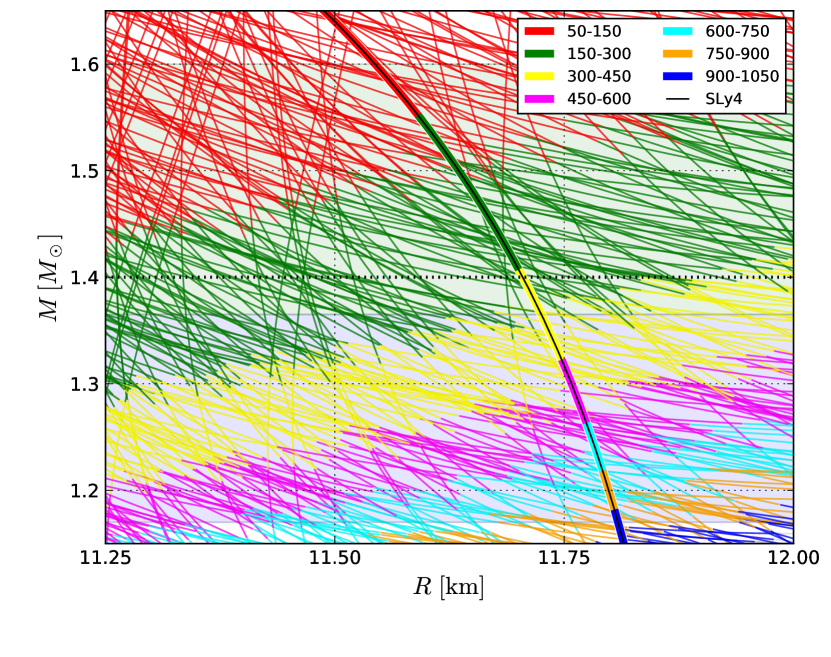
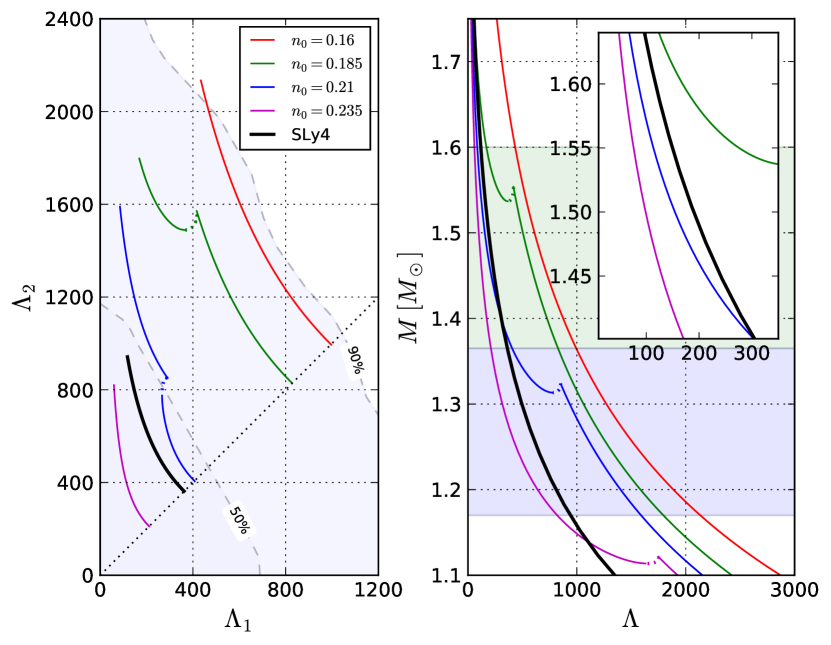
We now study the tidal deformability parameters (Eq. 10) using a subset of the parametric EOS. The ranges of astrophysically interesting parameters are indicated in Fig. 2. We note that it is virtually impossible to define a clear boundary between different ranges on the plane. As the value of depends sensitively on the EOS of dense matter, it cannot be treated as a simple function of and only. This is particularly visible for the comparison of the SLy4 EOS in Fig. 3. Here, depending on the EOS, configurations with the same compactness but visibly different occupy the same position on the diagram, e.g. for and km, the end of the magenta segment yielding is located in the middle of the range for the parametric EOS.
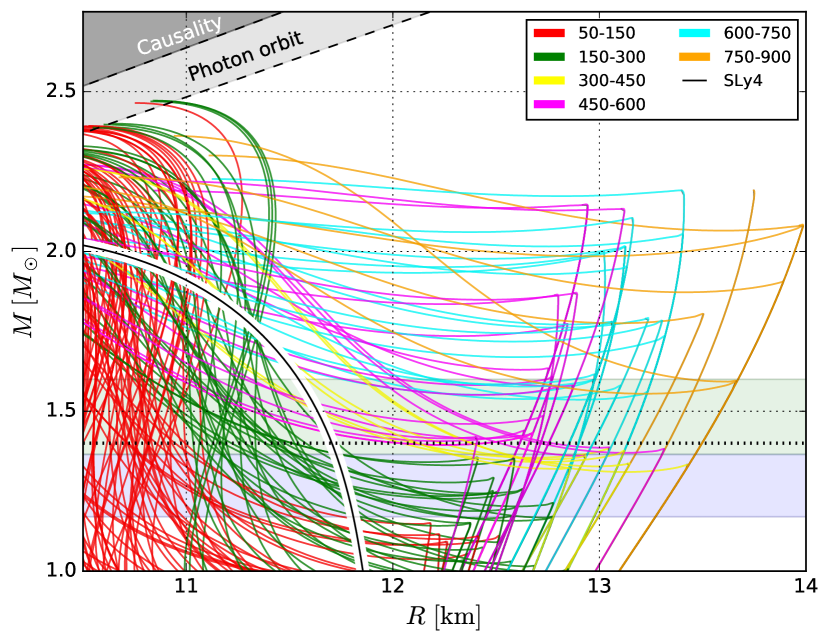
Figure 4 shows a diagram with the EOS colour-coded according to their values of . Here the situation is even less clear in terms of defining the on the plane, also because of the non-monotonic behaviour of due to the strong phase transition: a given EOS may yield several values of corresponding to different . We conclude that representing on the diagram (as proposed by e.g. Annala et al. 2017) is not the best way of uncovering the relation between the and other EOS functionals. Our results are based on a relatively simple model of the EOS; adding more degrees of freedom will only further complicate this picture.
Using the selected EOS from Fig. 2 as an example, we discuss the tidal deformability for the strong-phase transition EOS by applying a measurement of the chirp mass,
| (13) |
and the component mass ranges from the one binary NS merger observed so far in gravitational waves, the GW170817 event (Abbott et al., 2017a). We adopt the central value of the chirp mass, , and component masses in the low-spin prior estimation case: , (Abbott et al., 2017a). An improved analysis that gives consistent results is described in Abbott et al. (2018a, b), where revised values for the low-spin prior of the chirp mass and component masses are , and . A recent correction of the misprint reveal that (Table IV in Abbott et al. 2018b), instead of (Abbott et al. 2017a). Nevertheless, due to the very small differences between initial and re-evaluated estimations of the mentioned values, and the fact that their estimation errors overlap (in the case of tidal deformability values, errors of the estimations are considerable and depend on the waveform model, e.g. for the symmetric TaylorF2 waveform model and for HPD PhenomDNRT , according to Abbott et al. 2018b), we decided to use the results from the detection paper.
To visualise the influence of a phase transition softening on , we manufacture a selection of the EOS that differ in the size of the density jump , and otherwise share their parameters ( diagrams shown in Fig. 7). The phase transition from the polytropic segment of to the linear EOS of occurs at fm-3 (crust-core transition from the SLy4 EOS to a polytropic segment occurs at fm-3). The parameters are selected such that the onset of the softening occurs within the range of masses estimated for the GW170817 event (Abbott et al., 2017a).
In Fig. 8 we plot the relations for the component masses of the GW170817 event by assuming the estimated central value of the chirp mass, . Depending on the strength of the phase transition (measured by the size of the density jump ), the relation may exhibit a non-monotonic behaviour, as shown in the left panel of Fig. 8 for the blue curve. This feature is a direct consequence of a non-monotonic behaviour of the gravitational mass as a function of the tidal deformability (right panel of Fig. 8), which is connected to the instability caused by a sufficiently strong phase transition. Detecting this feature in the incoming observations of NS mergers will clearly signal a dense-matter softening in the range of central parameters corresponding to NS merger component masses.
Additionally, we produced a set of four strong phase-transition curves, displayed in Fig. 9: their common parameters are , fm-3, , . The EOS differ only in the values of the SLy4-polytrope density matching point, fm-3, respectively. These values were selected so that the phase transition mass is placed below, above, or within the ranges of the component masses for the low-spin prior estimation of the GW170817 event (Abbott et al., 2017a). The relations are displayed in Fig. 10. Specifically, the green and blue curves are mirror rotated versions of themselves, reflecting the fact that the phase transition occurs in the range of or , respectively.
When both configurations (twin case) are present in the relevant range of masses (e.g. blue and green curves in Fig. 9 and in the right panel of Fig. 10), the twin branch gives more compact configurations in comparison to those on the polytropic branch, their values are in general smaller, and thus preferable from the point of view of the GW170817 observations (Abbott et al., 2017a). Likewise, larger radii before the phase transition onset (e.g. red curve in Fig. 9) are generally less favoured by the observation of GW170817. This may put limits on the proposed high-mass twin branch solutions in which the onset of a phase transition occurs near (Benić et al., 2015; Kaltenborn et al., 2017; Typel & Blaschke, 2018). Figure 2 visualises the requirement for a high-mass twin solution and the radius: the higher the , the larger the radius at . For dependencies presented in Fig. 2 in the very large range of masses radius increases with mass; this property is typical for a very stiff EOS. As a consequence, high-mass twin configurations in the range of GW170817 masses (before the phase transition) have larger radii and larger than lower mass twins.
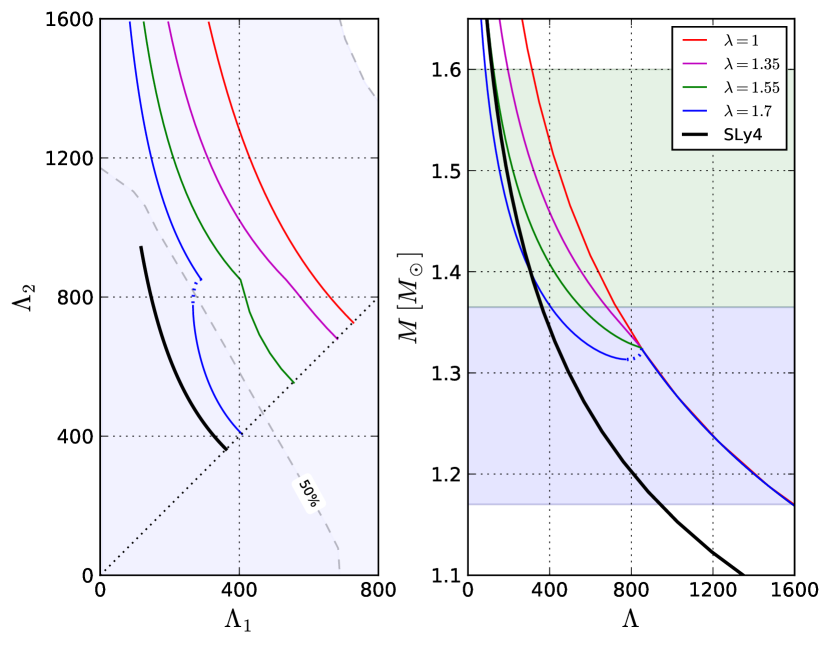
The twin branch segments lie in the region compatible with the SLy4 EOS. Even though the magenta EOS ( fm-3) and the blue EOS ( fm-3) mass-radius relations cross the SLy4 EOS sequence, their values differ in these points, as shown in the right panel of Fig. 10. For the SLy4-magenta EOS crossing at , the (to be compared with the value of at this point) and for the SLy4-blue EOS crossing at ( at this point). Generally, configurations with the same and (same compactness ) have notably different tidal deformabilities depending on their EOS. We plot the set of configurations from Fig. 2 on the -compactness plane (Fig. 11), and compare the results with the fitting formula proposed in Maselli et al. (2013) and recently updated in Yagi & Yunes (2017), (see Eq. 78 and Fig. 15 in Yagi & Yunes 2017). The deviation from the Yagi & Yunes fit is, for the EOS used here, typically larger than 5% and increases above 10% for . The best fit to our set of EOS has the following parameters: , , and (indicated by a green line in Fig. 11).
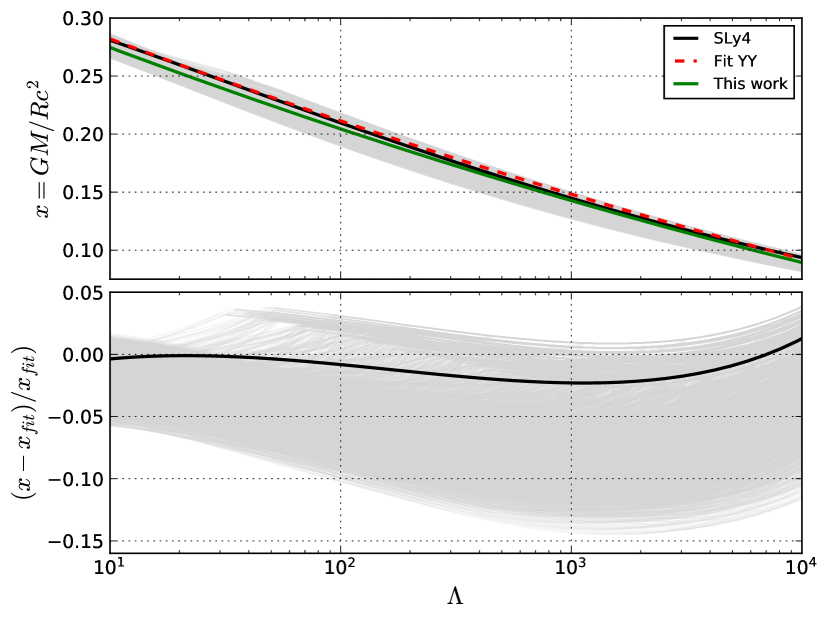
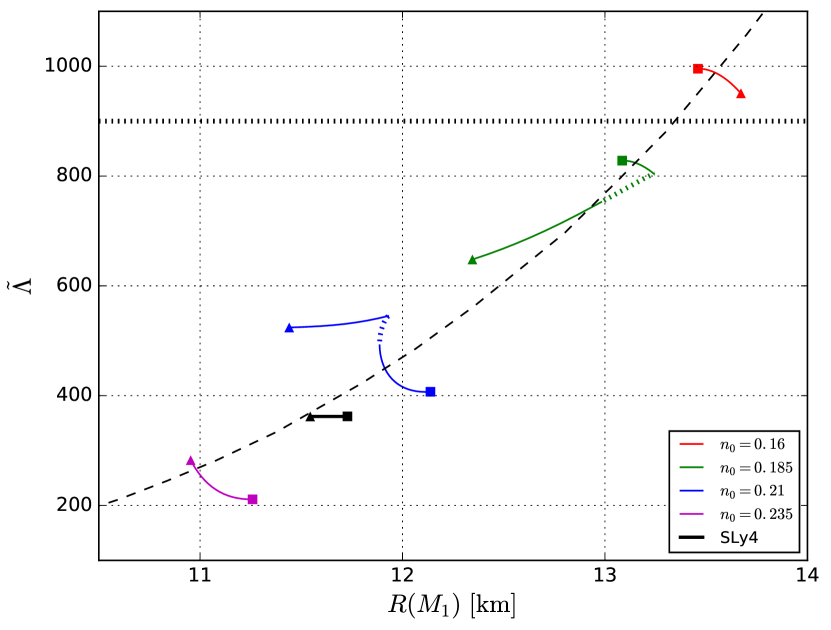
Figure 12 shows the resulting (Eq. 11) in a full range of the GW170817 event low-spin component masses ( for ) as a function of the radius of the more massive component for the selected strong phase transition EOS. These results are compared with the approximate formula for proposed in Raithel et al. (2018), based on a set of the ‘standard’ realistic EOS used in Abbott et al. (2017a). The twin branch spans a considerably wider range in for the allowed component masses of GW170817 than the standard EOS, e.g. the SLy4 EOS, for which the radii are relatively constant. This feature results in a much broader range of allowed values in comparison to the standard EOS: for comparison see Fig. 1 of Raithel et al. (2018), where varies to a much smaller extent than here. The behaviour of the red EOS (but also the violet EOS, in which the phase transition occurs below the lower bound on the mass) is qualitatively similar to the SLy4 EOS, but since the radii of the components change more than in the case of the SLy4 EOS in the appropriate mass ranges, the response of the star to the tidal deformation is larger, as the paramteter is a sensitive function of the radius. We expect a similar behaviour for any other EOS with a similar sequence. The deviation from the fit is of the order of 100 in and of several hundred metres in . The character of the curves depends on whether the phase transition occurs within the range of or (blue and green lines). In the first case, we note a discontinuity in related to the phase-transition induced instability; in the second case, however, the also behaves non-continuously because a range of for which two solutions with different values of is possible.
3.3 Features of the quark twin branch for given polytropic outer layer
In the following we present our study of the polytrope-quark matter EOS in order to connect the properties of the quark part of the diagram to its less-dense, outer part i.e. the polytrope. The last configuration of the polytropic EOS (corresponding to the transition point) is denoted by . For the sake of presentation we use a specific configuration with . It was selected because of its relation to the current maximum observed mass, which we assume to be equal .
| Model | [fm-3] | [fm-3] | ||
|---|---|---|---|---|
| Dark Blue (DB) | 0.192 | 5.45 | 0.325 | 1.9 |
| Blue (B) | 0.1 | 3.7 | 0.37 | 1.9 |
| Cyan (C) | 0.07 | 3.2 | 0.41 | 1.9 |
| Dark Red (DR) | 0.3 | 5.0 | 0.455 | 1.6 |
| Red (R) | 0.228 | 4.0 | 0.48 | 1.6 |
| Orange (O) | 0.14 | 3.418 | 0.518 | 1.6 |
| Yellow (Y) | 0.07 | 2.96 | 0.58 | 1.6 |
Figure 13 shows a complimentary set of features. Here we want to study the influence of the configuration on the twin branch. We fix the parameter to the maximum (). The stiffness of the polytropic EOS (related to the value of ) is directly connected with the derivatives or at , and has a direct impact on the presence of the twin branch. Stiffer EOS at (higher resulting in higher value of ) favours the presence and size of the twin branch. Additionally, we investigate the point before the onset of phase transition. Figure 14 shows the versus relation at the end of the polytope (related to the parameter from Table 2 for each EOS). The colours correspond to the relations in Fig. 13. For illustrative purposes to investigate the conditions at which the stable twin branch may be present, we select several mass-radius relations with (configurations denoted dark red, DR, and dark blue, DB), (red, R, and blue, B), (orange, O, and cyan, C), and one sequence without a twin branch (yellow, Y). The parameters of these configurations are given in Table 2.
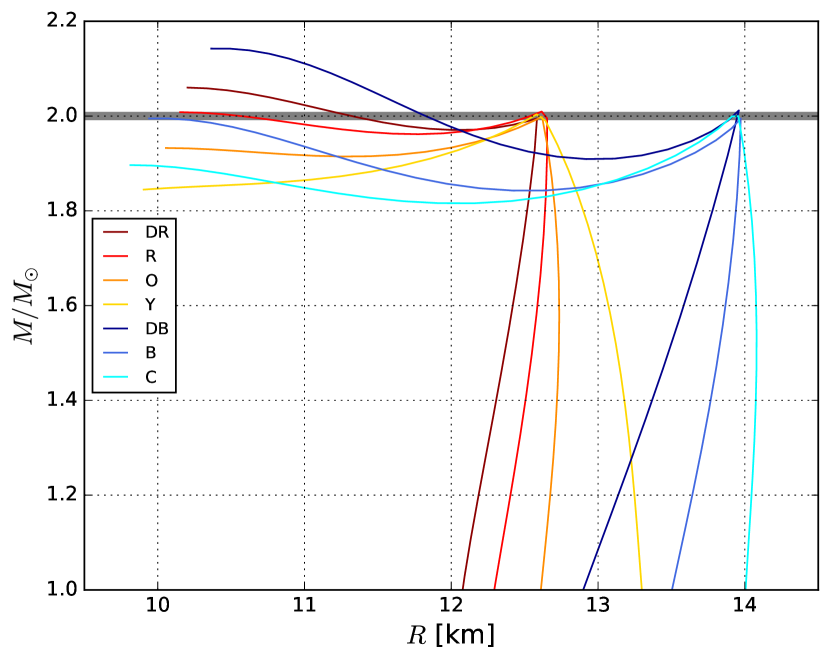
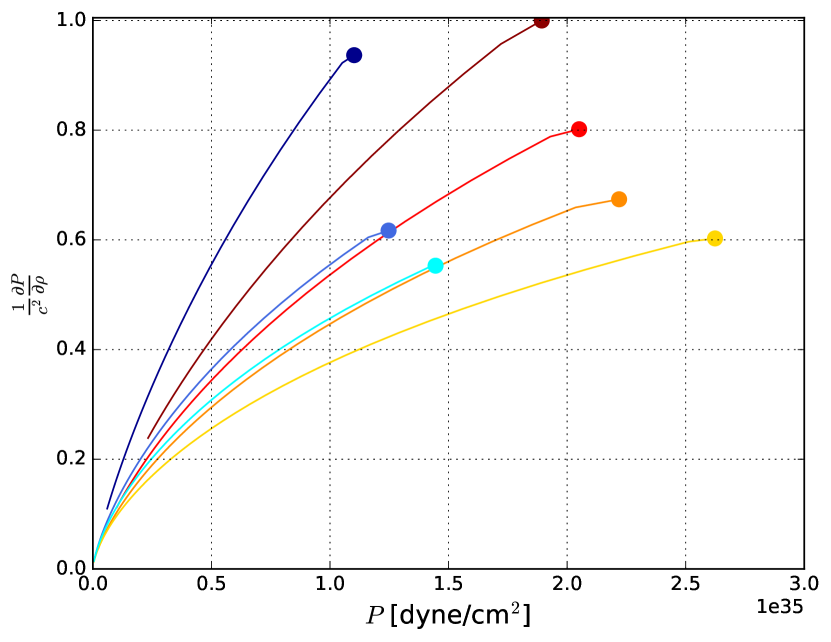
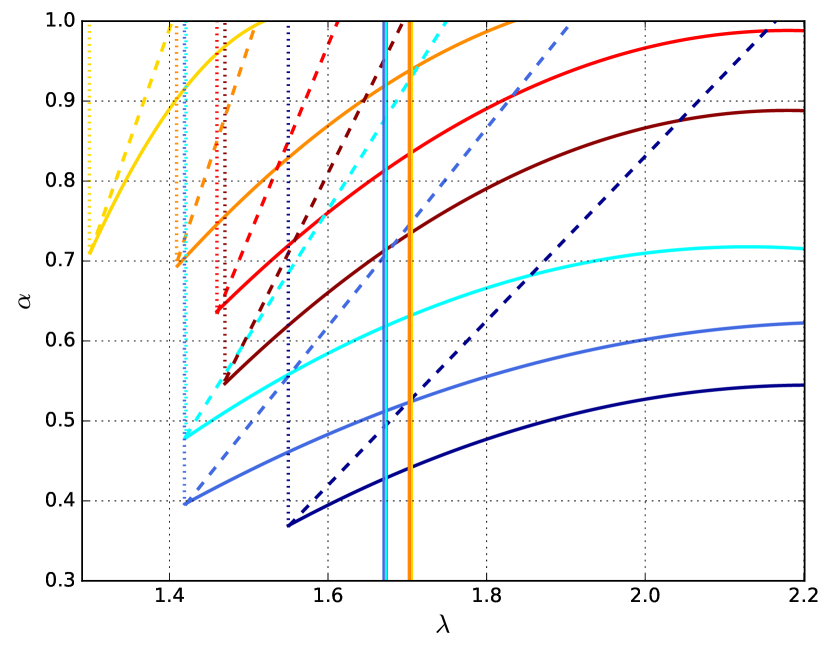
Figure 15 demonstrates the behaviour of the relations for the selected values of the speed of sound parameter (right panel) and the density jump parameter (left panel). Only critical values of and parameters for which stable twin branches can be formed are shown. As expected, the value of the sound velocity of a quark matter influences the stiffness of the core and ability to stop gravitational collapse due to instability resulting from softening by the phase transition. On the other hand, the stiffness influences the size of the instability region between polytropic one-phase stars and hybrid stars with a quark core. For the EOS with smaller radii, at the point of the phase transition, it is harder to produce a stable twin branch. This means that all twin solutions for the R and Y EOS occupy a similar area on the mass-radius plane, while twin branches for B and DB span a much wider space. From the observational point of view, according to Figs. 15 and 17, observations of the NS with smaller radii would put stronger constraints on the parameters of the possible phase transition to quark matter and the quark matter EOS, e.g. values of and , as well as the macroscopic properties of the NSs, e.g. the minimum radius , corresponding to the maximum mass on the twin branch.
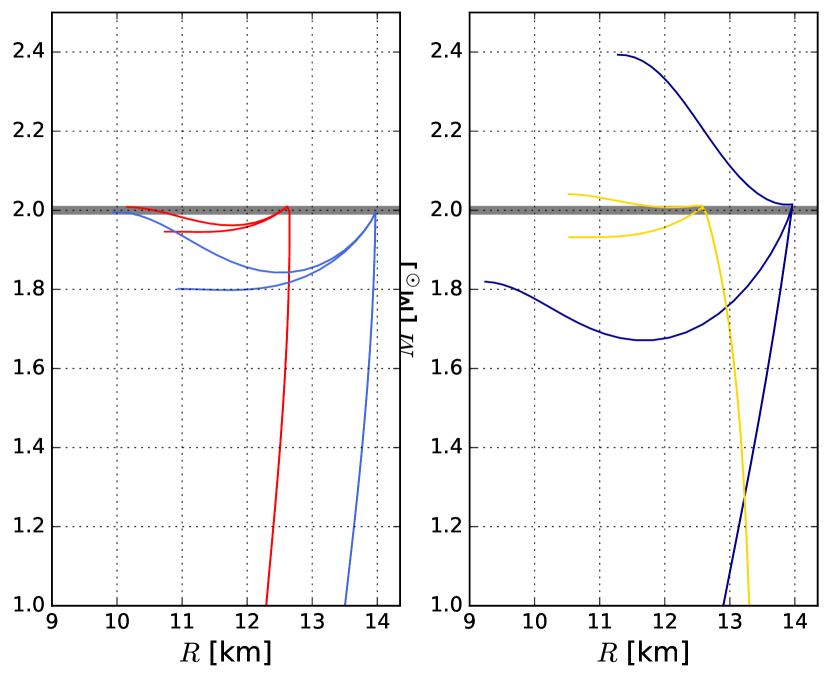
The onset and parameters of the polytrope have a crucial influence on the radius for configurations below and on the behaviour of the twin branch. The smaller the radius (the higher the value of , the smaller the value of ), the higher the value of needed to yield a stable twin branch (compare the lowest red and blue sequences in the left panel of Fig. 15, where lower limit for the R EOS equals for , and for for the B EOS). A similar situation, but for the parameter, is presented in the right panel of the same figure: stable twin branches for the DB EOS can be formed for values of between 1.58 and 2.5, while for the Y EOS the allowed range is much smaller, and lies between 1.34 and 1.48 (both for ).
Figure 16 illustrates the conditions for a stable twin branch. For this, local mass minimum and maximum, and , is required. A marginal case corresponds to . These configurations correspond to the zeros of the approximately linear relation between and the difference in Fig. 16 for the values of , , and as for the B EOS. We note that for smaller values of : i) a smaller value of is required to produce a stable twin branch, ii) higher values of are reached, iii) obtains higher values.
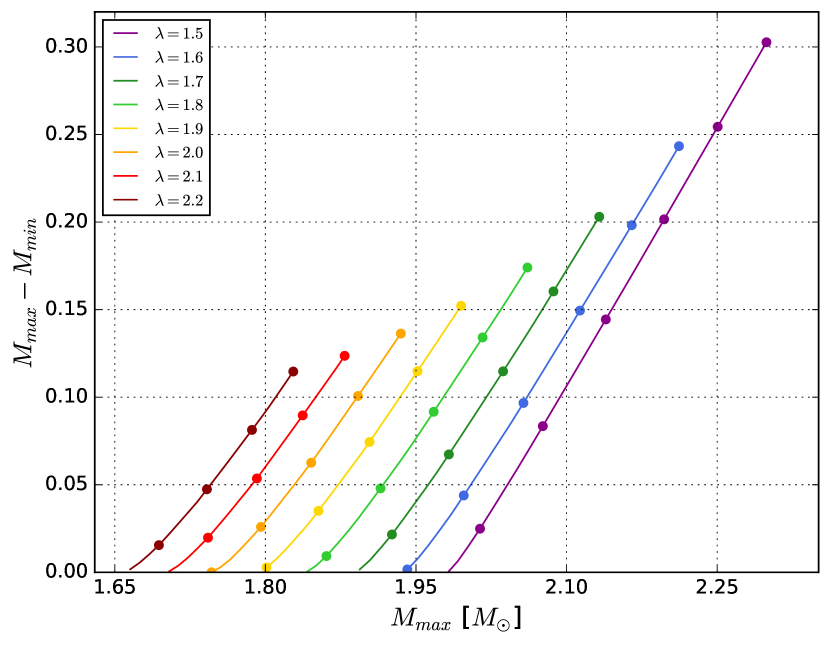
For a given configuration we can plot a relation, defining the onset of a twin branch, from the crossing point of the curve plotted in Fig. 16 with a horizontal line (y=0). For a given this condition defines the critical value of . For the presence of a new, stable twin branch, matter in a dense phase should be sufficiently stiff: .
Another astrophysically important condition corresponds to the presence of stellar configurations on the twin branch with baryon masses higher than the maximum mass of one-phase star . In this case there is a natural evolutionary track which allows for the creation of twin stars. The condition defines for each the limiting value of - . This condition is stronger than just the presence of stable twin branch and . Strictly speaking this condition corresponds to the comparison of baryon masses. However, the relative difference in the gravitational mass of normal and twin sequence for the same is of the order of , and within this accuracy we can consider the condition , which is equivalent to the crossing points of curves presented in Fig. 16 with vertical line . Conditions for the and parameters for which a stable twin branch is possible are shown in Fig. 17. A schematic explanation of this plot is presented in Fig. 18. Stable twin solutions are not possible to the left of the dotted vertical lines, nor below the solid curves. Between the solid curves and the dashed lines, a stable hybrid branch can be formed with . Dashed lines correspond to the situation in which , while the regions between the dashed and dotted curves correspond to .
We also indicate a region of the “Both” class proposed by Alford et al. (2013): it lies between the vertical dotted and vertical solid lines. These configurations are not immediately destabilised after the phase transition; both maxima in the mass-radius relation occur for a finite size quark-phase core. For the Y EOS, all twins are of the “Both” class. Limiting for the DB, B, and C EOS at which “Both” configurations can still be formed , while for the Y, O, R, and DR EOS it equals . A clear separation between these two types of EOS is, in this context, the effect of the separation of the radii at the phase-transition point.
Parameter decides where the transition point occurs. Here we investigate the properties of the twin branch with respect to the density at which the polytrope ends.
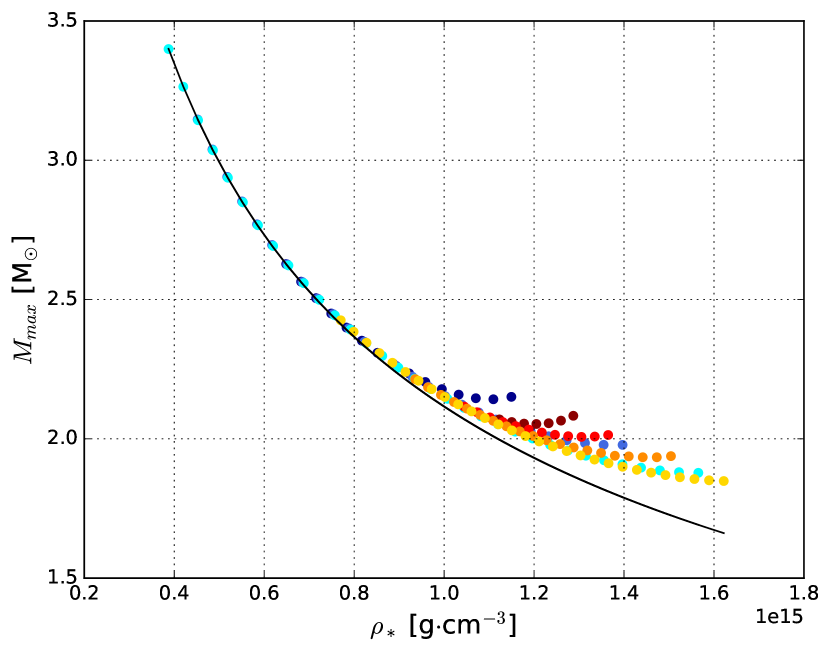
For the set of EOS from Table 2, we changed parameters and chose only the configurations with stable twin branches, as shown in Fig. 19. The configurations with larger radii at the polytropic branch (the C, B, DB EOS) span a wider range of for which our assumptions are fulfilled (see also Fig. 20). This kind of EOS support situation, where the phase transition point occurs at low and where very massive, stable NSs (with even higher than ) can exist on the quark branch. We note that all possible for the DR EOS are in the range km, while for the C EOS this range is much wider: km (shown in Fig. 19 as thick lines and in Fig. 20 as a function of ). We compare these results with the causal limit (see e.g. Appendix D in Haensel, Potekhin & Yakovlev 2007):
| (14) |
The maximum mass is then related to the density as
| (15) |
where g/cm3 (see Eq. 2). The relations for all the EOS are limited by Eq. 14 and asymptotically converge to the causal limit with decreasing .
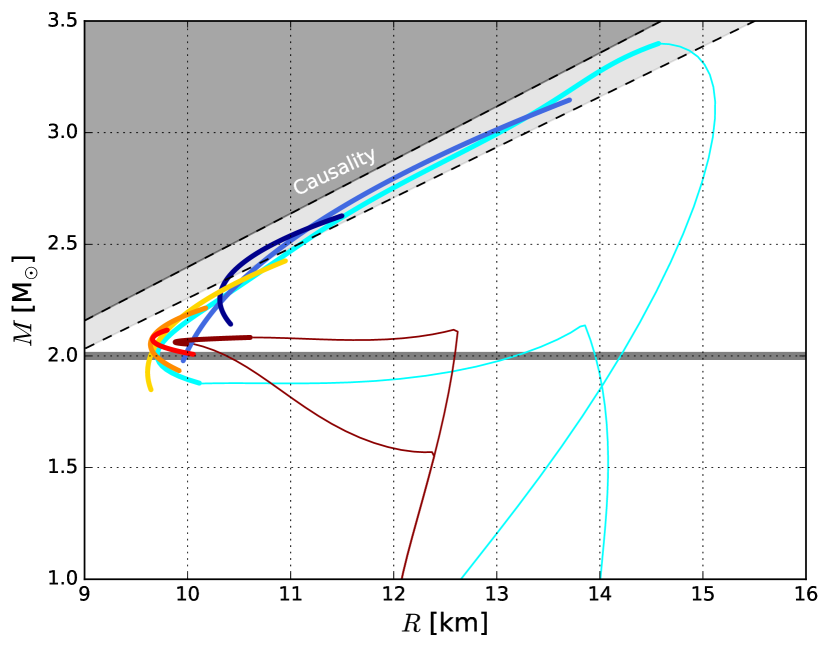
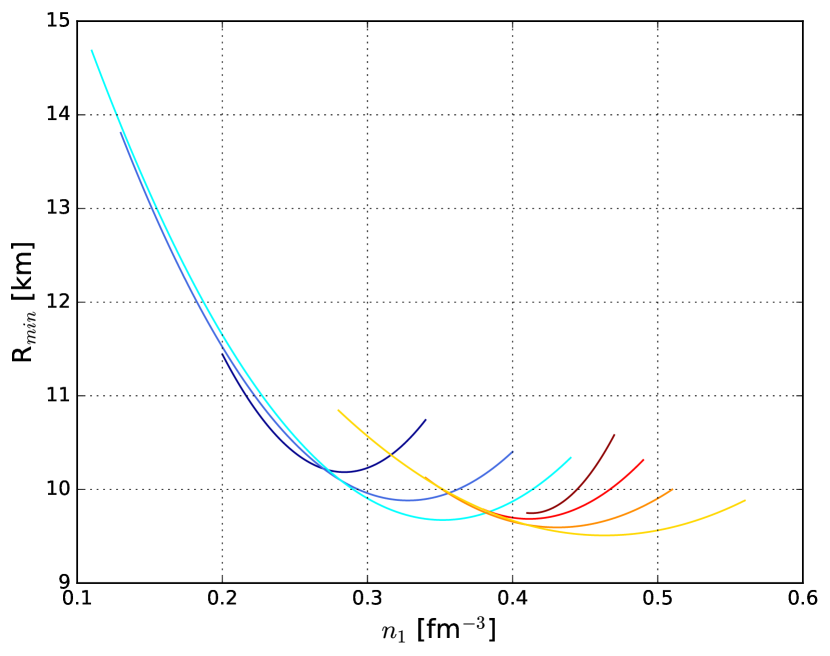
Minimum radii corresponding to are indicated by thick lines in Fig. 19, with between 9.5 and 10.5 km, depending on the EOS. For low values of the radii decrease approximately along the causal limit, reach a value of , and become bigger again for high values of .
We also investigate our results in the context of Eq. 15, as shown in Fig. 21. For the configurations with dominant contribution of the quark phase (like the C EOS), the results converge to the causal limit. If the phase transition starts at higher densities (corresponding to g/cm3), calculated curves diverge from the causal limit. The divergence is especially strong for the O, R, and DR EOS, for which twin branches can be formed for relatively small radii at the transition point. According to the recent analysis of the GW170817 event in Abbott et al. (2018a), these EOS are more favourable than C, B, and DB, due to the smaller radii for configurations without phase transition in the centre and with masses relevant to GW170817 ().
On the twin branch the minimum radius of the hybrid star depends on the density at phase transition (see Fig. 20). For the adopted EOS models the maximum for which a stable, twin branch exists is about [fm-3].
4 Conclusions
In our work we consider stable NSs configurations, described by the EOS constructed using the SLy4 prescription of the crust, joined with the relativistic polytrope, which ends in the transition point where the quark matter phase occurs. This internal structure may reflect as a twin branch in the mass-radius relation, which means that objects with different might have the same .
Recent detection and improved analysis of the gravitational wave event, originated as a NS-NS merger and named GW170817, delivered information about tidal deformabilities of the compact objects. By using the multiple hybrid EOS, we show that the behaviour of the is not straightforward, as regions with different values occupy the same space in the plane. We point out that representing on the plane, as was recently used in the literature, is not optimal for examining the dependency of the tidal deformability on the EOS. We also show that the non-monotonic behaviour of relation depends on the size of the density jump , and directly reflects the non-monotonic behaviour of function. An even more complicated situation occurs when the dependency on the SLy4 crust-polytrope connection point is included.
We find that objects on the twin branch are more compact (in comparison to the polytropic branch) and give smaller values. Such solutions are more favoured from the point of view of the GW170817 analysis. In the case of a high-mass twin branch (where the transition point occurs around ), stars in the range of GW170817 masses have larger and larger than lower-mass twins. Because the NS with the same compactness can have different tidal deformability (due to the different EOS), we show that the deviation from the fit proposed in the literature, for the broad range of the hybrid EOS, is around for and increases to above for the higher values of . We find a similar inaccuracy in the fit on the versus plane, where discontinuous relations for the hybrid EOS span a wider range in than the standard ones (e.g. the SLy4 EOS).
Finally, we focus on the influence of the transition point on the twin branch. Approximately linear relations for versus (for a fixed and changeable ) are used to establish conditions for a density jump and speed of sound, that allow for the creation of different types of twin configurations (i.e. “Both” NSs). For the exemplary EOS, most of the twins with can be formed for at least and corresponding values of , while “Both” stars occupy the range. Generally, the smaller the on the polytropic branch, the more fine-tuned the conditions need to be to produce a stable twin branch. Our whole set of solutions asymptotically converges to the limit of the causal EOS with decreasing values of , and it can be approximated by the causal limit when the central density at the beginning of the twin branch g/cm3 (when contribution to the EOS of the quark phase is dominant). We also show that the minimum radius on the twin branch has a size between 9.5 and 10.5 km and depends on the value. We note that analyses were performed for exemplary EOS, and at most two varying parameters at once from the parameter set (, , , , ), when other parameters were constant. This strategy simplified investigation and allowed us to determine the constraints mentioned above. Nevertheless, a full analysis is needed and is dedicated to future studies.
Acknowledgements.
We acknowledge support from the Polish National Science Centre via grant nos. 2014/13/B/ST9/02621, 2014/14/M/ST9/00707, and 2016/22/E/ST9/00037, and from the European Union’s Horizon 2020 research and innovation programme under grant agreement no. 653477. WT acknowledges the support of the Nicolaus Copernicus Astronomical Center 2015 summer studies programme.References
- Abbott et al. (2017a) Abbott, B. P., Abbott, R., Abbott, T. D., et al., 2017a, Physical Review Letters, 119, 161101
- Abbott et al. (2018a) Abbott, B. P., Abbott, R., Abbott, T. D., et al., 2018a, arXiv:1805.11581
- Abbott et al. (2018b) Abbott, B. P., Abbott, R., Abbott, T. D., et al., 2018b, arXiv:1805.11579
- Alford et al. (2013) Alford, M. G., Han, S. & Prakash, M. 2013, Phys. Rev. D 88, 083013
- Alford & Han (2016) Alford, M. & Han, S. Eur. Phys. J. A (2016) 52: 62.
- Alford & Sedrakian (2017) Alford, M. G. & Sedrakian, A. 2017, Phys. Rev. Lett. 119, 161104
- Annala et al. (2017) Annala, E., Gorda, T., Kurkela, A., & Vuorinen, A. 2018, Phys. Rev. Lett., 120, 172703
- Antoniadis et al. (2013) Antoniadis, J., Freire, P. C. C., Wex, N., et al. 2013, Science, 340, 448
- Benić et al. (2015) Benić, S., Blaschke, D., Alvarez-Castillo, D. E., Fischer, T., & Typel, S. 2015, A&A, 577, A40
- Buballa et al. (2014) Buballa, M., Dexheimer, V., Drago, A., Fraga, E., Haensel, P., Mishustin, I., Pagliara, G., Schaffner-Bielich, J., Schramm, S., Sedrakian, A. & Weber, F. 2014, J. Phys. G41, 123001
- Chodos et al. (1974) Chodos, A., Jaffe, R. L., Johnson, K., Thorn, C. B., & Weisskopf, V. F. 1974, Phys. Rev. D, 9, 3471
- Christian et al. (2018) Christian, J-E., Zacchi, A. & Schaffner-Bielich, J. 2018, Eur. Phys. J. A 54: 28
- Demorest et al. (2010) Demorest P.B., et al., Pennucci T., Ransom S.M., Roberts M.S.E., Hessels J.W.T., 2010, Nature, 467, 1081
- Douchin & Haensel (2001) Douchin, F., & Haensel, P. 2001, A&A, 380, 151
- Farhi & Jaffe (1984) Farhi, E., Jaffe, R.L., 1984, Phys. Rev. D, 30, 2379
- Flanagan & Hinderer (2008) Flanagan, É. É., & Hinderer, T. 2008, Phys. Rev. D, 77, 021502
- Fonseca et al. (2016) Fonseca, E., Pennucci, T. T., Ellis, J. A., et al. 2016, arXiv:1603.00545
- Haensel et al. (1999) Haensel, P., Lasota, J. P., & Zdunik, J. L. 1999, A&A, 344, 151
- Haensel & Pichon (1994) Haensel, P., & Pichon, B. 1994, A&A, 283, 313
- Haensel, Potekhin & Yakovlev (2007) Haensel, P., Potekhin, A.Y., Yakovlev, D.G., Neutron Stars 1 Equation of state and structure (Springer, New York 2007)
- Kaltenborn et al. (2017) Kaltenborn, M.A.R., Bastian, N.U.F., Blaschke, D.B. 2017, Phys. Rev. D, 96, 056024
- Love (1911) Love, A. E. H., 1911, ”Some Problems of Geodynamics”, (Cambridge University Press, Cambridge)
- Maselli et al. (2013) Maselli, A., Cardoso, V., Ferrari, V., Gualtieri, L., & Pani, P. 2013, Phys. Rev. D, 88, 023007
- Mellinger et al. (2017) Mellinger, R. D., Weber, F., Spinella, W., Contrera, G. A. & Orsaria, M. G. 2017, Universe, 3, 5
- Most et al. (2018) Most, E. R., Weih, L. R., Rezzolla, L., & Schaffner-Bielich, J. 2018, arXiv:1803.00549
- Nandi & Char (2018) Nandi, R., & Char, P. 2018, ApJ, 857, 12
- Paschalidis et al. (2018) Paschalidis, V., Yagi, K., Alvarez-Castillo, D., Blaschke, D. B., & Sedrakian, A. 2018, Phys. Rev. D, 97, 084038
- Press et al. (1992) Press, W. H., Teukolsky, S. A., Vetterling, W. T., & Flannery, B. P. 1992, Cambridge: University Press, 2nd ed.
- Raithel et al. (2018) Raithel, C., Özel, F., & Psaltis, D. 2018, arXiv:1803.07687
- Ranea et al. (2016) Ranea-Sandoval, I. F., Han, S., Orsaria, M. G., Contrera, G. A., Weber, F., & Alford, M. G. 2016, Phys. Rev. C 93, 045812
- Tolman (1939) Tolman, R. C. 1939, Physical Review, 55, 364
- Tooper (1965) Tooper, R. F. 1965, ApJ, 142, 1541
- Typel & Blaschke (2018) Typel, S., & Blaschke, D.,2018, Universe 4, 32
- Oppenheimer & Volkoff (1939) Oppenheimer, J. R., & Volkoff, G. M. 1939, Physical Review, 55, 374
- Van Oeveren & Friedman (2017) Van Oeveren, E. D., & Friedman, J. L. 2017, Phys. Rev. D, 95, 083014
- Yagi & Yunes (2017) Yagi, K., & Yunes, N. 2017, Phys. Rep, 681, 1
- Zdunik (2000) Zdunik, J. L. 2000, A&A, 359, 311