On magnetic reconnection as promising driver for future plasma propulsion systems
Abstract
This work presents a more detailed analysis of the process of magnetic reconnection as promising ion beam accelerator mechanism with possible applications in laboratory plasmas and, more importantly, in the plasma propulsion field. In a previous work, an introductory study on this subject was already carried out, yet under the adoption of relevant approximations, such as the limitation to 2.5D simulations and the especially use of Hydrogen plasma as a propellant, whose element is rarely considered in the real scenario. Also, the analysis mainly focussed on studying the physical content of the outcomes, by leaving out the analysis of more important engineering quantities, such as the mass flow and thrust effectively reached out of such systems. With this work, we intend to fill these gaps in order to provide further insights into the great potentiality of a future technology based on magnetic reconnection. Additionally, one of the possibly limiting features was the inevitable symmetric outflow produced by the reconnection process. Among all the possible solutions adoptable, we propose here a solution based on the particle behavior undertaken in entering the reconnection region according to the initial density profile. We demonstrate that a noticeable net thrust value can be achieved by setting up a longitudinal asymmetric density profile with a relevant drop gradient.
1 Introduction
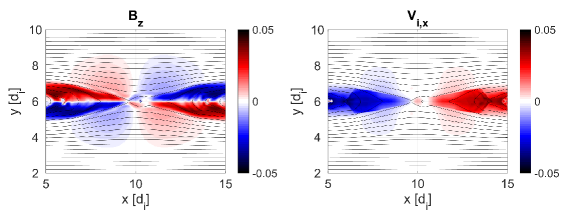
In a previous work the process of magnetic reconnection was investigated as possible efficient ion beam accelerator, by looking in particular at possible innovative plasma propulsion applications [8]. In short, magnetic reconnection is an electromagnetic process occurring whenever two anti-parallel magnetic field lines encounter, which causes a complete restructuration of the local magnetic topology and brings to the release of a great amount of the stored magnetic energy (e.g. [4]). In magnetized plasmas, depending on the initial configuration, it is believed that nearly up to of this released energy goes to particles, either in form of heat or kinetic energy ([22]). This latter distinction is crucial for plasma thruster purposes, as the thermal energy would then need to be further converted into kinetic energy by means of a magnetic or solid nozzle. In the previous work, the authors have determined that, in the configuration adopted for the analysis, during the first half stage of the process nearly half of the energy transferred to particles results to be kinetic energy, becoming mainly thermal energy towards the end of the process. The reader should bear in mind that within this work we are considering a sole collisionless situation, meaning that any neutral-ion energy exchange is not taken into account here. On the other hand, an analysis of the effects with a partly-ionized plasma in the same configuration could be an interesting subject for future works, even though it would require the use of specific collisional Particle-in-Cell codes. For those readers not entirely familiar with this process, a visual representation of some typical magnetic reconnection outcomes is given in Fig. 1. These plots are obtained from a computer simulation with the same setup as in [8]. On the lefthand side we show the out-of-plane magnetic field generated from an initial in-plane magnetic field profile. On the righthand side is shown the outcome in terms of longitudinal component of the ion velocity at the same time step.
In [8] upon performing a series of simulations set with typical laboratory plasma configurations, the most promising outcome in terms of ion outflow velocity was further analyzed more into detail. The study revealed the great potentiality of magnetic reconnection to generate remarkable exhaust velocities and high specific impulse, achieving values comparable with the presently existing plasma thruster technologies. However, given the preliminarily nature of that analysis, important approximations were assumed, including:
-
•
simulations were performed in dimensions, neglecting the variation of vector quantities along the third direction (namely the out-of-plane direction). This approximation may have led to different outcomes with respect to an actual configuration.
-
•
the analysis mainly focused on the energetics and the physical content in the outflow developed after reconnection under a particular initial configuration (i.e. an initially not-equilibrium low- plasma). However, very little was mentioned concerning more applicative quantities, such as the mass flow rate and, more importantly, the effective thrust possibly achievable out of such type of system, which instead seem of greater importance for potential laboratory applications.
-
•
the ion exhaust analysis was carried out over a single reconnection outflow wing. Despite the overall correctness of this choice, the almost longitudinal symmetric outflow generated by reconnection causes the ultimate net thrust gauge to be practically null.
-
•
finally, all simulations were performed considering a plasma made out of Hydrogen. On the other hand, it is now well established that, even though leading to remarkably higher exhaust velocities, this element shows unfortunate difficulties with the ionization process, so that other elements are instead preferred over it, such as Xenon, Hydrazine, Argon and Krypton ([20]).
In this paper we therefore intend to address a more complete analysis of the process by relaxing most of the approximations itemized earlier, such as:
-
•
a full configuration is considered with the same parameters as in [8], even though with a reduced mass ratio due to the significantly computational costs increase
-
•
in line with more typical laboratory applications, we show results from simulations set with a plasma made out of Xenon at its first ionization state ()
-
•
we aim to give new insights into the breaking of the outflow symmetry necessary to obtain an effective net thrust out of this process. Different solutions may be undertaken. The approach adopted here consists in setting up a density gradient along the longitudinal direction (i.e. along in the reference used here), in order to attain an outflow unbalance between the two wings
-
•
with regard to both the previous points, we intend to give more insights into the effective mass flow rates and thrust effectively obtainable. This point is crucial for possible propulsion applications, considering that all currently existing plasma thrusters hold the peculiarity of producing very high exhaust velocities against very low achievable thrusts, this latter mostly due to the limitations of the electric energy suppliers on spacecraft, such as solar panels, which makes this technology not particularly suitable for some specific applications, such as rapid spacecraft trajectory variations or gravity-escape maneuvers.
2 Simulations Setup
All simulations have been performed by adapting the fully kinetic massively parallelized implicit moment particle-in-cell code iPIC3D ([19]). This code has already been successfully used in a wide variety of different contents (e.g. [11, 21, 14, 9, 5]). The code makes use of the following normalizations: lengths are normalized to the ion skin depth , where is the ion plasma frequency, as well as the time unit, velocities are normalized to the speed of light , particle charges are normalized to the electric charge and masses are normalized to the ion mass . All the initial configurations consist in a single not-balanced current sheet domain within a box for the simulations, and a box for the setup. A fixed Cartesian frame of reference is used with the coordinate being parallel to the current sheet, the coordinate being the direction of the magnetic field change, and the coordinate completing the reference set in the out-of-plane direction. As done in [8], a typical laboratory plasma density of is adopted and set uniform all over the domain. The ions and electrons temperature are fixed at, respectively, (i.e. room temperature), and , while the magnetic field profile follows the traditional Harris profile [13, 2] normalized to the asymptotic field value of , namely
| (1) |
with . According to this density, the simulated box size results in a domain in , and domain in (). As pointed out in [8], this specific initial setup partially recalls the not-force-free simulation studied in [3], and particularly important is set a proper initial perturbation to trigger the reconnection process in a selected point, which lies in the middle for this case. Boundary conditions are chosen open along each boundary to better represent a realistic physical system. Particles and fields are free to escape the domain across the boundaries, with particles being re-injected from the borders, as similarly done in [10] and [26]. Also notice that in the cases with Hydrogen plasma, both 2.5D and 3D, we are dealing with a fully ionized gas, whereas in the case with Xenon plasma we are dealing with an element ionized at its first ionization stage. On the other hand, all partcles are considered either fully or partly ionized, so that there is no production of neutrals. A more detailed explanation on how a partly ionized plasma has been handled in the simulations will be introduced in Sec. 3.2.
3 Results
3.1 Hydrogen Plasma - 2D
In the work presented in [8], the authors mainly focused the analysis on the physical content of this particular reconnection configuration, leaving momentarily out a more detailed analysis on other engineering quantities, such as the effective mass flow rate and, more importantly, the thrust obtainable from this process. This section then intends to fill this gap by addressing an ad-hoc study on these important outputs under the same configuration. Until now, the specific impulse has been consider as the most suitable parameter for a direct comparison with currently existing technologies. This quantity is computed as the ratio between the exhaust velocity and the gravity constant. The key point is therefore what exhaust velocity to consider. In [8], this quantity was represented by the average ion velocity along the direction, whose choice was mainly driven by the 2D nature of the analysis. However, the velocity components along and are also observed to be not negligible. We then propose here a study of the mass flow rate and the thrust by considering two different approaches: on one hand we intend to consider again the sole -component of the ion velocity as the main relevant longitudinal direction of an hypothetical device, whilst on the other hand we intend to show the same outcomes as when the total average velocity magnitude is considered. The mass flow rate is computed as
| (2) |
where is the outflow mass crossing a specific cross section. This mass is computed as the sum over all the masses along the specific cross section. Notice that is being considered with its absolute value in order to give a better understand of the actual crossed mass. Being a scalar quantity, the sign would only indicate its direction upon setting up a reference direction. From the simulation output, the mass in each cell is computed as
| (3) |
where is the ions/electrons charge density, and and the respectively masses in . is the initial particles density, which is here set as . By considering negligible any instantaneous velocity variation, as also done in the rocketry literature [24, 20], we are able to compute the thrust from the momentum equation as
| (4) |
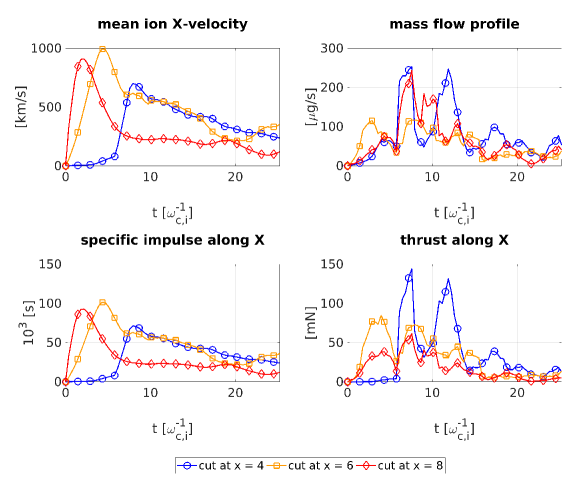
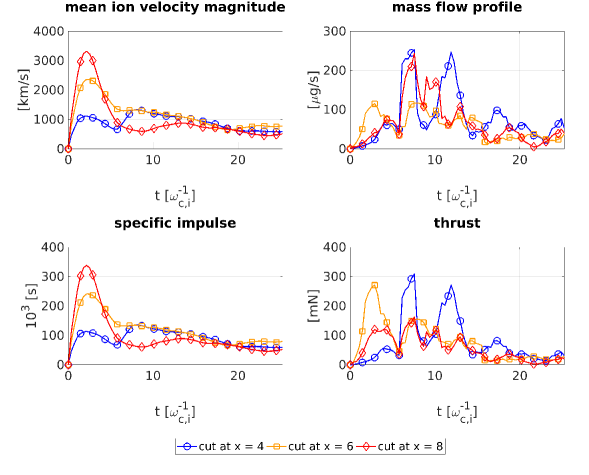
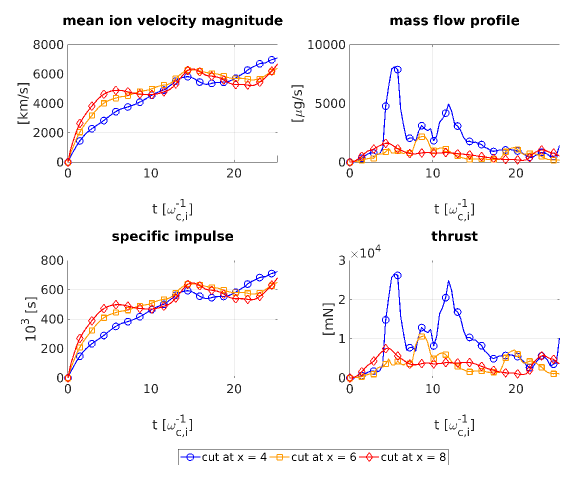
Notice that for the case in study the mass flow rate is determined only from the ions, as electrons have such a smaller mass that their total mass can be considered negligible. Accordingly, the velocity in Eq. 4 is the ions fluid velocity. Figures 2 and 3 show the results obtained for the 2.5D case with Hydrogen plasma. Notice that these plots have been slightly smoothed for a better readability. The quantities are studied in the same cross sections as considered in [8], which may identify three different possible exit edges of the device. Besides the specific impulse, three quantities are also represented, including the mean ion velocity, the mass flow rate expressed in and the generated thrust expressed in . Notice that the velocity is switched in sign for a better representation (i.e. multiplied by ). Unlike the case in [8], here the evolution is studied up to the time of , as at later times the process can be considered finished. This reason will also be particularly helpful for the comparison with the cases shown later, which are overall seen to finish earlier.
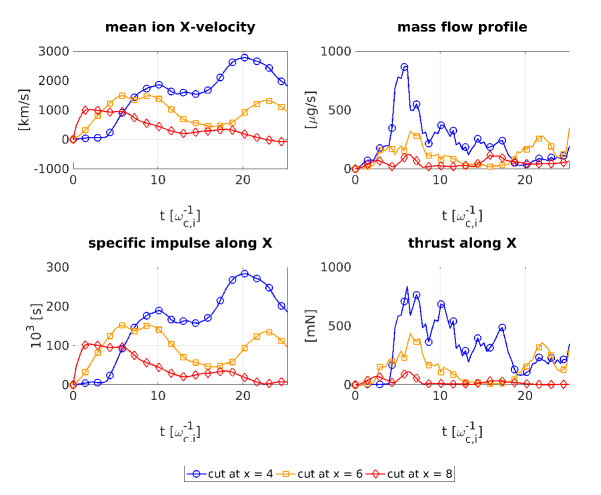
The specific impulse profile in Fig. 2 pretty much resembles that shown in [8], with the only discrepancies being most likely caused by the curve smoothing. In fact, in both the cases we observe that the greatest value is reached across the outermost section at , whereby the reconnection outflow is more developed, while a lower magnitude peak is observed across each of the other two sections. In particular, a first peak is observed across the nearest section to the reconnection region, followed by a second increasing peak at nearly half-way of the outflow. Interestingly, across the farthest section we notice a double peaked temporal evolution, as if the outflow was being pushed out in two different stages, by ultimately achieving very high velocity values. The latter can be explained by the presence of secondary reconnection processes occurring over the exhausts outflow.
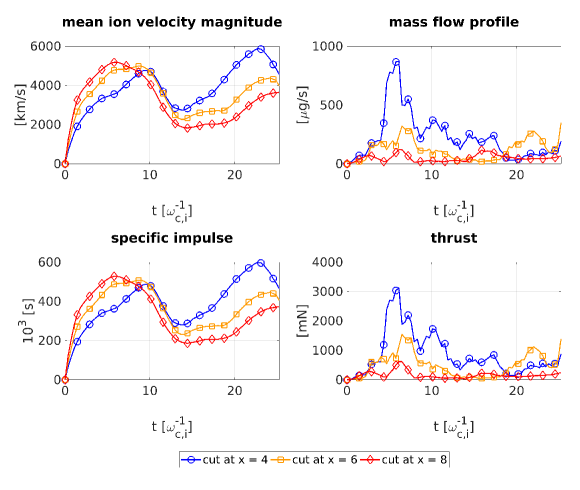
The situation is seen drastically changed when the ion velocity magnitude is instead considered. Here we observe the specific impulse to display as twice the values as in the previous case, pointing out that the other two velocity components can be quite determinant. As in the previous case, all the profiles show a double-peaked evolution, indicating a second acceleration occurring later in time. The situation across the three cross-sections show quite a more uniform profile, with the peaks being increasingly sorted according to their distance from it, although displaying a very little discrepancy among their maximum values.
Interesting is the evolution of the mass flow rate. This quantity is not influenced by the type of velocity considered. So the two cases show exactly the same behavior. We observe that the maximum mass crossing is always obtained in the earliest stage of the process, with the dominant value observed across the outermost cross-section. The flow rate is maintained fairly steady during the bulk of the reconnection process (i.e. between and ).
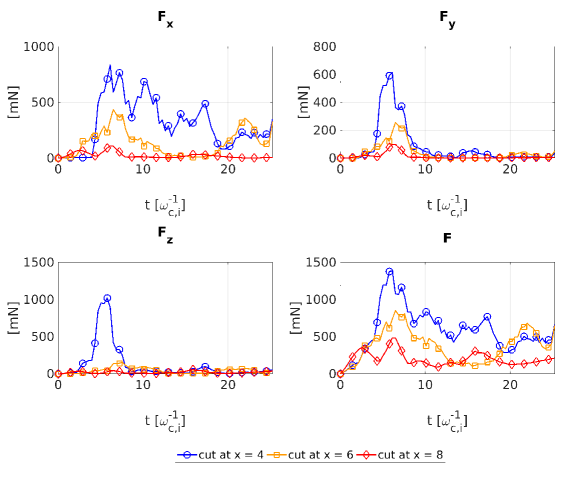
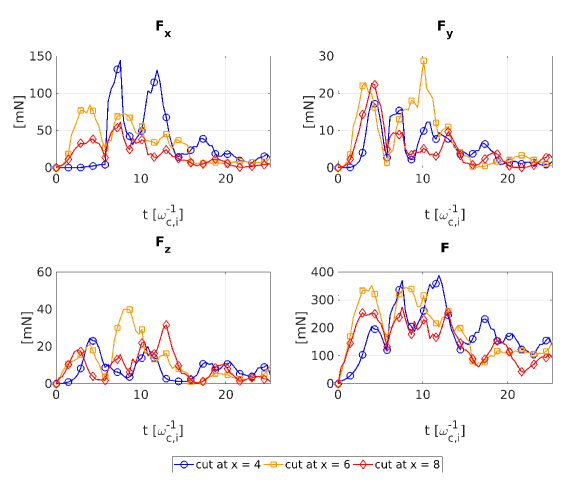
The thrust evolution follows the combination of both the mass flow rate and the velocity profile. We observe the highest thrust to be generated during the first stages of the process, by maintaining after a sufficiently high outcome throughout most of the process. Overall, the most suitable outflow boundary for an hypothetical device results in being as far as possible from the reconnection region. The thrust becomes more relevant as we consider the magnitude of the velocity rather than the single component. While the profile does not change much with respect to the previous case, the magnitude instead makes itself much higher achieving values as high as . We therefore identified how the other thrust components may affect the overall evolution. We plot them in Figure 4, where can be noticed that even though the direction is still nearly the predominant force direction, the and components show to become the relevant ones for a very short time period in the region far out of the reconnection region. This result may need a further investigation in the future for the necessity to have to counter-act these lateral forces and obtain a more balanced system. For instance, a solution could be adopting a symmetric double current sheet configuration such that the overall lateral force balance result satisfied while maintaining the longitudinal force unaltered.
3.2 Plasma - 2D
As mentioned in the introduction, Hydrogen plasma is rarely employed for plasma propulsion purposes due to its difficulty in being easily ionized. Upon this fact, other elements are currently considered, such as Xenon, Hydrazine, Argon and Krypton ([24, 20]), which show lower ionization energies, yet at the cost of a much lower output exhaust velocity. It is in fact well-known that the achievable exhaust velocity is inverse proportional to the atomic or molecular mass of the element used. In this section we show the results from an analysis considering a system similar to that shown in the previous section, but a plasma made out of Xenon ionized to its first ionization state. Even though the initial configuration is globally the same as that for the Hydrogen case, such a heavy element as Xenon requires us to sensibly lower the simulation mass ratio down to for a better simulation performance (indeed, as iPIC3D is normalized to the ion mass, it is , with the Xenon atomic mass and the proton to electron mass ratio, here chosen equal to ).
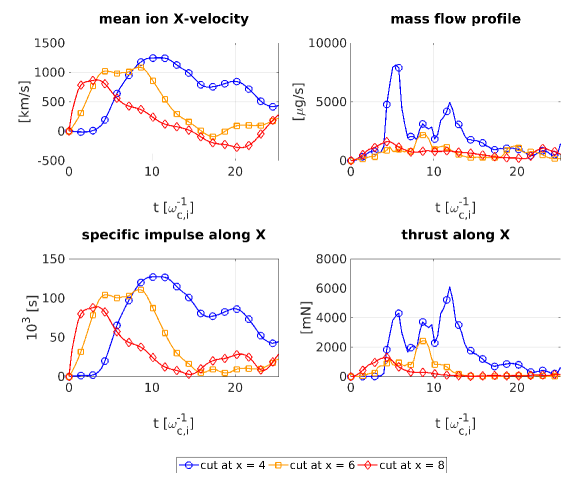
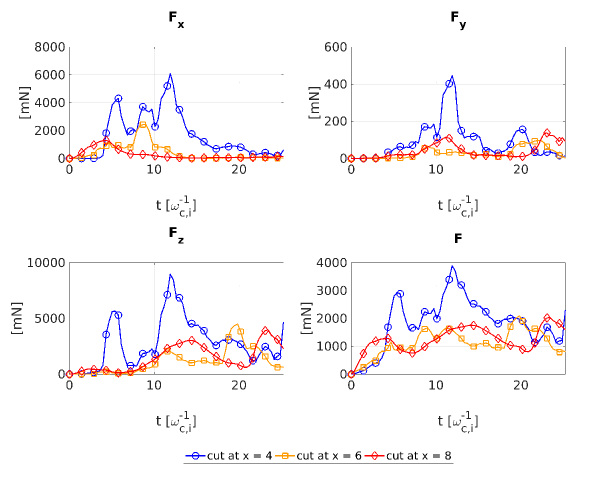
Figures 5, 6 and 7 show the same quantities shown earlier for the new case with Xenon. As expected, we observe a lower magnitude of the specific impulse due to the lower exhaust velocity caused by the Xenon’s higher molecular mass. However, unlike the previous case the situation along the -component shows a series of peaks apparently not directly correlated to the distance from the reconnection region. In particular, we notice that the maximum value is reached in the middle of the outflow (i.e. section at ). The latter suggests that magnetic reconnection in Xenon plasmas occurs faster than in Hydrogen plasmas, reaching out the top of its ion outflow velocity at the very early stage of the process, yet still maintaining a steady outflow velocity profile. Interesting is the mass flow profile, which shows the formation of a double-peaked profile shifting in time, with its highest magnitude observed across the farthest cross-sections. The latter makes sense if we consider the flow tends to decelerate and accumulate towards the external boundary. Unlike the former case, however, we also observe that when the average magnitude of the velocity is considered, the situation results to be neater, with a lower value than with the only single component. The latter suggests that the other two velocity components play a minor role. This is also confirmed by the plots in Figure 7, which indicate that the thrust along the directions perpendicular to are at least one order of magnitude lower. The thrust itself is however lower than the case with Hydrogen, most likely due to a lower ion exhaust velocity achieved in this condition. The mass flow rate shows to be more or less in line with the previous case, even though with a much smoother profile. Instead of the peaking observed across the farthest section, we now observe a more constant profile along all over the process, which might be a more preferable choice from a controllability point of view.
3.3 Symmetric Outflow Breaking
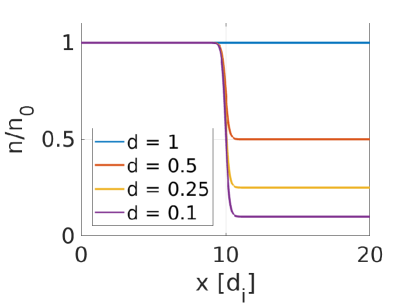
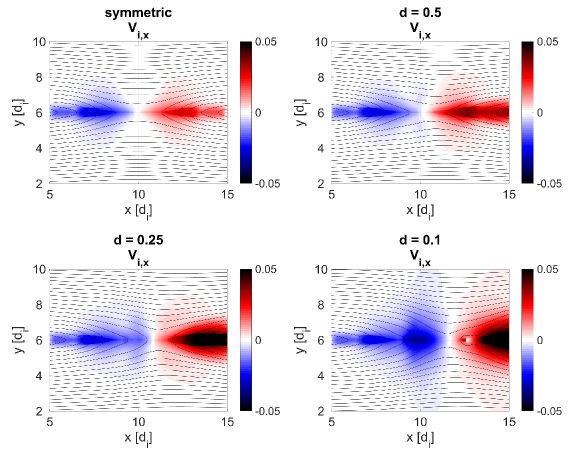
As introduced earlier, one of the main point not addressed in [8] was the fact that a nearly symmetric outflow expelled in two opposite directions cannot generate a net thrust, causing the whole system to stand in a perpetual steady position. This is also the reason why only one reconnection wing was indeed taken into consideration in that work. In order to break this symmetry, several solutions may be undertaken. Here we propose a solution based on a reconnection configuration resembling the situation in the outer the solar corona, and already considered in earlier works ([1]). The underlying idea is to consider a longitudinal asymmetric density profile along the direction, by recalling the different behavior hold by ions and electrons in entering the reconnection region ([17]). The magnetic field is instead still kept symmetric. A similar situation can also be appreciated from simulations of magnetic reconnection occurring at the magnetopause, whose transversal asymmetric profile brings the reconnection outflows to take an asymmetric shape [7]. Given the different balance between the particles outflow and the magnetic tension, the two wings now evolve differently from each other, giving out a ultimate different mass and velocity outflow, therefore leading to an overall non-null net thrust. We then recalled the same simulation as explained in Section 3.1 but now featuring a set of different density drops along the direction, namely , and of the initial asymptotic value. The density profile now reads
| (5) |
where is the decrease percentage, i.e. , and indicates the drop steepness, set here as . Different values may be used in future as a regulation parameter. Fig. 8 shows the density profiles here considered.
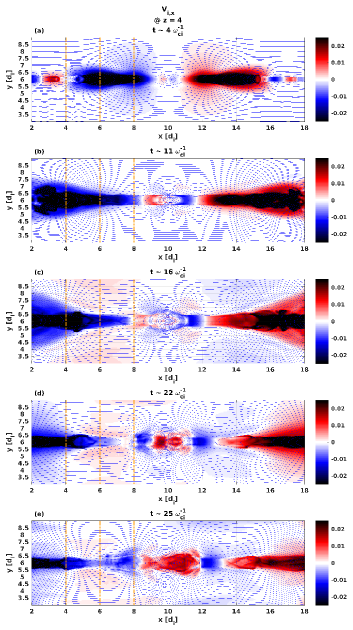
Before analysing the mass flow rate, we give an overview of the different longitudinal velocity outcomes obtained with these different density profiles in Fig. 9, where the asymmetric outflows can be neatly observed.
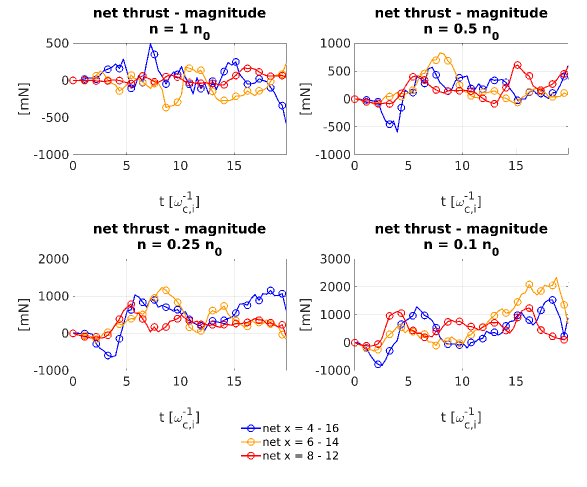
We can now make a comparison of the thrust evolution between the same cross-sections considered earlier and those specularly located in the other reconnection outflow, shown in Figs. 10 and 11. We intentionally kept the same color-code for each corresponding pair of specular sections to have an immediate view of the departure from each other. To prevent from including in the analysis the formation of too many secondary islands, we preferred to interrupt the simulations at nearly , when we can still consider the reconnection process amply concluded.
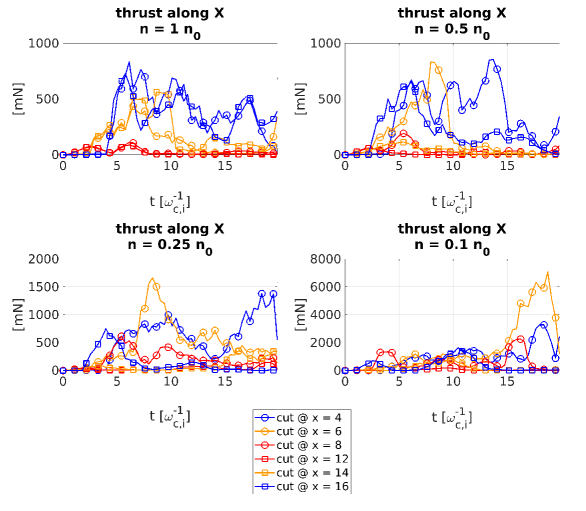
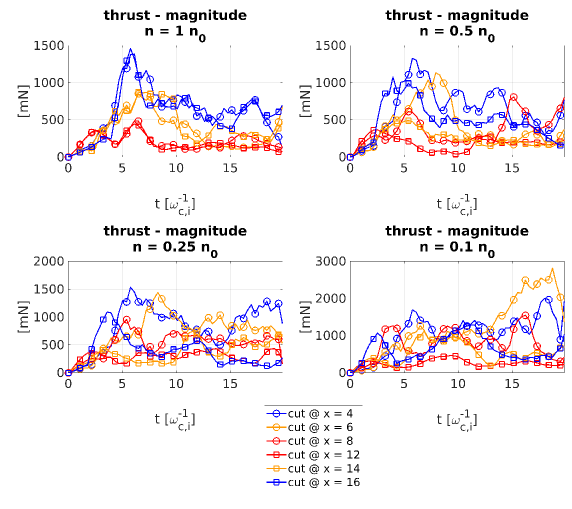
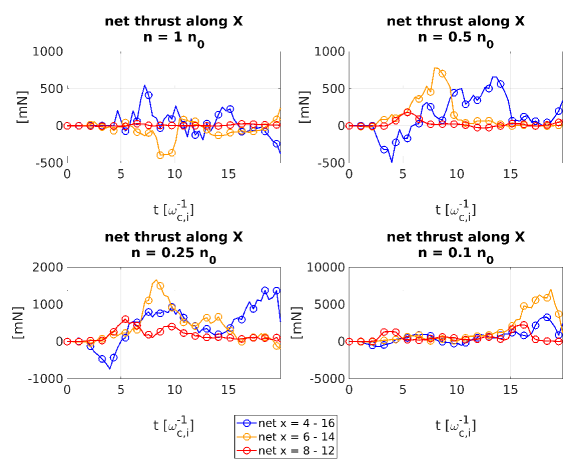
We focus on the case along first. We notice that no great discrepancy is observed when the density is kept uniform. The only divergence between the two sides is seen in the outermost sections (i.e. blue lines) at later times, and through the intermediate sections at intermediate times. This difference is likely to be caused by the occurrence of secondary reconnection events, which make the situation slightly asymmetric. However, we globally observe an overall consistency between the two sides. Such consistency is more and more broken as the density drop ratio increases. For convenience, in Figs. 12 and 13 we also plot the thrust difference between the corresponding sections. Notice that the difference is set as the left-hand side minus the right-hand side, with the sign obtained accordingly. When the density is kept constant, a couple of net thrust peaks are seen to occur. Again, this can be explained with the formation of smaller secondary islands, which go to influence the overall local thrust balance. In fact, the latter is mainly seen farther out of the reconnection region, whereby the earlier collapse of the current sheet makes the outflow-islands interaction more plausible. A more interesting situation is depicted when an asymmetric density profile is set. The most advantageous situation seems to be attained in the last case with one wing holding only of the initial density. Here the net thrust achieves very high values at late times. However, such situation can be considered a limit case due to the onset of several instabilities caused by such steep density gradient. The other two intermediate solutions underline that a density of a quarter of the initial value overall gives the best results, despite the negative values shown at the early stage soon counteract with a global relevant gain over the rest of the evolution. When the entire thrust is considered, we observe the situation to be much neater, with the case with density down to showing the most interesting outcomes. This indicates that the other thrust components play a fundamental role in stabilizing the entire system. Finally, we propose a summary of the time-average values of the net thrust for every cross-section pair in Table 3.3. Even though the case with no density gradient does not show a null value as it should be expected, most likely due to the formation of secondary effects such as magnetic islands which may influence the local thrust in an asymmetric fashion, this value is so low that can certainly be considered negligible compared to the order of magnitude of the other cases (units are in ).
| Case | cross-section 4 - 16 [mN] | cross-section 6 - 14 [mN] | cross-section 8 - 12 [mN] | [mN] |
|---|---|---|---|---|
| 112.64 | -232.70 | 71.88 | -48.18 | |
| 338.46 | 541.50 | 262.27 | 1142.24 | |
| 1001.50 | 1167.67 | 579.86 | 2749.03 | |
| 1258.16 | 2709.06 | 1449.63 | 5416.84 |
3.4 Hydrogen Plasma - 3D
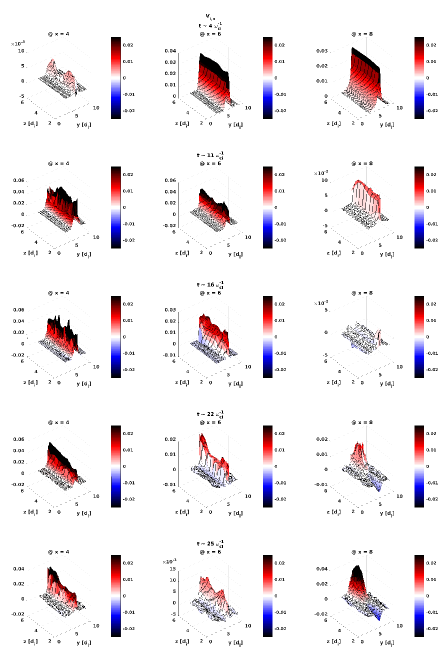
All the analyses proposed so far were performed in 2.5D, with the third out-of-plane variation considered negligible. However, for a more detailed analysis a full three-dimensional evolution would need to be considered. In this Section we then propose a 3D evolution of the same configuration as in Section 3.1. As introduced earlier, the third dimension (i.e. according to our frame of reference) is set as , which translates into an overall domain-box of . By following the same approach as in the previous Sections, in Fig. 14 we give a first insight to the velocity evolution on the plane considering a cross-section through the central plane at . Unlike the 2.5D case, we firstly notice that the outflow velocity is sensibly reduced (see [8]). A better outflow X-velocity perspective is given in Fig. 15, where the surface evolution perpendicular to the cross-sections indicated with yellow dash lines in Fig. 14 is plotted. Notice that, unlike the previous Figure, the sign of the velocity has been multiplied by for the sake of a better representation. The maximum outflow velocity is achieved in the early stage of the process, showing a regular and steady profile along the transversal direction (i.e. along ). Also, notice the formation of the shock-shock discontinuities already observed in [8], which are visible at . The situation becomes more chaotic with time after the formation of new magnetic islands. The latter is particularly noticeable at , when the process is considered finished. We want to study the performance of the process in terms of mass flow rate and thrust across the same cross-sections considered earlier. Again, we distinguish between the case with the only outflow (Fig. 16) and the case with the total ion velocity magnitude (Fig. 17). The plots represent the average velocity over the cross-sections taken into account. Fig 16 shows that the maximum mass flow is overall reached in the outermost section, similarly to the previous cases. The profiles show a three-peaked impulsive behavior only throughout this cross-section, whilst the other two sections show a more smoothed and regular behavior. A similar evolution is also seen for the component of the total thrust. The maximum values are again reached in the outermost cross-section, although the maximum peak is now attained later in time. When the magnitude of the velocity is instead considered, the specific impulse shows greater values, with a similar thrust profile to that for the only component, even though the values result now much higher. On the other hand, the velocity and specific impulse show a monotonically increasing behavior, unlike the previous case, which showed more like a shut down evolution. Now the velocity, and the specific impulse accordingly, are seen to increase indefinitely. However, the same behavior is not seen for the thrust and the mass flow rate, which instead show a more fluctuating profile. We explain this behavior with the formation of secondary reconnection events, which contribute in accelerating the outflow. This latter is proved by the series of peaks observed in Fig. 18, which gives an insight into each component of the outcome thrust. By comparing this Figure with Fig. 4 we can notice the generation of multiple reconnection boosts in the -direction. The phenomenon of secondary reconnection events in the outflow and the steady-state evolution of reconnection are well explained in [18] and [25]. Finally, the and components of the thrust appear to be dominant over the third direction, with the out-of-plane thrust being slightly greater than that along the axis. Again, a possible technological solution to counteract this lateral thrust might be the set of a symmetric double current sheet system, developing a thrust similar in magnitude but opposite in direction.
4 Conclusions
This paper presented a series of fully kinetic simulations of the process of magnetic reconnection to further demonstrate its potentiality for laboratory applications, with special focus on possible applications in the plasma propulsion field. For this purpose we used the fully kinetic massively parallelized implicit moment particle-in-cell code iPIC3D. In the future more advanced updated versions of this scheme will eventually be used to reach even more precise results, including the freshly proposed Energy Conserving scheme ([15, 16]), as well as the application of the Quasi Neutral Limit approach to PIC schemes ([23, 6, 12]), which allows to obtain neater simulations by getting rid of unwanted high-frequency waves. In particular, following up what introduced in [8], we showed that, also when the approximations considered in that work are relaxed, a technology system based on this physical process can still be considered highly competitive over the currently existing plasma propulsion technologies. More into detail, we proposed here an analysis of important engineering quantities, including specific impulse, mass flow rate and outcome thrust under different magnetic reconnection configurations, including a 3D simulation with with Hydrogen plasma, and 2.5D simulations with a plasma from Xenon ionized to its first state. Also, given the non-negligible contribute brought up by the transversal and out-of-plane components of the velocity (here pointed out as and respectively), these quantities have been studied in terms of both the sole component (axial component) and the total velocity magnitude. The two cases show remarkably different results, which indicate that the perpendicular components of the velocity may have an important relevance in the final system design. Finally, one of the main issues hindering the transfer of this technology from theory to a practical realization is the nearly symmetric outflow developed by magnetic reconnection, which would inevitably lead to a null net thrust. In order to break this symmetry without compromise the physical content of the process, here we have proposed the idea of considering an asymmetric longitudinal profile of the initial density. Based upon the behavior undertaken by particles entering the reconnection region, we have demonstrated that a remarkable net thrust between the two reconnection wings can be obtained by setting up a significant density gradient over the axial direction. A lower limit threshold should yet still be considered to prevent from the raise of instabilities caused by such sharp mass difference.
Acknowledgments
The present work has begun within the framework of the Illinois-KULeuven Faculty/PhD Candidate Exchange Program held in 2015. E.C. acknowledges support from the Leverhulme Research Project Grant Ref. 2014-112 and would like to thank Dr. Cesare Tronci for the opportunity given to carry on this work. Part of the work done by E.C. was performed over his permanence at the Centrum Wiskunde & Informatica (CWI) in Amsterdam during a collaboration with Dr. Enrico Camporeale, to whom the author is thankful for the enlightening discussions on the PIC methods. The simulations were conducted on the computational resources provided by the PRACE Tier-0 machines (Curie, Marconi and MareNostrum III supercomputers) and on the Flemish Supercomputing Center (VSC-VIC3).
References
- [1] Lapo Bettarini and Giovanni Lapenta. Spontaneous non-steady magnetic reconnection within the solar environment. Astronomy & Astrophysics, 518:A57, 2010.
- [2] J Birn, JF Drake, MA Shay, BN Rogers, RE Denton, M Hesse, M Kuznetsova, ZW Ma, A Bhattacharjee, A Otto, and P.L. Pritchett. Geospace environmental modeling (gem) magnetic reconnection challenge. Journal of Geophysical Research: Space Physics (1978–2012), 106(A3):3715–3719, 2001.
- [3] Joachim Birn and Michael Hesse. Reconnection in substorms and solar flares: analogies and differences. 27(3):1067–1078, 2009.
- [4] D. Biskamp. Magnetic Reconnection. Cambridge University Press, 2000.
- [5] JM Broll, SA Fuselier, and KJ Trattner. Locating dayside magnetopause reconnection with exhaust ion distributions. Journal of Geophysical Research: Space Physics.
- [6] Enrico Camporeale and Cesare Tronci. Electron inertia and quasi-neutrality in the weibel instability. Journal of Plasma Physics, 83(3), 2017.
- [7] E Cazzola, ME Innocenti, S Markidis, MV Goldman, DL Newman, and G Lapenta. On the electron dynamics during island coalescence in asymmetric magnetic reconnection. Physics of Plasmas (1994-present), 22(9):092901, 2015.
- [8] Emanuele Cazzola, Davide Curreli, Stefano Markidis, and Giovanni Lapenta. On the ions acceleration via collisionless magnetic reconnection in laboratory plasmas. Physics of Plasmas (1994-present), 23(11):112108, 2016.
- [9] Emanuele Cazzola, Maria Elena Innocenti, Martin V Goldman, David L Newman, Stefano Markidis, and Giovanni Lapenta. On the electron agyrotropy during rapid asymmetric magnetic island coalescence in presence of a guide field. Geophysical Research Letters, 2016.
- [10] William Daughton and Homa Karimabadi. Collisionless magnetic reconnection in large-scale electron-positron plasmas. Physics of Plasmas (1994-present), 14(7):072303, 2007.
- [11] Jan Deca, Andrey Divin, Giovanni Lapenta, Bertrand Lembège, Stefano Markidis, and Mihály Horányi. Electromagnetic particle-in-cell simulations of the solar wind interaction with lunar magnetic anomalies. Physical review letters, 112(15):151102, 2014.
- [12] Pierre Degond, Fabrice Deluzet, and David Doyen. Asymptotic-preserving particle-in-cell methods for the vlasov–maxwell system in the quasi-neutral limit. Journal of Computational Physics, 330:467–492, 2017.
- [13] Eo G Harris. On a plasma sheath separating regions of oppositely directed magnetic field. Il Nuovo Cimento Series 10, 23(1):115–121, 1962.
- [14] ME Innocenti, M Goldman, D Newman, S Markidis, and G Lapenta. Evidence of magnetic field switch-off in collisionless magnetic reconnection. The Astrophysical Journal Letters, 810(2):L19, 2015.
- [15] Giovanni Lapenta. Exactly energy conserving semi-implicit particle in cell formulation. Journal of Computational Physics, 334:349–366, 2017.
- [16] Giovanni Lapenta, Diego Gonzalez-Herrero, and Elisabetta Boella. Multiple-scale kinetic simulations with the energy conserving semi-implicit particle in cell method. Journal of Plasma Physics, 83(2), 2017.
- [17] Giovanni Lapenta, Stefano Markidis, Andrey Divin, David Newman, and Martin Goldman. Separatrices: the crux of reconnection. arXiv preprint arXiv:1406.6141, 2014.
- [18] Giovanni Lapenta, Stefano Markidis, Martin V Goldman, and David L Newman. Secondary reconnection sites in reconnection-generated flux ropes and reconnection fronts. Nature Physics, 11(8):690, 2015.
- [19] Stefano Markidis, Giovanni Lapenta, et al. Multi-scale simulations of plasma with ipic3d. Mathematics and Computers in Simulation, 80(7):1509–1519, 2010.
- [20] Stéphane Mazouffre. Electric propulsion for satellites and spacecraft: established technologies and novel approaches. Plasma Sources Science and Technology, 25(3):033002, 2016.
- [21] V. Olshevsky, J. Deca, A. Divin, I.B. Peng, S. Markidis, M.E. Innocenti, E. Cazzola, and G. Lapenta. Magnetic null points in kinetic simulations of space plasmas. arXiv preprint arXiv:1512.02018, 2015.
- [22] Eric Priest and Terry Forbes. Magnetic reconnection. Magnetic Reconnection, by Eric Priest, Terry Forbes, Cambridge, UK: Cambridge University Press, 2007, 1, 2007.
- [23] Cesare Tronci and Enrico Camporeale. Neutral vlasov kinetic theory of magnetized plasmas. Physics of Plasmas, 22(2):020704, 2015.
- [24] Martin JL Turner. Rocket and spacecraft propulsion: principles, practice and new developments. Springer Science & Business Media, 2008.
- [25] Weigang Wan and Giovanni Lapenta. Electron self-reinforcing process of magnetic reconnection. Physical review letters, 101(1):015001, 2008.
- [26] Weigang Wan and Giovanni Lapenta. Micro-macro coupling in plasma self-organization processes during island coalescence. Physical review letters, 100(3):035004, 2008.