Nonlinear Viscoelastic Modeling of Adhesive Failure for Polyacrylate Pressure-Sensitive Adhesives
Abstract
We investigate experimentally the adherence energy of model polyacrylate Pressure Sensitive Adhesives (PSAs) with combined large strain rheological measurements in uniaxial extension and an instrumented peel test. We develop a nonlinear model for such peel test which captures the dependence of with peeling rate revealing the key role played by the extensional rheology. Our model explains in particular why traditional linear viscoelastic approaches correctly predict the slope of curves for sufficiently elastic PSAs characterized by a simple rate-independent debonding criterion. However, for more viscoelastic adhesives, we identified a more complex rate-dependent debonding criterion yielding a significant modification of the curves, an effect that has been largely overlooked so far. This investigation opens the way towards the understanding of fibrils debonding, which is the main missing block to predict the adherence of PSAs.
keywords:
Adhesion, Cross-linked polymers, peeling, Viscoelasticity, Finite deformationsESPCI] Laboratoire Sciences et Ingénierie de la Matière Molle, PSL Research University, UPMC Univ Paris 06, ESPCI Paris, CNRS, 10 rue Vauquelin, 75231 Paris cedex 05, France \alsoaffiliation[Salvador] Instituto de Física, Universidade Federal da Bahia, Salvador-BA 40170-115, Brazil Saint Gobain] Saint-Gobain Glass France, Chantereine R&D Center, 1 rue de Montluçon - BP 40103, 60777 Thourotte Cedex, France, MMM] 3M Center, 3M Company, 230-1D-15, St. Paul, MN, 55144-1000, USA \alsoaffiliation[ESPCI] Laboratoire Sciences et Ingénierie de la Matière Molle, PSL Research University, UPMC Univ Paris 06, ESPCI Paris, CNRS, 10 rue Vauquelin, 75231 Paris cedex 05, France \alsoaffiliation[ESPCI] Laboratoire Sciences et Ingénierie de la Matière Molle, PSL Research University, UPMC Univ Paris 06, ESPCI Paris, CNRS, 10 rue Vauquelin, 75231 Paris cedex 05, France \alsoaffiliation[ESPCI] Laboratoire Sciences et Ingénierie de la Matière Molle, PSL Research University, UPMC Univ Paris 06, ESPCI Paris, CNRS, 10 rue Vauquelin, 75231 Paris cedex 05, France
1 Introduction
It is a very well known result that during the peeling of a typical viscoelastic PSA from a solid substrate, the measured adherence energy (the energy required to peel a unit tape area) is several orders of magnitude above the value given by the thermodynamic work of adhesion between the adhesive and the substrate. Moreover, in the slow steady state regime, is very dependent on the temperature and peeling rate . It has long been observed that for viscoelastic adhesives the adherence curves can be collapsed to a single master curve at a reference temperature by renormalizing the velocity axis by the same shift factor that is used for the Time-Temperature Superposition (TTS) of the linear rheological measurements 1, 2, 3, 4, 5. This has suggested that linear viscoelasticity should be used to quantitatively model the adherence energy .
Various linear viscoelastic models have since been developed based on a perturbation of the linear elastic fracture mechanics (LEFM) crack tip singular fields 6, 7, 8, 9, 10, 11. These models predict a fracture energy in the separable form 12, 13, where is an intrinsic adhesion energy and is a factor accounting for the linear viscoelastic losses. However, most attempts to quantitatively check these predictions experimentally for soft adhesives and rubbers have up to now failed 14, 11, 15. Even an important protagonist of this domain such as Gent 14, has pointed out the intrinsic limitation of these theories to describe experimental data since they would predict a process-zone of unphysical subatomic size.
When considering soft PSAs the elastoadhesive lengthscale , where large strains are present around the crack tip 16, 17, is comfortably larger than the typical 20 m thickness of the adhesive layer used for tapes 18. Since the LEFM approach relies on a clear separability of scales between the crack tip singular field and the bulk sample deformation, it can not be applied to PSAs in most practical situations. Alternative modeling approaches have been developed to account for the strong confinement of the material based on a linear viscoelastic foundation following the pioneering work of Kaelble 19, 20, 3. But the experimentally observed development of a dense array of highly stretched fibrils in the debonding region is at odds with this linear approach 21, 22, 23, 24. The role played by the fibrillated region in the overall dissipation was pointed out by several polymer rheologists 2, 25, 26, but most experimental investigations were made on non-crosslinked fluid-like adhesives, where failure occurs either cohesively in the fibrils or without fibrillation at all. Such viscoelastic fluids even if able to strain harden in extension are not representative of the lightly crosslinked polymers used for PSA that form an extended fibrillar zone that cleanly debonds from the surface of the substrate. Thus, the respective roles played in the peeling process by the linear, small strain dissipation controlled by the monomer friction coefficient and by the non-linear extensional rheology, where strain hardening due to chain architecture is important, remains elusive. The same conclusion has been reached with other classically used adhesive tests such as the probe-tack test 27, 28.
In a previous investigation 18, we specifically studied a series of model lightly cross-linked polyacrylate adhesives with different behaviors in extensional rheology but nearly identical small strain dissipation at the strain rates relevant for peeling. We showed from steady-state peeling experiments that a more pronounced strain hardening caused an overall decrease of the peeling force and a stronger dependence with peeling rate, which can not be explained by any model based on linear rheology. In parallel, a quantitative characterization of the debonding region by optical microscopy revealed that the fibrils always detached cleanly from the substrate after a stretch larger than 500%, which diminished with peeling velocity, confirming that non-linear material properties matter here. Similar experiments were later performed and reported by Barrios 29. Moreover, we found that a more pronounced strain stiffening causes the maximum fibril extension before detachment to decrease and to become less sensitive to the peeling rate 18.
In this paper, we provide the first quantitative physically based model connecting non-linear extensional rheological properties of model crosslinked PSAs with the adherence curves obtained in peel tests. We reconcile the TTS principle observed in the adherence curve and nonlinear deformation in the adhesive. Our results reveal complex debonding criteria, which unambiguously demonstrate the non trivial role played by polymer chain architecture and hence non-linear rheology in determining the curves.
2 Experimental
The model PSA were synthesized by free radical polymerization in solution from 85 wt% of 2-ethylhexyl acrylate (EHA), 10 wt% of methyl acrylate (MA) and 5 wt% of acrylic acid (AA). 0.2 wt% or 0.4 wt% of aluminium acetyl acetonate relative to monomer was added after synthesis to provide two levels of cross-linking (labelled A, B) to the adhesive layer-which were coated between two silicone release liners.
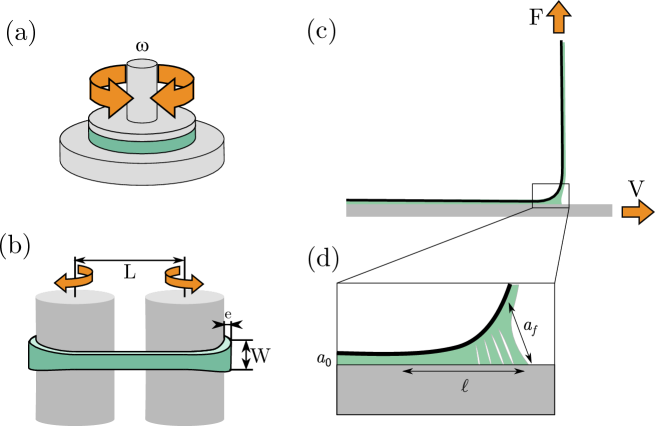
The linear viscoelastic characterization of the polymers was carried out with an Anton-Paar rheometer (MCR-301) using a standard parallel plate geometry (Fig. 1(a)). The storage and loss shear moduli were measured at pulsation in the range to rad/s. Pulsation sweeps were performed for temperatures in the range -40 to 120∘C. The maximum applied shear strain is .
The nonlinear rheological properties are obtained by extensional rheology measurements using the Sentmanat extensional rheometer (SER, see Fig. 1(b)) 30, adapted on the same MCR-301 rheometer. A slab of the polymer of width mm and thickness m is brought in contact with the cylinders. The stickiness of the materials guarantees a no slip condition at the interface. The cylinders were rotated at a constant angular velocity, resulting in a constant true strain rate in the range to s-1. The temperature was varied in the range to ∘C. The cross section is given by . True strain and stress are given by and , respectively, where is time and is the measured force acting on the slab. Nominal stress is , where is the stretch.
Finally, instrumented peel tests were performed at a 90o angle by applying a force at a peeling rate (Fig. 1(c)). As detailed elsewhere 18, the peeling occurred either at imposed load or imposed velocity allowing to explore a large range of peeling rates from m/s to m/s. The same model adhesives were coated on a 38m thick, PET film. The adhesive layer thickness m. All adhesive tapes were carefully bonded to the release side of a commercially available adhesive tape to ensure clean peeling and repeatable results. In this geometry, the energy release rate is simply given by :
| (1) |
where mm is the tape width. In steady state, an energy balance yields . Further, the experimental setup was equipped with a lateral optical microscope allowing to image the structure of the debonding region with a micrometric resolution (Fig. 1(d)).
Thus, the peeling test was intrumented to characterize the structure of the debonding region while measuring macroscopically the adherence curves . Insights of viscoelastic dissipative processes occurring in the debonding region have been obtained from linear and nonlinear rheological measurements in controlled and imposed geometries. In the remaining part of the paper, we will present in turn the results obtained from each experimental setup. We will finally present our model, developed to predict the macroscopic adherence curves of lightly crosslinked PSA from bulk rheological properties and detailed knowledge of the structure of the debonding region.
3 Results
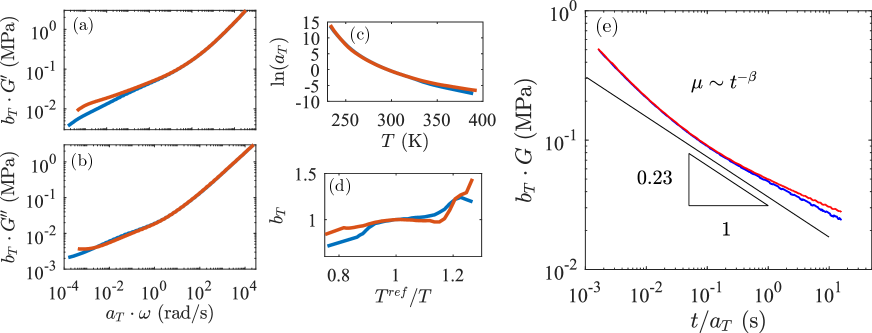
In Fig. 2, we present the results obtained from linear rheological measurements. We plot the rescaled storage shear modulus in Fig. 2(a) and the rescaled loss modulus in Fig. 2(b) as a function of the rescaled pulsation at a reference temperature K. The horizontal shift factor and vertical shift factor are shown in Fig. 2(c) and (d), respectively. Over the range of temperatures and rates used in the peel tests and extensional rheology, within 10% error. The dependence of the horizontal shift factor with temperature can be captured using the Williams-Landel-Ferry model :
| (2) |
with K. A fit of the experimental data over the entire temperature range gives for polymer A: and K, and, for polymer B: and K. In Fig. 2(e), we calculate the relaxation shear modulus at temperature using the Cox-Merz rule, yielding . This can be roughly approximated by a power law with in the relevant range for peel. We can readily see that the level of cross-linking does not significantly affect the linear rheological response of the material nor the shift factors.
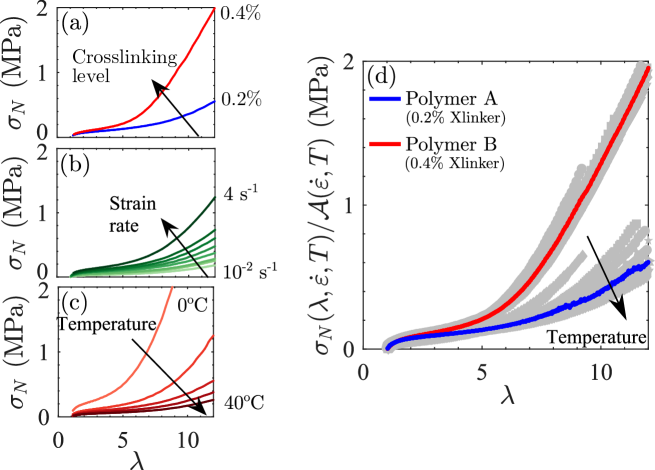
Typical nonlinear extensional curves are shown in Fig. 3(a-c) for independent changes of the crosslinking level, strain rate and temperature. In all cases, after a linear regime at , we observe a softening followed by a strain hardening, as expected for PSAs 31. Fig. 3(a) shows that when increasing the level of crosslinking (at s-1 and ∘C) the curves are first superimposed in the linear regime as expected and then significantly depart from it at while still in the softening regime. The typical stretch for the onset of strain hardening is (resp. 5) for polymer A (resp. B). Fig. 3(d) shows that the variation of with and can be captured by a single prefactor allowing to collapse all the curves on a reference master curve, where s. The stress curves can then be written in a separable form , where only depends on the stretch and on the cross-linking level. This separability is less obvious for the polymer A with a lower level of crosslinking, especially for low and large where nonlinear relaxation processes typical of viscoelastic fluids are active 32. However, it provides a good description of the nonlinear rheology in the domain of stretch experienced by fibrils before debonding in peeling.
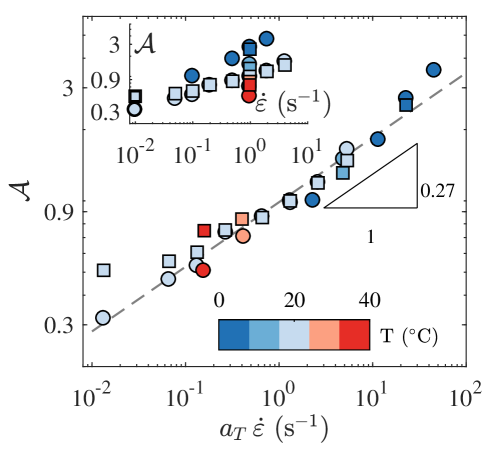
In the inset of Fig. 4, the prefactor for polymers A and B is plotted in a log-log scale as a function of for the range of temperatures for which we have performed nonlinear tests. In the main graphic of Fig. 4, we show that the data can be collapsed onto a master curve when plotted against where is the shift factor determined from linear rheology. Remarkably, the linear and nonlinear rheology are thus found to share the same TTS. Moreover, for both polymers, we find that for s-1. Deviations are observed at smaller but, as it will be shown later, this occurs outside the range of strain rates experienced by the fibrils during our peeling tests. By construction, the same prefactor can be used to rescale the true stress curves , yielding :
| (3) |
which is compatible with a Rivlin-Sawyers type of nonlinear constitutive law 33. Since Eq. 3 is also valid in the small strain regime where we have , we obtain that where we have used the Cox-Merz rule (). The exponent measured by linear rheology (cf. Fig. 2(e)) is found to be in reasonable agreement with the 0.27 exponent obtained for nonlinear rheology. This strongly indicates that most of the rate and temperature dependence of both polymers is encapsulated in a single linear rheology function , in the range relevant for the measured peeling curves.
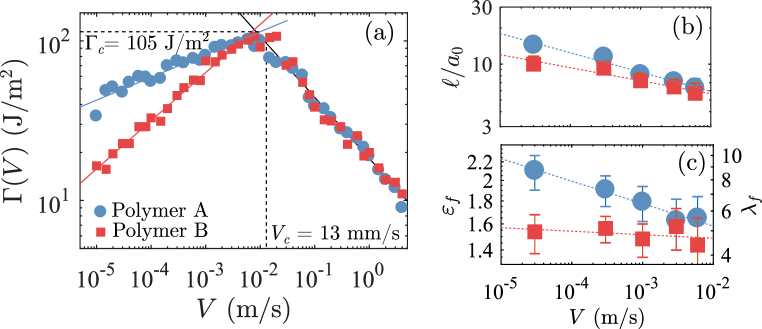
Next, we focus on the characterization of the cohesive zone during steady-state peeling using an instrumented peel test 18, 34 at a 90∘ angle and ∘C. From images of the fibrillated debonding region, we measured both the extension of the stretched region and the maximum fibril length at debonding (see Fig. 1(d)). In Fig. 5(a), we reproduced the adherence curves as a function of the peeling rate for polymer A and B from data collected in Villey et al. 18. As mentioned in the introduction, polymer B which has a more pronounced strain hardening presents a lower adherence than polymer A but a stronger dependence with the peeling rate. The adherence curves for the two polymers are distinct until reaching a critical velocity mm/s above which they exhibit an identical trend characterized by a negative slope. The region corresponds to an unsteady peeling caused by a stick-slip instability 35. However, in the present manuscript, we focus on the steady-state peeling regime with a well-defined peeling rate. In this regime, the normalized lateral size shown in Fig. 5(b) is found to decrease as a power law with an exponent weakly dependent on the crosslinking level. The characteristic timescale for stretching the fibrils is in the range s a regime where linear rheological measurements show no difference between polymers A and B (see Fig. 2). The maximal fibril stretch plotted in Fig. 5(c) shows that fibrils reach the strain hardening regime before debonding from the substrate (see Fig. 3). Interestingly, the maximum stretch increases upon decreasing , indicating that the nonlinear viscoelastic response dominates even in the lower speed limit. The signature of material nonlinearities at low speed is also demonstrated by the clear increase of when the crosslinking level is lowered. A fit of the data with a power law yields with (resp. ) for polymer A (resp. B). Furthermore, we evaluate the average strain rate experienced by a fibril as where . For the measured peeling rates in the range m/s, the equivalent strain rate is in the range of s-1 which is overlapped by the rheological measurements.
We are now in a position to propose a model to predict the adherence energy by combining the nonlinear material behavior and the measured characteristics of the fibrillated debonding region. Since the cavitation of the adhesive locally relaxes the effect of confinement 36, we initially make the assumption that the large stretch of the fibrils can be treated as uniaxial. The adherence energy can thus be modeled as:
| (4) |
where is provided by the elongational measurements corresponding to the average strain rate and is an adjustable factor compensating the crude approximation of uniaxial extension of fibrils, while the more complex fibril drawing condition will be investigated in future work. In the present implementation and are measured quantities, since a model able to capture their functional dependence with the peeling speed has yet to be developed.
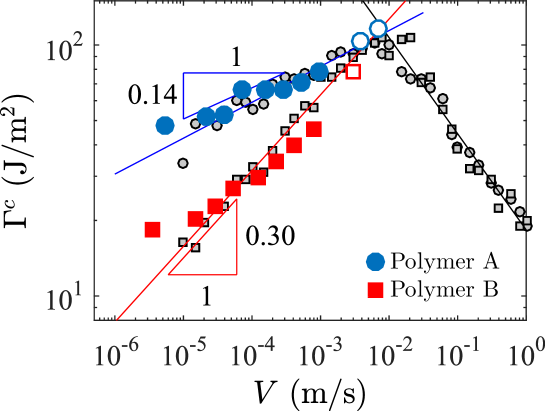
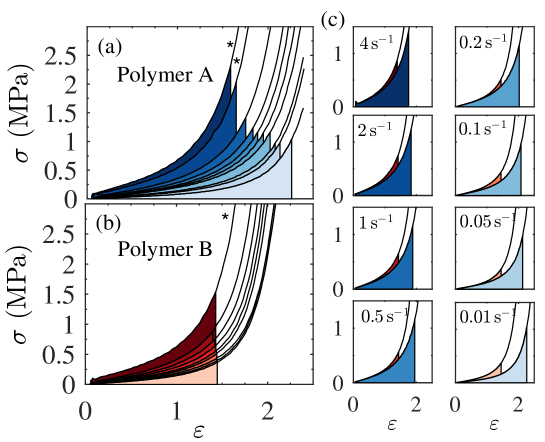
In Fig 6, we replot the curves for polymer A and B in terms of true stress and strain varying the strain rate at ∘C, unless otherwise stated in caption. The area under the curves is proportional to . In Fig 7, we plot the model prediction as a function of the peeling rate according to Eq. 4, along with the steady-state peeling data from our previous work 18. The two datasets are in excellent agreement if the value of the peel prediction is multiplied by a dimensionless prefactor demonstrating that Eq. 4 captures the clear difference in the adherence energy curves between polymer A and B both in terms of relative values and slope, while a model based on linear rheology alone cannot explain this difference. The dimensionless prefactor , can be interpreted as the sign that the fiber drawing process from the bulk adhesive layer is affected by a higher stress triaxiality than uniaxial extension tests, which will be the focus of further investigation.
The direct experimental access to the model parameters provides interesting insights on the physical mechanisms at the origin of the adherence curves in peeling. When focusing on the fibril debonding data in Fig. 6(a), we clearly see that the debonding criterion cannot be simply expressed in terms of a critical stress or strain 37, 26. However, for the more crosslinked polymer B, the debonding criterion is closer to a critical strain condition. In Fig. 6(c), we compare the stress curves for polymers A and B at specific values of . We observe that although the stress level for B is always higher than for A, the overall dissipation, hence , is larger for A due to the larger values of . Moreover, the observation that the two polymers present a different rate dependence of with explains why at higher the peeling energy for both polymers tends to get closer. Therefore, we demonstrate that both the increase in the stress level with , and the decrease of are crucial to determine the general trend of , making it difficult to derive a priori predictions unless we identify a sound fibril debonding criterion.
We can now discuss the link between our model and previous linear models. Taking advantages of the separability between strain rate dependence and strain dependence observed for our polymers (see Eq. 3), Eq. 4 can be further simplified as :
| (5) |
which more clearly reveals two contributions to : 1- a rate-dependent linear viscoelastic factor, and 2- a nonlinear factor whose rate-dependence originates from the debonding criterion. If we first consider polymer B alone, for which is essentially rate independent, the dependence on rate of the adherence curve is completely determined by linear rheology and the power law exponent of is quite close to the measured values of to . This result can explain why several authors have previously observed the TTS superposition for the adherence curves and the correlations between the and exponents. However, when considering the behaviour of polymer A, which has a less elastic character, the maximum fibril stretch at debonding becomes significantly dependent on the peel rate and the competition between the increase in stress and the decrease in maximum stretch affects the curve in a deeply nonlinear manner. It is worth noting that even in the low speed regime, where LEFM based approaches are generally considered to be more appropriate, extremely soft materials, such as polymer A, are shown to be stretched increasingly outside their linear viscoelastic regime, thus precluding the use of linear models.
4 Conclusion
We have shown that the peel force of model soft viscoelastic PSAs can be quantitatively modeled for a range of strain rates with a single adjustable dimensionless prefactor based on experimentally measured values of the maximum stretch in the fibrils at the detachment point. For more crosslinked adhesives the stress can be separated into the product of a strain dependent term that characterizes the strain softening and hardening behaviour of the adhesive, and a strain rate dependent term, which characterizes the molecular friction and is dependent on the glass transition temperature of the adhesive. However, for weakly crosslinked adhesives the two factors are no longer easily separable and the functional form of the strain hardening depends on the strain rate especially for very large strains.
A detailed modeling of both the relevant stress triaxiality during the fibril drawing process and of the fibril debonding criterion are certainly the next step, but we believe that the present model provides a clear understanding of the ingredients needed to understand the adherence energy in the peeling of very soft and dissipative materials.
References
- Ferry 1970 Ferry, J. Viscoelastic properties of polymers; Wiley: New York, 1970; p 292
- Gent and Petrich 1969 Gent, A. N.; Petrich, R. P. Adhesion of Viscoelastic Materials to Rigid Substrates. Proc. Roy. Soc. A-Math. Phy. 1969, 310, 433–448
- Kaelble 1964 Kaelble, D. H. Theory and Analysis of Peel Adhesion: Rate-Temperature Dependence of Viscoelastic Interlayers. J. Coll. Sci. 1964, 19, 413–424
- Andrews and Kinloch 1974 Andrews, E.; Kinloch, A. Mechanics of elastomeric adhesion. J. Polym. Sci. Pol. Sym. 1974, 46, 1–14
- Maugis 1985 Maugis, D. Subcritical crack growth, surface energy, fracture toughness, stick-slip and embrittlement. J. Mater. Sci. 1985, 20, 3041–3073
- Mueller and Knauss 1971 Mueller, H.; Knauss, W. G. Crack propagation in a linearly viscoelastic strip. J. Appl. Mechanics 1971, 38, 483–488
- Schapery 1975 Schapery, R. A theory of crack initiation and growth in viscoelastic media. Part I : Theoretical Development. Int. J. Fracture 1975, 11, 141–159
- de Gennes 1988 de Gennes, P.-G. Fracture of a Weakly Crosslinked Adhesive. CR. Acad. Sci. II 1988, 307, 1949–1953
- Saulnier \latinet al. 2004 Saulnier, F.; Ondarçuhu, T.; Aradian, A.; Raphaël, E. Adhesion between a viscoelastic material and a solid surface. Macromolecules 2004, 37, 1067–1075
- Persson and Brener 2005 Persson, B.; Brener, E. Crack propagation in viscoelastic solids. Phys. Rev. E 2005, 71, 036123
- Barthel and Frétigny 2009 Barthel, E.; Frétigny, C. Adhesive contact of elastomers: effective adhesion energy and creep function. J. Phys. D Appl. Phys. 2009, 42, 195302
- Gent and Schultz 1972 Gent, A. N.; Schultz, J. Effect of Wetting Liquids on the Strength of Adhesion of Viscoelastic Material. J. Adhesion 1972, 3, 281–294
- Maugis and Barquins 1988 Maugis, D.; Barquins, M. Adhesion of Viscoelastic Materials to Rigid Substrates. In: Allen KW, editor. Adhesion 12. London: Elsevier Applied Science 1988, 310, 205
- Gent 1996 Gent, A. N. Adhesion and strength of viscoelastic solids. Is there a relationship between adhesion and bulk properties? Langmuir 1996, 12, 4492–4496
- Cristiano \latinet al. 2011 Cristiano, A.; Marcellan, A.; Keestra, B. J.; Steeman, P.; Creton, C. Fracture of model polyurethane elastomeric networks. J. Polym. Sci. B 2011, 49, 355–367
- Hui \latinet al. 2003 Hui, C.-Y.; Jagota, A.; Bennison, S. J.; Londono, J. D. Crack blunting and the strength of soft elastic solids. Proc. Roy. Soc. A-Math. Phy. 2003, 459, 1489–1516
- Creton and Ciccotti 2016 Creton, C.; Ciccotti, M. Fracture and adhesion of soft materials: a review. Rep. Prog. Physics 2016, 79, 046601
- Villey \latinet al. 2015 Villey, R.; Creton, C.; Cortet, P.; Dalbe, M.; Jet, T.; Saintyves, B.; Santucci, S.; Vanel, L.; Yarusso, D.; Ciccotti, M. Rate dependent elastic hysteresis during the peeling of pressure sensitive adhesives. Soft Matter 2015, 11, 3480–3491
- Kaelble 1959 Kaelble, D. H. Theory and Analysis of Peel Adhesion : and Mechanics Mechanisms. T. Soc. Rheol. 1959, 3, 161–180
- Kaelble 1960 Kaelble, D. H. Theory and Analysis of Peel Adhesion : Bond Stresses and Distributions. T. Soc. Rheol. 1960, 4, 45–73
- Urahama 1989 Urahama, Y. Effect of peel load on stringiness phenomena and peel speed of pressure-sensitive adhesive tape. J. Adhesion 1989, 31, 47–58
- Chiche \latinet al. 2005 Chiche, A.; Dollhofer, J.; Creton, C. Cavity growth in soft adhesives. Eur. Phys. J. E 2005, 17, 389–401
- Benyahia \latinet al. 1997 Benyahia, L.; Verdier, C.; Piau, J.-M. The mechanisms of peeling of uncross-linked pressure sensitive adhesives. J. Adhesion 1997, 62, 45–73
- Gay and Leibler 1999 Gay, C.; Leibler, L. Theory of Tackiness. Phys. Rev. Lett. 1999, 82, 936–939
- Derail \latinet al. 1997 Derail, C.; Allal, A.; Marin, G.; Tordjeman, P. Relationship between Viscoelastic and Peeling Properties of Model Adhesives . Part 1 . Cohesive Fracture. J. Adhesion 1997, 61, 123–157
- Yarusso 1999 Yarusso, D. J. Quantifying the Relationship Between Peel and Rheology for Pressure Sensitive Adhesives. J. Adhesion 1999, 70, 299–320
- Deplace \latinet al. 2009 Deplace, F.; Rabjohns, M. A.; Yamaguchi, T.; Foster, A. B.; Carelli, C.; Lei, C.-H.; Ouzineb, K.; Keddie, J. L.; Lovell, P. A.; Creton, C. Deformation and adhesion of a periodic soft–soft nanocomposite designed with structured polymer colloid particles. Soft Matter 2009, 5, 1440
- Creton \latinet al. 2009 Creton, C.; Hu, G.; Deplace, F.; Morgret, L.; Shull, K. R. Large-strain mechanical behavior of model block copolymer adhesives. Macromolecules 2009, 42, 7605–7615
- Barrios 2017 Barrios, C. Anatomy of the deformation of pressure sensitive adhesives (PSAs) from rigid substrates. Proceedings of the Pressure Sensitive Tapes Council (PSTC) Tech 40, NV, May 17-19, 2017. 2017
- Sentmanat \latinet al. 2005 Sentmanat, M.; Wang, B. N.; McKinley, G. H. Measuring the transient extensional rheology of polyethylene melts using the SER universal testing platform. J. Rheol. 2005, 49, 585–606
- Deplace \latinet al. 2009 Deplace, F.; Carelli, C.; Mariot, S.; Retsos, H.; Chateauminois, A.; Ouzineb, K.; Creton, C. Fine tuning the adhesive properties of a soft nanostructured adhesive with rheological measurements. J. Adhesion 2009, 85, 18–54
- Wagner 1978 Wagner, M. A constitutive analysis of uniaxial elongational flow data of low-density polyethylene melt. J. Non-Newton. Fluid 1978, 4, 39–55
- Bird \latinet al. 1987 Bird, R. B.; Armstrong, R. C.; Hassager, O. Dynamics of polymeric liquids. Vol. 1: Fluid mechanics; John Wiley and Sons Inc., New York, NY, 1987
- Villey \latinet al. 2017 Villey, R.; Cortet, P.-P.; Creton, C.; Ciccotti, M. In-situ measurement of the large strain response of the fibrillar debonding region during the steady peeling of pressure sensitive adhesives. Int. J. Fracture 2017, 204, 175–190
- Cortet \latinet al. 2013 Cortet, P.-P.; Dalbe, M.-J.; Guerra, C.; Cohen, C.; Ciccotti, M.; Santucci, S.; Vanel, L. Intermittent stick-slip dynamics during the peeling of an adhesive tape from a roller. Phys. Rev. E 2013, 87, 022601
- Chikina and Gay 2000 Chikina, I.; Gay, C. Cavitation in adhesives. Phys. Rev. Lett. 2000, 85, 4546
- Hata 1972 Hata, T. Mechanisms of Adhesive Failure. J. Adhesion 1972, 4, 161–170