Secondary-electron radiation accompanying hadronic GeV-TeV gamma-rays from supernova remnants
Abstract
The synchrotron radiation from secondary electrons and positrons (SEPs) generated by hadronic interactions in the shock of supernova remnant (SNR) could be a distinct evidence of cosmic ray (CR) production in SNR shocks. Here we provide a method where the observed gamma-ray flux from SNRs, created by pion decays, is directly used to derive the SEP distribution and hence the synchrotron spectrum. We apply the method to three gamma-ray bright SNRs. In the young SNR RX J1713.7-3946, if the observed GeV-TeV gamma-rays are of hadronic origin and the magnetic field in the SNR shock is mG, the SEPs may produce a spectral bump at eV, exceeding the predicted synchrotron component of the leptonic model, and a soft spectral tail at keV, distinct from the hard spectral slope in the leptonic model. In the middle-aged SNRs IC443 and W44, if the observed gamma-rays are of hadronic origin, the SEP synchrotron radiation with G can well account for the observed radio flux and spectral slopes, supporting the hadronic origin of gamma-rays. Future microwave to far-infrared and hard X-ray (>100keV) observations are encouraged to constraining the SEP radiation and the gamma-ray origin in SNRs.
keywords:
acceleration of particles - cosmic ray interaction - gamma rays - supernova remnants: individual (RX J1713.7-3946, IC 443, and W44)1 Introduction
Supernova remnants (SNRs) are long considered to be the prime sources of Galactic cosmic rays (GCRs) for energies at least up to the CR spectral “knee” at eV, and probably up to the spectral “ankle" at eV, above which the CRs might come from extragalactic sources (Aharonian, 2013; Gabici, 2009). There are mainly two reasons to believe that SNRs are the major sites to produce GCRs. The first is based on the produced rate of GCRs, , which can be supplied by approximately of the kinetic energy of Galactic supernovae (SNe) (Gaisser, 1991). The second is that the diffusive shock acceleration (DSA) process in SNRs is expected to convert the kinetic energy of the bulk motion of SN ejecta to relativistic electrons and nuclei effectively. Many theoretic and observational works try to give more direct evidence to prove or disprove SNRs as GCR sources.
In the past decades, multi-wavelength observations had substantially increased our knowledge of SNR phenomena. Young and middle-aged SNRs are often observed to emit nonthermal radiation from radio up to GeV-TeV gamma-ray bands, which is believed to be produced by high energy electrons and/or protons accelerated by SNR shocks. The radio to X-ray emission can be originated from synchrotron radiation from the primary shock-accelerated electrons. However, the origin of high energy gamma-ray emission, whether Inverse Compton (IC) scattering/bremsstrahlung emission from primary electrons (leptonic model) or pion production caused by the collisions of accelerated protons/ions with background plasma (hadronic model), is less understood, because both leptonic and hadronic models can well explain the high energy GeV-TeV gamma-ray emission.
Some methods must be developed to distinguish the main production mechanism for gamma-ray emission from SNRs. At GeV energies two middle-aged SNRs, IC 443 and W44, show the characteristic spectral feature (often referred to as the “pion-decay bump") uniquely identifies -decay gamma rays and thereby high-energy proton existence (Ackermann et al., 2013). More direct evidence of proton-proton () interactions should be detection of gamma-ray emission exceeding TeV, since the leptonic process suffers from Klein-Nishina suppression at such high energies. Future deep spectroscopic and morphological studies of SNRs with Cherenkov Telescope Array (CTA) and LHAASO promise a breakthrough regarding the identification of radiation mechanism (e.g., Aharonian, 2013).
Here, we present another potential method to distinguish the hadronic and leptonic models. In the hadronic process, the interactions produce not only pionic gamma-rays but also secondary electrons and positrons (SEPs) from charged pion decays. The SEPs may compete with primary accelerated electrons and significantly contribute to the nonthermal electromagnetic radiation (e.g., Gabici, Aharonian & Casanova, 2009; Petropoulou et al., 2016). The SEP synchrotron radiation may differ from that contributed by the primary accelerated electrons. So the detection of the synchrotron radiation by SEPs can be an alternative method to distinguish the mechanisms of gamma-ray emission in SNRs.
Both SEPs and secondary gamma-rays are produced in interactions, and their spectra both depend on the unknown CR spectrum and the medium density surrounding the SNR. However, there is a tight correlation between the SEPs’ and secondary gamma-rays’ spectra due to particle physics, so we can derive SEP spectrum by gamma-ray spectrum, and vise verse, avoiding knowing the uncertain CR and medium properties. Here we provide in §2 a new method of deriving the SEP distribution and hence their synchrotron radiation directly by the observed gamma-ray spectrum and flux from SNRs. In §3 we apply our method to several SNRs with GeV-TeV detections, RX J1713.7-3946, IC 443 and W44. §4 will be the discussion on the results, and the main conclusion is summarized in §5.
2 Method
The SN ejecta drives a shock into the surrounding medium. The shock swept-up particles can be accelerated by the SNR shock. The acceleration makes SNRs potential sources of GeV-TeV gamma rays, resulted from decays of secondary -mesons produced in hadronic interactions.
A direct signature of high energy protons is provided by gamma rays generated in the decay of neutral pions (): collisions create mesons, including neutral and charged -mesons. The neutral pions will quickly decay into two gamma rays, each having an energy of MeV in the rest frame of the neutral pion. On the other hand, the charged pions will quickly decay into SEPs, as well as neutrinos. The decay channels are as following,
| (1) |
where represents other products. Here, we take the approximate isospin-invariant distribution of pions, i.e., the three types of pions produced have similar numbers at given energies, . Thus there will be a correlation between the energy distributions of SEPs and gamma-ray photons. In the following we provide a way to derive the distribution of the SEPs directly by using the gamma-ray emission. In the derivation we adopt the parameterized distribution functions of secondaries in interactions from Kelner, Aharonian, & Bugayov (2006). At last we calculate the synchrotron radiation by the generated SEPs in the SNR shock.
2.1 SEP energy spectra from interactions
Define as the spectrum of -mesons produced in interactions, i.e., the produced number per unit pion energy per unit time , then the produced rate of pions in the energy interval (, ) is . The energy distribution of gamma-rays from the decay of -mesons, , , is
| (2) |
On the contrary we may obtain the energy distribution of gamma-ray production rate by observed photon flux (: photon number per unit gamma-ray energy per unit detector area per unit time) , with the source distance from the Earth. Given , Eq.(2) can be used to derive the -mesons distribution ,
| (3) |
Eq.(3) shows that the -mesons distribution depends on the derivative of the gamma-ray spectrum, . The energy production rate of gamma-rays is equal to that of pions, .
The produced electrons are the secondary products of decays of charged pions, . The spectrum of the produced SEPs, , is given by
| (4) |
where , and the factor 2 takes into account the contributions of both and . The function is given by:
| (5) |
where ,
| (6) |
| (7) |
| (8) |
is the Heaviside function ( if , and otherwise). Thus, given the pion-decayed gamma-ray spectrum , one can use Eq.(3) and Eq.(4) to derive the energy distribution of produced SEPs, .
Some notes should be made here on the method. First, eq. (2) (so that eq. 3) is valid for MeV, whereas for , the precise equation is eq. (78) in Kelner, Aharonian, & Bugayov (2006) (also see Kafexhiu, et al. (2014)). However, it can be found that our method to derive SEP spectrum using eqs. (3) and (4) is good enough for gamma-rays and SEPs with energy of MeV and MeV, respectively. Second, we ignore the gamma-ray flux from meson decay, which only contributes about of the total flux from interactions (Kelner, Aharonian, & Bugayov, 2006).
2.2 Synchrotron radiation from SEPs
The SEPs are accumulated in the SNR, but their energy distribution is affected by radiative cooling. We derive first the energy distribution of SEPs, and then calculate the synchrotron spectrum emitted by them.
We solve the continuity equation governing the temporal SEPs’ distribution
| (9) |
Here is the Lorentz factor of the SEPs, is the instantaneous SEPs’ spectrum in the SNR at time ( denotes the time of the SN explosion), and is the source function. We can obtain , e.g., by gamma-ray observations, by the way explained in §2.1.
The energy loss rate of SEPs, , is mainly determined by several cooling processes:
| (10) |
The first is Coulomb collisions between energetic electrons and background electrons (Rephaeli, 1979),
| (11) |
where is the Thomson cross-section, is the background electron density, and is the Coulomb logarithm. The second is the bremsstrahlung energy loss. In fully ionized hydrogen plasma we have (Skibo et al., 1996)
| (12) |
where is the postshock hydrogen density and is the fine structure constant. The third is synchrotron radiation, given by (Rybicki & Lightman, 1979)
| (13) |
where is the postshock magnetic field strength. The forth is inverse Compton (IC) up-scattering the soft photons. The cosmic microwave background (CMB) photons dominate the soft background photons. In the Thomson regime, the energy-loss rate via IC scatterings of the CMB field is given by (Rybicki & Lightman, 1979)
| (14) |
where is the energy density of CMB photons. The last one is the adiabatic cooling due to the expansion of SNRs (Longair, 1994)
| (15) |
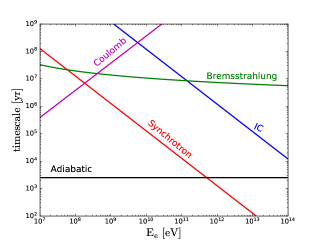
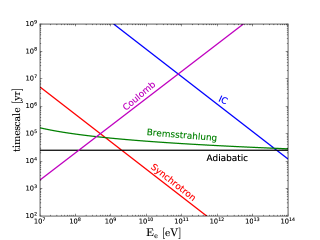
where is the time since SN explosions, and is analytically derived to be in the SNR Sedov phase. In Fig.1, we compare the energy-loss timescales of these processes, adopting the physical parameters that mimic the cases of SNRs RX J1713.7-3946 (upper panel) and IC 443 (or W44; lower panel). It can be seen that in the electron energy that we are interested in ( MeV; see below), the dominant cooling processes are synchrotron and adiabatic cooling, and that IC cooling can be neglected.
We have neglected any escape of SEPs in Eq.(9). This is because only the particles with energy around the maximum accelerated energy may be able to escape upstream of the shock, if the maximum energy is constrained by the finite dynamical time. The SEP energy is only a fraction of the primary cosmic rays, so they are confined and cannot escape from the system. Following Chang & Cooper (1970); Chiaberge & Ghisellini (1999), we use the fully implicit difference scheme to numerically solve Eq.(9).
Given the solved-out distribution of SEPs, , the optically-thin synchrotron radiation produces a total luminosity per unit photon frequency of (Crusius & Schlickeiser, 1986)
| (16) |
where describes the synchrotron radiative power of a single electron in magnetic filed with chaotic directions, for which we take a simple analytical form following Zirakashvili & Aharonian (2007),
| (17) |
with being the critical frequency for electrons with . At low enough frequencies, the correction due to synchrotron and free-free absorption may need to take into account. The observed synchrotron radiation flux is then
| (18) |
Note that our method is valid to derive SEPs of MeV, corresponding to Lorentz factors of . Depending on the magnetic field in the SNR shock, the related energy range of the synchrotron radiation is . Thus, in the calculation we take a lower limit of the SEP Lorentz factor, . This does not affect our discussion on the radio data at eV, even the magnetic field is as high as mG.
We approximately consider a constant GeV-TeV gamma-ray luminosity, and hence a constant source function in Eq (9) within the SNR age . We solve out the time-dependent up to time , and then calculate the synchrotron spectrum of the same time. The approximation of constant gamma-ray luminosity is reasonable as explained below. After the SN shock starts to decelerate and go into the adiabatic expansion phase, the total shock energy keeps a constant. If a constant fraction of the energy of the injected plasma goes to CRs, even though both the plasma and the CRs suffer adiabatic cooling downstream, the CR fraction keeps constant. Thus, the total CR energy in the shock is constant. The pion production rate, depending on total CR energy and medium density, is also constant.
The main uncertainty for the SEP synchrotron radiation is the magnetic field in the postshock region of the SNR shock, which we will regard as a free parameter. It is noted that in hadronic model for the GeV-TeV gamma-ray emission from SNRs a magnetic field of order of ’s G is usually derived from spectral fitting.
3 Application
We will apply the method described in the previous section to derive the synchrotron radiation from SEPs directly with the observed gamma-ray spectrum, assumed to be hadronic origin.
3.1 RX J1713.7-3946
| SNR | ||||||
|---|---|---|---|---|---|---|
| RX J1713.7-3946 | ||||||
| IC 443 | ||||||
| W44 |
RX J1713.7-3946 is the best studied young () gamma-ray SNR. It was discovered in the all-sky survey (Pfeffermann & Aschenbach, 1996) and had an estimated distance of kpc (Fukui et al., 2003). It is a prominent and well studied example of a class of X-ray bright and radio dim shell-type SNRs (Lazendic et al., 2004). Despite the past deep HESS exposure and detailed spectral and morphological studies (H. E. S. S. Collaboration et al., 2018), the origin of the gamma-ray emission (leptonic, hadronic, or a mix of both) is not clearly established(Morlino et al., 2009; Zirakashvili & Aharonian, 2010; Ellison et al., 2010; Yuan et al., 2011). For the leptonic model to explain the multiwavelength emission of RX J1713.7-3946, a small magnetic field () (H. E. S. S. Collaboration et al., 2018; Tanaka et al., 2008; Yuan et al., 2011) is needed. However, for the hadronic model to explain the multiwavelength emission, a larger magnetic field () is needed (Zirakashvili & Aharonian, 2010; Yuan et al., 2011; Gabici & Aharonian, 2014). The observed rapid X-ray variability of RX J1713.7-3946 has been interpreted as a large, multi-mG, magnetic field (Uchiyama et al., 2007) (see, however, e.g., Butt et al., 2008).
Here, we apply our method to RX J1713.7-3946. We assume that the gamma-ray emission is due to the hadronic model. We fit the observed gamma-ray emission by a function as:
| (19) |
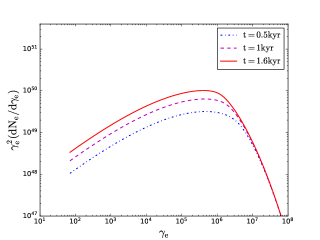
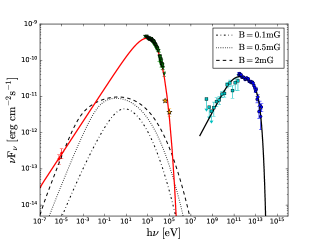
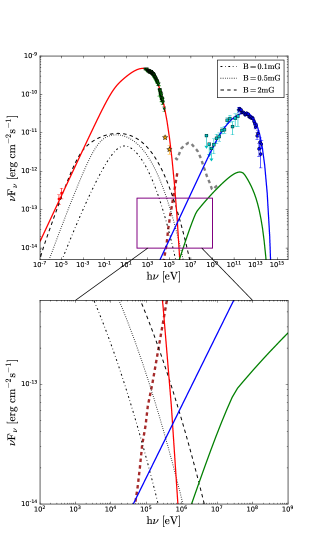
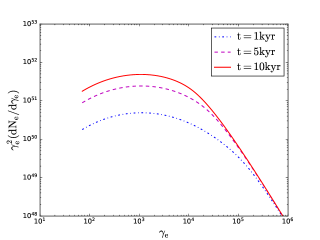
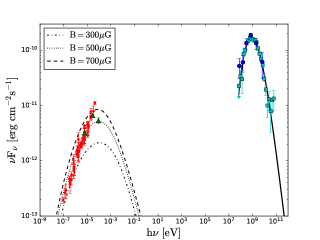
where , , , , and are parameters determined by fitting data. The best fitting parameters are showed in Tab.1. The parameter is positive, indicating that there is a spectral cutoff at high energies. We then use Eq.(3) and Eq.(4) to transform the spectra of observed gamma-ray to the spectra of SEPs, solve the time-dependent continuity equation and calculate the SEP synchrotron radiation. The negligible synchrotron and free-free absorption in RX J1713.7-3946 are ignored in the calculation. The results are showed in Fig.2. The upper panel in Fig.2 represents the temporal electrons distribution which is the result governed by solving the continuity equation. The lower panel in Fig.2 represents the synchrotron radiation of SEPs.
By changing the only free parameter , we see in Fig.2 that the synchrotron spectral profile of SEPs broaden as increases. For mG, the flux matches the observed radio flux by ATCA. So, if the gamma-rays from RX J1713.7-3946 are dominated by hadronic interactions, the magnetic field in the shock cannot be larger than mG, otherwise the synchrotron radiation from SEPs overshoots the observed radio flux.
The radio-to-X-ray flux is usually believed to be dominated by the synchrotron radiation by primary electrons accelerated by the SNR shocks. We show in Fig. 2 a best fit of the radio-to-X-ray data by the synchrotron spectrum of primary electrons, using the public code Naima111https://github.com/zblz/naima. The primary electrons’ energy distribution is assumed to follow a broken power law with an high-energy exponential cutoff, and the postshock magnetic field is mG (Note the value is not determined because of the degeneracy of the electron distribution parameters and ). Comparing the radiation of primary electrons and SEPs in Fig. 2, it can be found that for large magnetic field mG the SEP radiation may exceed that of the primary electrons in the range of eV. The flux level could be . This is bright enough to be detected by many telescopes of relevant range. However, since that this source is located on the Galactic plane, and it is close to a HII region (Acero et al., 2009), removing the stronger contaminations is the main problem. At keV, the synchrotron radiation of SEPs may also show up as an excess compared to the synchrotron spectrum by primary electrons, but with a flux of only or below. Note that the spectra of IC and bremsstrahlung radiation by both the primary electrons and SEPs are all negligible in the case here, i.e., the magnetic field mG and the density (H. E. S. S. Collaboration et al., 2018), thus they are not shown in the figure.
We emphasize that the spectral slope is very different at keV between leptonic and hadronic models. In Fig.3 we show the broadband (radio to TeV) fitting of leptonic model using Naima, where the radio-to-X-ray emission is dominated by synchrotron radiation of primary electrons and the GeV-TeV emission is dominated by IC radiation of primary electrons. In this model the postshock magnetic field is well constrained to be in the order of G (e.g., Yuan et al., 2011). Around few hundred keV, the emission is dominated by the IC radiation with a hard spectral slope. However, the spectrum around few hundred keV in the hadronic model will be very soft. For comparison, the SEP radiation assuming the hadronic origin for the GeV-TeV emission is also shown in Fig.3. The obvious difference between leptonic and hadronic models at keV is important and needs detailed observation in this region by future sensitive hard X-ray telescopes, with flux sensitivity as good as . This is still challenging to the upcoming telescopes in the near future (Fig.3).
3.2 IC 443 and W44
SNR IC 443 and W44 are two middle-aged () SNRs surrounded with dense molecular clouds (MCs) (Ackermann et al., 2013; Cardillo et al., 2014; Tavani et al., 2010; Fang et al., 2013; Uchiyama et al., 2010). Since they are close (with distances of 1.5 kpc and 2.9 kpc for IC 443 and W44, respectively) and bright in gamma-ray energies, they are the best studied SNRs so far. Ackermann et al. (2013) shows that the 4-year observations with Fermi-LAT on IC 443 and W44 reveal the characteristic “pion-decay bump" in the sub-GeV gamma-ray spectra, which tends to exclude a leptonic-only model for the GeV gamma-ray emission from IC 443 and W44. This provides an evidence of CR acceleration in SNRs.
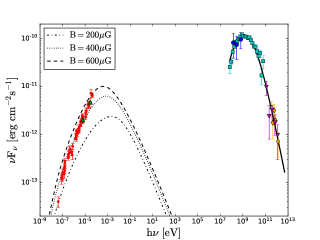
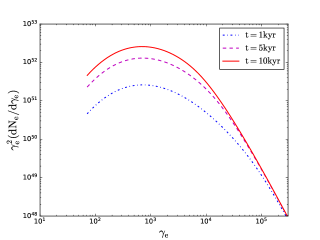
If the GeV emission is produced by hadronic interactions, there should be accompanying SEPs which produce synchrotron radiation in the postshock magnetic field. Again we use the spectral model of Eq.(19) to fit the gamma-ray data of SNRs IC 443 and W44, and then the best fitting parameters are shown in Tab.1. Note, indicates that the data can be best fit with a low-energy spectral cutoff. The results of derived SEPs’ and synchrotron radiation spectra are shown in Figs.4 and 5 for IC 443 and W44, respectively. We have neglected the attenuation in radio emission due to synchrotron and free-free absorption in the calculation. Indeed the whole radio spectra consistent with a single power law imply negligible absorption in the observational frequency ranges (Castelletti et al., 2007, 2011).
We see that the synchrotron flux increases with the magnetic field. Since the predicted flux cannot exceed the observed radio emission, we can give upper limits to the magnetic field, G and G for IC 443 and W44, respectively. However, the predicted flux and spectral index are both well consistent with observations, which may implies that the radio emission is mainly produced by the synchrotron radiation of the SEPs. In fact, the observed radio spectral index, if explained by synchrotron radiation, needs a power-law distributed electron population with a spectral index , which is harder than DSA predicted index . However, the sub-GeV SEPs, which account for the radio emission, is derived to be hard (as shown in Figs.4 and 5) because the corresponding gamma-ray spectra at GeV are hard. This can also be seen in Fig 3 of Ackermann et al. (2013), which shows that the proton energy distributions to fit the gamma-ray spectra are hard at GeV. All these facts suggest that the radio emission from IC 443 and W44 is more naturally explained by SEP radiation with magnetic fields G and G, respectively.
4 Discussion
In the hadronic model for RX J1713.7-3946, a spectral bump in eV may show up if the magnetic field is the order of mG (Fig.2). Observations in microwave to far-infrared bands are encouraged to confirm if it is there, and test the origin of the gamma-rays. However, an upper limit mG is constrained in this model by the observed radio flux. Huang & Pohl (2008) have obtained comparable result of the magnetic field by carrying out a detailed Monte Carlo particle collision calculation of the SEP production. We here directly use the observed gamma-ray spectrum to derive SEP spectrum analytically, avoiding the complicated numerical calculation of the hadronic interactions.
The synchrotron spectrum from radio to X-ray bands from SNRs can be used to constrain the magnetic field in the SNR shocks, as discussed in Wang & Li (2014). In the spectrum there is a spectral break corresponding to the electrons with a radiative cooling time equal to the SNR age, eV, only function of and (e.g., Katz & Waxman, 2008). If the injected electrons’ index is , then the synchrotron spectral slope changes from below to above . Given the observed radio flux (below ), and the X-ray flux (maybe above ), we can constrain and then . For H. E. S. S. Collaboration et al. (2018) derives G in RX J1713.7-3946. If as expected by DSA theory, is larger and becomes smaller, ’s G. Small will lead to enhancement of the inverse-Compton (IC) radiation, and favor leptonic model for the gamma-rays from RX J1713.7-3946.
As for IC 443 and W44, the derived SEP radiation can well match the radio data with G and G, respectively (Figs 4 and 5). Besides the “pion-decay bump", these results further support the hadronic origin of gamma-rays. The required relatively large magnetic field, ’s G, is consistent with the hadronic model but disfavors leptonic one (e.g., Cardillo et al., 2014). Moreover, the large can be well explained by the large density of the surrounding MCs, since the postshock magnetic field is (with being the energy fraction of the postshock internal energy carried by magnetic field, and is the velocity of postshock). For example, for W44 the CO data obtained from the NANTEN2 telescope imply a dense medium with (Cardillo et al., 2014), then the postshock magnetic field is mG222 See, however, that in some recent simulations, the non-relativistic or mildly relativistic shocks typically have much lower values of , i.e., (Caprioli & Spitkovsky, 2014; van Marle, Casse & Marcowith, 2018; Crumley, et al., 2019), which is in tension with the hadronic models of high energy emission from SNRs., consistent with the requirement for SEP radiation to account for the radio emission.
Note, Uchiyama et al. (2010) had shown that, in a specific model where the medium is clumpy clouds, the SEP synchrotron radiation can dominate primary electron radiation and account for the observed radio spectrum from SNR W44. In their model the SEPs and secondary gamma-rays are produced in the same region (i.e., the shocked clumpy clouds), a situation similar to our one-zone case, thus we can make comparison between their and our results. It can be found following their calculation that the required magnetic field of shocked clouds in their specific model is , similar to our result derived directly from gamma-ray data. This also shows the advantage of our method that no CR spectrum and interaction should be considered in the calculation, but simply using the correlation between the SEP and secondary gamma-ray productions.
The measurement of the postshock magnetic field is important for the study of the collisionless shock physics. In any case, by requiring the SEP synchrotron radiation not exceeding the observed radio-to-X-ray flux we can give an upper limit of the magnetic field. This is simply true if the gamma-rays are hadronic origin. If, however, the gamma-rays are leptonic origin, an even low magnetic field is required to model the radio to gamma-ray data (This is because in the leptonic models the radio to X-ray emission is explained by synchrotron radiation, whereas the gamma-ray emission by IC or bremsstrahlung. A low magnetic field can suppress the synchrotron radiation so that the IC and or bremsstrahlung radiation can be enhanced). So after all, the requirement of SEP synchrotron radiation below observed radio flux always gives an upper limit of the magnetic field. Thus we can conclude that few mG in the shock of RX J1713.7-3946, and mG in the shocks of IC 443 and W44.
We can estimate the efficiency that primary electrons can be accelerated in IC 443 and W44, based on the conclusion that the entire spectrum is contributed by the hadronic gamma-rays and the SEP synchrotron radiation, rather than primary electrons. The proton lifetime is (Aharonian, & Atoyan, 1996). With and , the pion production efficiency is estimated to be . A fraction of proton energy goes to the SEP energy, so the total energy of the SEPs is a fraction of the primary protons. Since the total energy of the primary electrons should be lower than that of the SEPs, the primary electron to proton ratio should be lower than . This should be compared to the electron-proton ratio, , implied by the radio observations of SNRs in nearby galaxies (Katz & Waxman, 2008; Zhang, & Chen, 2016).
5 Conclusion and summary
Since there is a connection between the SEPs and gamma ray photons, there should be a connection between the synchrotron radiation produced by SEPs and the observed gamma-rays from hadronic interactions. Here, we develop a simple analytical method to transform the observed gamma-ray spectra to the SEP spectra, and then calculate the SEP synchrotron radiation. We apply our method to three well observed gamma-ray SNRs, RX J1713.7-3946, IC 443 and W44. The main results are:
-
•
If the GeV-TeV gamma-rays from young SNR RX J1713.7-3946 are produced by hadronic interactions, the SEP synchrotron radiation may give rise to a spectral bump at eV dominating the predicted synchrotron component in leptonic model, if the magnetic field in the SNR shock is mG. In hard X-ray range, keV, the SEP synchrotron radiation may show up as an excess compared to the synchrotron spectrum from primary electron contribution, which is a distinct feature of hadronic model but needs future sensitive hard X-ray telescopes to observe.
-
•
If the GeV-TeV gamma-rays from middle-aged SNRs IC 443 and W44 are produced by hadronic interactions, the SEP synchrotron radiation can well account for the observed radio flux and spectral slopes, which further supports the hadronic origin of the gamma-rays and the TeV CR accelerations in these two SNRs.
-
•
The requirement that the SEP radiation derived by the observed gamma-ray spectra, assumed to be hadronic origin, cannot exceed the observed radio flux constrain the magnetic fields in the SNR shocks to be mG, G, and G for RX J1713.7-3946, IC 443 and W44, respectively.
In brief, the SEP synchrotron radiation can be a powerful tool to distinguish production processes of the GeV-TeV gamma-ray emission from SNRs. Future microwave to far infrared and deep hard X-ray observations may tell the differences between the synchrotron spectra by SEPs and primary electrons, and probe the particle accleration ability of SNR shocks.
Acknowledgements
We thank the anonymous referees for valuable suggestions. We also thank Xiao Zhang and Ke Wang for helpful discussion. This work is partly supported by the Natural Science Foundation of China (No. 11773003, No. 11622326, No. 11203067, No. 11721303, and No. U1931201), the 973 Program of China (No. 2014CB845800), the National Program on Key Research and Development Project (Grants No. 2016YFA0400803) and the Yunnan Natural Science Foundation (No. 2011FB115 and No. 2014FB188).
References
- Abdo et al. (2011) Abdo, A. A., Ackermann, M., Ajello, M., et al. 2011, ApJ, 734, 28
- Acciari et al. (2009) Acciari, V. A., Aliu, E., Arlen, T., et al. 2009, ApJ, 698, L133
- Acero et al. (2009) Acero, F., Ballet, J., Decourchelle, A., et al. 2009, A&A, 505, 157
- Ackermann et al. (2013) Ackermann, M., Ajello, M., Allafort, A., et al. 2013, Science, 339, 807
- Aharonian, & Atoyan (1996) Aharonian, F. A., & Atoyan, A. M. 1996, A&A, 309, 917
- Aharonian et al. (2010) Aharonian, F. A., Kelner, S. R., & Prosekin, A. Y. 2010, Phys. Rev. D, 82, 043002
- Aharonian (2013) Aharonian, F. A. 2013, Astroparticle Physics, 43, 71
- Albert et al. (2007) Albert, J., Aliu, E., Anderhub, H., et al. 2007, ApJ, 664, L87
- Baring et al. (1999) Baring, M. G., Ellison, D. C., Reynolds, S. P., Grenier, I. A., & Goret, P. 1999, ApJ, 513, 311
- Bird et al. (2010) Bird, A. J., Bazzano, A., Bassani, L., et al. 2010, ApJS, 186, 1
- Butt et al. (2008) Butt, Y. M., Porter, T. A., Katz, B., & Waxman, E. 2008, MNRAS, 386, L20
- Caprioli & Spitkovsky (2014) Caprioli D., Spitkovsky A., 2014, ApJ, 794, 46
- Cardillo et al. (2014) Cardillo, M., Tavani, M., Giuliani, A., et al. 2014, A&A, 565, A74
- Castelletti et al. (2007) Castelletti, G., Dubner, G., Brogan, C., & Kassim, N. E. 2007, A&A, 471, 537
- Castelletti et al. (2011) Castelletti, G., Dubner, G., Clarke, T., & Kassim, N. E. 2011, A&A, 534, A21
- Chang & Cooper (1970) Chang, J. S., & Cooper, G. 1970, Journal of Computational Physics, 6, 1
- Chiaberge & Ghisellini (1999) Chiaberge, M., & Ghisellini, G. 1999, MNRAS, 306, 551
- Crumley, et al. (2019) Crumley P., Caprioli D., Markoff S., Spitkovsky A., 2019, MNRAS, 485, 5105
- Crusius & Schlickeiser (1986) Crusius, A., & Schlickeiser, R. 1986, aap, 164, L16
- Egron et al. (2017) Egron, E., Pellizzoni, A., Iacolina, M. N., et al. 2017, MNRAS, 470, 1329
- Ellison et al. (2010) Ellison, D. C., Patnaude, D. J., Slane, P., & Raymond, J. 2010, ApJ, 712, 287
- Fang et al. (2013) Fang, J., Yu, H., Zhu, B.-T., & Zhang, L. 2013, MNRAS, 435, 570
- Fukui et al. (2003) Fukui, Y., Moriguchi, Y., Tamura, K., et al. 2003, pasj, 55, L61
- Gabici (2009) Gabici, S. 2009, 21st European Cosmic Ray Symposium, 66
- Gabici & Aharonian (2014) Gabici, S., & Aharonian, F. A. 2014, MNRAS, 445, L70
- Gabici, Aharonian & Casanova (2009) Gabici, S., Aharonian, F. A., & Casanova, S. 2009, MNRAS, 396, 1629
- Gaisser (1991) Gaisser, T. K. 1991, Cosmic Rays and Particle Physics, by Thomas K. Gaisser, pp. 295. ISBN 0521326 672. Cambridge, UK: Cambridge University Press, January 1991., 295
- Giuliani et al. (2011) Giuliani, A., Cardillo, M., Tavani, M., et al. 2011, ApJ, 742, L30
- H. E. S. S. Collaboration et al. (2018) H. E. S. S. Collaboration, Abdalla, H., Abramowski, A., et al. 2018, A&A, 612, A6
- Huang & Pohl (2008) Huang, C.-Y., & Pohl, M. 2008, Astroparticle Physics, 29, 282
- Kafexhiu, et al. (2014) Kafexhiu E., Aharonian F., Taylor A. M., Vila G. S., 2014, PhRvD, 90, 123014
- Katz & Waxman (2008) Katz, B., & Waxman, E. 2008, JCAP, 1, 018
- Kelner, Aharonian, & Bugayov (2006) Kelner, S. R., Aharonian, F. A., & Bugayov, V. V. 2006, Phys. Rev. D, 74, 034018
- Khangulyan et al. (2014) Khangulyan, D., Aharonian, F. A., & Kelner, S. R. 2014, ApJ, 783, 100
- Lagage & Cesarsky (1983) Lagage, P. O., & Cesarsky, C. J. 1983, aap, 125, 249
- Laurent, et al. (2019) Laurent P., et al., 2019, arXiv, arXiv:1908.08586
- Lazendic et al. (2004) Lazendic, J. S., Slane, P. O., Gaensler, B. M., et al. 2004, ApJ, 602, 271
- Longair (1994) Longair, M. S. 1994, High energy astrophysics. Volume 2. Stars
- Loru et al. (2018) Loru, S., Pellizzoni, A., Egron, E., et al. 2018, MNRAS,
- Morlino et al. (2009) Morlino, G., Amato, E., & Blasi, P. 2009, MNRAS, 392, 240
- Petropoulou et al. (2016) Petropoulou, M., Kamble, A., & Sironi, L. 2016, MNRAS, 460, 44
- Pfeffermann & Aschenbach (1996) Pfeffermann, E., & Aschenbach, B. 1996, Roentgenstrahlung from the Universe, 267
- Rephaeli (1979) Rephaeli, Y. 1979, ApJ, 227, 364
- Rybicki & Lightman (1979) Rybicki, G. B., & Lightman, A. P. 1979, New York, Wiley-Interscience, 1979. 393 p.,
- Shibata et al. (2011) Shibata, T., Ishikawa, T., & Sekiguchi, S. 2011, ApJ, 727, 38
- Skibo et al. (1996) Skibo, J. G., Ramaty, R., & Purcell, W. R. 1996, A&AS, 120, 403
- Tanaka et al. (2008) Tanaka, T., Uchiyama, Y., Aharonian, F. A., et al. 2008, ApJ, 685, 988-1004
- Tatischeff, et al. (2016) Tatischeff V., et al., 2016, SPIE, 99052N, SPIE.9905
- Tavani et al. (2010) Tavani, M., Giuliani, A., Chen, A. W., et al. 2010, ApJ, 710, L151
- Uchiyama et al. (2007) Uchiyama, Y., Aharonian, F. A., Tanaka, T., Takahashi, T., & Maeda, Y. 2007, Nature, 449, 576
- Uchiyama et al. (2010) Uchiyama, Y., Blandford, R. D., Funk, S., Tajima, H., & Tanaka, T. 2010, ApJ, 723, L122
- van Marle, Casse & Marcowith (2018) van Marle A. J., Casse F., Marcowith A., 2018, MNRAS, 473, 3394
- Wang & Li (2014) Wang, W., & Li, Z. 2014, ApJ, 789, 123
- Yuan et al. (2011) Yuan, Q., Liu, S., Fan, Z., Bi, X., & Fryer, C. L. 2011, ApJ, 735, 120
- Zhang, & Chen (2016) Zhang, X., & Chen, Y. 2016, ApJ, 821, 43
- Zirakashvili & Aharonian (2007) Zirakashvil, V. N., & Aharonian, F. 2007, aap, 465, 695
- Zirakashvili & Aharonian (2010) Zirakashvili, V. N., & Aharonian, F. A. 2010, ApJ, 708, 965