Spectroscopic follow-up of double quasar candidates
Abstract
We report the results of an optical spectroscopic follow-up of four double quasar candidates in the Sloan Digital Sky Survey (SDSS) database. SDSS J1617+3827 is most likely a lensed quasar at = 2.079, consisting of two images with 1921 and separated by 2″. We identify an extended source northeast of the brightest image as an early-type lensing galaxy at = 0.602, and detect a candidate for the main deflector in the vicinity of the faintest image. SDSS J2153+2732 consists of two distinct but physically associated quasars at 2.24 ( 1920, = 36). Although this system might be a binary quasar, there is evidence of a collision or merger within a galaxy cluster at an early stage. The other two candidates are projected pairs of active galactic nuclei: SDSS J1642+3200 ( 3″) comprises a distant quasar ( 18) at = 2.263 and the active nucleus ( 20) of a galaxy at 0.3, while SDSS J02400208 ( 1819, 1″) is a pair of quasars at = 1.687 and = 1.059. In each of these two systems, the background quasar only suffers a weak gravitational lensing effect by the host galaxy of the foreground active nucleus, so the host galaxy mass is constrained to be less than (2.93) 1011 M⊙ inside 10 kpc.
keywords:
gravitational lensing: strong – quasars: general – methods: data analysis – methods: observational1 Introduction
Quasars that are being strongly lensed by gravitational fields of foreground massive galaxies serve as unique probes of our Universe (e.g. Schneider, Kochanek & Wambsganss, 2006; Treu, 2010; Jackson et al., 2012). For instance, observations of these multiply-imaged quasars are used to constrain cosmological parameters and sizes of quasar accretion discs. Multiple quasar systems are also valuable tools for investigating the structure and evolution of lensing galaxies. In addition, physically associated, small-separation quasar pairs lead to relevant information on small-scale quasar clustering, providing evidence that direct interactions trigger or enhance quasar activitity (e.g. Hennawi et al., 2006a; Kayo & Oguri, 2012). Although such systems are generically termed binary quasars, here we distinguish between two different scenarios (e.g. Djorgovski et al., 1987): the term binary quasar describes two quasars residing at the nuclei of two galaxies that are gravitationally bound, while we refer to close quasar pair in a cluster as the active nuclei of two colliding/merging galaxies in a high density region. Projected quasar pairs can also be used to study environments of foreground quasars (e.g. Hennawi et al., 2006b; Lau et al., 2018) or constrain their masses (e.g. Claeskens et al., 2000).
The Sloan Digital Sky Survey (SDSS) database111http://www.sdss.org/ is being deeply mined to discover new multiply-imaged, gravitationally lensed quasars (e.g. Inada et al., 2012; More et al., 2016), and the identification of new binary quasars and other interesting systems (see above) is a by-product of these efforts. Searching for new doubly-imaged quasars in the SDSS-III DR10 (Ahn et al., 2014; Pâris et al., 2014), we selected a subsample of 14 double quasar candidates (SS2), where each of the targets in this subsample consisted of a confirmed quasar and an unidentified point-like source (see Table 1 of Sergeyev et al., 2016, henceforth Paper I). To construct SS2, we checked for the presence of some point-like source in the vicinity ( 6″ apart) of each DR10Q quasar (Pâris et al., 2014) in the range RA = 180360°, at redshift 1 5 and brighter than = 20. For each widely-separated quasar-companion pair ( 2″), we also compared the , , and colours of the quasar and its companion. After visual inspection, we finally selected the 14 promising candidates. About 80% of the SS2 quasars span the redshift interval = 22.6, and most SS2 targets are widely-separated pairs.
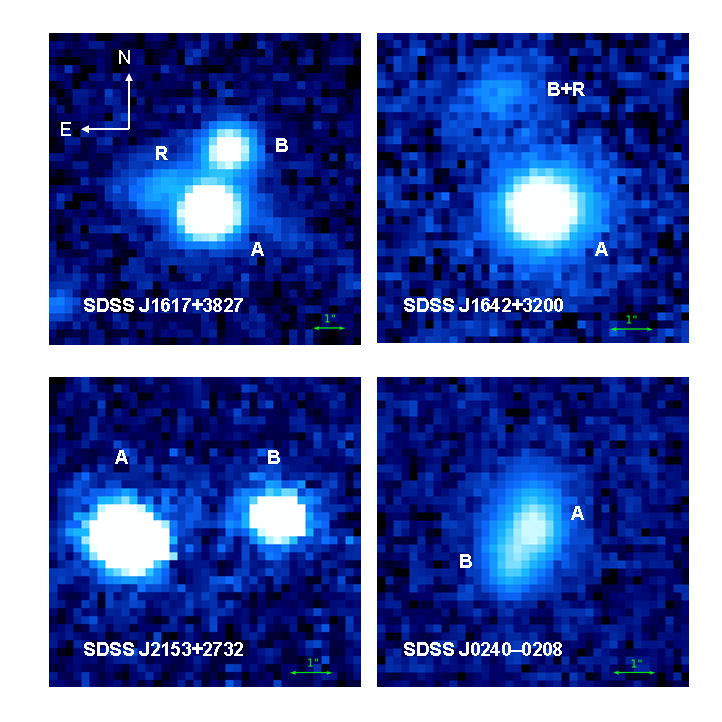
Complementary deep-imaging of 13 SS2 candidates at the Maidanak Astronomical Observatory222http://www.maidanak.uz/ (MAO) was used to select three superb candidates, i.e., quasar-companion pairs showing parallel flux variations on a 10-year timescale and evidence for the presence of a lensing galaxy (extended residual source). In Paper I, one out of these three golden targets was confirmed as the optically bright, wide separation double quasar SDSS J1442+4055 at redshift = 2.575 (see also More et al., 2016), while the other two superb candidates SDSS J1617+3827 and SDSS J1642+3200 were not spectroscopically observed. Here, we present spectra of these two last systems that allow us to discuss their nature. For SDSS J1617+3827, in addition to the extraction of spectra, we carefully analyse its best acquisition frame. In this paper, we also describe spectroscopic observations of another target in the SS2 subsample (SDSS J2153+2732) and the pseudo-galaxy SDSS J0240-0208. SDSS J2153+2732 is a quasar-companion pair showing anti-parallel flux variations and no evidence for a lensing galaxy. Although SDSS J0240-0208 was identified as a galaxy in the SDSS database, we serendipitously discovered that this target consists of two unidentified point-like sources separated by 1″. The spectra of SDSS J2153+2732 and SDSS J0240-0208 are used to identify all main sources in these systems.
2 Two superb candidates
2.1 SDSS J1617+3827
SDSS J1617+3827 consists of a quasar at = 2.079 with 19 (A), its companion with 21 (B) and a residual source (R) located northeast of A (see the top left panel of Fig. 1 and Fig. 2 in Paper I). The SDSS position of A is RA (J2000) = 24447052 and Dec. (J2000) = +3846030, and A and B are separated by 21. This target was initially observed in 2016 May using the SPRAT spectrograph on the 2.0m Liverpool Telescope. Despite taking a 5000-s total exposure, the data did not confirm the similarity between the spectra of A and B. The SPRAT spectrum of B seems to include emission lines similar to those of A, but the signal is relatively poor and it could be dominated by residual light of the brighter component. Due to the ambiguity of these initial results, SDSS J1617+3827 was also observed in dark time with the OSIRIS instrument on the 10.4m Gran Telescopio Canarias (GTC). On 2017 March 1, using the grism R500B and the 123-width slit aligned with the axis defined by A and B, we took 3900 s exposures with FWHM seeing of 103, 089 and 087. In a second observing run during such night, after aligning the slit to the direction joining A and R, we obtained three additional 900 s exposures with 076 FWHM seeing.
To extract the spectrum of each individual source, we followed a technique similar to that of Shalyapin & Goicoechea (2014) and Goicoechea & Shalyapin (2016). We used the astro-photometric solution from the acquisition frames in the band to make two ideal 2D light models with two on-axis point-like sources: AB for the first slit orientation and AR for the second one. These ideal models were then convolved with 2D Moffat PSFs having a power index = 2.5, masked with the slit transmission and integrated across the slit. Thus, for each spectroscopic exposure, our 1D model at each wavelength bin included four free parameters in a first iteration, i.e., the position of A, the width of the Moffat function, and the total fluxes of A and the other source (B or R). The two position-structure parameters were then fitted to smooth polynomial functions of the observed wavelength, leaving only the total fluxes as free parameters in a second iteration. The initial configuration led to flux-calibrated spectra and , whereas the second configuration yielded flux-calibrated spectra and .
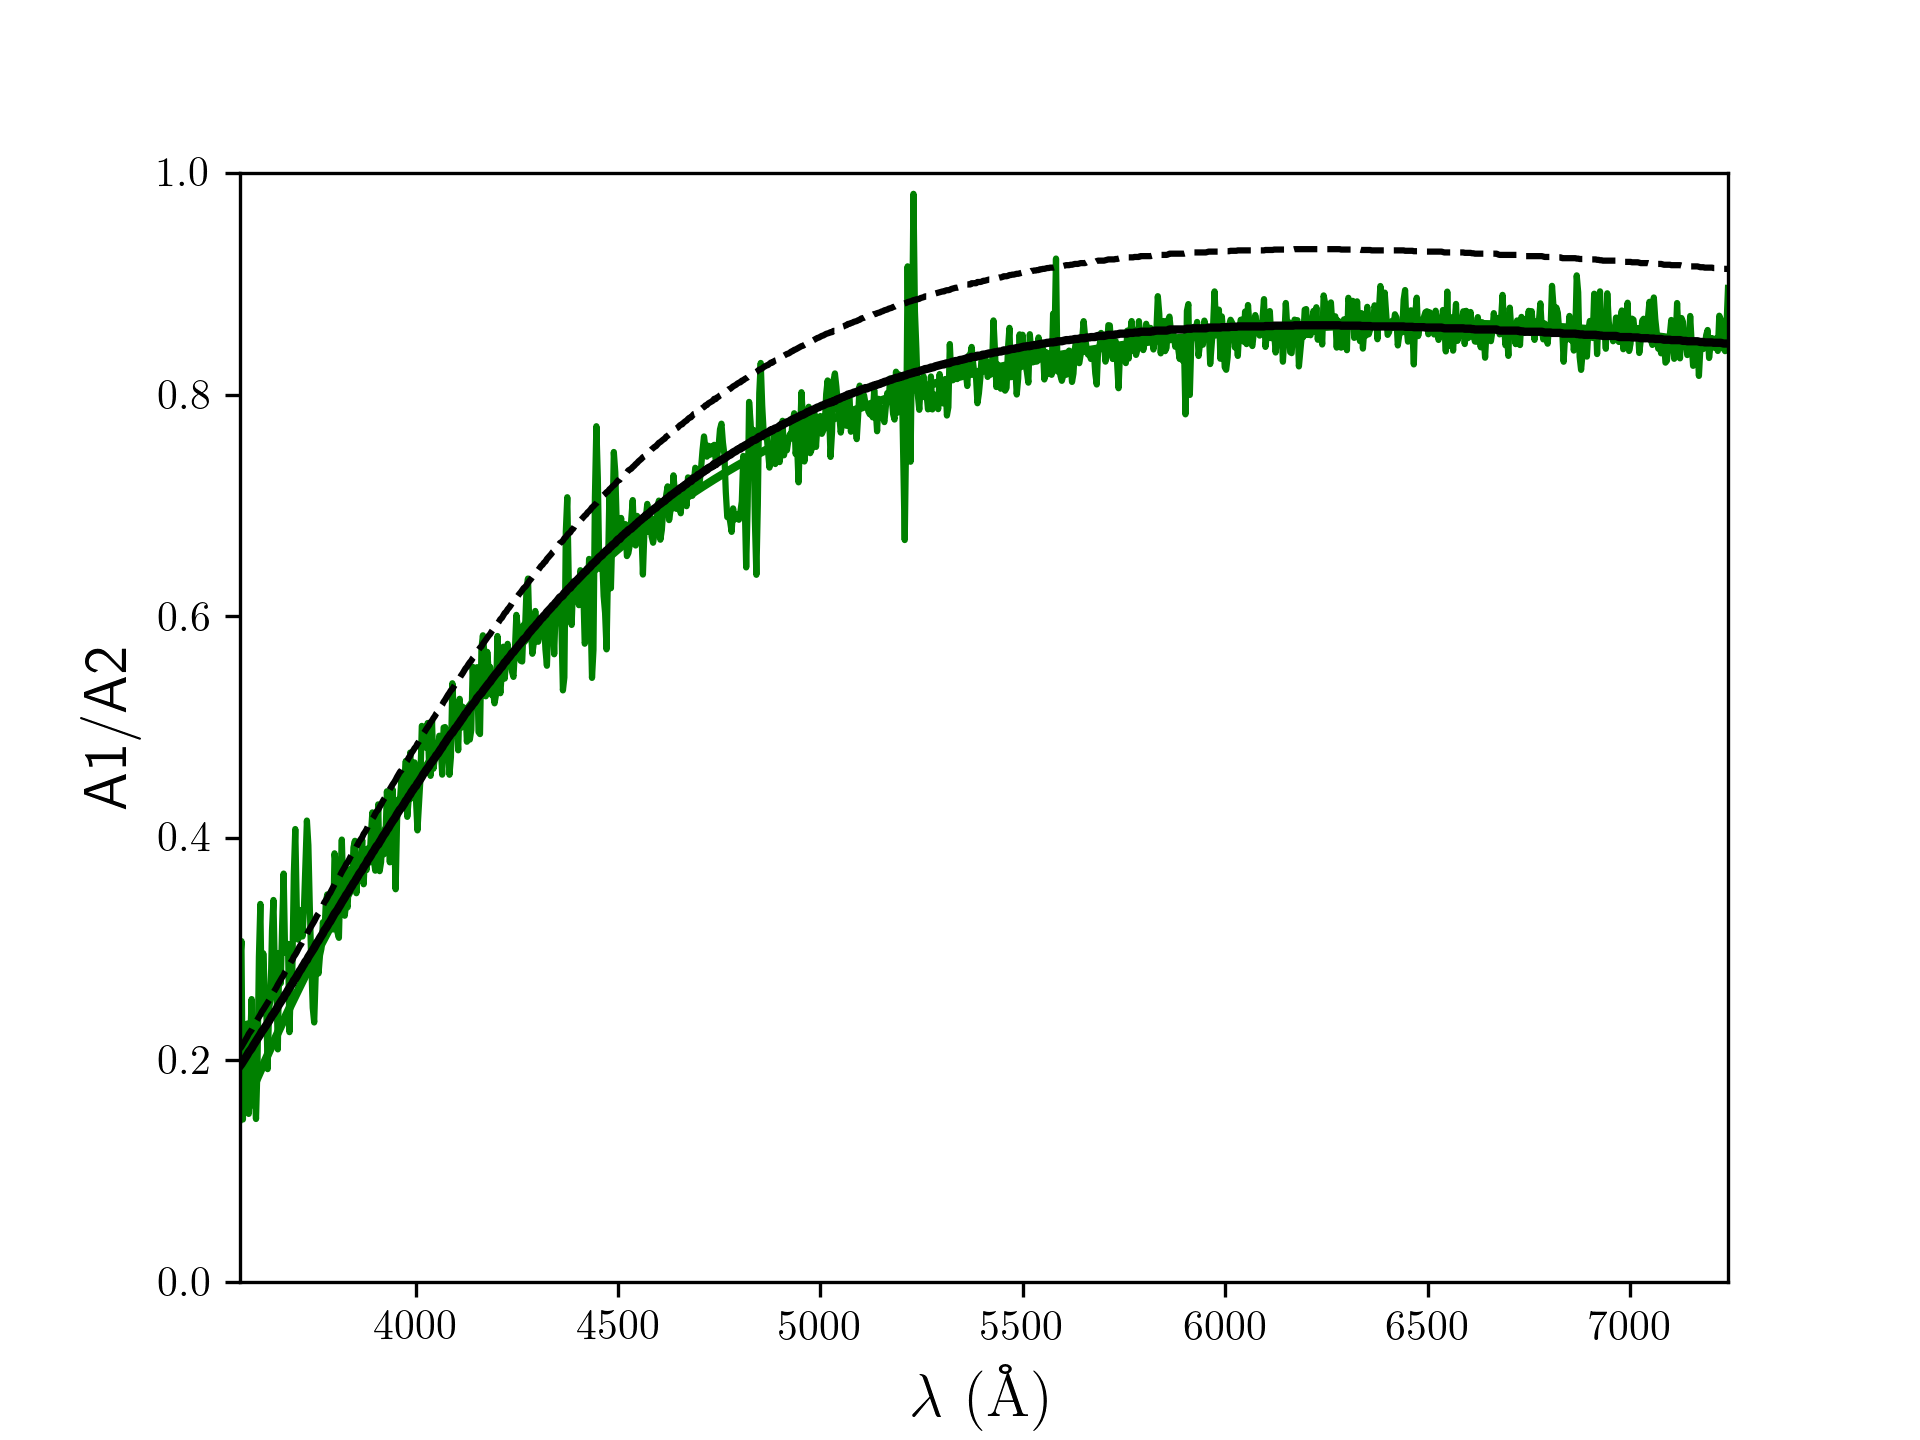
The spectral ratio strongly depends on wavelength (see green lines in Fig. 2), suggesting that differential atmospheric refraction (DAR) is playing a relevant role and on-axis sources throughout the entire spectral range is not a realistic approach. Hence, to account for DAR-induced spectral distortions, we considered on-axis sources only at 6225 Å, since the adquisition frame was taken in the SDSS passband. The DAR produces chromatic offsets of sources across the slit, and thus wavelength-dependent slit losses (Filippenko, 1982). Taking into account the airmass and the slit position angle for each exposure, we derived the slit losses for both configurations AB and AR, as well the expected spectral ratio (see the black dashed line in Fig. 2). The expected ratio follows the same trend as the measured one, but having a larger amplitude. Multiplying it by an achromatic factor of 0.926, we reproduce the measured spectral ratio (see the black solid line in Fig. 2). This last factor is likely related to changes in atmospheric transparency throughout the observing night.
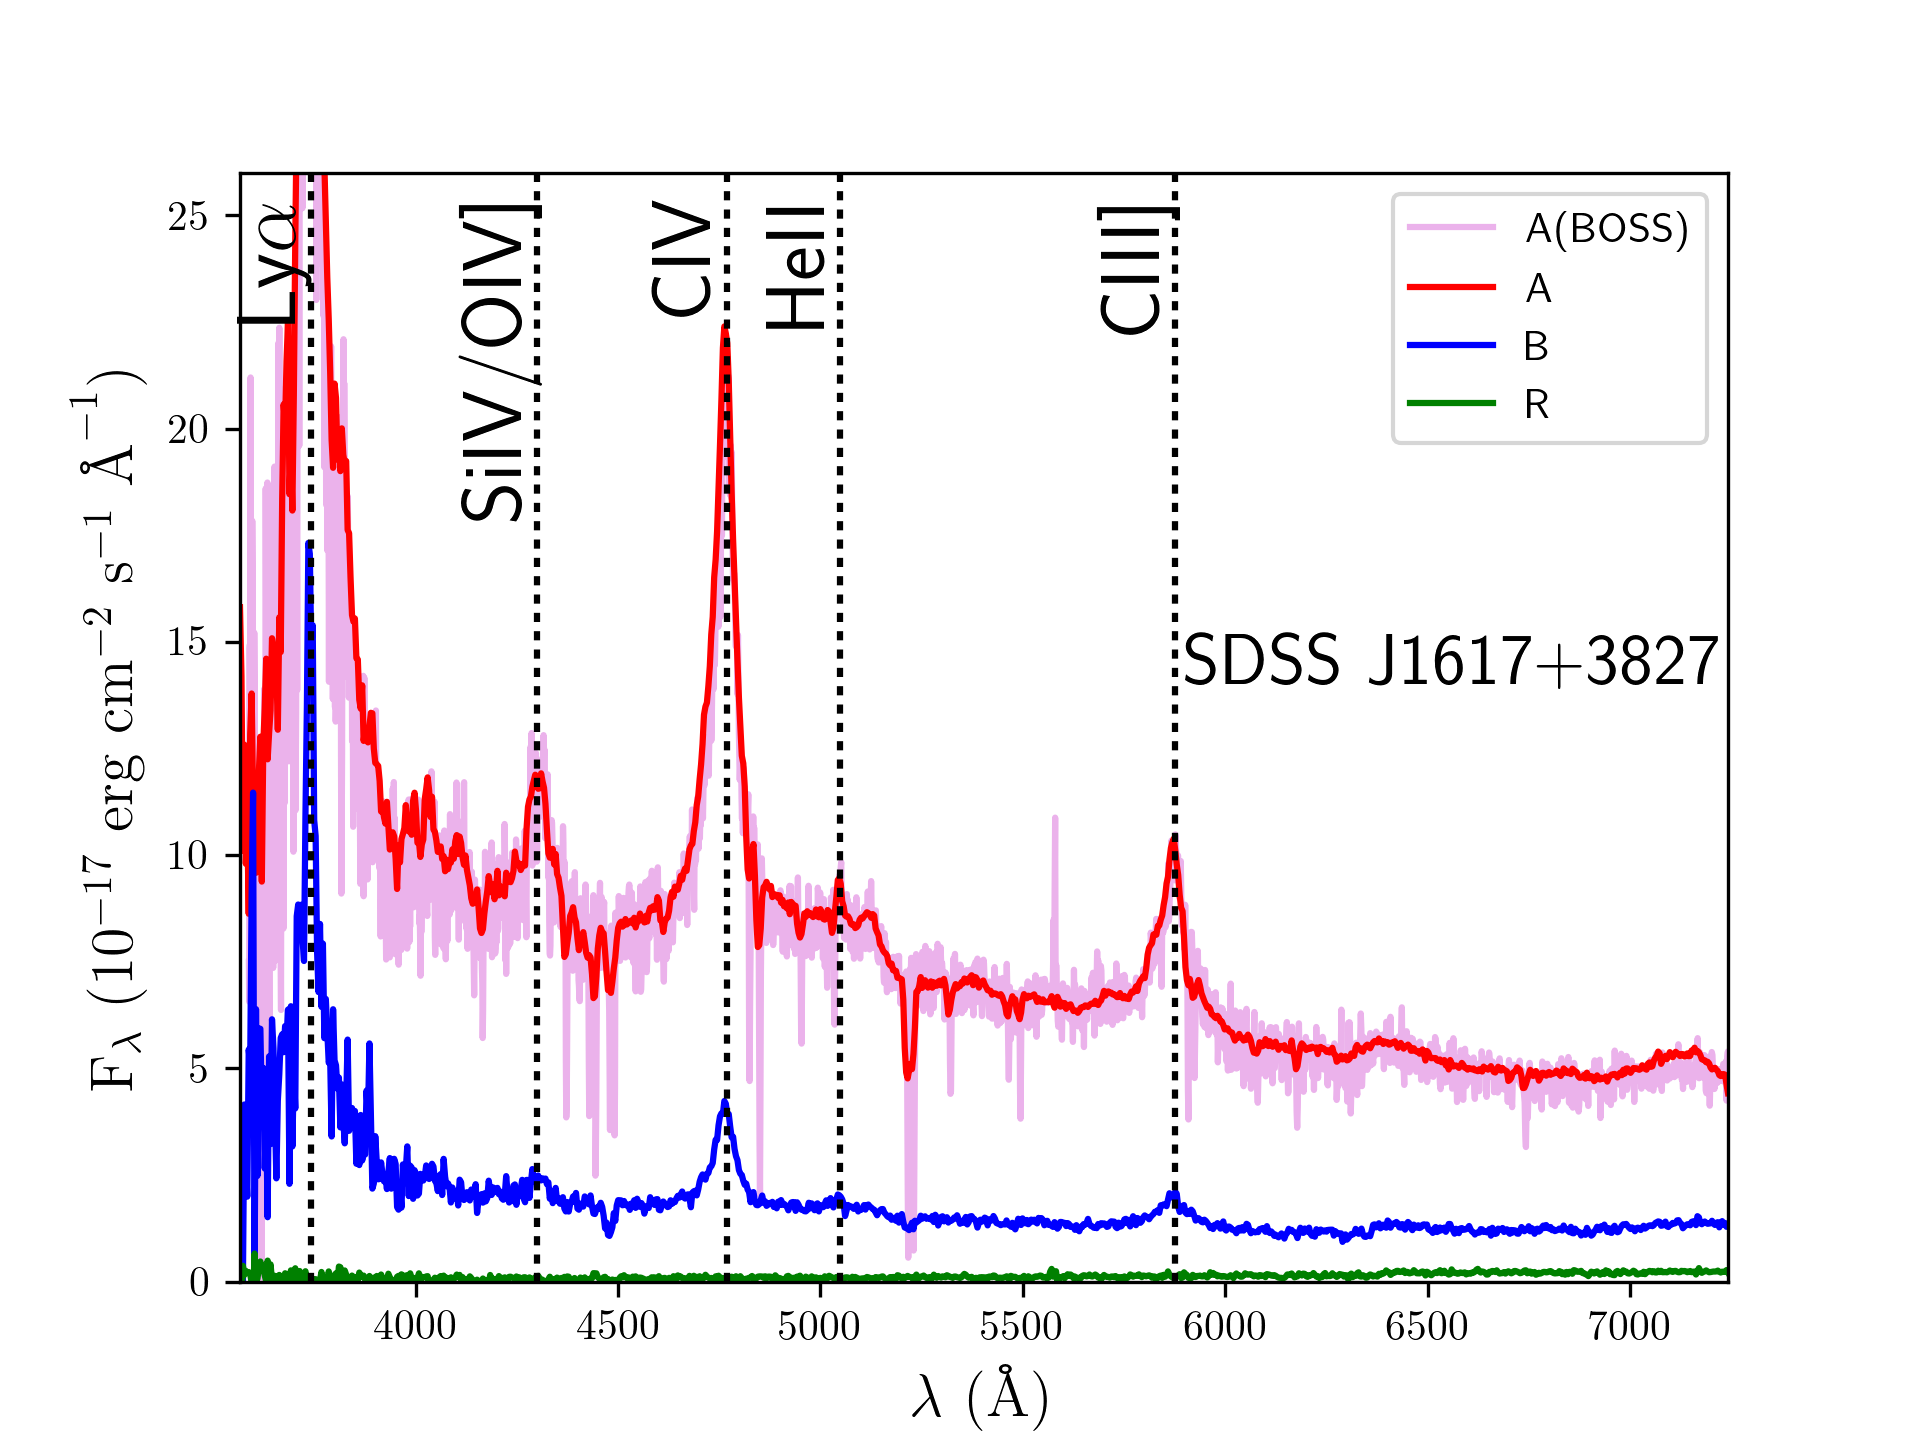
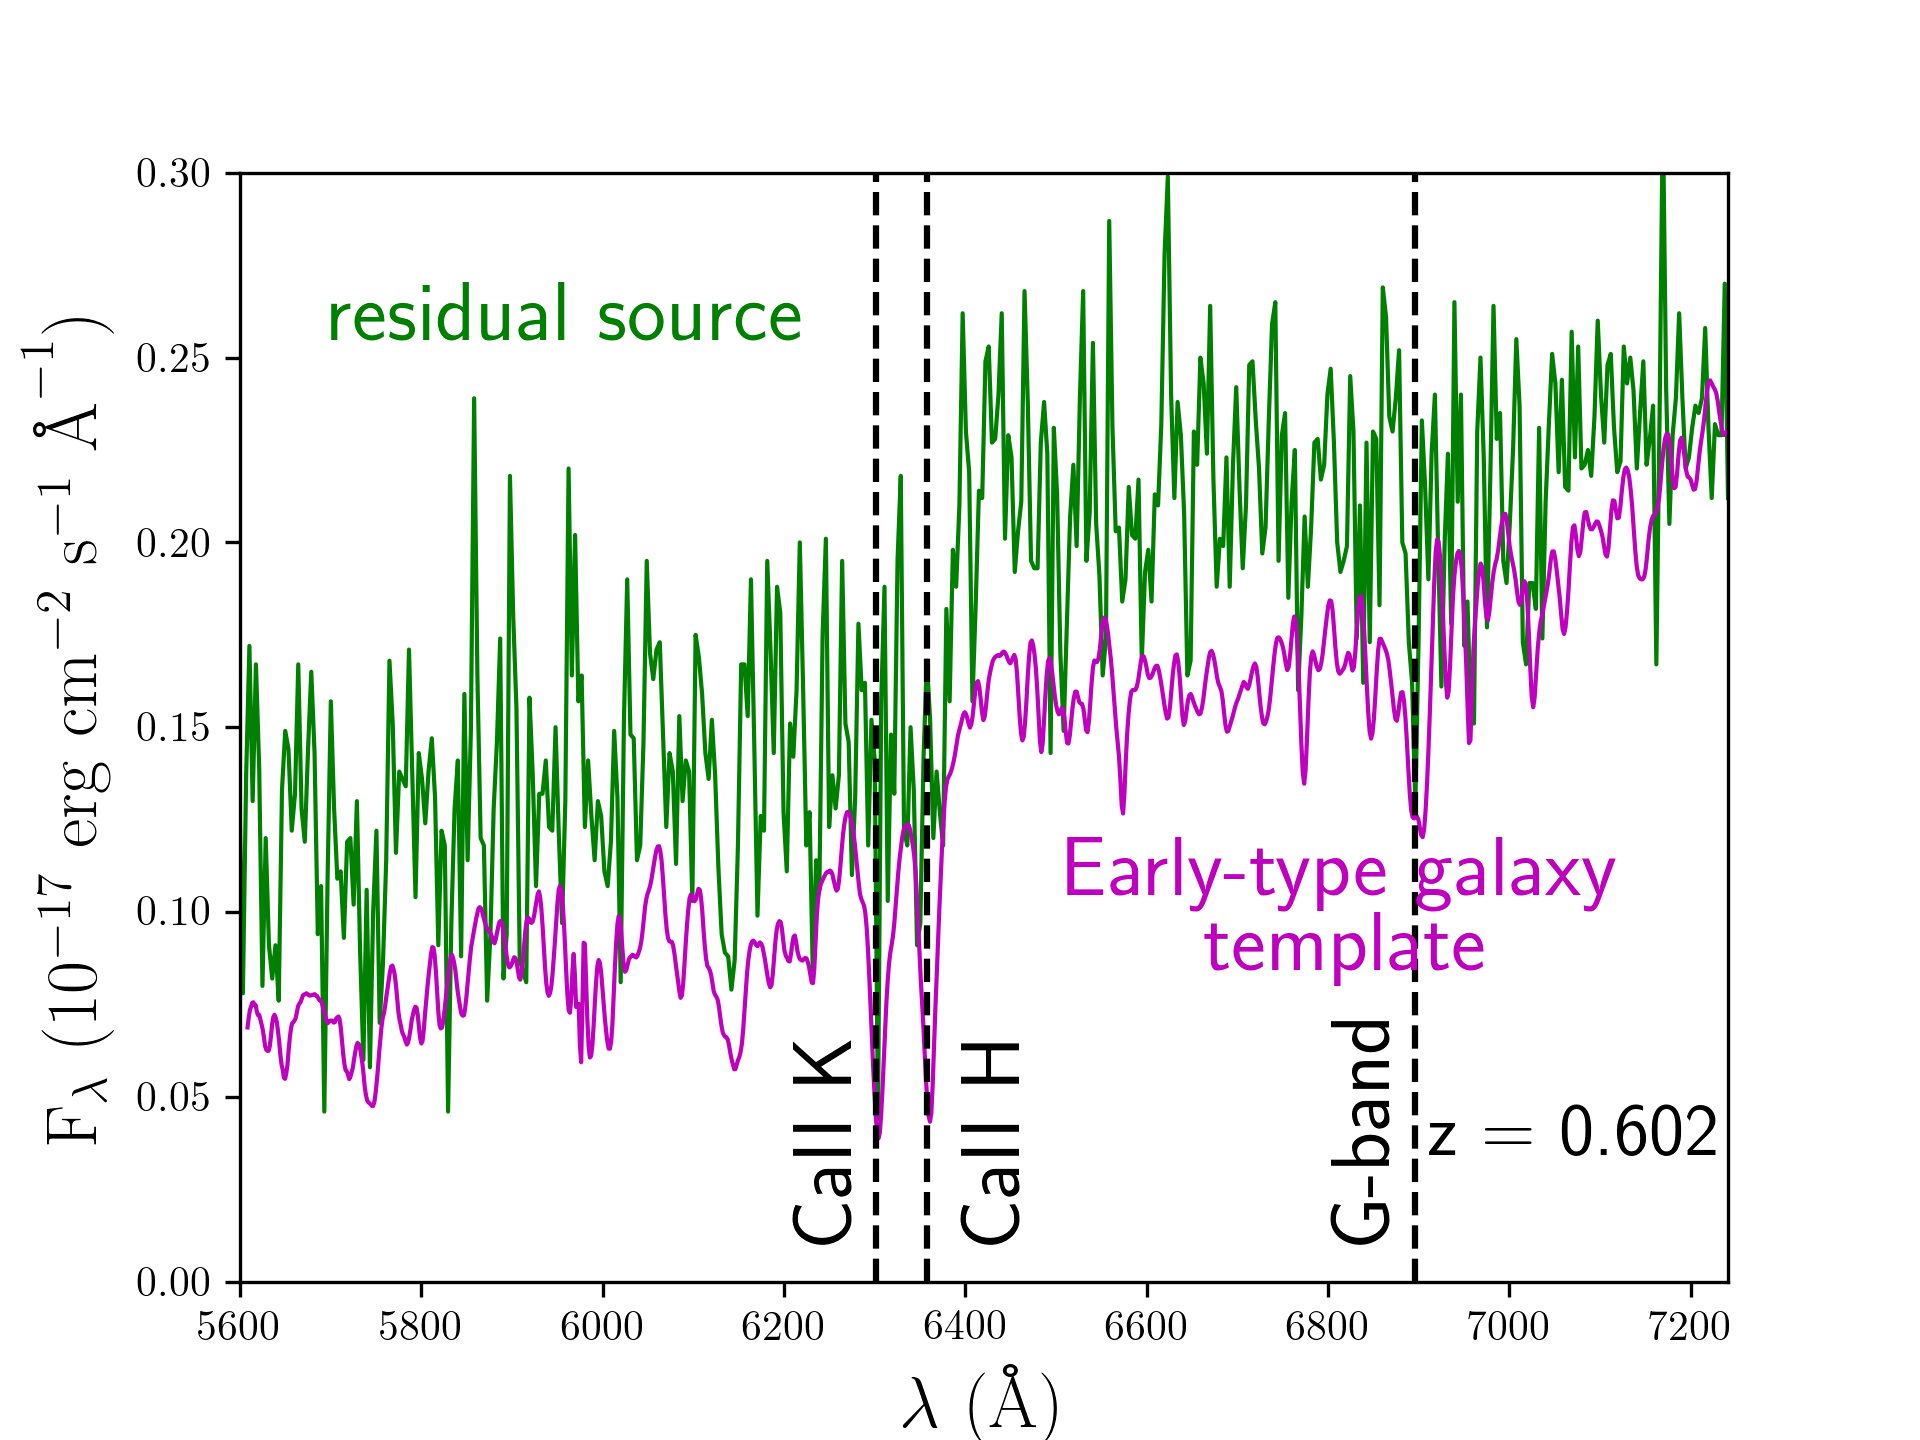
After correcting for slit losses in , , and , and combining and , we obtained final spectra of A, B and R. Table 1 includes wavelengths (Col. 1), and fluxes of A, B and R (Cols. 2, 3 and 4). The GTC spectra are also shown in Fig. 3. In the top panel of Fig. 3, our A spectrum is compared with the SDSS-BOSS spectrum of this component, as well as the spectra of B and R. As expected for a double quasar, the spectra of A and B show identical emission-line redshifts. The bottom panel of Fig. 3 incorporates a zoomed-in version of the spectrum of R at the longest wavelengths. Despite the faintness of this residual source, we identify it as an early-type lensing galaxy at = 0.602.
| (A) | (B) | (R) | |
|---|---|---|---|
| 3566.450 | 15.814 | 0.948 | 0.138 |
| 3570.042 | 14.197 | 1.827 | -0.275 |
| 3573.634 | 10.100 | 0.000 | 0.370 |
| 3577.226 | 12.591 | 4.153 | 0.157 |
| 3580.819 | 9.798 | 2.793 | 0.253 |
| 3584.411 | 10.852 | 1.992 | 0.200 |
| 3588.003 | 8.625 | 5.442 | 0.224 |
| 3591.595 | 12.829 | 5.066 | 0.189 |
| Object | (″) | (″) | (mag) | (″) | (°) | |
|---|---|---|---|---|---|---|
| A | 0 | 0 | 19.37 0.01 | — | — | — |
| B | 0.643 0.003 | 1.983 0.002 | 21.08 0.01 | — | — | — |
| R | 1.509 0.018 | 0.896 0.012 | 21.01 0.16 | 3.15 0.55 | 0.32 0.05 | 68.7 6.1 |
| R2 | 0.379 0.041 | 1.689 0.061 | 22.00 0.21 | 1.95 0.63 | 0.34 0.11 | 5.1 12.9 |
The high-resolution SDSS-BOSS spectrum of A, taken on 2012 May 20, and the IRAF task SPLOT333IRAF is distributed by the National Optical Astronomy Observatories, which are operated by the Association of Universities for Research in Astronomy, Inc., under cooperative agreement with the National Science Foundation. The SPLOT task is used to plot and analyse spectra were used to search for Fe/Mg absorption systems, and accurately measure redshifts and line strengths of Mg ii 2796, 2803 absorption doublets. We found four different absorbers at = 0.6020, 0.8656, 1.1129 and 1.5927, the second being the strongest one. These results basically agree with previous measures that were based on an early SDSS spectrum in 2003 April. Prochter et al. (2006) detected the two first absorbers when analysing Mg ii 2796 lines having a rest-frame equivalent width () exceeding 1 Å. Lawther et al. (2012) and Seyffert et al. (2013) also reported values for the strongest Mg ii 2796, 2803 doublet lines at = 0.8656. For example, Seyffert et al. (2013) estimated 2.4 Å (2796 Å) and 2 Å (2803 Å), which roughly match our results using the spectrum more recent and less noisy: = 2.21 Å (2796 Å) and 2.25 Å (2803 Å).
The GTC data have worse spectral resolution than SDSS-BOSS ones, but the signal-to-noise ratio is higher and the absorption in both quasar images can be compared with each other. Regarding the nearest intervening system ( = 0.6020) that is likely associated with the lensing galaxy northeast of A, the of the Mg ii doublet in B is large compared with that in A. There is a difference in a factor 2 between the two images. However, for the second system at = 0.8656, we estimated (A) 1.5 (B). Unfortunately, the position in the sky of such absorber is unknown, so it is hard to discuss the role that its gravitational field plays. The lensed components (A and B) and the lensing galaxy R are not aligned, and we could not make reasonable strong lens models using exclusively data of A, B and R as constraints. Therefore, the residual object in the top left panel of Fig. 1 is not the main lensing galaxy in this putative lens system.
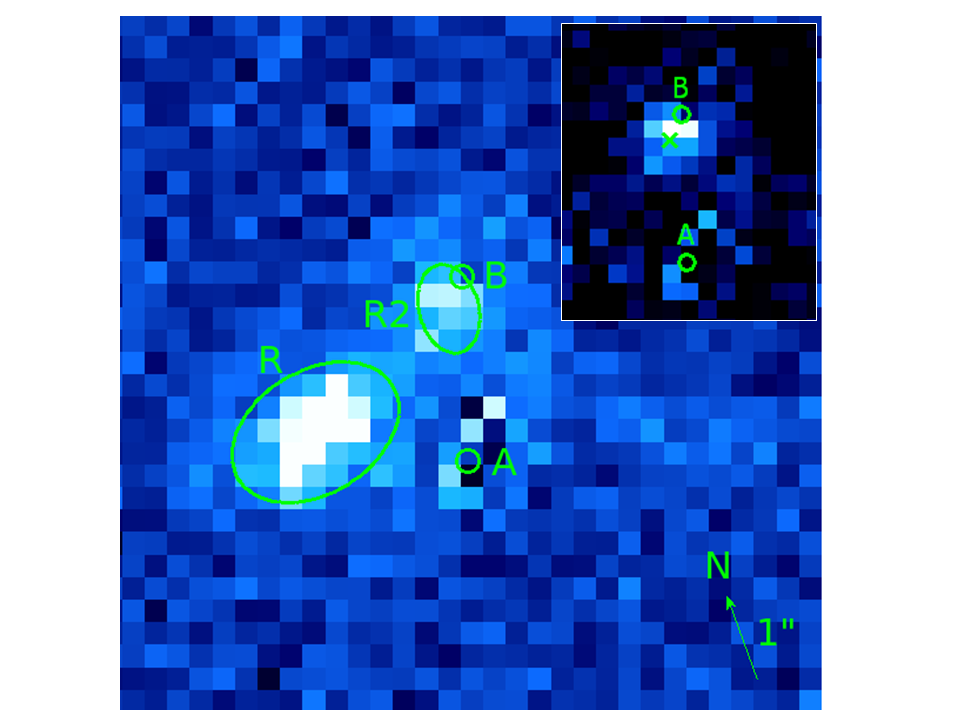
To confirm the strong gravitational lens nature of SDSS J1617+3827, we searched for the elusive primary deflector in the best adquisition frame (see Fig. 1). Our aim was to detect an additional residual source R2 and find out its properties. Despite this GTC -band exposure lasted only 40 s, it is equivalent to a relatively deep exposure of 1080 s with a 2m telescope. The FWHM seeing was stable at around 075. The system subframe consisted of 3232 pixels (with pixel scale and position angle of 02544 and 20°, respectively), and the objects A and B were described as two stellar-like sources, i.e., using the PSF of a nearby star, while each residual object was modelled as a de Vaucouleurs profile convolved with the PSF. We used the GALFIT software (Peng et al., 2002, 2010) to initially model the system as a superposition of A, B and R. In a subsequent fit, we considered a fourth source R2. When introducing R2, the number of degrees of freedom is reduced by 6, but the value decreases by 63. Thus, we detect a faint source R2 close to B and aligned with both quasar images (see the top right subpanel in Fig. 4), which provides evidence supporting that SDSS J1617+3827 is a lensed quasar.
The GALFIT solution for the A+B+R+R2 model is shown in Table 2. This solution has a reduced value of 0.88, and incorporates positions and structure parameters for the light distributions of R (secondary lensing object) and R2 (candidate for the main lensing object). In Fig. 4, we display the residuals after subtracting the modelling results for A and B, as well as the positive residuals after subtracting the models of A, B and R (top right subpanel). New deep IR imaging is required to accurately determine astro-photometric parameters of R and R2. Additionally, an accurate reconstruction of the lensing mass distribution for SDSS J1617+3827 is not yet feasible.
2.2 SDSS J1642+3200
SDSS J1642+3200 consists of a quasar at = 2.263 with 18 (A), its companion with 20 (B) and a residual source (R) around the fainter object. Although B+R appears as a dim light distribution in the top right panel of Fig. 1, we were able to resolve both sources from the deep -band exposure at the MAO (see Fig. 2 in Paper I). Component A is located at RA (J2000) = 25071282 and Dec. (J2000) = +3200811, and A and B are 29 apart. The source R could be physically associated with B, so B would be the central region of a galaxy. In fact, the SDSS database clasifies B+R as a galaxy with photometric redshift of 0.25 0.07. However, even in this case, we would not dealing with a normal galactic nucleus because B can be resolved as a point-like source and shows optical variability. To clarify the true nature of the system, SDSS J1642+3200 was spectroscopically observed on 2016 March 3 using the ALFOSC instrument on the 2.5m Nordic Optical Telescope (NOT). We also used the grism #18 and the 10-width slit, putting the long slit in the direction joining A and B. Four consecutive exposures of 1000 s each were done under typical seeing conditions.
As the A and B components are separated by 3″, in each individual frame, we clearly distinguish the bright multi-line spectrum of A from a faint spectrum for B that is dominated by a light spot at 4760 Å. In order to extract the spectra of A and B, we followed a simple procedure. Our 1D model at each wavelength bin incorporated two Gaussian profiles with a fixed separation between both sources. In a first iteration, there were four free parameters: the position of A, the width of the Gaussian function, and the total fluxes of A and B. We then fitted A positions and Gaussian widths to smooth polynomial functions of the observed wavelength. In a second iteration, only the total fluxes were allowed to vary. A very similar procedure is followed in Sec. 2.1.
| (A) | (B) | |
|---|---|---|
| 3576.500 | 44.397 | 15.231 |
| 3577.323 | 37.889 | 4.632 |
| 3578.146 | 31.381 | 4.183 |
| 3578.969 | 29.859 | 14.035 |
| 3579.792 | 26.101 | 15.786 |
| 3580.615 | 29.631 | 14.101 |
| 3581.439 | 36.411 | 12.415 |
| 3582.262 | 43.191 | 9.497 |
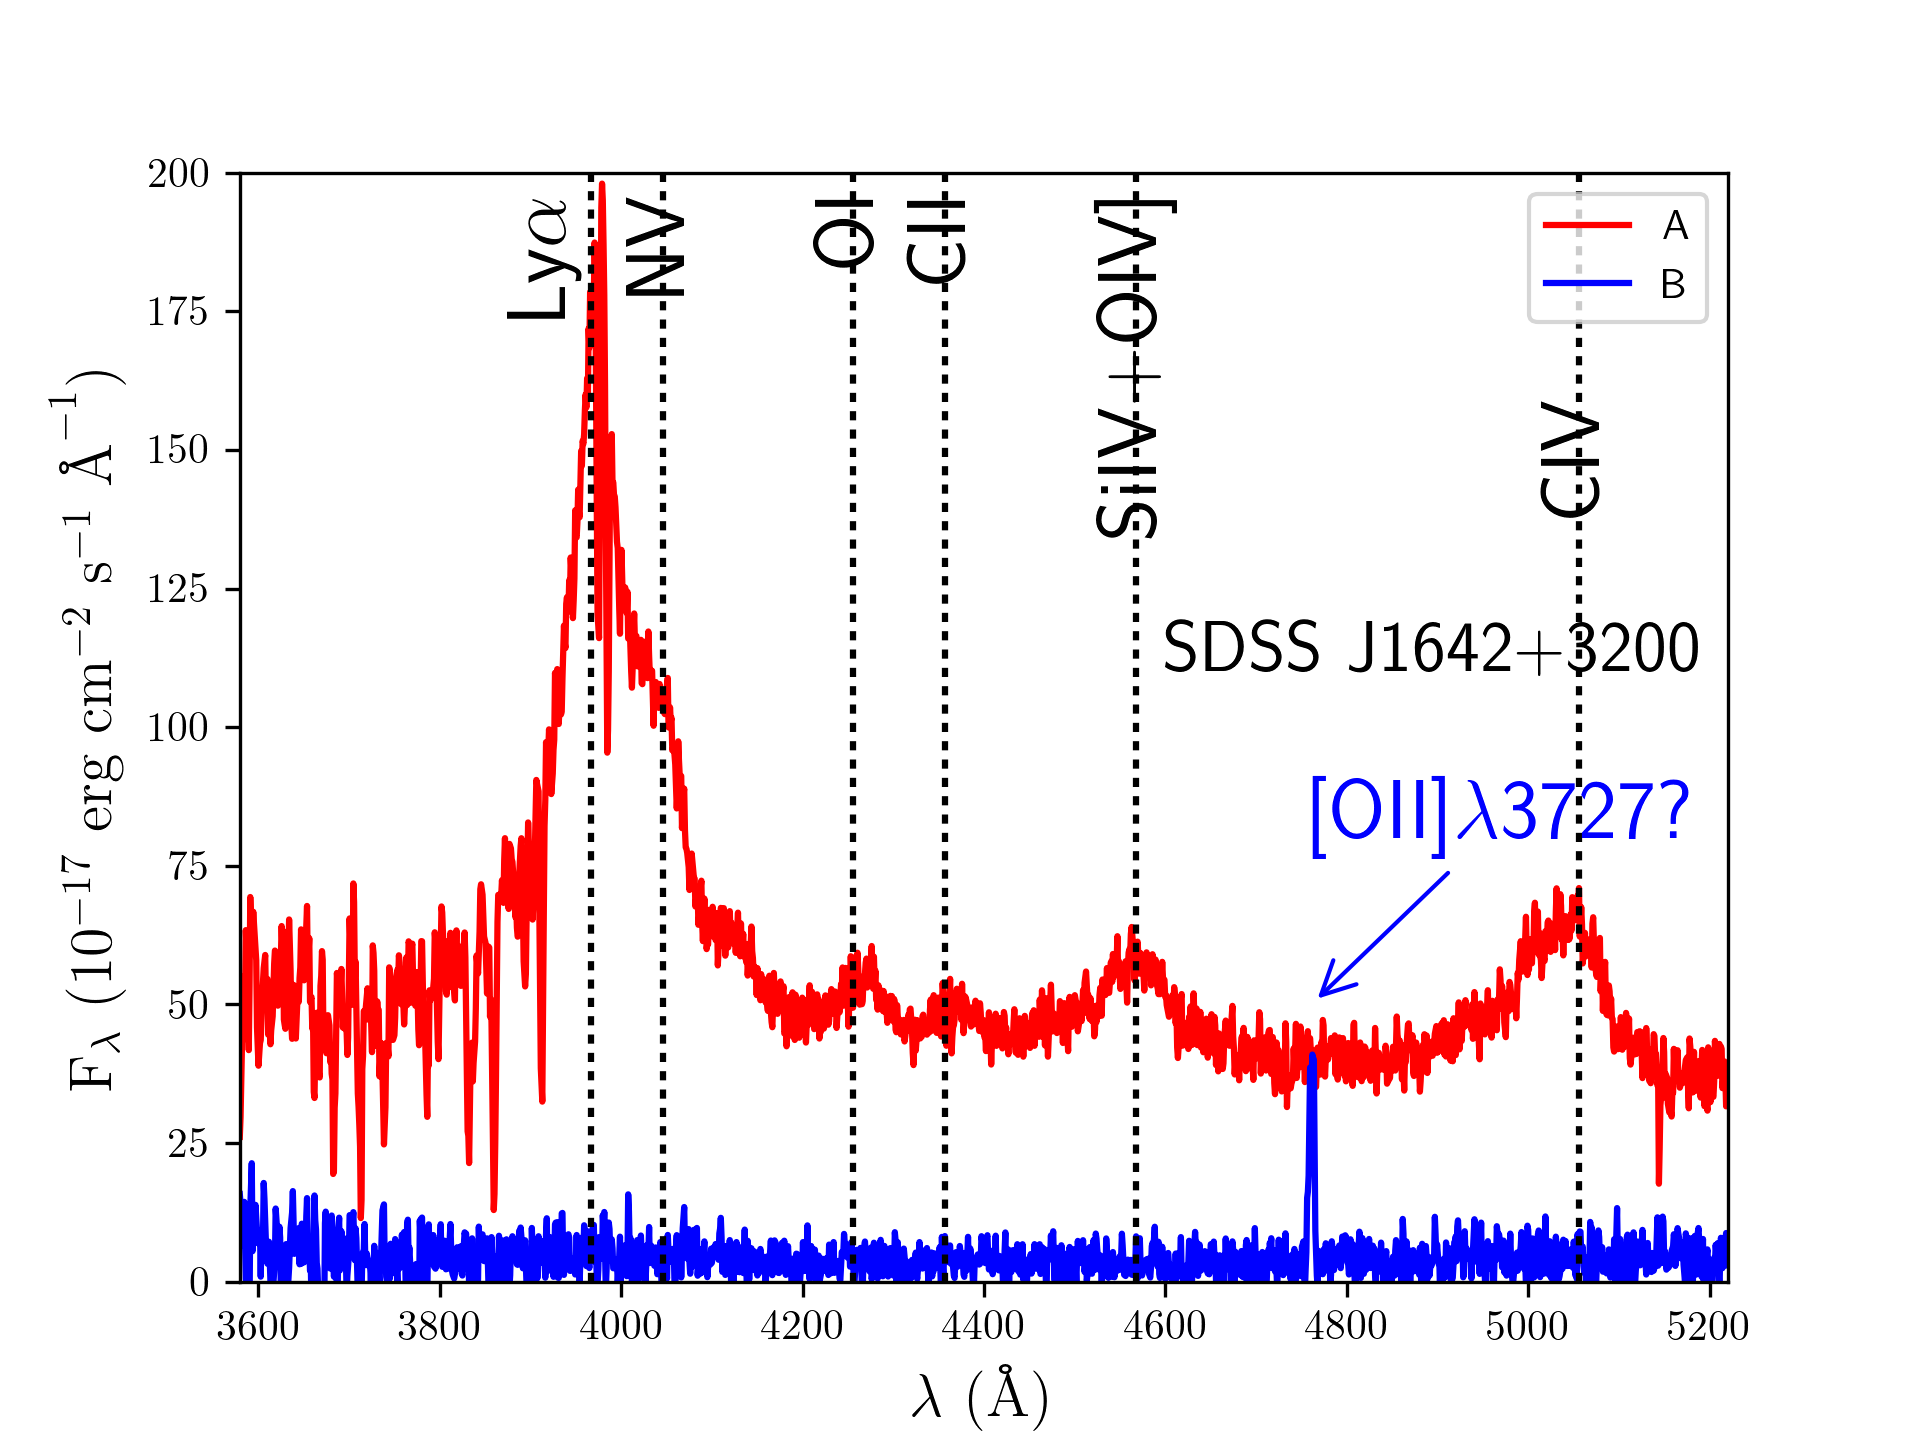
The final flux-calibrated spectra of A and B are included in Table 3 and depicted in Fig. 5. While A is a quasar with Ly, N v, O i, C ii, Si iv/O iv] and C iv emission lines at the expected redshift of 2.263, the spectral energy distribution of B reveals a weak flat continuum with a superimposed narrow emission line. This prominent emission may correspond to the O ii 3727 line at = 0.277, since such redshift is within the error bar for the photometric of B+R in the SDSS database. Hence, B is not the second image of the quasar at = 2.263, but another active galactic nucleus showing variability, a flat continuum and narrow emission lines at optical wavelengths. The residual source R is most likely the host galaxy of B.
For SDSS J1642+3200, the question arises why the host galaxy of B does not produce strongly lensed images of the background source associated with A. To answer this question, we considered a simple model for the mass distribution in such host galaxy. The matter content of the deflector was modelled as a singular isothermal sphere (SIS), so its Einstein radius is given by = 14 (/220 km s, where is the one-dimensional velocity dispersion, is the (angular diameter) distance between deflector and source, and is the distance between observer and source (e.g. Narayan & Bartelmann, 1999). Using suitable expressions for these distances (e.g. Hogg, 1999), a concordance flat cosmology (Bennett et al., 2014) and the redshifts involved: = 0.277 and = 2.263, the SIS model yielded = 112 (/220 km s. To see only one image of the distant quasar, the condition that has to be fulfilled is (weak lensing regime), or equivalently, the deflecting mass within 10 kpc must be less than 3 1011 M⊙ ( 255 km s-1).
3 SDSS J2153+2732: a puzzling candidate
Besides the three golden candidates in Paper I (see also the first paragraph of Sec. 1), we found a puzzling candidate in the SS2 subsample. Although there is no evidence for a lensing galaxy (residual source) in SDSS J2153+2732, this system displayed significant anti-parallel variations in the flux of its two components A and B. The brighter component A is classified as a quasar at = 2.214 with 19, whereas B is about one magnitude fainter (see the bottom left panel of Fig. 1). The SDSS position of A is RA (J2000) = 32831784 and Dec. (J2000) = +2754302, and the two sources are separated by 36. We observed SDSS J2153+2732 on 2015 November 7 using the ALFOSC spectrograph (grism #14) on the NOT. The 10-width slit was aligned with the axis defined by A and B, and we took a global exposure of 4000 s with FWHM seeing of about 1″. We obtained the spectra of both components following the same method as in Sec. 2.2.
Our final results are shown in Table 4 and Fig. 6. In the top panel of Fig. 6 (red and blue lines), it is evident that A and B are two different quasars having similar (but not identical) redshifts. The SDSS-IV DR14 (Abolfathi et al., 2018) also includes the BOSS spectrum of B taken on 2015 October 12, only a few weeks before the NOT observations and 3 years after the SDSS-BOSS spectrum of A obtained on 2012 June 20. In agreement with our NOT spectra, the current version of the SDSS database indicates that SDSS J2153+2732 consists of a pair of quasars with (A) = 2.214 and (B) = 2.244.
| (A) | (B) | |
|---|---|---|
| 3245.585 | -12.216 | -43.301 |
| 3247.004 | 14.016 | -21.166 |
| 3248.422 | 40.247 | 7.852 |
| 3249.841 | 36.725 | 7.782 |
| 3251.259 | 27.255 | 7.713 |
| 3252.678 | 33.396 | 29.561 |
| 3254.096 | 32.233 | 25.537 |
| 3255.515 | 31.071 | 24.027 |
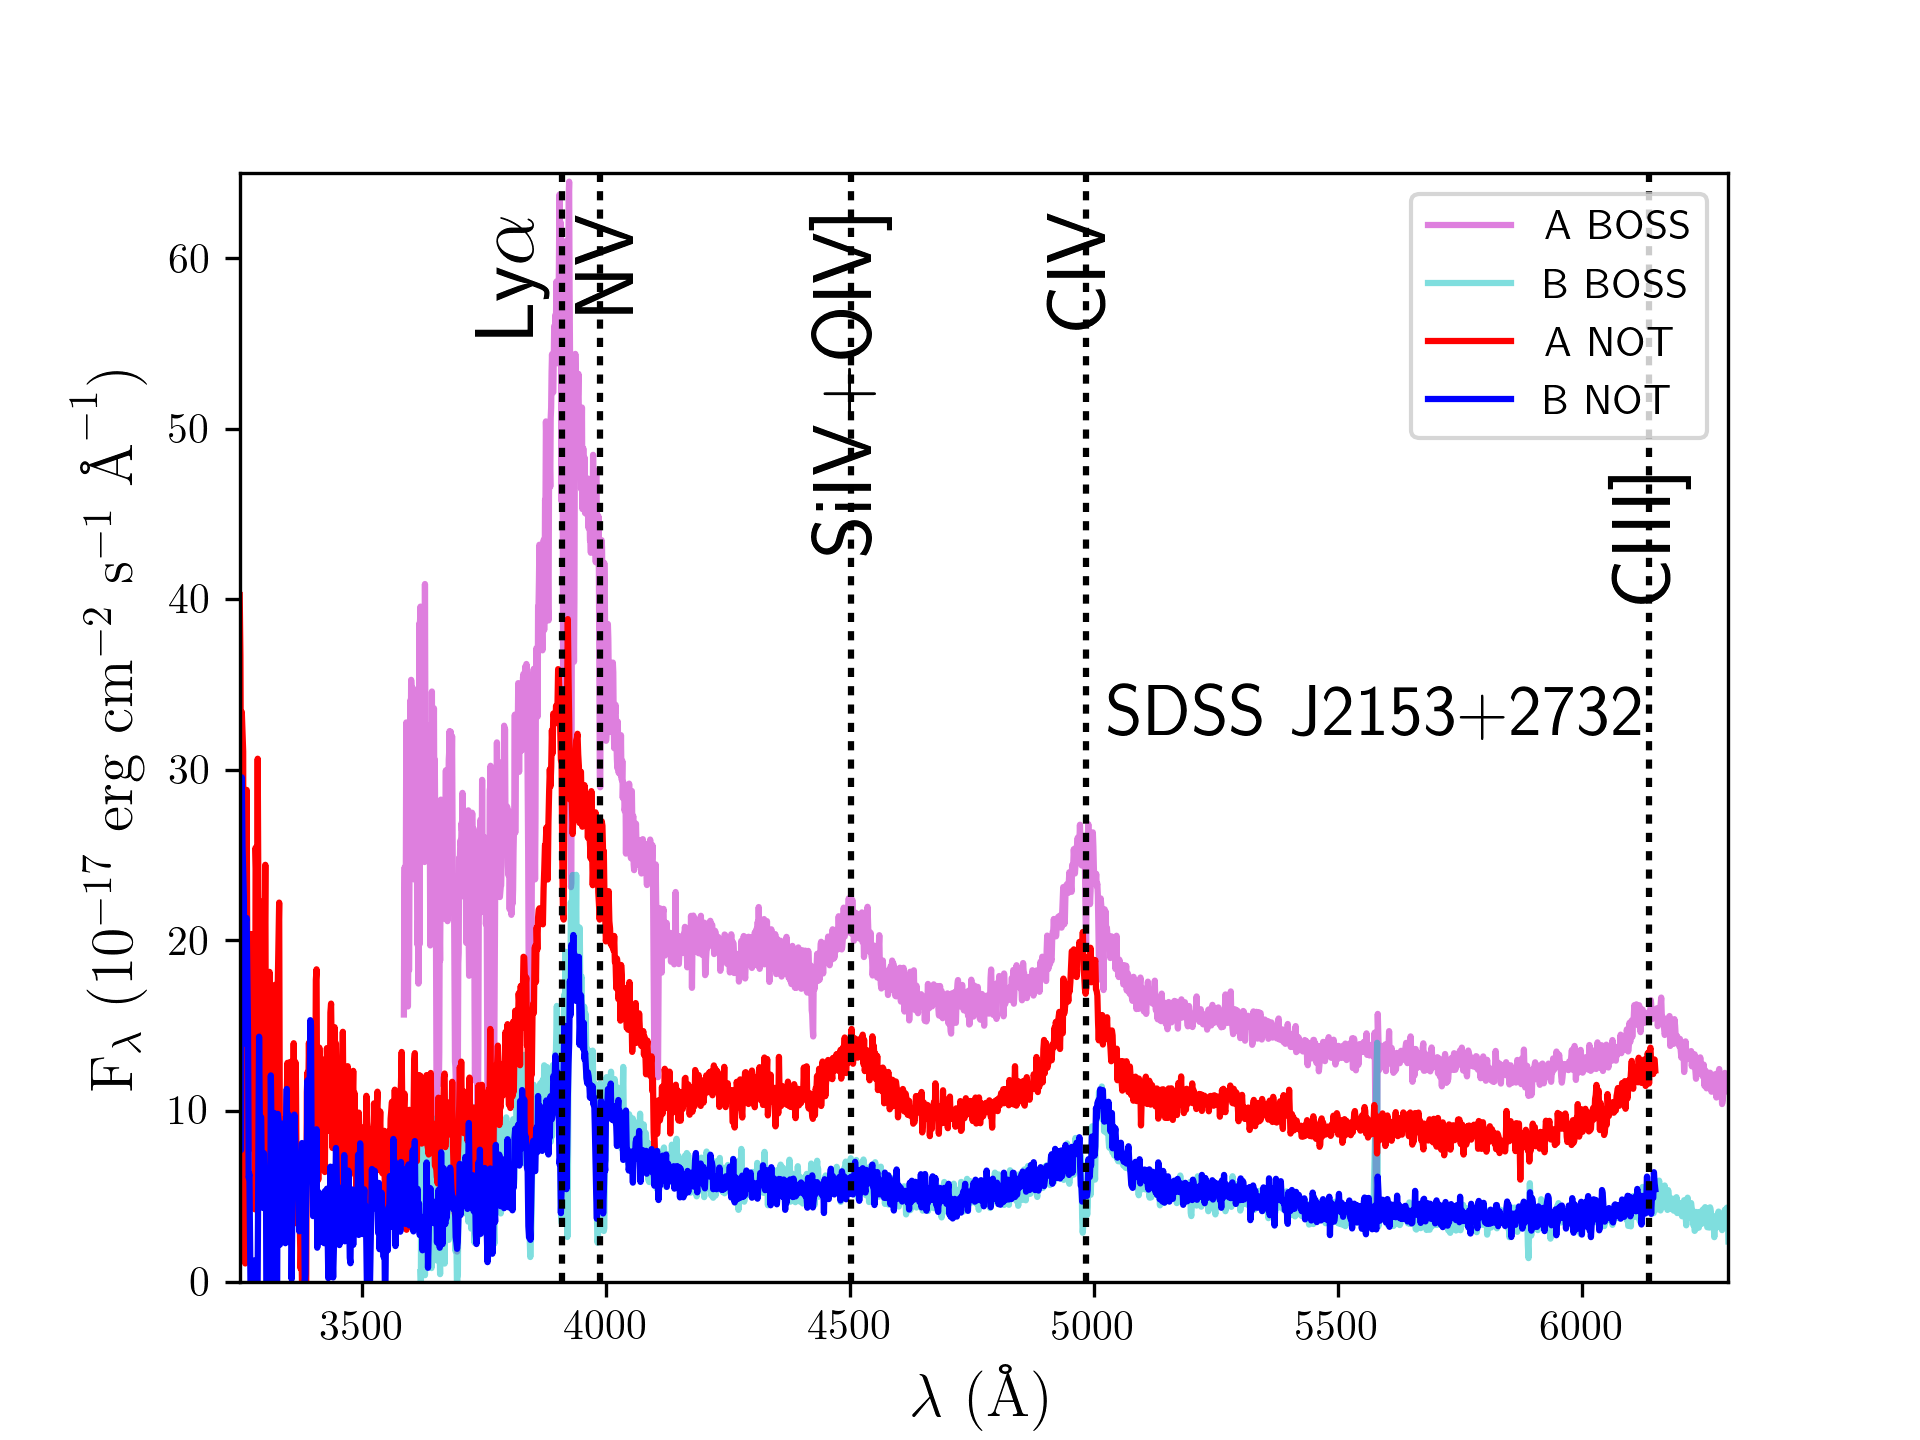
We analysed the SDSS-BOSS spectra of both sources (see the magenta and cyan lines in the top panel of Fig. 6; we show the spectral region covering wavelengths shorter than 6300 Å) to estimate reliable redshifts and discuss whether or not the two quasars are physically associated. Although the C iii] and C iv emission lines of A led to an average redshift of 2.214, the Mg ii emission line of A yielded a larger value of 2.231. This last emission line is thought to be a good tracer of the systemic redshift (e.g. Richards et al., 2002), and we adopted (A) = 2.231 instead of the nominal value in the SDSS database. For the other quasar, the Mg ii emission line indicated that (B) is 2.242, which is very close to its nominal value.
As close galaxy encounters trigger or enhance their nuclear activity (e.g. Mortlock et al., 1999; Hennawi et al., 2006a; Eftekharzadeh et al., 2017), we checked the hypothesis of a close separation quasar-quasar pair. Thus, assuming a cosmological redshift 2.237 for the two quasars, the physical transverse separation and the peculiar velocity difference (along the line-of-sight) would be 30 kpc444Based on the angular separation = 36, the concordance flat model described by Bennett et al. (2014) and the cosmology calculator of Wright (2006) and 1000 km s-1, respectively. Even though such large relative motion requires very massive host galaxies in a binary scenario, quasars likely reside in central regions of massive halos (e.g. Turner, 1991; Porciani et al., 2004; Prochaska et al., 2013). Moreover, considering a collision or merger in a high density environment (e.g. Hennawi et al., 2006a, and references therein), it seems also plausible to account for the estimated velocity difference.
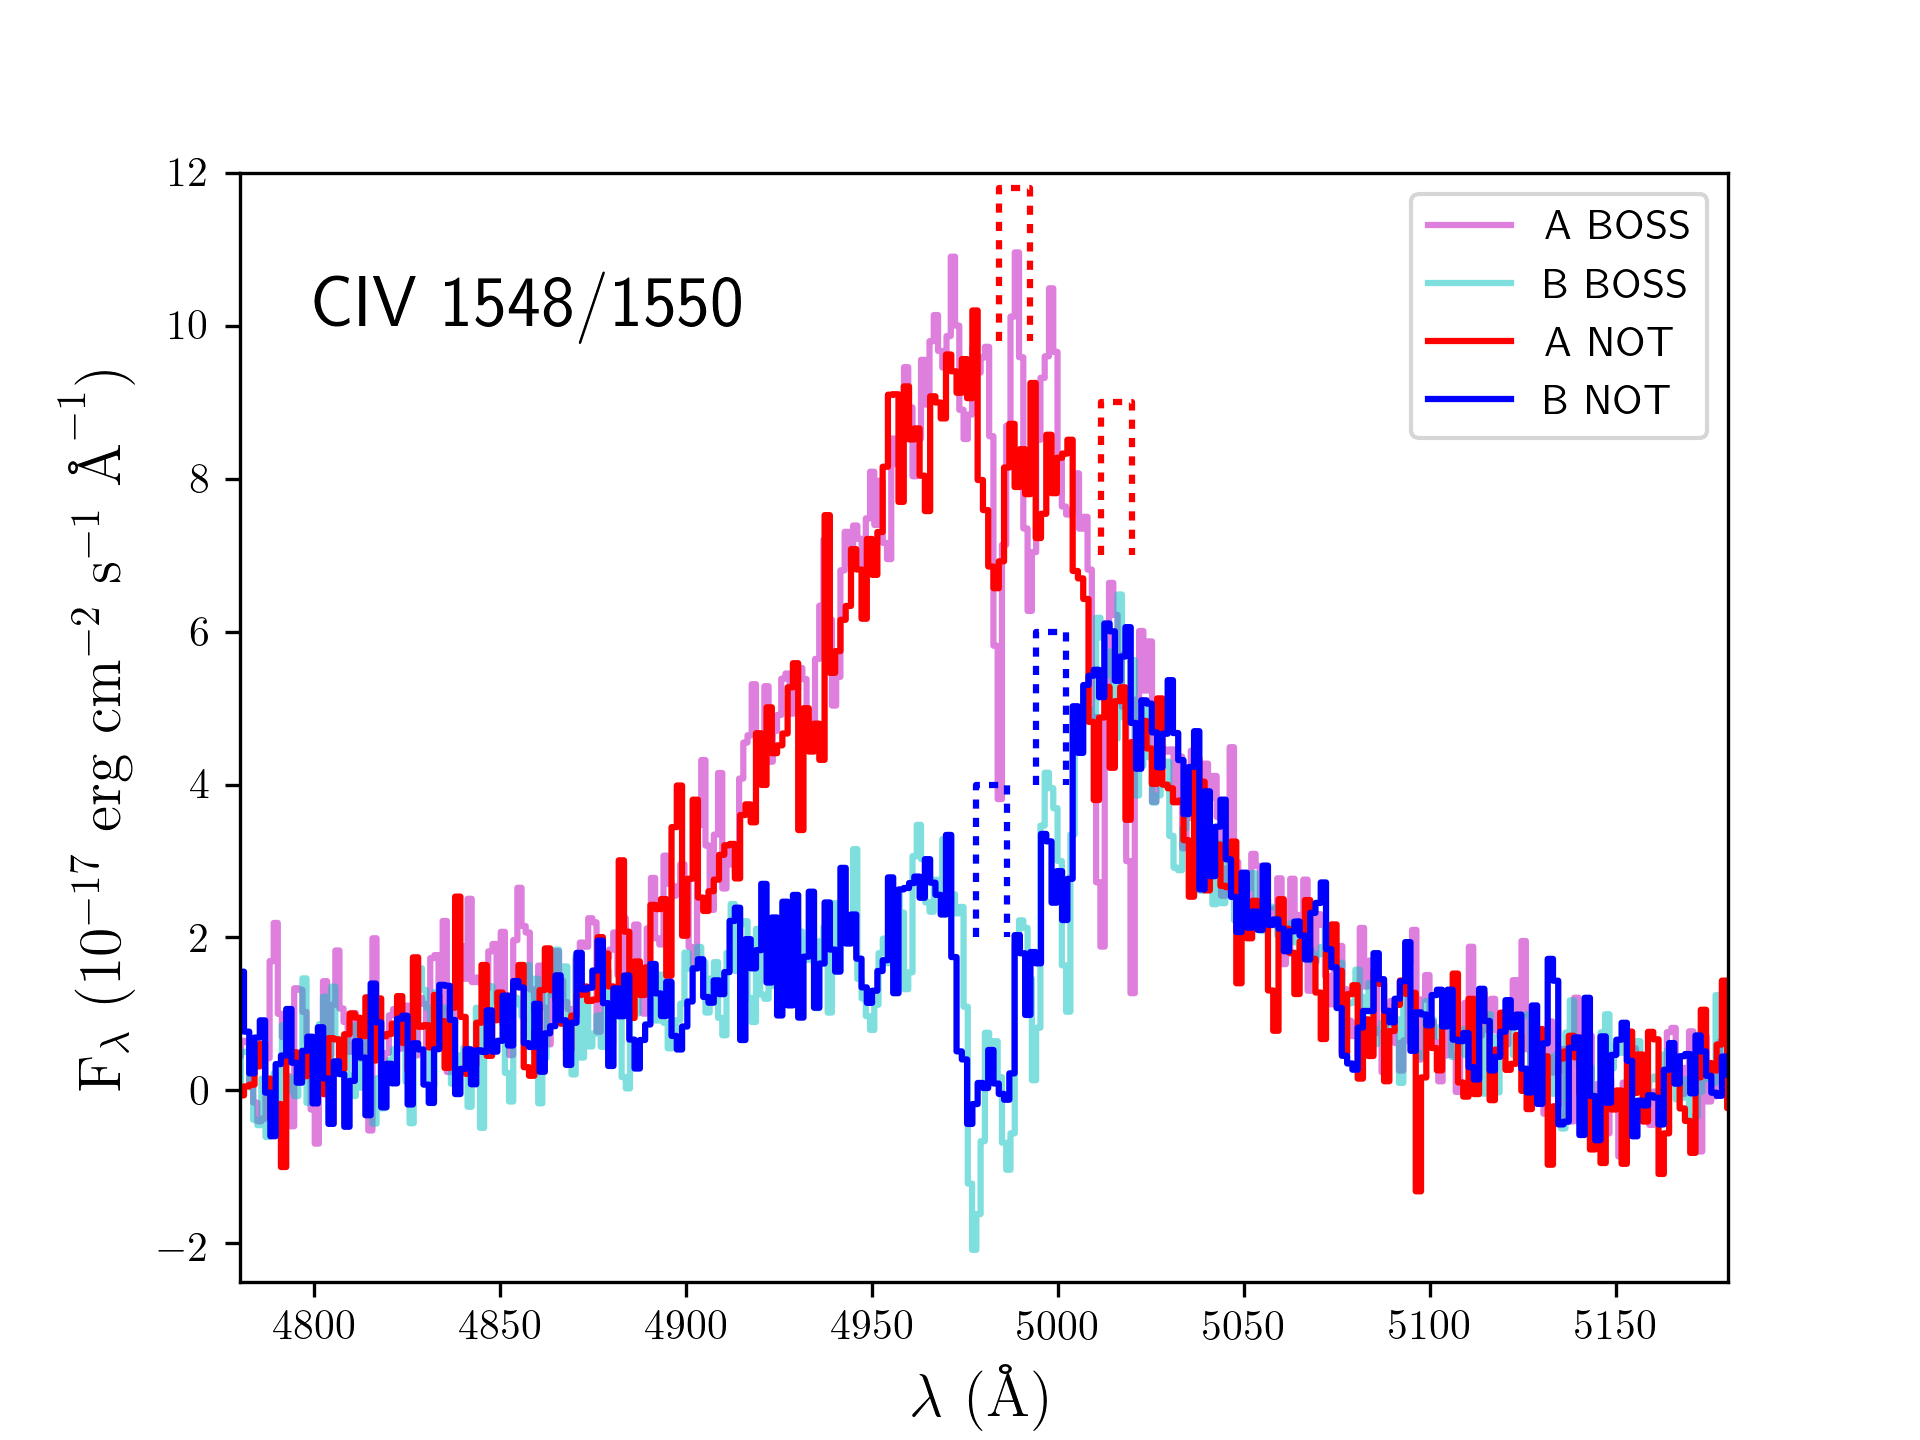
When a C iv absorption system is found in a sightline towards a quasar, there is a high probability to detect C iv absorption within 1000 km s-1 in a close sightline (e.g. Martin et al., 2010). Prochaska et al. (2014) also reported that quasars at 2 are embedded in massive dark matter halos. In addition, quasar sightlines often show C iv absorption, and most absorbers may be associated to massive galaxies that cluster with the quasar hosts. We searched through the SDSS-BOSS spectra for C iv absorbers in the surroundings of the two quasars, detecting several C iv 1548, 1550 absorption doublets. The sightline towards A exhibits absorption at three different redshifts: = 2.2369, = 2.2193 and = 1.6480, whereas the other sightline only shows the presence of highly ionised C iv gas at = 2.2256 and = 2.2153. The four doublets at 2 are illustrated in the bottom panel of Fig. 6. We also found H i Ly absorbers at redshifts similar to those of the C iv systems at 2. Additionally, we identified N v gas linked to A2 and B2.
Considering a systemic redshift (A) = 2.231 (see here above), the absorber A1 is moving towards the quasar at a speed of 550 km s-1. Alternatively, the systemic redshift of A might be slightly underestimated, so and the peculiar velocity difference (between A and B) would be less than 500 km s-1. This clearly favours a close galaxy encounter. It is also reasonable to think that the galaxies harbouring the four intervening systems at 2.215 2.237 are physically associated with each other and with the two quasar host galaxies. Therefore, despite a binary scenario cannot be ruled out from current data, a collision/merger in a high density region is supported by evidence of clustering around SDSS J2153+2732.
4 The pseudo-galaxy SDSS J02400208
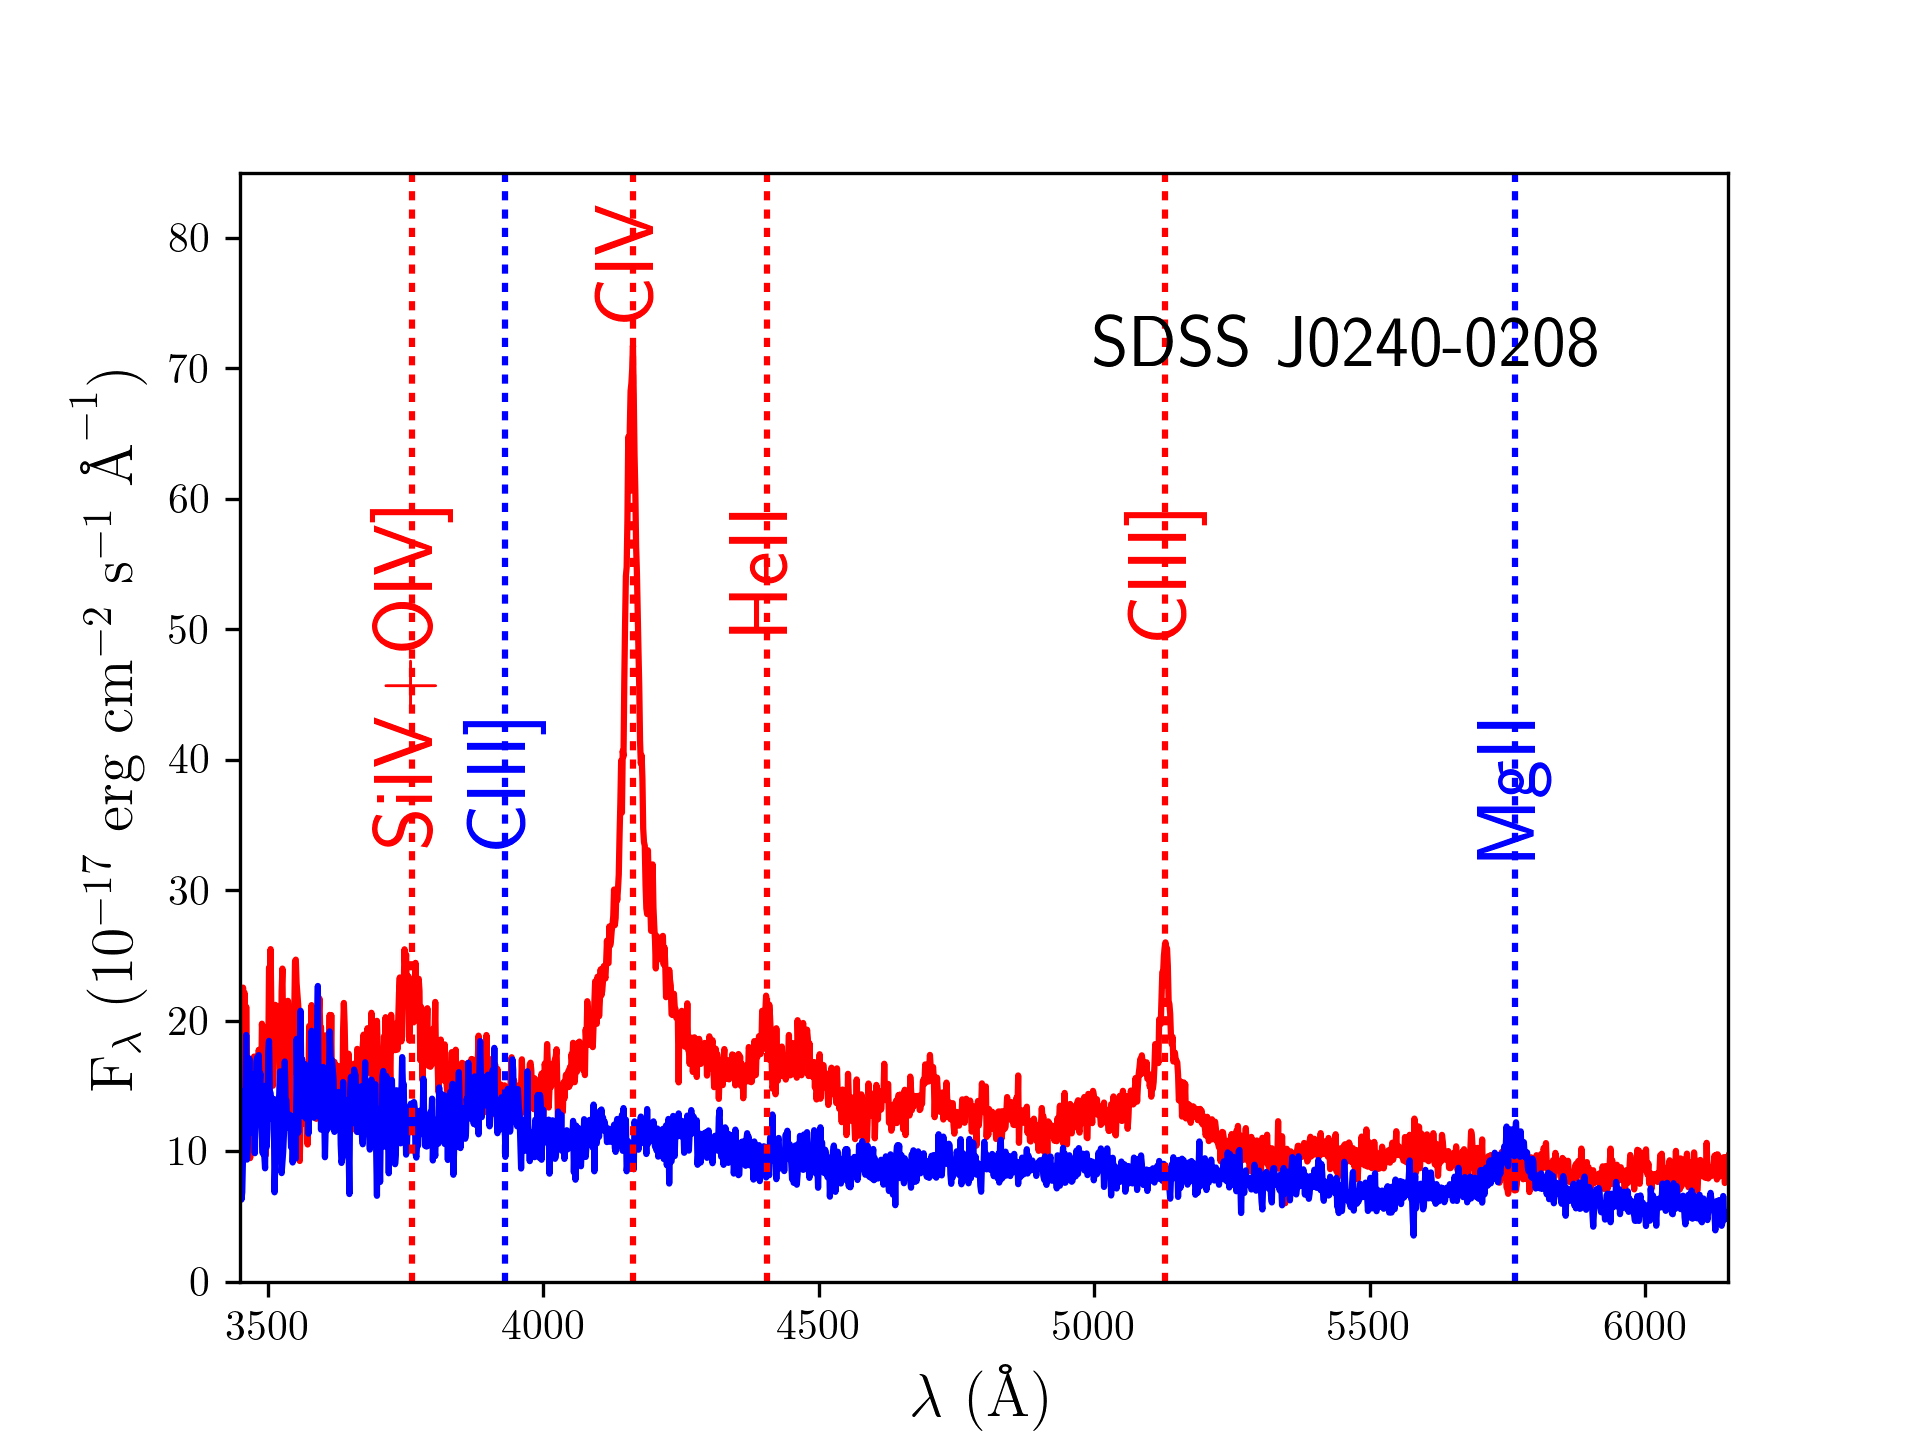
Searching for pairs of point-like sources with small angular separation, we found the system SDSS J02400208 at RA (J2000) = 4007669 and Dec. (J2000) = 214730. This consists of two objects A and B ( 1819) that are separated by 095 (see the bottom right panel of Fig. 1). We performed follow-up spectroscopic observations of SDSS J02400208 on 2015 November 5 under good seeing conditions and using the NOT/ALFOSC 10-width slit. The global exposure of 3000 s covered a sky area including both sources and the 34406150 Å wavelength range (grism #14). From these new data and the spectrum extraction techniques in previous sections, we then obtained the spectral energy distributions of A and B. The pair is misidentified as a galaxy in the SDSS-IV DR14 (Abolfathi et al., 2018), and there are no available spectra in the SDSS database.
The NOT spectra of A and B are listed in Table 5 and shown in Fig. 7. The spectrum of the brighter component A (red line in Fig. 7) contains Si iv/O iv], C iv, He ii and C iii] emissions at = 1.687. However, the spectrum of the fainter component B (blue line in Fig. 7) only includes a clear emission feature at 5765 Å. Such feature is probably produced by Mg ii gas at = 1.059, which would explain the flux enhancement near 3900 Å as due to C iii] emission. The putative redshift of 1.059 was also checked by analysing the continuum of B. This spectral contribution can be easily reproduced by adding the iron forest generated by a quasar at = 1.059 (we used a scaled version of the Fe pseudo-continuum template of Vestergaard & Wilkes, 2001) to a nuclear power-law continuum. Thus, SDSS J02400208 is most likely a projected quasar pair, i.e., a pair of quasars that appear to be very close to each other on the sky but are in fact at a large distance from each other in space.
| (A) | (B) | |
|---|---|---|
| 3438.344 | 21.476 | 10.413 |
| 3439.773 | 20.684 | 9.872 |
| 3441.202 | 18.984 | 9.064 |
| 3442.632 | 15.626 | 12.295 |
| 3444.061 | 15.795 | 9.951 |
| 3445.491 | 15.964 | 7.606 |
| 3446.920 | 24.354 | 11.958 |
| 3448.349 | 20.607 | 13.959 |
To obtain an upper limit on the mass of the host galaxy of B, we followed a procedure identical to the one used in the last paragraph of Sec. 2.2. For SDSS J02400208, = 1.059, = 1.687 and = 038 (/220 km s. Hence, the relationship leads to 2.9 1011 M⊙ ( 250 km s-1) within a radius of 10 kpc. We are dealing with a weak lensing effect and a single image A located 1″ from B. Assuming a characteristic velocity dispersion of 225 km s-1 (e.g. Rusin et al., 2003, and references therein), the background quasar and B would be separated by 06, and A would be magnified by a factor 1.7 (e.g. Narayan & Bartelmann, 1999). This characteristic host galaxy can only produce two images of a = 1.687 quasar when the source lies within 04 of B (strong lensing regime).
5 Summary
The search for new gravitational lensed quasars is a task of great importance in cosmology (e.g. Schneider, Kochanek & Wambsganss, 2006), and thus several data mining methods have been used to select lensed quasar candidates in large databases. As quasars are variable sources, some selection techniques based on variability analyses were proposed over the previous decade (e.g. Pindor, 2005; Kochanek et al., 2006; Lacki et al., 2009), and a number of multiple quasars are being discovered in recent years from methods including variability studies (e.g. Sergeyev et al., 2016; Berghea et al., 2017; Kostrzewa-Rutkowska et al., 2018). In Paper I, we selected three superb candidates for double quasar: SDSS J1442+4055, SDSS J1617+3827 and SDSS J1642+3200. Each of these golden targets consisted of a confirmed quasar, a neighbour point-like source without spectroscopic identification and an extended residual source. Additionally, as expected for double quasars, the two point-like objects showed significant parallel flux variations on a long timescale.
We initially reported the discovery of the optically bright, wide separation double quasar SDSS J1442+4055 (Paper I), and new GTC data indicate that SDSS J1617+3827 is most likely another lensed quasar at = 2.079 (this paper). The GTC spectra of both images of SDSS J1617+3827 exhibit identical emission-line redshifts, and reveal the presence of two intervening objects at redshifts of 0.602 and 0.866, with the nearest being an early-type (secondary) lensing galaxy. Moreover, our GTC acquisition frame unveils the presence of a candidate for the main lensing galaxy, located 04 from the faintest quasar image. In this paper, using new spectroscopic observations with the NOT, we also identify SDSS J1642+3200 as a projected pair of active galactic nuclei. Thus, in comparison with other standard selection techniques that are largely inefficient (e.g. Inada et al., 2012), 66% of our superb candidates turn out to be double quasars. A suitable selection of golden targets leads to an impressive efficiency in discovering multiple quasars, saving large amounts of spectroscopic observing time.
The spectroscopic identification campaign with the NOT has been also proved to be a useful way to find pairs of active galactic nuclei. In addition to SDSS J1642+3200, we report on the projected quasar pair SDSS J02400208, which consists of two distinct quasars at = 1.059 and = 1.687. Using astrometry and spectroscopy (redshifts) of such pairs, as well as a SIS mass model for the foreground host galaxies and a concordance cosmology, we determine the constraint 250255 km s-1 for the one-dimensional velocity dispersion. Therefore, our results are consistent with typical dark matter halos having 225 km s-1 (Rusin et al., 2003). Regarding the third NOT target, SDSS J2153+2732 is a quasar pair inhabiting the central regions of two close galaxies at 2.24. These findings are supported by the new NOT spectra and updated information in the SDSS database. The SDSS-BOSS spectra of both quasars show a series of C iv absorbers at 2 that could be associated with massive galaxies close to the quasar hosts (high density environment; e.g. Prochaska et al., 2014).
Acknowledgements
We thank the anonymous referee for helpful comments that contributed to improving the final version of the paper. This paper is based on observations made with the Gran Telescopio Canarias (Prog. GTC69-17A), the Liverpool Telescope (Prog. XCL04BL2) and the Nordic Optical Telescope (Progs. SST2016-318 and 52-402), operated on the island of La Palma by GRANTECAN S.A., the Liverpool John Moores University (with financial support from the UK Science and Technology Facilities Council) and the Nordic Optical Telescope Scientific Association, respectively, in the Spanish Observatorio del Roque de los Muchachos of the Instituto de Astrofísica de Canarias. We thank the staff of the three telescopes for a kind interaction before, during and after the observations. We also used data taken from the Sloan Digital Sky Survey (SDSS) web sites, and we are grateful to the SDSS collaboration for doing that public database. We gratefully acknowledge to Sh. Ehgamberdiev and to staff of Maidanak Observatory of Astronomical Institute UzAS for supporting our observations at Maidanak Astronomical Observatory. This research has been supported by the Spanish Department of Research, Development and Innovation grant AYA2013-47744-C3-2-P, the GLENDAMA (AYA2017-89815-P) project financed by MINECO/AEI/FEDER-UE, the complementary action "Lentes Gravitatorias y Materia Oscura" financed by the SOciedad para el DEsarrollo Regional de CANtabria (SODERCAN S.A.) and the Operational Programme of FEDER-UE, and the University of Cantabria.
References
- Abolfathi et al. (2018) Abolfathi B. et al., 2018, ApJS, 235, 42
- Ahn et al. (2014) Ahn C. P. et al., 2014, ApJS, 211, 17
- Bennett et al. (2014) Bennett C. L., Larson D., Weiland J. L., Hinshaw G., 2014, ApJ, 794, 135
- Berghea et al. (2017) Berghea C. T., Nelson G. J., Rusu C. E., Keeton C. R., Dudik R. P., 2017, ApJ, 844, 90
- Claeskens et al. (2000) Claeskens J. F., Lee D. W., Remy M., Sluse D., Surdej J., 2000, A&A, 356, 840
- Djorgovski et al. (1987) Djorgovski S., Perley R., Meylan G., McCarthy P., 1987, ApJ, 321, L17
- Eftekharzadeh et al. (2017) Eftekharzadeh S. et al., 2017, MNRAS, 468, 77
- Filippenko (1982) Filippenko A. V., 1982, PASP, 94, 715
- Goicoechea & Shalyapin (2016) Goicoechea L. J., Shalyapin V. N., 2016, A&A, 596, 77
- Hennawi et al. (2006a) Hennawi J. F. et al., 2006a, AJ, 131, 1
- Hennawi et al. (2006b) Hennawi J. F. et al., 2006b, ApJ, 651, 61
- Hogg (1999) Hogg D. W., 1999, eprint arXiv:astro-ph/9905116
- Inada et al. (2012) Inada N. et al., 2012, AJ, 143, 119
- Jackson et al. (2012) Jackson N., Rampadarath H., Ofek E. O., Oguri, M., Shin, M., 2012, MNRAS, 419, 2014
- Kayo & Oguri (2012) Kayo I., Oguri, M., 2012, MNRAS, 424, 1363
- Kochanek et al. (2006) Kochanek C. S., Mochejska B., Morgan N. D., Stanek K. Z., 2006, ApJ, 637, L73
- Kostrzewa-Rutkowska et al. (2018) Kostrzewa-Rutkowska Z. et al., 2018, MNRAS, 476, 663
- Lacki et al. (2009) Lacki B. C., Kochanek C. S., Stanek K. Z., Inada, N., Oguri, M., 2009, ApJ, 698, 428
- Lau et al. (2018) Lau M. W., Prochaska J. X., Hennawi J. F., 2018, ApJ, 857, 126
- Lawther et al. (2012) Lawther D. et al., 2012, A&A, 546, 67
- Martin et al. (2010) Martin C. L. et al., 2010, ApJ, 721, 174
- More et al. (2016) More A. et al., 2016, MNRAS, 456, 1595
- Mortlock et al. (1999) Mortlock D. J., Webster R. L., Francis P. J., 1999, MNRAS, 309, 836
- Narayan & Bartelmann (1999) Narayan R., Bartelmann M., 1999, Lectures on Gravitational Lensing, in Dekel A., Ostriker J.P., eds, Formation of Structure in the Universe. Cambridge University Press, Cambridge (eprint arXiv:astro-ph/9606001)
- Pâris et al. (2014) Pâris I. et al., 2014, A&A, 563, 54
- Peng et al. (2002) Peng C. Y., Ho L. C., Impey C. D., Rix H.-W., 2002, AJ, 124, 266
- Peng et al. (2010) Peng C. Y., Ho L. C., Impey C. D., Rix H.-W., 2010, AJ, 139, 2097
- Pindor (2005) Pindor B., 2005, ApJ, 626, 649
- Porciani et al. (2004) Porciani C., Magliocchetti M., Norberg P., 2004, MNRAS, 355, 1010
- Prochaska et al. (2013) Prochaska J. X. et al., 2013, ApJ, 776, 136
- Prochaska et al. (2014) Prochaska J. X., Lau M. W., Hennawi J. F., 2014, ApJ, 796, 140
- Prochter et al. (2006) Prochter G. E., Prochaska J. X., Burles S. M., 2006, ApJ, 639, 766
- Richards et al. (2002) Richards G. T. et al., 2002, AJ, 124, 1
- Rusin et al. (2003) Rusin D. et al., 2003, ApJ, 587, 143
- Schneider, Kochanek & Wambsganss (2006) Schneider P., Kochanek C. S., Wambsganss J., 2006, in Meylan G., Jetzer P., North P., eds, Proc. 33rd Saas-Fee Advanced Course, Gravitational Lensing: Strong, Weak & Micro. Springer, Berlin
- Sergeyev et al. (2016) Sergeyev A. V., Zheleznyak A. P., Shalyapin V. N., Goicoechea L. J., 2016, MNRAS, 456, 1948
- Seyffert et al. (2013) Seyffert E. N. et al., 2013, ApJ, 779, 161
- Shalyapin & Goicoechea (2014) Shalyapin V. N., Goicoechea L. J., 2014, A&A, 568, 116
- Treu (2010) Treu T., 2010, ARA&A, 48, 87
- Turner (1991) Turner E. L., 1991, AJ, 101, 5
- Vestergaard & Wilkes (2001) Vestergaard M., Wilkes B. J., 2001, ApJS, 134, 1
- Wright (2006) Wright E. L., 2006, PASP, 118, 1711