The 3CR Chandra snapshot survey: extragalactic radio sources with 0.51.0
Abstract
This paper presents the analysis of Chandra X-ray snapshot observations of a subsample of the extragalactic sources listed in the revised Third Cambridge radio catalog (3CR), previously lacking X-ray observations and thus observed during Chandra Cycle 15. This data set extends the current Chandra coverage of the 3CR extragalactic catalog up to redshift =1.0. Our sample includes 22 sources consisting of one compact steep spectrum (CSS) source, three quasars (QSOs), and 18 FR II radio galaxies. As in our previous analyses, here we report the X-ray detections of radio cores and extended structures (i.e., knots, hotspots and lobes) for all sources in the selected sample. We measured their X-ray intensities in three energy ranges: soft (0.5–1 keV), medium (1–2 keV) and hard (2-7 keV) and we also performed standard X-ray spectral analysis for brighter nuclei. All radio nuclei in our sample have an X-ray counterpart. We also discovered X-ray emission associated with the eastern knot of 3CR 154, with radio hotspots in 3CR 41, 3CR 54 and 3CR 225B and with the southern lobe of 3CR 107. Extended X-ray radiation around the nuclei 3CR 293.1 and 3CR 323 on a scale of few tens kpc was also found. X-ray extended emission, potentially arising from the hot gas in the intergalactic medium and/or due to the high energy counterpart of lobes, is detected for 3CR 93, 3CR 154, 3CR 292 and 3CR 323 over a few hundreds kpc-scale. Finally, this work also presents an update on the state-of-the-art of Chandra and XMM-Newton observations for the entire 3CR sample.
Subject headings:
galaxies: active — X-rays: general — radio continuum: galaxies1. Introduction
Since the early 60’s, the ensemble of extragalactic sources listed in the Third Cambridge radio catalog (3C) represents one of the most attractive samples to study the physics of radio-loud active galactic nuclei (AGNs). Originally created using radio observations performed at 159 MHz (Edge et al., 1959), and subsequently at 178 MHz (Bennett, 1962), the 3C catalog went through two main revisions later in the 80’s (see e.g. Laing et al., 1983; Spinrad et al., 1985).
Since then, a vast suite of observations became available from the radio to optical wavelengths thus enriching the multifrequency database necessary to carry out broad band analyses. Radio images with arcsecond resolution for almost all 3CR extragalactic sources are already present in the NRAO Very Large Array (VLA) Archive Survey (NVAS)111http://archive.nrao.edu/nvas/ and in the MERLIN222http://www.jb.man.ac.uk/cgi-bin/merlin_retrieve.pl archives (see e.g., Giovannini et al., 2005). At higher frequencies, Spitzer (see e.g., Werner et al., 2012; Dicken et al., 2014), in particular for high redshift sources (see also Hass et al., 2008; Leipski et al., 2010), and Hubble Space Telescope observations cover more than 90% of the 3CR extragalactic catalog (see e.g. Madrid et al., 2006; Privon et al., 2008; Tremblay et al., 2009; Hilbert et al., 2016). In addition near infrared observations are also available for a significant fraction of the 3CR objects (see e.g. Baldi et al., 2010). Recently, the Herschel Space Observatory also observed several 3CR sources, mostly focusing on the higher redshift ones, (see e.g. Podigachoski et al., 2015; Westhues et al., 2016). Moreover, a dedicated spectroscopic campaign was carried out with the Telescopio Nazionale Galileo to provide a detailed optical classification and to study their nuclear emission (Buttiglione et al., 2009, 2011). All these observations make the extragalactic 3CR catalog an ideal sample to investigate AGN nuclear properties, extended radio structures, such as jet knots, hotspots and lobes, and/or their large-scale environments (see e.g. Ineson et al., 2013; Chiaberge et al., 2015).
However, although most of the 3CR extragalactic radio sources were observed thanks to extensive X-ray campaigns carried out with Chandra, XMM-Newton and Swift (see e.g., Hardcastle et al., 2000; Harvanek et al., 2001; Hardcastle et al., 2006; Evans et al., 2006; Balmaverde et al., 2012; Wilkes et al., 2013; Maselli et al., 2016, and references therein), until Cycle 9 the Chandra archive covered only up to 60% of the 3CR extragalactic sample (see e.g. Massaro et al., 2015, for a recent review), while the others, such as XMM-Newton, covered less than 1/3 of the entire catalog. Thus we started our Chandra snapshot survey to ensure that all 3CR extragalactic sources have at least an exploratory X-ray observation, with an angular resolution similar to those at lower energies, available to the astronomical community. Adopting a step-wise strategy, we requested observations in narrow redshift, , ranges resulting in modest proposals each cycle to minimize the impact on the Chandra schedule. To date all the 3CR sources with 1 have at least a snapshot observation (i.e., less than 20ksec total exposure time) available in the Chandra archive (Massaro et al., 2010, 2012, 2013) and several of them inspired follow up X-ray observations on interesting objects (see e.g., Hardcastle et al., 2010, 2012; Dasadia et al., 2016, to name a few examples).
Here, we present the analysis of the Chandra snapshot observations approved during Cycle 15 including all 3CR radio sources lying between =0.5 and =1 that were previously unobserved by Chandra.
The paper is organized as follows. The update of the ongoing Chandra campaign of the 3CR sources is described in § 2 together with some details on the current sample. A brief overview of the data reduction procedures are given in § 3 while results are described in § 4. Then, in § 5 we present our summary and conclusions. Finally, in the Appendix, we show X-ray images with radio contours overlaid for all the sources in the current sample (§ A) together with the updated summary of the Chandra observations for the entire of 3CR extragalactic catalog (§ B).
Unless otherwise stated we adopt cgs units for numerical results and we also assume a flat cosmology with km s-1 Mpc-1, and (Bennett et al., 2014). Spectral indices, , are defined by flux density, S.
2. State-of-the-art of the 3CR extragalactic Chandra snapshot survey
The revised 3C extragalactic catalog includes 298 sources (Spinrad et al., 1985). We have already analyzed and published all the data collected to date for the Chandra observations carried out in Cycles 9, 12 and 13 for a total of 75 sources (Massaro et al., 2010, 2012, 2013) and an additional 140 objects, listed in the Chandra archive, were also presented adopting the same data reduction procedures (Massaro et al., 2011, 2015). Several subsets of the 3CR sample have been also observed by other groups (e.g., Wilkes et al., 2013; Kuraszkiewicz et al., 2017). Table 1 summarizes the references for the Chandra observations of the 3CR extragalactic sources already analyzed and published as part of this compilation.
In our previous archival analyses we excluded 7 sources, namely 3CR 66A (e.g., Abdo et al., 2011), 3CR 71 (alias NGC 1068; e.g., Brinkman et al., 2002), 3CR 84 (alias NGC1275 or Perseus A; e.g., Fabian et al., 2003), 3CR 186 (Siemiginowska et al., 2010), 3CR 231 (alias M82; e.g., Griffiths et al., 2000), 3CR 317 (alias Abell 2052; e.g., Blanton et al., 2009) and 3CR 348 (alias Hercules A; e.g., Nulsen et al., 2005), since each of these source has accumulated an exposure time of greater than 80 ks, and has been discussed extensively in the literature. In addition, we also did not re-analyze: 3CR 236, 3CR 326, 3CR 386 since the PI of these observations is currently carrying out the analysis (M. Birkinshaw, priv. comm.).
The Chandra archive now includes all the 3CR extragalactic sources up to =0.5 (i.e., 150 sources), with the only exceptions being those objects for which spectroscopic observations, performed after the last revision (Spinrad et al., 1985), reported different redshift estimates, namely: 3CR 27, at =0.184, 3CR 69 at =0.458 (Hiltner & Roeser, 1991) and 3CR 93 at =0.357, as confirmed by Ho & MinJin (2009). The present analysis extends the Chandra database up to =1.0 including 22 more targets. During these Cycle 15 3CR snapshot observations, we also observed 3CR 142.1 and 3CR 277 for which the redshift reported in the literature (Hewitt & Burbidge, 1991) updates the earlier estimates from Spinrad et al. (1985). These two sources, together with 3CR 93, belong to the sample of 22 targets analyzed in the present work. Chandra snapshot observations of 3CR 27 and 3CR 69 were proposed and obtained in subsequent observing cycles (Stuardi et al. 2017 in prep.).
Twenty-five of the 298 3CR extragalactic sources are still unidentified, lacking an optical counterpart and/or an optical spectroscopic observation necessary to unveil their nature. We recently observed 21 of these 25 targets with Swift snapshot observations discovering X-ray counterparts for eleven of them, but even using optical data available thanks to the instruments on board of the Swift satellite, we could not discern and/or confirm their extragalactic nature (see Maselli et al., 2016, for all details).
A summary table on the state-of-the-art of the Chandra observations for all the 3CR extragalactic sources, including detections of extended components: jet knots, hotspots, lobes and X-ray emission from the hot intergalactic medium present in galaxy groups/clusters, is reported in Appendix § B.
| Program | Cycle | Proposal Number | Number of sources | Redshift range | Reference |
|---|---|---|---|---|---|
| 3CR snapshot survey | 9 | 09700745 | 30∗ | 0.3 | Massaro et al. (2010) |
| XJET+ | — | — | 47 | — | Massaro et al. (2011) |
| 3CR snapshot survey | 12 | 12700211 | 26 | 0.3 | Massaro et al. (2012) |
| 3CR snapshot survey | 13 | 13700190 | 19 | 0.30.5 | Massaro et al. (2013) |
| Archival project+ | — | — | 93 | — | Massaro et al. (2015) |
| 3CR snapshot survey | 15 | 15700111 | 22∘ | 0.51.0 | This work |
∗ The AO9 sample includes 3CR 346 that was re-observed in Cycle
12 because during Cycle 9 its Chandra observation was affected by high
background
(see Massaro et al., 2010, for details).
+ The redshift ranges for both the archival and the XJET samples are
unbounded w.r.t. selection
(see also http://hea-www.cfa.harvard.edu/XJET/ for more details on the database).
∘ The field of view of the 3C 255B Chandra observation also covers the region where 3C 255A lies but no X-ray counterpart for its nucleus is detected.
3. Data reduction and data analysis
Data reduction and analysis procedures adopted for all the Chandra observations presented here were extensively described in our previous papers, thus only a brief overview is reported in the following. We adopted the same procedures since our final aim is to create a uniform database for the entire 3CR extragalactic survey once all the sources listed therein will be observed by Chandra.
We followed the standard procedure described in the Chandra Interactive Analysis of Observations (CIAO) threads333http://cxc.harvard.edu/ciao/guides/index.html, to perform our data reduction and we used CIAO v4.7 with the Chandra Calibration Database (CALDB) version 4.6.2.
3.1. X-ray photometry
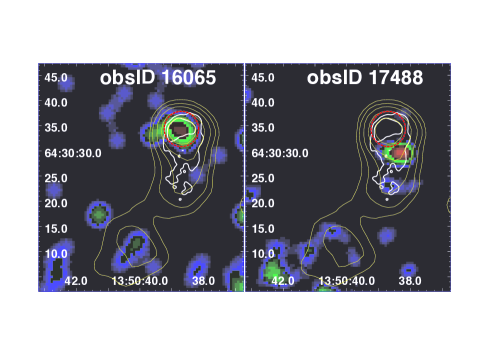
We initially generated level 2 event files using the task and filtering for grades 0,2,3,4,6. We checked the absence of high background intervals inspecting lightcurves extracted for each data set, but this never occurred. We aligned the X-ray position of each core with that of the radio to perform the astrometric registration (see e.g., Massaro et al., 2011, for details). The source 3CR 292 has been observed twice with Chandra, obsID 16065 and obsID 17488, with exposure times of 4ksec and 8ksec, respectively. In this case a merged event file was created using the CIAO routine reproject_obs, thus reprojecting event files to the reference coordinates of the deeper observation (i.e., obsID 17488).
Then we created flux maps in the X-ray energy ranges: 0.5 – 1 keV (soft), 1 – 2 keV (medium), 2 – 7 keV (hard), taking into account exposure time and effective area. In our procedure, as previously done, we used monochromatic exposure maps set to the nominal energies of 0.75, 1.4, and 4 keV for the soft, medium and hard band, respectively. All flux maps were converted from units of counts/sec/cm2 to cgs units by multiplying each event by the nominal energy of each band. However, we made the necessary correction to recover the observed erg/cm2/s, when performing X-ray photometry (see e.g., Massaro et al. 2009b, ; Massaro et al. 2009a, , for details).
We measured observed fluxes for all the X-ray detected nuclei and extended components. This was done choosing a region of size and shape appropriate to the observed X-ray emission and matching the radio structure. We also chose two background regions, having the same shape and size so as to avoid X-ray emission from other parts of the source. The flux for each energy band and region was measured using funtools444http://www.cfa.harvard.edu/john/funtools as in our previous analyses. Uncertainties are computed assuming Poisson statistics (i.e., square root of the number-of-counts) in the source and background regions. X-ray fluxes, not corrected for the Galactic absorption, measured for the cores are reported in Table 3 while those for detected jet knots, hotspots and lobes are given in Table 5. The name of each component (e.g., knot or hotspot) is a combination of one letter indicating the orientation of the radio structure and one number indicating distance from the core in arcseconds.
Since the Chandra native pixel size for the ACIS instrument is 0″.492, the data are undersampled, thus to recover the resolution we regridded our images to 1/2, 1/4, or 1/8 of the native ACIS pixel size. This was dictated by the angular size of each radio source and by the number of counts in each source components. For sources of large angular extent 1/2 or no regridding was adopted (see also Massaro et al., 2012, 2013, for more details).
Finally, we performed a comparison between radio and X-ray images at similar angular resolution to verify if extended structures in radio sources, such as jet knots, hotspots and lobes, have an X-ray counterpart. To achieve this goal, we used radio images retrieved from publicly available websites as that of the National Radio Astronomy Observatory VLA Archive Survey (NVAS) 555http://archive.nrao.edu/nvas/, NASA Extragalactic Database (NED) 666http://ned.ipac.caltech.edu/, the (DRAGN)777http://www.jb.man.ac.uk/atlas/ website as well as personal websites of our colleagues888http://3crr.extragalactic.info999http://www.slac.stanford.edu/ teddy/vla3cr/vla3cr.html. Image parameters for each radio observation used are given in the figure captions of § A.
3.2. X-ray spectral analysis
We performed spectral analysis for the X-ray counterparts of radio cores of those sources having more than 400 counts, to determine their X-ray spectral indices , the presence or absence of significant intrinsic absorption, and the role played by mild pileup in artificially hardening the spectrum.
The spectral data were extracted from a 2″ aperture, as for photometric measurements, using the CIAO routine specextract, thereby automating the creation of count-weighted response matrices. Background spectra were extracted in nearby circular regions of radius 10″ not containing obvious sources. The source spectra were then filtered in energy between 0.5-7 keV and binned to allow a minimum number of 30 counts per bin to ensure the use of the Gaussian statistic. We used the Sherpa101010http://cxc.harvard.edu/sherpa modeling and fitting package to fit our spectra. For each source we adopted two models: (1) a redshifted power-law with Galactic and intrinsic photoelectric absorption components, and (2) the same model with an additional pileup component using the jdpileup Chandra CCD pileup model developed by Davis (2001).
Prior to fitting, the Galactic hydrogen column density and the source redshift were fixed at the measured values for each source. When considering the first (1) fitting model, the two main variable parameters - namely the intrinsic absorption (NH(z)) and X-ray photon index - were allowed to vary in a first pass fit, but subsequently stepped through a range of possible physical values to explore the parameter space, determine 68% confidence intervals, and quantify the degree to which and are degenerate.
We have also explored the possible effect of pileup on our sources adding a jdpileup111111http://cxc.harvard.edu/sherpa/ahelp/jdpileup.html component to our baseline model (2). We left the parameters of the jdpileup model fixed to their default values, with the exception of alpha (the probability of a good grade when two photons pile together) and f (the fraction of flux falling into the pileup region). In no case were we able to constrain the value of alpha since it was usually degenerate with f and/or the intrinsic absorption, so we decided to freeze it to its default value of 1. The value of f was left free to vary between 0.85 and 1, and was constrained in two cases. The results of spectral fitting are given in Table 4.
4. Results
4.1. General
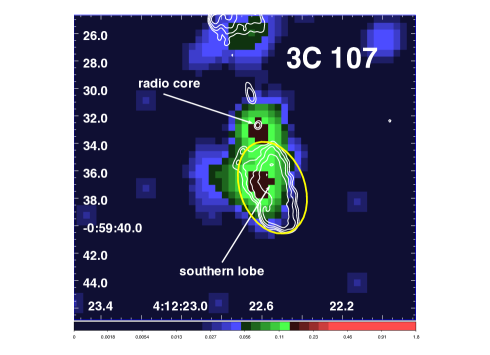
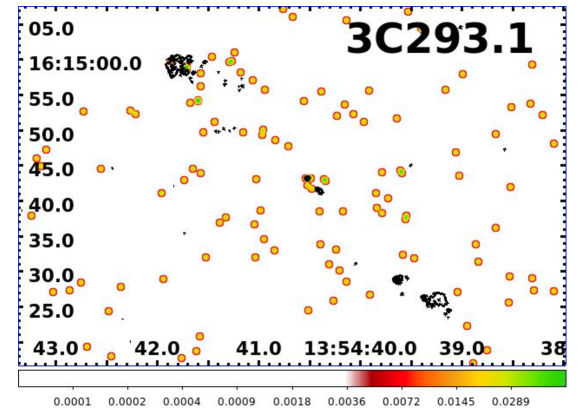
We detected the X-ray counterpart of all radio cores in our sample and we measured their fluxes adopting a circular region of 2 centered on the radio position used for the astrometric registration. All the results of our X-ray photometry, i.e., nuclear X-ray fluxes in the three different bands (see § 3) together with their X-ray luminosities, are reported in Table 3 while X-ray images for the whole selected sample are presented in § A. In Table 3, we also report the values of the ’extended emission’ parameter, computed as the ratio of the total number of counts in a circular region of radius r = 2″ circle to that of a circle of radius r = 10″ both centered on the radio position of each 3CR source (i.e., Ext. Ratio “Extent Ratio”). This ratio is close to unity for unresolved (i.e., point-like) sources since the on-axis encircled energy for 2″ is 0.97, and only a small increase is expected up to 10″. Thus parameter values significantly less than 0.9 indicate the presence of extended emission around the nuclear component (e.g., Massaro et al., 2010, 2013). In our sample this situation clearly occurs for 3CR 107, 3CR 293.1 and 3CR 323.
Four of the 22 sources./, namely: 3CR 93, 3CR 114, 3CR 154 and 3CR 288.1, show X-ray nuclei with more than 400 counts within a circular region of 2″ radius. Thus, according to our previous works, we performed a basic X-ray spectral analysis for them. Their spectra are consistent with a mildly absorbed power-law with the absorption consistent with the Galactic value (Kalberla et al., 2005). 3CR 93 and 3CR 154 show a fraction of pileup of 10%, however their fits do not improve significantly when including a jdpileup spectral component 121212http://cxc.harvard.edu/sherpa/ahelp/jdpileup.html. Results of the spectral analysis are reported in Table 4, the statistical uncertainties quoted refer to the 68% confidence level.
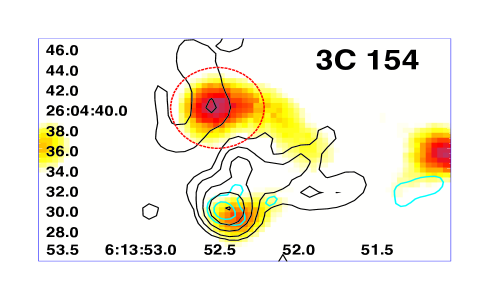
We also discovered X-ray emission associated with three hotspots in three different sources; their X-ray fluxes are reported in Table 5 together with detection significances, all above 3, computed assuming a Poisson distribution for the background. The X-ray counterpart of a radio knot in the 3CR 154 eastern lobe as well as that of the whole southern radio lobe of 3CR 107 was also found (see Table 5 for details).
Three of 22 3CR sources in our sample lie within optically known galaxy cluster, namely: 3CR 34, 3CR 44 and 3CR 247 (Spinrad et al., 1985) and to search for possible X-ray emission due to the hot gas permeating the intergalactic medium around the radio structure, we adopted the following procedure for all our targets. We measured the total number of counts in a circular region with diameter equal to the total extent of the radio source and we subtracted those counts within circular regions of 2″ corresponding to the radio nucleus and/or to background sources lying within the larger circle. Then assuming a Poisson distribution for the background events, we computed the probability of obtaining the measured value given the expected number of counts in the background.
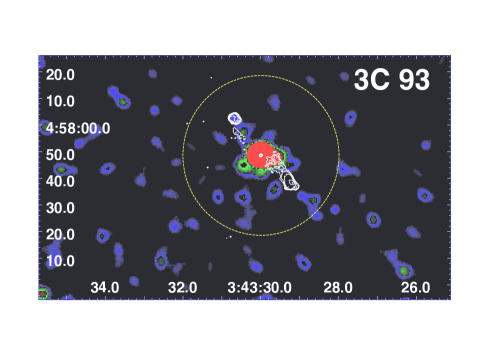
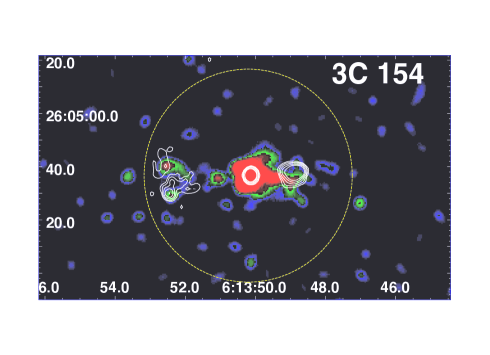
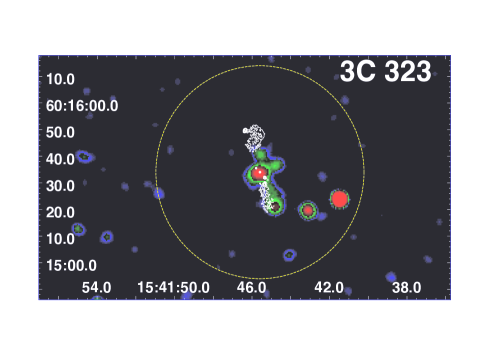
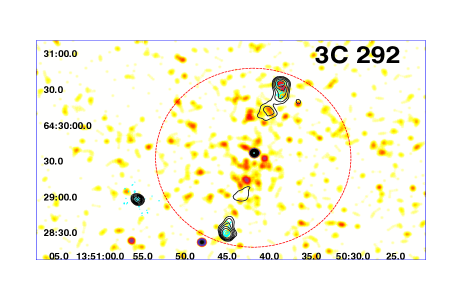
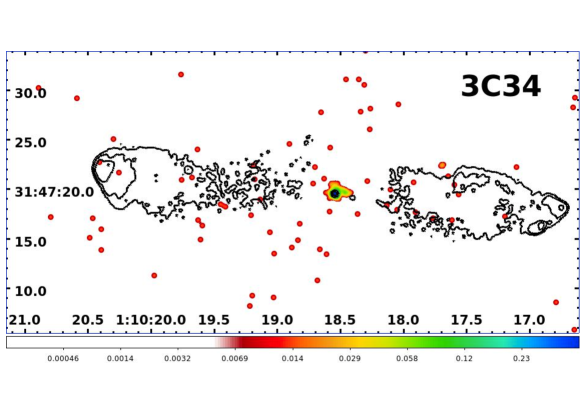
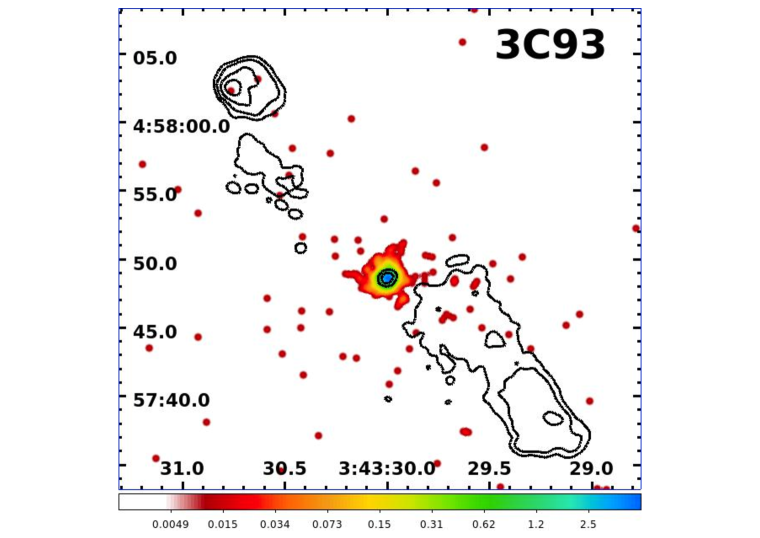
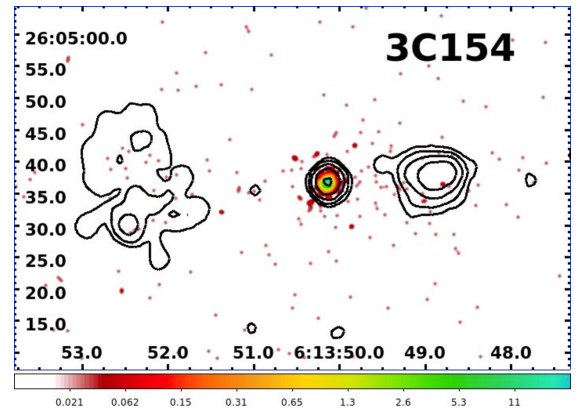
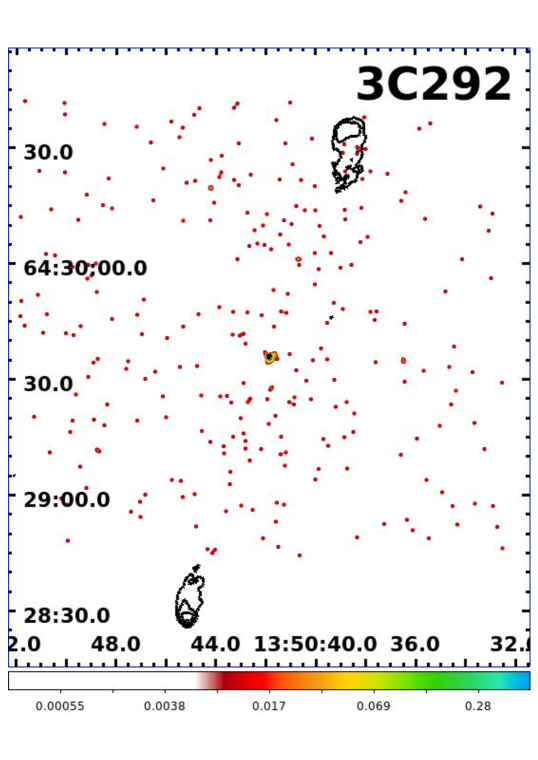
We detected an excess of X-ray photons, above 3 significance, around the radio structures of 3CR 93, 3CR 154 and 3CR 323, on a scale of few hundreds kpc as shown in Fig. 1. Such X-ray extended emission could be due to the presence of hot gas filling their large-scale X-ray environment (see Fig. 1) but it could also be contaminated by the radiation arising from the lobes of these FR II radio galaxies which would be aligned with their large-scale radio structure. These scenarios are indistinguishable due to the low number of counts available, however we tend to favor the former (i.e. presence of hot gas in the intergalactic medium) since the peaks of the X-ray surface brightness do not appear coincident with those of the radio intensity (i.e., hotspots in the lobes). We also found a marginal detection (i.e. 2 significance) of X-ray emission from the group/cluster around 3CR 34 (see also Fig. 1). For this source we do not claim that the extended X-ray emission could be associated with the radio lobes because it lies in a galaxy-rich large scale environment (McCarthy et al., 1995). Then we discovered extended X-ray emission also for 3CR 292 on a hundreds of kpc scale (see Fig. 2) above 3 significance. Here an excess of X-ray photons is also found associated with the northern hotspot/lobe but it is consistent with a 3 fluctuation of the X-ray diffuse background (more details are given in the following section). A specific analysis to search for galaxy groups or cluster signatures surrounding the 3CR sources observed during the Chandra snapshot survey is out of the scope of the paper and it will be presented in a forthcoming work.

Finally, we remark that X-ray images with radio contours overlaid for all the sources in the current sample are shown in the Appendix (§ A).
4.2. Source details
3CR 34. This is an FR II radio galaxy at =0.69 and optically classified as a high-excitation line radio galaxy (HERG; Mullin et al., 2006). It lies near the center of a compact cluster of galaxies (McCarthy et al., 1995) appearing as one of the reddest members and being surrounded by fainter companions. There is a double hotspot in the western lobe. Best et al. (1997) reported the detection of a strong jet-cloud interaction at 120 kpc distance from the core and HST images also show a narrow region of blue emission orientated along the radio axis and directed towards a radio hotspot. In the Chandra observation analyzed here we only detected the X-ray core. We tested the presence of diffuse X-ray emission due to the intergalactic medium of the known galaxy cluster where 3C 34 lies according to the procedure previously described. We found an X-ray excess of about 3 significance (see Fig. 1) where the number of counts in an annular region of radii 2″and 30″, centered on the radio core position, is 90, compared with 45.7 expected background counts in that region. We also estimated the luminosity of the X-ray extended emission, , adopting an annular region of inner radius 2″and outer radius 30″, centered on the position of the 3CR 34 radio nucleus, to exclude the nuclear contribution of the central radio galaxy. Our estimate is (5.22.2)1043erg/s. We note that this estimate, as in the following cases of 3CR 93, 3CR 154, 3CR 292 and 3CR 323, is an upper limit on the X-ray luminosity of the hot gas in the intergalactic medium since there could be a possible contamination due to the lobe X-ray emission.
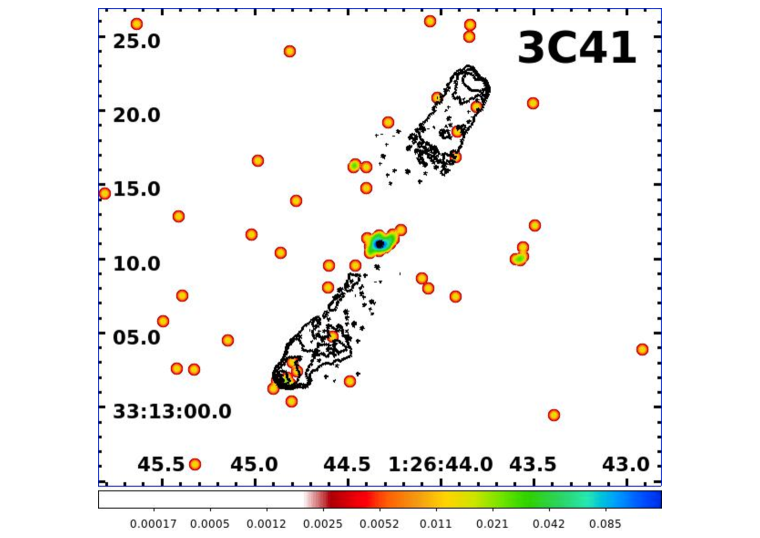
3CR 41. This is an FR II radio galaxy with 0.79, classified as a narrow emission line radio galaxy. In the radio image at 8.45 GHz there is no detection of a jet in the northern lobe while extended radio emission associated with the jet pointing towards the south-eastern hotspot is detected (Mullin et al., 2008, see e.g.). Both radio lobes are also visible even at 8.45 GHz. At higher energies, in our Chandra snapshot observations, the southern hotspot is detected as well as the core of the radio galaxy.
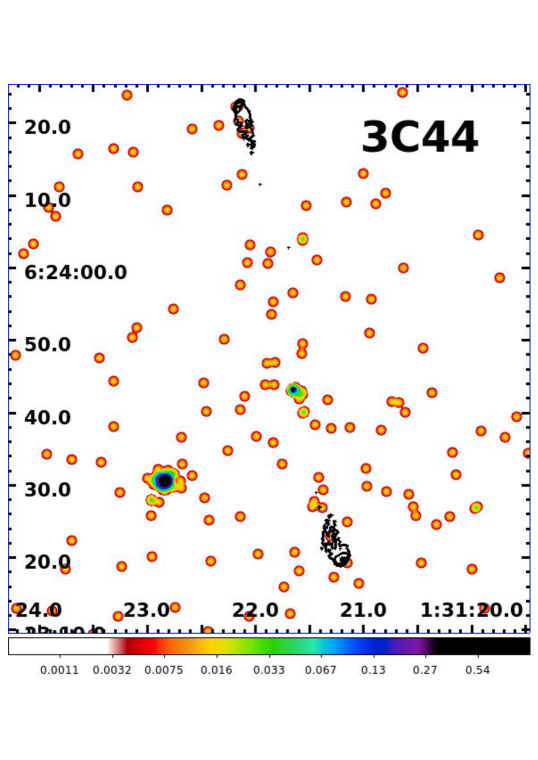
3CR 44. This quasar, with a radio morphology similar to that of an FR II radio galaxy, is at =0.66 being associated with a galaxy cluster visible in the optical image(O’Dea et al., 2009). Kharb et al. (2008) reported a hint of a jet-like structure extending towards the southern hotspot in the 5GHz radio map while the HST image shows this radio galaxy to be either composed of two structures oriented north-south or, more likely, bisected by a dust lane running east-west (McCarthy et al., 1997). We clearly detected the nuclear emission in the X-rays and we also found an excess of X-ray counts associated with the northern lobe but at 3 significance.
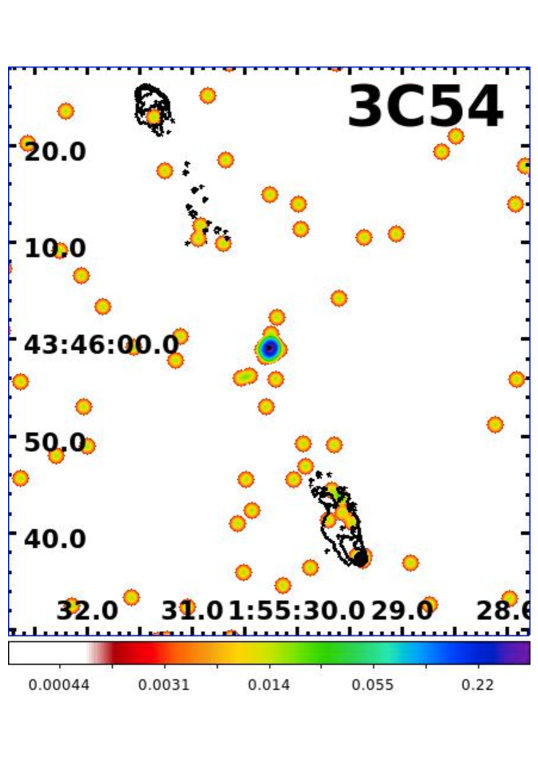
3CR 54. This is an FR II radio galaxy at redshift =0.8274. The lobe morphology on the southern side of the source is more extended than the northern one (Kharb et al., 2008). In the HST image, the galaxy has close companions and the source appears extended towards the southwest side but it is unclear if it is a bridge, a tidal tail, or a jet feature (McCarthy et al., 1997). In the X-ray image the radio core is clearly detected together with the southern hotspot.
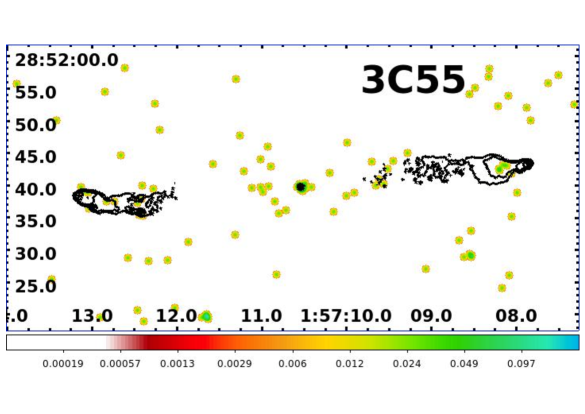
3CR 55. This is an FR II radio galaxy at =0.735 and optically classified as a narrow emission line radio galaxy. The radio core is detected in the X-rays while the two hotspots are not.
3CR 93. This is a =0.358 quasar with a lobe-dominated radio morphology (see e.g. Bogers et al., 1994). In the optical image, available in the HST archive, 3CR 93 has a host galaxy with 3″ diameter (Lehnert et al., 1999). In the X-ray image the core is clearly detected with more than 1000 counts but there is no detection of hotspots. X-ray spectral analysis of the nuclear emission shows a power law spectrum with absorption consistent with the Galactic column density. Significant extended X-ray emission on hundreds of kpc scale was found around 3CR 93 with a significance above 3 (see Fig. 1). The number of counts in an annular region of radii 2″and 30″, centered on the radio core position, is 114 while those expected for the same region in the background is 45.4. The X-ray luminosity of the extended emission, , estimated adopting an annular region of inner radius 2″and outer radius 30″, centered on the location of 3CR 93, as previously done for 3CR 34, is (2.30.5)1043erg/s.
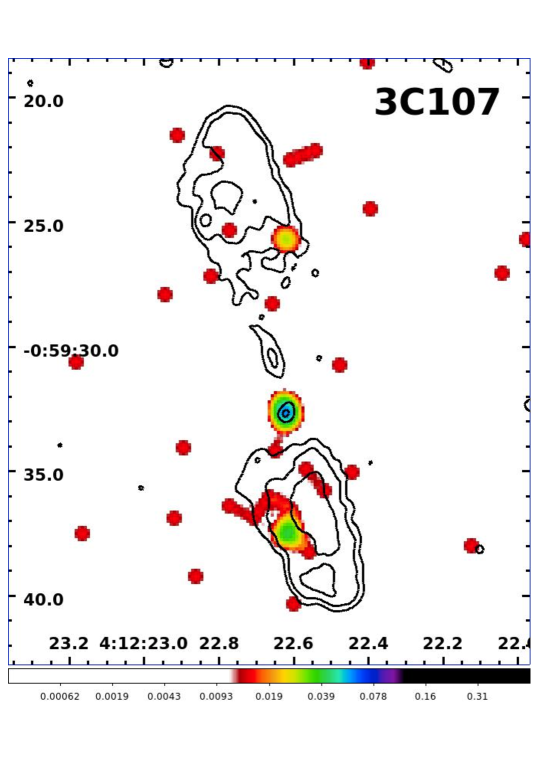
3CR 107. This FR II - HERG radio galaxy lies at =0.785 (McCarthy et al., 1997). In our Chandra snapshot observation we clearly detected the nuclear emission as well as X-ray extended emission associated with the southern lobe (see Fig. 3 and Table 5), as also indicated by the low value of the “ext ratio” in Table 3.
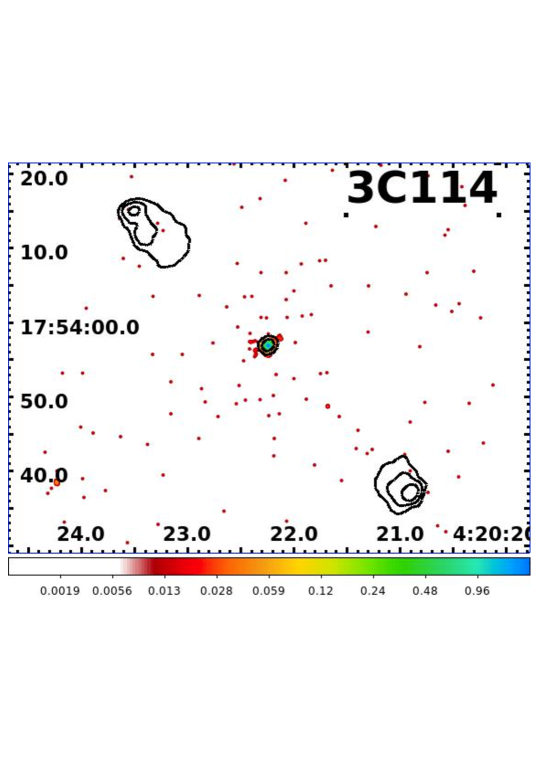
3CR 114. This FR II radio galaxy is at =0.815 showing fairly weak emission lines in its optical spectrum that led to a LERG classification (Strom et al., 1990). A faint compact nucleus with several clumps within the few arcseconds is observed at radio frequencies and a jet-like feature appears on the northern side in the 1.4GHz image (Kharb et al., 2008) while single hotspots are detected both in the southern and in the northern lobes. Storm et al. (1990) claimed that this radio galaxy could lie in the core of a rich, distant cluster with some signatures of a merger on the basis of their optical observations. In the X-ray image the nucleus is detected but there is no evidence of hotspots and no signatures of X-ray emission from intracluster medium was found.
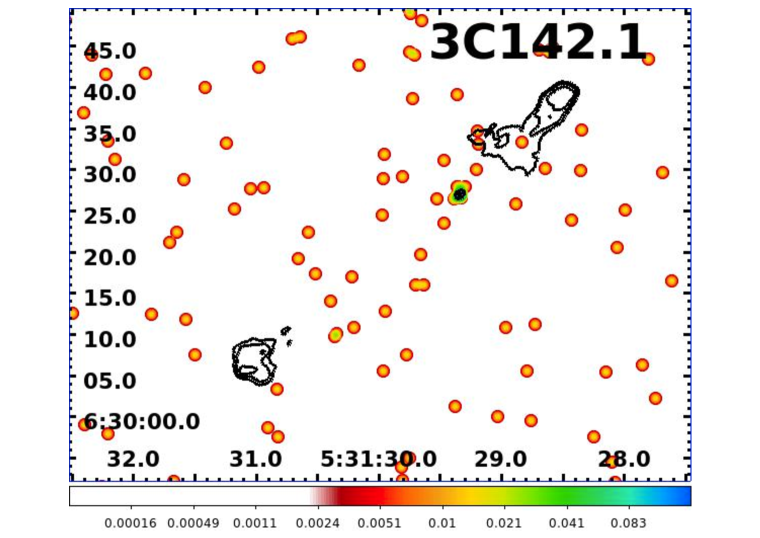
3CR 142.1. This double radio source (i.e., FR II morphology) at 0.4061. In the radio there are two clear extended radio lobes with a radio bridge showing a constant spectral index Kharb et al. (2008); O’Dea et al. (2009). In the X-ray image only the radio nucleus is detected.
3CR 154. This is a nearby lobe-dominated quasar (Bogers et al., 1994) at =0.58 (Sokolovsky et al., 2011) appearing as a point-like source in the HST optical image. In the Chandra snapshot observation only the relatively bright radio core is detected, for which X-ray spectral analysis was performed. As in 3CR 34 and 3CR 93, 3CR 154 shows extended X-ray emission on kpc scale detected above 5 level of confidence, measured adopting the same method previously described (see Fig. 1). We measured 243 X-ray photons in a annular region of radii 2″and 40″, centered on the location of the radio core, while 70.1 are expected in the background region. This X-ray extended emission has a luminosity (2.20.3)1044erg/s, measured using an annular region of inner radius 2″and outer radius 40″, centered on the location of radio nucleus of 3CR 154. In the eastern lobe we found an association between the peak of the radio and the X-ray intensities for a radio knot lying at 33″ from the nucleus (see marked region in Fig. 4). Given this spatial coincidence, this excess of X-ray photons is probably due to the high energy counterpart of the radio extended structure. On the other hand, the southern knot in the same eastern lobe does not show a correspondence between the radio and the X-ray emissions (1.5″ offset), indicating that this high energy emission could be linked to the hot gas in the intergalactic medium.
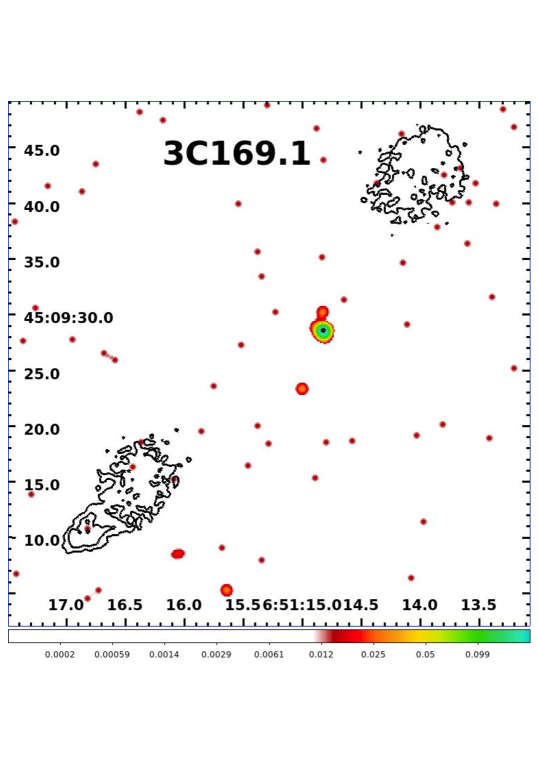
3CR 169.1. This classical FR II radio galaxy is at =0.633. There is no detection of the jet and/or of the hotspots in the radio map at 8 GHz Kharb et al. (2008). Harvanek et al. (1998) classified this source as a narrow emission line radio galaxy according to its optical spectrum. In the X-ray snapshot image the nucleus is detected but there is no detection of the extended radio structure.
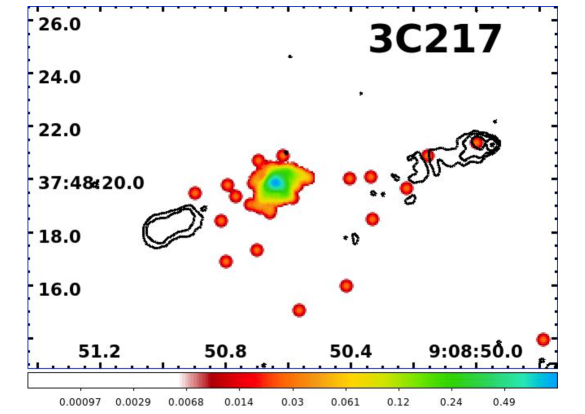
3CR 217. This is a FR II radio galaxy with narrow emission lines at =0.898. In the radio image at 8 GHz there are no jet signatures, in either the eastern or the western lobe (Mullin et al., 2008) and only the western lobe is detected. In the X-ray band the radio core is detected but the Chandra image is not registered because we were not able to locate precisely its position. Only a single photon is associated with the western hotspot being undetected in the X-rays.
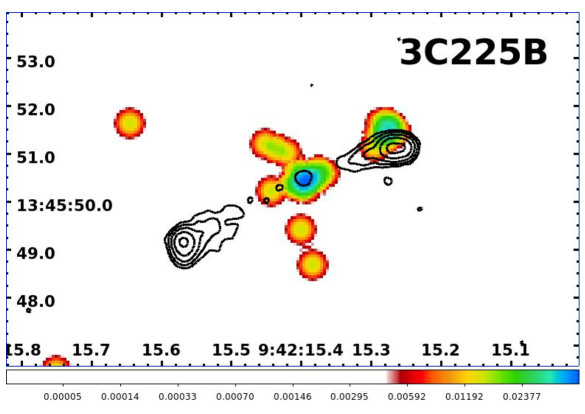
3CR 225B. This is a FR II radio galaxy at =0.582, optically classified as a narrow emission line galaxy. It does show only hotspots within its radio lobes Mullin et al. (2008). In the X-ray there is a hint of diffuse emission near the nucleus but no detection for the two hotspots. We note that the nearby radio source 3CR 225A is also in the field of view of the Chandra snapshot observation on a nearby CCD, but we did not detect any signature of X-ray emission arising from this radio object.
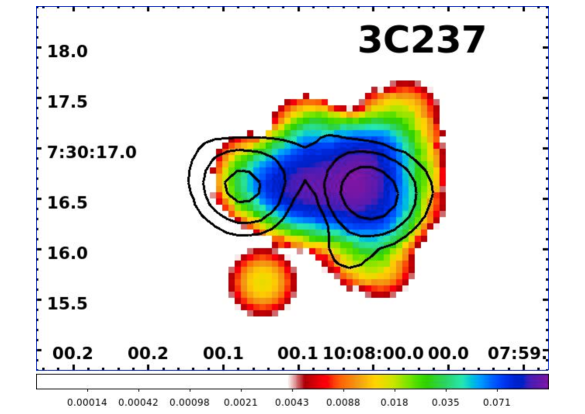
3CR 237.This is the only compact steep spectrum (CSS) radio source in our sample. It shows an FR II radio morphology and is at =0.877. The radio source size is less than 2″ (i.e., less than 15 kpc at 0.877) and it has a clear X-ray counterpart.
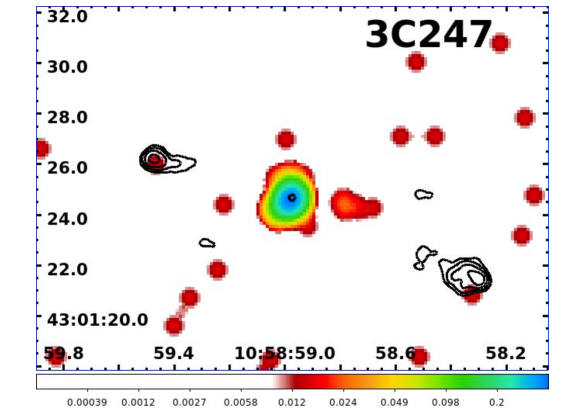
3CR 247. This is an FR II radio galaxy at =0.75, showing two hotspots on both the eastern and the western side, optically classified as a narrow emission line radio galaxy. The host galaxy associated with the radio source 3C247 lies in a very crowded field. In the HST optical image it appears as a symmetrical central galaxy with a close companion lying about 0.8 arcsec to the south. Two nearby galaxies also lie within the envelope of the infrared emission (see e.g. Best et al., 1998, 2000). Radio spectral ageing analysis of this source has yielded an age of 3-5 million years, corresponding to a hotspot advance velocity of about 0.1c (Liu et al., 1992). In the Chandra X-ray image the radio core and the northern hotspot are detected.
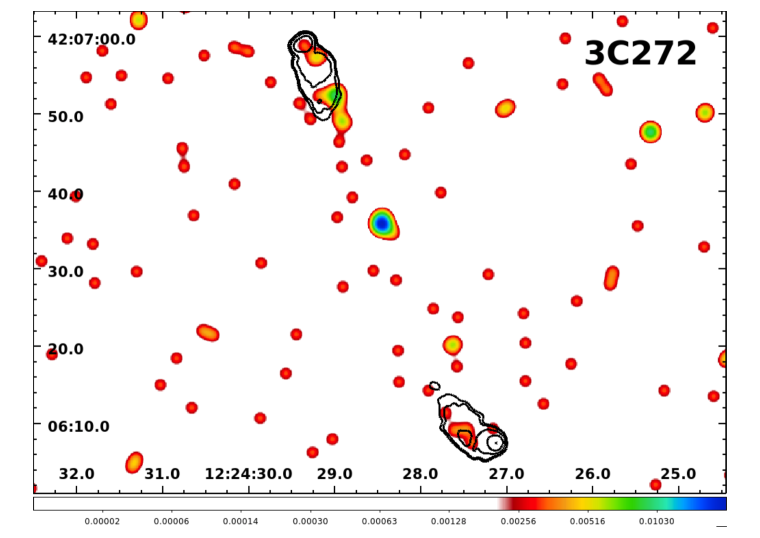
3CR 272. A classical double FR II radio source at =0.944, showing a relatively faint nuclear component with respect to the two hotspots at radio frequencies. Its optical spectrum shows a typical HERG spectrum with high ionization emission lines (Strom et al., 1990). There is nothing to report in the Chandra snapshot image other than the core detection.
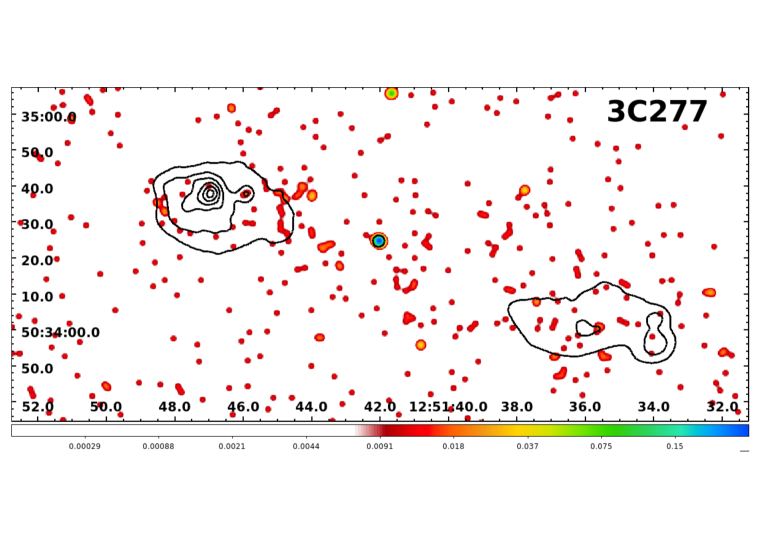
3CR 277. This is a giant FR II radio galaxy at =0.414 (Strom et al., 1990), optically classified as a low excitation type radio galaxy (i.e., LERG). At 1.4 GHz the core and a jet-like structure are detected in the eastern lobe. Both radio lobes show double hotspots in high resolution radio images (see e.g., Harvanek & Hardcastle, 1998). According to McCarthy et al. (1997) the source reveals a basic double morphology with the nuclear component slightly offset from the geometrical center. In the X-ray image the radio core is detected while while neither double hotspot has an X-ray counterpart.
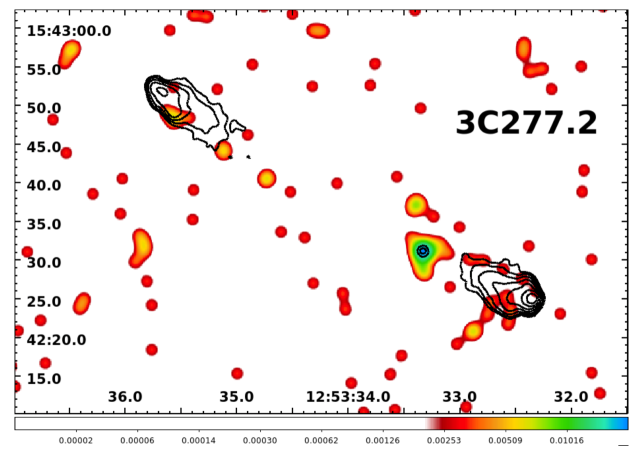
3C 277.2. This FR II radio galaxy at =0.767 is optically classified as a narrow line emission galaxy. It has a clear jet-like component in the southern lobe that is closer to the radio core but no signatures in the X-rays.
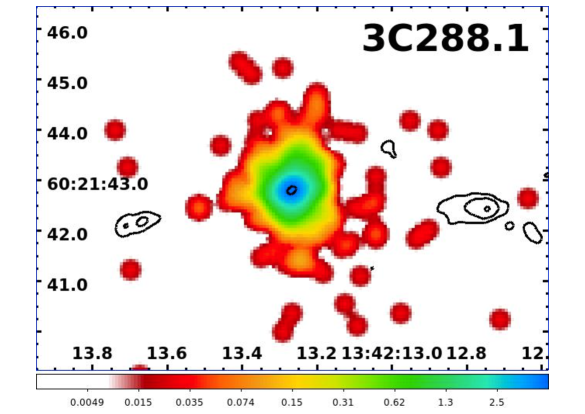
3CR 288.1. This is a lobe-dominated QSO lying at =0.961 having a clear point-like optical counterpart (Gendre & Wall, 2008). In the X-ray image the nucleus is clearly detected and given the high number of photons with respect to the majority of the other targets, we also performed its spectral analysis finding its X-ray spectrum consistent with an absorbed power-law (see Table 4). Extended emission on kpc scale seems to be present around the core (see Table 3) but no evidence of a galaxy cluster or a group of galaxies is present in the optical images.
3CR 292. A narrow line FR II radio galaxy at redshift 0.713. Mullin et al. (2006) reported the detection of the two hotspots and the core in the radio map at 8.45 GHz but a part from the core none of these features is detected in the X-rays. Adopting the same procedure as in previous cases we found that 3CR 292 shows extended X-ray emission (more than 3 detection significance) detected on kpc scale and potentially due to the presence of hot gas in the intergalactic medium (see Fig. 1). The number of X-ray photons measured in a annular region of radii 2″and 75″, centered on the radio core position, is 525 while those expected in the background, for the same area, is 364.3, where both X-ray counts have been measured using the merged event file. We estimated an X-ray luminosity for the extended emission of (2.50.7)1044erg/s, using the same annular region. Belsole et al. (2004) reported the X-ray detection of radio lobes in an XMM-Newton observation and as previously stated in the merged event file we clearly detected an excess of X-ray photons correspondent to the location of the northern hotspot. However, as shown in Fig. 5, in a circular region of 3.5″ radius, centered on the northern hotspot, we measured 5 X-ray counts in the 4ksec Chandra observation (i.e. obsID 16065) but only 1 in the deeper one (i.e. obsID 17488, 8ksec exposure time). Then, in the latter observation, the peak of the radio surface brightness is not coincident with the X-ray excess. Since this radio structure lies in a large scale environment permeated by X-ray emission from the hot intergalactic medium, we measured the level fo the X-ray background of the 4ksec observation within 75″ from the radio core and excluding the nuclear X-ray emission. We found that, over the same area (i.e., circle of 3.5″ radius), the expected number of counts is 1.51.2 (obsID 16065), thus this X-ray excess is consistent with a 3 fluctuation of the diffuse X-ray background. A deeper investigation will be necessary to distinguish between X-ray emission associated with the hotspot or that of the intergalactic medium. Variability on monthly time scale has been excluded because the hotspot size, even if being relatively compact with respect to the lobe structure, covers a region of 25 kpc.
3CR 293.1. This faint FR II radio galaxy is at =0.709. Its radio structures, i.e, the nucleus and both hotspots, are barely detected in the radio image available to us at 4.9 GHz and the comparison with the X-ray image indicates that the radio core is detected with possible extended X-ray emission around it (see Table 3).
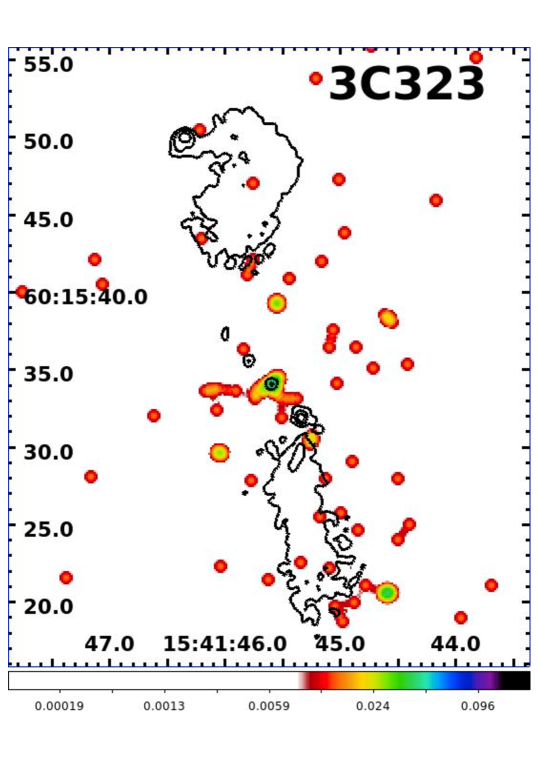
3CR 323. This is a FR II radio galaxy at =0.679. McCarthy et al. (1997) pointed out that the outer lobes are irregular and rather different in structure, the northern one undergoing a sharp bend to the east and ending in what may be a hotspot. In the X-ray we only detected the nucleus and there is also significant X-ray extended emission surrounding it both on scales of few tens and 300 kpc (above 5 significance), potentially due to its intergalactic medium (see Fig. 1). There are 329 X-ray photons in a annular region of radii 2″and 75″, centered on the radio core position, while 269.3 background photons are expected in this region. In this case the number of X-ray counts within a circular region of 2″ positioned on two point-like sources lying on the western side of 3CR 323 were also subtracted from the X-ray photons measured within the annular region. This does not affect the significance of the detection of the X-ray extended emission since only 8 and 20 photons were measured for the two nearby objects. We estimated an X-ray luminosity of (4.71.6)1043erg/s for the extended emission surrounding 3CR 323, this was measured over an annular region of inner radius 2″and outer radius 21″, centered on the location of its radio core. A lower value of the outer radius for the annular region has been chosen to avoid contamination due to the presence of nearby foreground/background X-ray point-like sources.
5. Summary and Conclusions
This paper presents the analysis of Chandra snapshot observations of a subsample of the extragalactic sources listed in the revised Third Cambridge radio catalog (3CR), previously lacking Chandra observations and observed during Cycle 15. This data set extends the current Chandra coverage of the 3CR extragalactic catalog up to redshift =1.0. The 3CR extragalactic sample includes 22 sources listing one compact steep spectrum (CSS) source and three quasars (QSOs) while all the remaining sources are FR II radio galaxies. Nineteen targets lie at in the range 0.5–1.0 plus 3C 93, 3CR 142.1 and 3CR 277. One additional target, 3CR 255A, lies in the Chandra field of view of a nearby source (i.e., 3CR 255B) observed during these Cycle 15 observations, but its radio core is not detected in the X-rays.
The main aims of the 3CR Chandra snapshot survey are: (i) to search for X-ray emission from jet knots, hotspots and lobes, (ii) to study the nuclear emission of their host galaxies and (iii) to investigate their environments at all scales, aiming to discover new galaxy groups/clusters via the X-ray emission of the intergalatic medium.
In the present work, the basic source parameters for the newly acquired Chandra data are presented. We created fluxmaps for all the X-ray snapshot observations and compared them with radio images to search for the high energy counterparts of extended radio structures (i.e., jet knots, hotspots, lobes). We measured their X-ray intensities in three energy ranges, namely soft, medium and hard band, for all radio cores and hotspots detected in the X-rays. Then, for the nuclei brighter than 400 X-ray photons, measured in a circular region of 2″ radius in the 0.5–7 keV energy range, we also performed X-ray spectral analysis showing nuclear spectra all consistent with simple power-law model, with an eventual mild intrinsic absorption in a single case.
We found X-ray emission arising from three hotspots in 3CR 41, 3CR 54 and 3CR 225B. We also report the discovery of extended X-ray emission, on tens of kpc scale, around the radio nuclei of 3CR 107 and 3CR 293.1, for the former source due to the X-ray counterpart of the southern radio lobe. Three sources in our sample are members of, optically-known galaxy groups/clusters: 3CR 41, 3CR 44 and 3CR 247. In the last two cases we did not detect X-ray emission arising from the intergalactic medium while a marginal detection (i.e., 2) was found for 3CR 34. Moreover, we discovered extended X-ray emission on a scale of few hundreds of kpc around the radio structures of 3CR 93, 3CR 154, 3CR 292 and 3CR 323, all above 3 significance. Then, for 3CR 154, we also detected the X-ray counterpart of a knot in the eastern radio lobe at 33″ distance from the nucleus.
Finally, we highlight that a table summarizing the state-of-the-art of the X-ray (i.e., Chandra and XMM-Newton) observations carried out to date is reported at the end of the present manuscript (see § B). Chandra detections are all based on both our current and previous analysis and represent an update with respect to previous works while those regarding XMM-Newton, shown here for the first time, are only based on literature search.
References
- Abdo et al. (2011) Abdo, A. A., Ackermann, M., Ajello, M. et al. 2011ApJ…726…43
- Arnaud (1996) Arnaud, K.A., 1996, ”Astronomical Data Analysis Software and Systems V”, eds. Jacoby G. and Barnes J., p17, ASP Conf. Series volume 101
- Baldi et al. (2010) Baldi, R. D.; Chiaberge, M.; Capetti, A.; Sparks, W.; Macchetto, F. D.; O’Dea, C. P.; Axon, D. J.; Baum, S. A.; Quillen, A. C. 2010 ApJ, 725, 2426
- Belsole et al. (2004) Belsole, E.; Worrall, D. M.; Hardcastle, M. J.; Birkinshaw, M.; Lawrence, C. R. 2004 MNRAS, 352, 924
- Belsole et al. (2007) Belsole, E.; Worrall, D. M.; Hardcastle, M. J.; Croston, J. H. 2007 MNRAS, 381, 1109
- Balmaverde et al. (2012) Balmaverde, B., Capetti, A., Grandi, P., Torresi, E., Chiaberge, M. et al. 2012 A&A, 545A, 143
- Best et al. (1997) Best, P. N., Longair, M. S., Rttering, H. J. A. 1997 MNRAS, 286, 785
- Best et al. (1998) Best, P. N., Longair, M. S., Rttering, H. J. A. 1998 MNRAS, 295, 549
- Best et al. (2000) Best, P. N. 2000 MNRAS, 317, 720
- Bennett (1962) Bennett, A. S. 1962 MmRAS, 68, 163
- Bennett et al. (2014) Bennett, C. L., et al. 2014 ApJ, 794, 135
- Blanton et al. (2009) Blanton, E. L., Randall, S. W., Douglass, E. M. et al. 2009 ApJ, 697L, 95
- Bogers et al. (1994) Bogers, W. J., Hes, R., Barthel, P. D., Zensus, J. A., 1995 A&A 105, 91
- Brinkman et al. (2002) Brinkman, A. C.; Kaastra, J. S.; van der Meer et al. 2002 A&A, 396, 761
- Buttiglione et al. (2009) Buttiglione, S., Capetti, A., Celotti, A., Axon, D.J., Chiaberge, M., Macchetto, F.D., Sparks, W.B., 2009 A&A 495, 1033
- Buttiglione et al. (2011) Buttiglione, S.; Capetti, A.; Celotti, A.; Axon, D. J.; Chiaberge, M.; Macchetto, F. D.; Sparks, W. B. 2011 A&A, 525A, 28
- Chiaberge et al. (2015) Chiaberge, M.; Gilli, R.; Lotz, J. M.; Norman, C. 2015 ApJ, 806, 147
- Croston et al. (2005) Croston, J. H.; Hardcastle, M. J.; Harris, D. E.; Belsole, E.; Birkinshaw, M.; Worrall, D. M. 2005 ApJ, 626, 733
- Croston et al. (2008) Croston, J. H.; Hardcastle, M. J.; Birkinshaw, M.; Worrall, D. M.; Laing, R. A. 2008 MNRAS, 386, 1709
- Dasadia et al. (2016) Dasadia, S. Sun, M. Morandi, A. et al. 2016 MNRAS, 458, 681
- Davis (2001) Davis, J. E. 2001 ApJ, 562, 575 2014 ApJ, 788, 98
- Dicken et al. (2014) Dicken, D.; Tadhunter, C.; Morganti, R.; Axon, D.; Robinson, A.;
- Edge et al. (1959) Edge, D. O., Shakeshaft, J. R., McAdam, W. B., Baldwin, J. E.; Archer, S. 1959 MmRAS, 68, 37
- Evans et al. (2006) Evans, D. A.; Worrall, D. M.; Hardcastle, M. J.; Kraft, R. P.; Birkinshaw, M. 2006 ApJ, 642, 96
- Fabian et al. (2003) Fabian, A. C., Sanders, J. S., Allen, S. W. et al. 2003 MNRAS, 344L, 43
- Fanaroff & Riley (1974) Fanaroff, B. L. & Riley J. M. 1974, MNRAS, 167, P31
- Gendre & Wall (2008) Gendre M. A. & Wall, J. V. 2008 MNRAS, 390, 819
- Giovannini et al. (2005) Giovannini, G.; Taylor, G. B.; Feretti, L.; Cotton, W. D.; Lara, L.; Venturi, T. 2005, ApJ 618, 635
- Griffiths et al. (2000) Griffiths, R. E., Ptak, A., Feigelson, E. D. et al. 2000 Sci, 290, 1325
- Grimes et al. (2004) Grimes, Rawlings & Willott, 2004, MNRAS, 349, 503
- Hass et al. (2008) Haas, M; Willner, S. P.; Heymann, F.; Ashby, M. L. N.; Fazio, G. G.; Wilkes, B. J.; Chini, R.; Siebenmorgen, R. 2008 ApJ, 688, 122
- Hardcastle et al. (2000) Hardcastle, M. J.; Worrall, D. M. 2000 MNRAS, 314, 359
- Hardcastle et al. (2006) Hardcastle, M. J.; Evans, D. A.; Croston, J. H. 2006 MNRAS, 370, 1893
- Hardcastle et al. (2010) Hardcastle, M. J., Massaro, F., Harris, D. E. 2010 MNRAS, 401, 2697
- Hardcastle et al. (2012) Hardcastle, M. J., Massaro, F., Harris, D. E. et al. 2012 MNRAS, 424, 1774
- Harvanek & Hardcastle (1998) Harvanek, M. & Hardcastle, M. J. 1998 ApJS, 119, 1
- Harvanek et al. (2001) Harvanek, M.; Ellingson, E.; Stocke, J. T.; Rhee, G. 2001 AJ, 122, 2874
- Hes et al. (1996) Hes, R.; Barthel, P. D.; Fosbury, R. A. E. 1996 A&A, 313, 423
- Hewitt & Burbidge (1991) Hewitt, A.& Burbidge, G. 1991 ApJS, 75, 297
- Hilbert et al. (2016) Hilbert, B.; Chiaberge, M.; Kotyla, J. P.; Tremblay, G. R.; Stanghellini, C. et al. 2016 ApJS, 225, 12
- Hiltner & Roeser (1991) Hiltner, P. R. & Roeser, H.-J. 2009 ApJS, 184, 398
- Ho & MinJin (2009) Ho, L. C. & Minjin, K. 2009 ApJS, 184, 398
- Ineson et al. (2013) Ineson, J.; Croston, J. H.; Hardcastle, M. J.; Kraft, R. P.; Evans, D. A.; Jarvis, M. 2013 ApJ, 770, 136
- Ineson et al. (2017) Ineson, J.; Croston, J. H.; Hardcastle, M. J.; Mingo, B. 2017 MNRAS, 467, 1586
- Kalberla et al. (2005) Kalberla, P.M.W., Burton, W. B., Hartmann, D., et al. 2005, A&A, 440, 775
- Kharb et al. (2008) Kharb, P. , O’Dea, C. P., Baum, S. A., Daly, R. et al. 2008 ApJS, 174, 74
- Kuraszkiewicz et al. (2017) Kuraszkiewicz, J. et al. 2017 ApJ in prep.
- Laing et al. (1983) Laing, R. A., Riley, J. M., Longair, M. S. 1983 MNRAS 204, 151
- Laskar et al. (2010) Laskar, T.; Fabian, A. C.; Blundell, K. M.; Erlund, M. C. 2010 MNRAS, 401, 1500
- Lehnert et al. (1999) Lehnert, M. D.; Miley, G. K.; Sparks, W. B.; Baum, S. A.; Biretta, J. et al. 1999 ApJS, 123, 351L
- Leipski et al. (2010) Leipski, C.; Haas, M.; Willner, S. P.; Ashby, M. L. N.; Wilkes, B. J.; Fazio, G. G.; Antonucci, R.; Barthel, P.; Chini, R.; Siebenmorgen, R.; Ogle, P.; Heymann, F. 2010 ApJ, 717, 766
- Liu et al. (1992) Liu, R., Pooley, G. & Riley, J. M. 1992 MNRAS, 257, 545
- Madrid et al. (2006) Madrid, J. P.; Chiaberge, M.; Floyd, D.; Sparks, W. B.; Macchetto, D.; 2006 ApJS, 164, 307
- Mannering et al. (2013) Mannering, E.; Worrall, D. M.; Birkinshaw, M. 2013 MNRAS, 431, 858
- Maselli et al. (2016) Maselli, A.; Massaro, F.; Cusumano, G.; La Parola, V.; Harris, D. E. et al. 2016 MNRAS, 460, 3829
- (56) Massaro, F., Chiaberge, M., Grandi, P. et al. 2009 ApJ, 692, L123
- (57) Massaro, F., Harris, D. E., Chiaberge M. et al. 2009 ApJ, 696, 980
- Massaro et al. (2010) Massaro, F. et al. 2010 ApJ, 714, 589
- Massaro et al. (2011) Massaro, F., Harris, D. E., Cheung, C. C. 2011 ApJS, 197, 24
- Massaro et al. (2012) Massaro, F. et al. 2012 ApJS, 203, 31
- Massaro et al. (2013) Massaro, F. et al. 2013 ApJS, 203, 31
- Massaro et al. (2015) Massaro, F., D. E., Harris, E., Liuzzo, M., Orienti, R., Paladino et al. 2015 ApJS 220, 5
- McCarthy et al. (1995) McCarthy, P. J.; Spinrad, H.; van Breugel, W. 1995 ApJS, 99, 27
- McCarthy et al. (1997) McCarthy, P. J., Miley, G. K., de Koff, S., Baum, S. A., Sparks, W. B. et al. 1997 ApJS, 112, 415
- Mullin et al. (2006) Mullin, L. M.; Hardcastle, M. J.; Riley, J. M. 2006 MNRAS, 372, 113
- Mullin et al. (2008) Mullin, L.M., Riley, J. M., Hardcastle, M. J. MNRAS 2008, 390, 595
- Nulsen et al. (2005) Nulsen, P. E. J., Hambrick, D. C., McNamara, B. R. 2005 ApJ, 625L, 9
- O’Dea et al. (2009) O’Dea, C. P., Daly, R. A., Kharb P., Freeman, K. A., Baum, S. A., 2009 A&A 494, 471
- Perryman et al. (1984) Perryman, M. A. C.; Lilly, S. J.; Longair, M. S.; Downes, A. J. B. 1984 MNRAS, 209, 159
- Podigachoski et al. (2015) Podigachoski, P.; Barthel, P. D.; Haas, M.; Leipski, C.; Wilkes, B. et al. 2015 A&A, 575A, 80
- Privon et al. (2008) Privon, G. C.; O’Dea, C. P.; Baum, S. A.; Axon, D. J.; Kharb, P.; 2008 ApJS, 175, 423
- Shelton et al. (2011) Shelton, D. L.; Hardcastle, M. J.; Croston, J. H. 2011 MNRAS, 418, 811
- Siemiginowska et al. (2010) Siemiginowska, A.; Burke, D. J.; Aldcroft, Thomas L.; Worrall, D. M.; Allen, S.; Bechtold, Jill; Clarke, Tracy; Cheung, C. C. 2010 ApJ, 722, 102
- Sokolovsky et al. (2011) Sokolovsky, K. V. , Kovalev, Y. Y., Pushkarev, A. B., Lobanov, A. P. 2011 A&A, 532, 38
- Spinrad et al. (1985) Spinrad, H., Marr, J., Aguilar, L., Djorgovski, S. 1985 PASP, 97, 932
- Strom et al. (1990) Strom, R. G.; Riley, J. M.; Spinrad, H.; van Breugel, W. J. M.; Djorgovski, S.; Liebert, J.; McCarthy, P. J. 1990 A&A, 227, 1
- Stuardi et al. (2017) Staurdi, C. et al. 2017 ApJS in prep.
- Taylor (2005) Taylor, M. B. 2005, ASP Conf. Ser., 347, 29
- Tremblay et al. (2009) Tremblay, G. R.; Chiaberge, M.; Sparks, W. B.; Baum, S. A.; Allen, M. G.; et al. 2009 ApJS, 183, 278
- Werner et al. (2012) Werner, M. W., Murphy, D. W., Livingston, J. H., Gorjian, V., Jones, D. L., 2012 ApJ, 759, 86
- Westhues et al. (2016) Westhues, C.; Haas, M.; Barthel, P.; Wilkes, B. J.; Willner, S. P. et al. 2016 AJ, 151, 120
- Wilkes et al. (2013) Wilkes, B. J., Kuraszkiewicz, J., Haas, M. et al. 2013 ApJ, 773, 15
| 3CR | Class | R.A. (J2000) | Dec. (J2000) | z | kpc scale | DL | NH | mv | S178 | Chandra | Obs. Date |
|---|---|---|---|---|---|---|---|---|---|---|---|
| name | (hh mm ss) | (dd mm ss) | (kpc/arcsec) | (Mpc) | cm -2 | Jy | Obs. ID | yyyy-mm-dd | |||
| 34 | FR II - HERG | 01 10 18.542 | +31 47 19.51 | 0.69 | 7.191 | 4236.3 | 5.50e20 | 21 | 11.9 | 16046 | 2014-09-25 |
| 41 | FR II - HERG | 01 26 44.325 | +33 13 10.96 | 0.794 | 7.586 | 5035.7 | 5.09e20 | 21 | 10.6 | 16047 | 2014-09-03 |
| 44 | QSO | 01 31 21.647 | +06 23 43.14 | 0.66 | 7.058 | 4011.6 | 3.18e20 | 22 | 7.9 | 16048 | 2014-06-14 |
| 54 | FR II - HERG | 01 55 30.258 | +43 45 59.06 | 0.8274 | 7.693 | 5298.7 | 7.80e20 | 22 | 8.8 | 16049 | 2014-06-15 |
| 55 | FR II - HERG | 01 57 10.539 | +28 51 39.70 | 0.735 | 7.374 | 4578.4 | 5.38e20 | 22 | 21.5 | 16050 | 2014-06-15 |
| 93 | QSO | 03 43 29.996 | +04 57 48.60 | 0.358 | 5.059 | 1924.5 | 1.15e21 | 18.1 | 9.9 | 16051 | 2014-10-10 |
| 107 | FR II - HERG | 04 12 22.620 | -00 59 32.69 | 0.785 | 7.555 | 4965.3 | 8.42e20 | 22 | 10.8 | 16052 | 2014-09-02 |
| 114 | FR II - LERG | 04 20 22.243 | +17 53 56.97 | 0.815 | 7.654 | 5200.7 | 1.61e21 | 22 | 6.5 | 16053 | 2014-09-02 |
| 142.1 | FR II | 05 31 29.334 | +06 30 26.90 | 0.4061 | 5.476 | 2233 | 1.79e21 | 21 | 19.4 | 16054 | 2014-08-16 |
| 154 | QSO | 06 13 50.139 | +26 04 36.64 | 0.580 | 6.654 | 3426.3 | 3.47e21 | 18.0 | 23.1 | 16055 | 2014-08-13 |
| 169.1 | FR II - HERG | 06 51 14.816 | +45 09 28.56 | 0.633 | 6.930 | 3811.7 | 9.30e20 | 20.5 | 7.3 | 16056 | 2014-08-16 |
| 217 | FR II - HERG | 09 08 50.6 | +37 48 19 | 0.898 | 7.892 | 5863.9 | 1.68e20 | 22 | 11.3 | 16057 | 2014-06-13 |
| 225B | FR II -HERG | 09 42 15.396 | +13 45 50.49 | 0.582 | 6.665 | 3440.7 | 3.45e20 | 19 | 21.3 | 16058 | 2014-10-18 |
| 237 | FR II-CSS | 10 08 00.0 | +07 30 16 | 0.877 | 7.836 | 5694.5 | 1.89e20 | 21 | 20.9 | 16059 | 2014-10-31 |
| 247 | FR II - HERG | 10 58 58.973 | +43 01 24.66 | 0.750 | 7.430 | 4693.7 | 8.79e19 | 21.5 | 10.6 | 16060 | 2014-09-26 |
| 272 | FR II | 12 24 28.5 | +42 06 36 | 0.944 | 8.003 | 6238.6 | 2.23e20 | 22 | 8 | 16061 | 2015-03-01 |
| 277 | FR II | 12 51 43.6 | +50 34 25 | 0.414 | 5.540 | 2284.7 | 1.04e20 | 20 | 7.5 | 16062 | 2015-03-03 |
| 277.2 | FR II - HERG | 12 53 33.330 | +15 42 31.18 | 0.767 | 7.492 | 4825.2 | 1.70e20 | 21.5 | 12 | 16063 | 2015-05-07 |
| 288.1 | QSO | 13 42 13.267 | +60 21 42.79 | 0.9610 | 8.041 | 6378.3 | 1.75e20 | 18.1 | 9 | 16064 | 2014-06-08 |
| 292 | FR II - HERG | 13 50 41.852 | +64 29 35.86 | 0.713 | 7.287 | 4410.4 | 1.66e20 | 20.7 | 10.1 | 16065+ | 2014-09-12 |
| 293.1 | FR II | 13 54 40.519 | +16 14 43.14 | 0.709 | 7.271 | 4380.0 | 1.82e20 | 21 | 9.2 | 16066 | 2014-06-05 |
| 323 | FR II | 15 41 45.594 | +60 15 34.03 | 0.6790 | 7.143 | 4153.6 | 1.49e20 | 21 | 8.4 | 16067 | 2014-04-30 |
Col. (1): The 3CR name.
Col. (2): The ‘class’ column contains both a radio descriptor (Fanaroff-Riley class I or II), Compact Steep Spectrum (CSS) and
the optical spectroscopic designation, LERG, “Low Excitation Radio Galaxy”, HERG, “High Excitation Radio Galaxy” and QSO for quasars (see also Perryman et al., 1984; Hes et al., 1996; Grimes et al., 2004, for more details).
Col. (3-4): The celestial positions listed are those of the radio nuclei which we used to register the X-ray images: Right ascension and Declination (equinox J2000, see § 3 for details). We reported here the original 3CR position (Spinrad et al., 1985) of the sources for which the radio core was not clearly detected.
Col. (5): Redshift . We also verified in the literature (e.g., NED and/or SIMBAD databases) if new values were reported after the release of the 3CR catalog.
Col. (6): The angular to linear scale factor in arcseconds. Cosmological parameters used to compute it are reported in § 1.
Col. (7): Luminosity Distance in Mpc. Cosmological parameters used to compute it are reported in § 1.
Col. (8): Galactic Neutral hydrogen column densities NH,Gal along the line of sight (Kalberla et al., 2005).
Col. (8): The optical magnitude in the V band taken from the 3CR catalog (Spinrad et al., 1985).
Col. (9): S178 is the flux density at 178 MHz, taken from Spinrad et al. (1985).
Col. (10): The Chandra observation ID.
Col. (11): The date when the Chandra observation was performed.
+ For 3CR 292 two Chandra observations are available with obsID: 16065 and 17488, the latter performed in 2014-11-21, (see § 4 for details).
| 3CR | Ext. Ratio | F | F | F | F | LX |
|---|---|---|---|---|---|---|
| name | (cgs) | (cgs) | (cgs) | (cgs) | (1044erg s-1) | |
| 34 | 0.72 (0.04) | 0.25 (0.57) | 4.69 (1.43) | 77.53 (9.95) | 82.47 (10.06) | 1.76 (0.22) |
| 41 | 0.59 (0.06) | 0.32 (0.32) | 0.94 (0.68) | 41.33 (7.42) | 42.6 (7.46) | 1.29 (0.23) |
| 44 | 0.45 (0.09) | 0.82 (0.59) | 0.68 (0.64) | 9.71 (3.67) | 11.22 (3.77) | 0.22 (0.07) |
| 54 | 0.83 (0.05) | 1.06 (0.75) | 4.76 (1.33) | 41.04 (7.25) | 46.85 (7.41) | 1.57 (0.25) |
| 55 | 0.48 (0.09) | 0.82 (0.58) | 2.41 (0.91) | 8.39 (3.47) | 11.61 (3.64) | 0.29 (0.09) |
| 93 | 0.948 (0.006) | 77.48 (6.26) | 157.41 (7.41) | 429.53 (22.58) | 664.42 (24.58) | 2.94 (0.11) |
| 107 | 0.15 (0.06) | 0.38 (0.38) | 0.49 (0.49) | 2.95 (2.12) | 3.82 (2.21) | 0.11 (0.07) |
| 114 | 0.91 (0.02) | 1.16 (0.82) | 43.23 (4.05) | 255.54 (17.3) | 299.94 (17.78) | 9.71 (0.58) |
| 142.1 | 0.61 (0.09) | 0.57 (0.57) | 2.24 (0.91) | 11.19 (3.77) | 13.99 (3.92) | 0.08 (0.02) |
| 154 | 0.947 (0.006) | 41.35 (4.59) | 241.5 (9.31) | 923.47 (33.73) | 1206.32 (35.29) | 16.95 (0.5) |
| 169.1 | 0.64 (0.08) | 2.1 (0.94) | 0.23 (0.51) | 18.65 (4.98) | 20.98 (5.1) | 0.36 (0.09) |
| 217 | 0.91 (0.20) | 1.42 (1.0) | 15.01 (2.29) | 100.01 (10.98) | 116.44 (11.26) | 4.78 (0.46) |
| 225B | 0.48 (0.11) | 0.68 (0.48) | 0.12 (0.26) | 5.18 (2.59) | 5.98 (2.65) | 0.08 (0.04) |
| 237 | 0.84 (0.05) | 4.11 (1.45) | 7.0 (1.53) | 13.76 (4.01) | 24.87 (4.53) | 0.97 (0.18) |
| 247 | 0.7 (0.06) | 0.99 (0.7) | 3.71 (1.25) | 36.22 (6.61) | 40.92 (6.77) | 1.07 (0.18) |
| 272 | 0.41 (0.12) | 0.0 (0.0) | 0.46 (0.46) | 4.85 (2.48) | 5.31 (2.52) | 0.25 (0.12) |
| 277 | 0.84 (0.06) | 0.33 (0.33) | 2.2 (1.0) | 26.81 (6.0) | 29.34 (6.09) | 0.18 (0.04) |
| 277.2 | 0.43 (0.10) | 3.15 (1.29) | 0.21 (0.47) | 2.26 (2.26) | 5.63 (2.65) | 0.16 (0.07) |
| 288.1 | 0.946 (0.08) | 76.35 (5.65) | 114.05 (6.1) | 236.49 (16.45) | 426.88 (18.43) | 20.78 (0.9) |
| 292 | 0.86 (0.04) | 0.9 (0.9) | 1.8 (1.04) | 103.58 (14.13) | 106.29 (14.19) | 2.47 (0.33) |
| 293.1 | 0.26 (0.10) | 0.0 (0.0) | 0.84 (0.6) | 1.76 (1.24) | 2.59 (1.38) | 0.06 (0.03) |
| 323 | 0.18 (0.06) | 0.0 (0.0) | 0.9 (0.65) | 5.03 (2.25) | 5.93 (2.34) | 0.12 (0.05) |
Col. (1): The 3CR name.
Col. (2): The Ext. Ratio defined as the ratio of the net counts in the r = 2″ circle to the net counts in the
r = 10″ circular region surrounding the core of each 3CR source. The 1 uncertainties are given in parenthesis.
Col. (3): Measured X-ray flux between 0.5 and 1 keV.
Col. (4): Measured X-ray flux between 1 and 2 keV.
Col. (5): Measured X-ray flux between 2 and 7 keV.
Col. (6): Measured X-ray flux between 0.5 and 7 keV.
Col. (7): X-ray luminosity in the range 0.5 to 7 keV with the 1 uncertainties given in parenthesis.
Note:
(∗) Fluxes are given in units of 10-15erg cm-2s-1 and 1 uncertainties are given in parenthesis.
The uncertainties on the flux measurements are computed as described in § 3
(+) Sources having count rates above the threshold of 0.1 counts per frame
for which the X-ray flux measurement is affected by pileup (see Massaro et al., 2013, and references therein for additional details).
| 3CR | f | |||
|---|---|---|---|---|
| 93 | 1.78(-0.08,0.15) | 0.06 | 0.91 | 34.91/25 |
| 114 | 2.06(-0.34,0.36) | 7.21(-2.4,2.54) | - | 3.91/7 |
| 154 | 1.85(-0.14,0.18) | 0.61(-0.26,0.28) | 0.92 | 41.52/39 |
| 288.1 | 1.77(-0.08,0.09) | 0.1 | - | 16.99/19 |
Col. (1): The 3CR name. Col. (2): The X-ray photon index . Col. (3): The intrinsic absorption at the source redshift. Col. (4): The fraction of flux falling into the pileup region. Col. (5): The value divided by the degrees of freedom. Statistical uncertainties quoted refer to the 68% confidence level.
| 3CR | Component | class | Counts | F | F | F | F | LX |
|---|---|---|---|---|---|---|---|---|
| name | (cgs) | (cgs) | (cgs) | (cgs) | (1042erg s-1) | |||
| 41 | s11.3 | h | 6 (0.1) | 0.56 (0.56) | 0.55 (0.55) | 4.7 (2.7) | 5.8 (2.8) | 17.5 (8.5) |
| 54 | s9.3 | h | 3 (0.4) | 0.0 (0.0) | 0.91 (0.52) | 0.0 (0.0) | 0.91 (0.52) | 3.05 (1.74) |
| 107 | s5.0 | l | 11 (1.5) | 0.62 (0.62) | 1.3 (0.8) | 3.9 (2.3) | 5.9 (2.5) | 17.3 (7.2) |
| 154 | e33.0 | k | 8 (0.9) | 0.0 (0.0) | ¡0.24 | 6.3 (2.6) | 6.6 (2.6) | 9.2 (3.7) |
| 225B | w2.0 | h | 4 (0.1) | 0.0 (0.0) | 0.79 (0.58) | 0.69 (0.69) | 1.5 (0.9) | 2.1 (1.3) |
Col. (1): The 3CR name.
Col. (2): The component name (e.g., knot or hotspot) is a combination of one letter indicating the orientation of the radio structure and one number indicating distance from the core in arcseconds.
Col. (3): The component class: “h” = hotspot - “k” = knot - “l” = lobe.
Col. (4): The total counts in the photometric circle together with the average of the 8 background regions, in parentheses; both for the 0.5 to 7 keV band.
Col. (5): Measured X-ray flux between 0.5 and 1 keV.
Col. (6): Measured X-ray flux between 1 and 2 keV.
Col. (7): Measured X-ray flux between 2 and 7 keV.
Col. (8): Measured X-ray flux between 0.5 and 7 keV.
Col. (9): X-ray luminosity in the range 0.5 to 7 keV with the 1 uncertainties given in parenthesis.
Note:
(∗) Fluxes are given in units of 10-15erg cm-2s-1 and 1 uncertainties are given in parenthesis.
The uncertainties on the flux measurements were computed as described in § 3
Appendix A A: Images of the sources
For all the 3CR sources in our sample, radio morphologies are shown here as contours superposed on the re-gridded/smoothed X-ray event files. The full width half maximum (FWHM) of the Gaussian smoothing function and the binning factor are reported in the figure captions. X-ray event files were limited to the 0.5 to 7 keV band and rebinned to change the pixel size with a binning factor ’f’ (e.g. f=1/4 produces pixels 4 times smaller than the native ACIS pixel of 0.492″). The labels on the color bar for each X-ray map are in units of counts/pixel. We included in each caption also the radio brightness of the lowest contour, the factor (usually 2 or 4) by which each subsequent contour exceeds the previous one, the frequency of the radio map, and the FWHM of the clean beam. Figures appear so different from each other mainly because of the wide range in angular size of the radio sources.
Appendix B B: The Status of the Chandra X-ray 3CR observations
Here we present the current status of the Chandra and XMM-Newton observations for the entire 3CR catalog. While Chandra X-ray observations have been uniformly re-analyzed, as reported in our previous investigations, all the XMM-Newton information provided here is based on a literature search (see e.g. Croston et al., 2005; Belsole et al., 2007; Croston et al., 2008; Laskar et al., 2010; Shelton et al., 2011; Ineson et al., 2013; Mannering et al., 2013; Ineson et al., 2017, and references therein for more details).
For all 3CR sources, we report their classification, labeling: radio galaxies (RG), according to the Fanaroff & Riley criterion (Fanaroff & Riley, 1974); quasars (i.e., QSRs); Seyfert galaxies (Sy) and BL Lac objects (BL). We also indicate as “UNID” those sources which, lacking optical spectroscopy, remain unidentified. We include a column reporting the radio morphology for the radio galaxies (FR I FR II types) and indicating those objects that also show the radio structure of: (i) Compact Steep Spectrum (CSS) or X-shaped (XS) radio sources or (ii) have been classified in the literature as wide-angle tailed or narrow-angle tailed radio galaxies (WAT and NAT, resepctively). We also devoted a column to the optical classification of radio galaxies distinguishing them as HERG or LERG. The most updated value of the redshift is also reported and we used a “cluster flag” to label sources that belong to a known galaxy group/cluster. We considered sources belonging to a galaxy-rich large scale environment those for which there is a known optical group/cluster reported in the literature and/or those for which there is an archival X-ray observation confirming the presence of hot gas in the intergalactic medium.
Regarding the X-ray analysis, we report X-ray detections of radio components adopting the following symbols: jet knot; hotspot; lobe and for sources that belong to a galaxy-rich large scale environment. No distinction has been made between sources lying in group or clusters of galaxies. We also adopt the symbol for those radio objects that show extended X-ray emission of kpc scale as highlighted in our analyses using the “extent ratio” measurements. For XMM-Newton observations we only adopted and symbols due to the lower angular resolution with respect to Chandra that does not allow to see counterparts of jet knots and hotspots in the large fraction fo the 3CR sources.
Finally, the “X-ray flag” indicates if the source was already observed by Chandra (c) and/or XMM-Newton (x). Sources marked with a ∗ close to their 3CR name are those not re-analyzed in our previous studies (see § 2 for more details). The table present in this work updates and thus supersedes those included in previous publications.
| 3CR | class | radio | optical | Cluster | Chandra | XMM-Newton | X-ray | |
|---|---|---|---|---|---|---|---|---|
| name | morph. | class | flag | detections | detections | obs. | ||
| 2.0 | 1.03658 | QSO | e | c | ||||
| 6.1 | 0.8404 | RG | FRII | HERG | h | c | ||
| 9.0 | 2.01976 | QSO | LDQ | k;l | c | |||
| 11.1 | ? | UNID | - | - | x | |||
| 13.0 | 1.351 | RG | FRII | HERG | e;h | c-x | ||
| 14.0 | 1.469 | QSO | c | |||||
| 14.1 | ? | UNID | - | - | x | |||
| 15.0 | 0.07368 | RG | FRI | LERG | k;l | c | ||
| 16.0 | 0.405 | RG | FRII | HERG | e;h;l | c-x | ||
| 17.0 | 0.219685 | QSO | k | c | ||||
| 18.0 | 0.188 | RG | FRII | e | c | |||
| 19.0 | 0.482 | RG | FRII | LERG | yes | h;igm | c-x | |
| 20.0 | 0.174 | RG | FRII | HERG | c-x | |||
| 21.1 | ? | UNID | - | - | x | |||
| 22.0 | 0.936 | RG | FRII | c | ||||
| 27.0 | 0.184 | RG | FRII | HERG | c | |||
| 28.0 | 0.19544 | RG | FRI | LERG | yes | igm | igm | c-x |
| 29.0 | 0.045031 | RG | FRI | LERG | yes | k;igm | c | |
| 31.0 | 0.017005 | RG | FRI | LERG | yes | k | igm | c-x |
| 33.0 | 0.0597 | RG | FRII | HERG | yes | h:l | l;igm | c-x |
| 33.1 | 0.181 | RG | FRII | HERG | c | |||
| 33.2 | ? | UNID | - | - | x | |||
| 34.0 | 0.69 | RG | FRII | HERG | yes | igm | c | |
| 35.0 | 0.067013 | RG | FRII | LERG | yes | e;l | l;igm | c-x |
| 36.0 | 1.301 | RG | FRII | HERG | c | |||
| 40.0 | 0.018 | RG | FRI-WAT | LERG | yes | igm | igm | c-x |
| 41.0 | 0.795 | RG | FRII | HERG | h | c | ||
| 42.0 | 0.39598 | RG | FRII | HERG | c-x | |||
| 43.0 | 1.459 | QSO | CSS | c | ||||
| 44.0 | 0.66 | QSO | yes | c | ||||
| 46.0 | 0.4373 | RG | FRII | HERG | yes | igm | c-x | |
| 47.0 | 0.425 | QSO | LDQ | h;l | c | |||
| 48.0 | 0.367 | QSO | CSS | c | ||||
| 49.0 | 0.23568 | RG | FRII-CSS | HERG | c | |||
| 52.0 | 0.29 | RG | FRII-XS | HERG | yes | h | c | |
| 54.0 | 0.8274 | RG | FRII | HERG | h | c | ||
| 55.0 | 0.7348 | RG | FRII | HERG | c-x | |||
| 61.1 | 0.18781 | RG | FRII | HERG | h | c-x | ||
| 63.0 | 0.175 | RG | FRII | HERG | c | |||
| 65.0 | 1.176 | RG | FRII | HERG | e;h | c-x | ||
| 66.0A | ? | BLL | BL | - | yes | c-x | ||
| 66.0B | 0.021258 | RG | FRI-XS | LERG | yes | k | igm | c-x |
| 67.0 | 0.3102 | RG | FRII-CSS | c-x | ||||
| 68.1 | 1.238 | QSO | c | |||||
| 68.2 | 1.575 | RG | FRII | HERG | e;h | c | ||
| 69.0 | 0.458 | RG | FRII | HERG | c | |||
| 71.0 | 0.003793 | SEY | - | Sy2 | c-x | |||
| 75.0 | 0.023153 | RG | FRI-WAT | LERG | yes | igm | igm | c-x |
| 76.1 | 0.032489 | RG | FRI | LERG | yes | igm | igm | c-x |
| 78.0 | 0.028653 | RG | FRI | LERG | k | c |
Col. (1): The 3CR name. Col. (2): Redshift . We also verified in the literature (e.g., NED and/or SIMBAD databases) if new values were reported after the release of the 3CR catalog. Col. (3): The source classification of the sources: RG stands for radio galaxies, QSO for quasars; Sy for Seyfert galaxies and BLL for BL Lac objects. We used the acronym UNID for sources that are still unidentified; i.e., lacking of an optical spectroscopic observation. Col. (4): The radio morphological classification: FR I and FR II refer to the Fanaroff and Riley classification criterion (Fanaroff & Riley, 1974) while LDQ and CDQ is sometimes adopted for lobe-dominated and core-dominated quasars; we also indicated if in the literature the source is classified as CSS or if presents an X-shaped radio structure (XS) or if it is a narrow or wide angle tailed radio galaxy (NAT and WAT, respectively). Col. (5): The optical spectroscopic designation: LERG, “Low Excitation Radio Galaxy”, HERG, “High Excitation Radio Galaxy”. Col. (6): The “cluster flag” as discussed in § B. Col. (7): In this column we report if the source has a radio component with an X-ray counterpart in a Chandra observation. We used the following labels: k = jet knot; h = hotspot; l = lobe; e = extended X-ray emission around the nucleus on kpc scale and igm whenever this extended emission is associated with the hot gas present in the intergalactic medium. Col. (8): The same of the previous column (i.e. Col. 7) but for the XMM-Newton observations. Col. (9): The c flag indicates that at least one Chandra observation is present in its archive while the x flag refers to the XMM-Newton archive.
| 3CR | class | radio | optical | Cluster | Chandra | XMM-Newton | X-ray | |
|---|---|---|---|---|---|---|---|---|
| name | morph. | class | flag | detections | detections | obs. | ||
| 79.0 | 0.2559 | RG | FRII | HERG | yes | igm | c-x | |
| 83.1 | 0.025137 | RG | FRI-NAT | LERG | yes | k;igm | igm | c-x |
| 84.0 | 0.017559 | RG | FRI | LERG | yes | igm | igm | c-x |
| 86.0 | ? | UNID | - | - | ||||
| 88.0 | 0.030221 | RG | FRI | LERG | yes | k;igm | igm | c-x |
| 89.0 | 0.13981 | RG | FRI-WAT | LERG | yes | igm | c | |
| 91.0 | ? | UNID | - | - | ||||
| 93.0 | 0.35712 | QSO | e | c | ||||
| 93.1 | 0.243 | RG | FRII-CSS | HERG | yes | c | ||
| 98.0 | 0.030454 | RG | FRII-XS | HERG | l | l | c-x | |
| 99.0 | 0.426 | SEY | - | Sy2 | c | |||
| 103.0 | 0.33 | RG | FRII | c | ||||
| 105.0 | 0.089 | RG | FRII | HERG | k;h | c-x | ||
| 107.0 | 0.785 | RG | FRII | HERG | l | c | ||
| 109.0 | 0.3056 | RG | FRII | HERG | h;l | c-x | ||
| 111.0 | 0.0485 | RG | FRII | k;h | c-x | |||
| 114.0 | 0.815 | RG | FRII | LERG | c | |||
| 119.0 | 1.023 | QSO | CSS | c | ||||
| 123.0 | 0.2177 | RG | FRII | LERG | yes | h;igm | c | |
| 124.0 | 1.083 | RG | FRII | HERG | e | c | ||
| 125.0 | ? | UNID | - | - | ||||
| 129.0 | 0.0208 | RG | FRI-NAT | yes | k;igm | igm | c-x | |
| 129.1 | 0.0222 | RG | FRI | yes | igm | igm | c-x | |
| 130.0 | 0.109 | RG | FRI-WAT | igm | c | |||
| 131.0 | ? | UNID | - | - | ||||
| 132.0 | 0.214 | RG | FRII | LERG | yes | c-x | ||
| 133.0 | 0.2775 | RG | FRII | HERG | c | |||
| 134.0 | ? | UNID | - | - | ||||
| 135.0 | 0.12738 | RG | FRII | HERG | yes | c | ||
| 136.1 | 0.064 | RG | FRII-XS | HERG | e | c | ||
| 137.0 | ? | UNID | - | - | ||||
| 138.0 | 0.759 | QSO | CSS | c | ||||
| 139.2 | ? | UNID | - | - | ||||
| 141.0 | ? | UNID | - | - | ||||
| 142.1 | 0.4061 | RG | FRII | c | ||||
| 147.0 | 0.545 | QSO | CSS | c | ||||
| 152.0 | ? | UNID | - | - | ||||
| 153.0 | 0.2769 | RG | FRII | LERG | yes | c-x | ||
| 154.0 | 0.58 | QSO | e;k | c | ||||
| 158.0 | ? | UNID | - | - | ||||
| 165.0 | 0.2957 | RG | FRII | LERG | e | c | ||
| 166.0 | 0.2449 | RG | FRII | LERG | c | |||
| 169.1 | 0.633 | RG | FRII | HERG | c | |||
| 171.0 | 0.2384 | RG | FRII | HERG | e | c-x | ||
| 172.0 | 0.5191 | RG | FRII | HERG | c | |||
| 173.0 | 1.035 | QSO | CSS | HERG | c | |||
| 173.1 | 0.2921 | RG | FRII | LERG | yes | h;l | c | |
| 175.0 | 0.77 | QSO | c | |||||
| 175.1 | 0.92 | RG | FRII | HERG | c | |||
| 180.0 | 0.22 | RG | FRII | HERG | c |
| 3CR | class | radio | optical | Cluster | Chandra | XMM-Newton | X-ray | |
|---|---|---|---|---|---|---|---|---|
| name | morph. | class | flag | detections | detections | obs. | ||
| 181.0 | 1.382 | QSO | h | c | ||||
| 184.0 | 0.994 | RG | FRII | HERG | yes | l | igm | c-x |
| 184.1 | 0.1182 | RG | FRII | HERG | yes | c | ||
| 186.0 | 1.06551 | QSO | CSS | yes | igm | c | ||
| 187.0 | 0.465 | RG | FRII | LERG | e;l | c | ||
| 190.0 | 0.24639 | QSO | CSS | c | ||||
| 191.0 | 1.96810 | QSO | k;l | c | ||||
| 192.0 | 0.05968 | RG | FRII-XS | HERG | yes | l | igm | c-x |
| 194.0 | 1.184 | RG | FRII | HERG | c | |||
| 196.0 | 0.87063 | QSO | c | |||||
| 196.1 | 0.198 | RG | FRII | LERG | yes | igm | c | |
| 197.1 | 0.12825 | RG | FRII | HERG | yes | c | ||
| 198.0 | 0.08145 | RG | FRII | HERG | yes | c | ||
| 200.0 | 0.458 | RG | FRII | LERG | yes | k;l | c | |
| 204.0 | 1.112 | QSO | c-x | |||||
| 205.0 | 1.53154 | QSO | c-x | |||||
| 207.0 | 0.68038 | QSO | LDQ | yes | k;l | igm | c-x | |
| 208.0 | 1.11151 | QSO | c | |||||
| 208.1 | 1.02 | QSO | c-x | |||||
| 210.0 | 1.169 | RG | FRII | HERG | yes | e;h | igm | c-x |
| 212.0 | 1.04931 | QSO | LDQ | e;h | c | |||
| 213.1 | 0.19405 | RG | FRI-CSS | LERG | yes | e;h | c | |
| 215.0 | 0.41106 | QSO | yes | k;l | c-x | |||
| 216.0 | 0.67002 | QSO | c | |||||
| 217.0 | 0.8975 | RG | FRII | HERG | c | |||
| 219.0 | 0.17456 | RG | FRII | HERG | yes | k;l | c | |
| 220.1 | 0.61 | RG | FRII | HERG | yes | igm | c | |
| 220.2 | 1.15610 | QSO | h;l | c | ||||
| 220.3 | 0.68 | RG | FRII | c | ||||
| 222.0 | 1.339 | RG | FRI | c | ||||
| 223.0 | 0.13673 | RG | FRII | HERG | yes | igm | c-x | |
| 223.1 | 0.1075 | RG | FRII-XS | HERG | c | |||
| 225.0A | 1.565 | RG | FRII | c | ||||
| 225.0B | 0.58 | RG | FRII | HERG | h | c | ||
| 226.0 | 0.8177 | RG | FRII | c | ||||
| 227.0 | 0.086272 | RG | FRII | HERG | h | c | ||
| 228.0 | 0.5524 | RG | FRII | HERG | e;h | c | ||
| 230.0 | 1.487 | RG | FRII | HERG | c | |||
| 231.0 | 0.000677 | RG | FRI | LERG | c-x | |||
| 234.0 | 0.184925 | RG | FRII | HERG | h | c-x | ||
| 236.0 | 0.1005 | RG | FRII | LERG | c | |||
| 237.0 | 0.877 | RG | FRII-CSS | c | ||||
| 238.0 | 1.405 | RG | FRII | HERG | c | |||
| 239.0 | 1.781 | RG | FRII | x | ||||
| 241.0 | 1.617 | RG | FRII | c-x | ||||
| 244.1 | 0.428 | RG | FRII | HERG | yes | e | c-x | |
| 245.0 | 1.027872 | QSO | k | c | ||||
| 247.0 | 0.7489 | RG | FRII | HERG | yes | c | ||
| 249.0 | 1.554 | QSO | x | |||||
| 249.1 | 0.3115 | QSO | c-x | |||||
| 250.0 | ? | UNID | - | - |
| 3CR | class | radio | optical | Cluster | Chandra | XMM-Newton | X-ray | |
|---|---|---|---|---|---|---|---|---|
| name | morph. | class | flag | detections | detections | obs. | ||
| 252.0 | 1.1 | RG | FRII | c | ||||
| 254.0 | 0.736619 | QSO | LDQ | e;h | c | |||
| 255.0 | 1.355 | QSO | c | |||||
| 256.0 | 1.819 | RG | FRII | c | ||||
| 257.0 | 2.474 | QSO | x | |||||
| 258.0 | 0.165 | RG | FRI-CSS | LERG | yes | c | ||
| 263.0 | 0.646 | QSO | LDQ | h | c | |||
| 263.1 | 0.824 | RG | FRII | c | ||||
| 264.0 | 0.021718 | RG | FRI | LERG | yes | k | igm | c-x |
| 265.0 | 0.811 | RG | FRII | h;l | c | |||
| 266.0 | 1.275 | RG | FRII | c-x | ||||
| 267.0 | 1.14 | RG | FRII | c | ||||
| 268.1 | 0.97 | RG | FRII | h | c | |||
| 268.2 | 0.362 | RG | FRII | yes | e;h | c-x | ||
| 268.3 | 0.37171 | RG | FRII | c | ||||
| 268.4 | 1.402200 | QSO | c-x | |||||
| 270.0 | 0.007378 | RG | FRI | LERG | yes | k | igm | c-x |
| 270.1 | 1.528432 | QSO | c | |||||
| 272.0 | 0.944 | RG | FRII | c | ||||
| 272.1 | 0.003392 | RG | FRI | LERG | yes | k | c-x | |
| 273.0 | 0.158339 | QSO | CDQ | k | c-x | |||
| 274.0 | 0.0043 | RG | FRI | LERG | yes | k;igm | igm | c-x |
| 274.1 | 0.422 | RG | FRII | HERG | e | l | c-x | |
| 275.0 | 0.48 | RG | FRII | LERG | yes | c | ||
| 275.1 | 0.5551 | QSO | LDQ | k;h;l | c | |||
| 277.0 | 0.414 | RG | FRII | c | ||||
| 277.1 | 0.31978 | QSO | c | |||||
| 277.2 | 0.766 | RG | FRII | HERG | c-x | |||
| 277.3 | 0.085336 | RG | FRII | HERG | c | |||
| 280.0 | 0.996 | RG | FRII | yes | k;h;l | c-x | ||
| 280.1 | 1.667065 | QSO | l | |||||
| 284.0 | 0.239754 | RG | FRII | HERG | yes | igm | c-x | |
| 285.0 | 0.0794 | RG | FRII | HERG | l | c | ||
| 286.0 | 0.849934 | QSO | c | |||||
| 287.0 | 1.055 | QSO | c-x | |||||
| 287.1 | 0.2156 | RG | FRII | HERG | h | c | ||
| 288.0 | 0.246 | RG | FRI | LERG | yes | igm | c | |
| 288.1 | 0.96296 | QSO | c | |||||
| 289.0 | 0.9674 | RG | FRII | c | ||||
| 292.0 | 0.71 | RG | FRII | HERG | yes | e | igm | c-x |
| 293.0 | 0.045034 | RG | FRI | LERG | e | c | ||
| 293.1 | 0.709 | RG | FRII | c | ||||
| 294.0 | 1.779 | RG | FRII | yes | h;igm | c | ||
| 295.0 | 0.4641 | RG | FRII | LERG | yes | h;igm | c | |
| 296.0 | 0.024704 | RG | FRI | LERG | yes | k;igm | igm | c-x |
| 297.0 | 1.4061 | QSO | c | |||||
| 298.0 | 1.438120 | QSO | yes | igm | c-x | |||
| 299.0 | 0.367 | RG | FRII | yes | h | c | ||
| 300.0 | 0.27 | RG | FRII | HERG | c-x |
| 3CR | class | radio | optical | Cluster | Chandra | XMM-Newton | X-ray | |
|---|---|---|---|---|---|---|---|---|
| name | morph. | class | flag | detections | detections | obs. | ||
| 300.1 | 1.15885 | RG | FRII | HERG | c | |||
| 303.0 | 0.141186 | RG | FRII | HERG | yes | k;l | c | |
| 303.1 | 0.2704 | RG | FRII-CSS | HERG | e | c-x | ||
| 305.0 | 0.041639 | RG | FRII-CSS | HERG | e | c-x | ||
| 305.1 | 1.132 | RG | FRII-CSS | LERG | c | |||
| 306.1 | 0.441 | RG | FRII | HERG | yes | e | c | |
| 309.1 | 0.905 | QSO | e | c | ||||
| 310.0 | 0.0538 | RG | FRI | LERG | yes | igm | c | |
| 314.1 | 0.1197 | RG | FRI | LERG | yes | c-x | ||
| 313.0 | 0.461 | RG | FRII | HERG | yes | h;igm | c | |
| 315.0 | 0.1083 | RG | FRI-XS | LERG | yes | e | c | |
| 317.0 | 0.034457 | RG | FRI | LERG | yes | igm | igm | c-x |
| 318.0 | 1.574 | RG | FRII | yes | c-x | |||
| 318.1 | 0.045311 | RG | FRI | yes | igm | igm | c-x | |
| 319.0 | 0.192 | RG | FRII | LERG | yes | c-x | ||
| 320.0 | 0.342 | RG | FRII | yes | igm | c | ||
| 321.0 | 0.0961 | RG | FRII | HERG | h;l | c-x | ||
| 322.0 | 1.681 | RG | FRII | yes | igm | x | ||
| 323.0 | 0.679 | RG | FRII | e | c | |||
| 323.1 | 0.2643 | RG | FRII | HERG | yes | c | ||
| 324.0 | 1.2063 | RG | FRII | yes | e;h | c-x | ||
| 325.0 | 1.135 | RG | FRII | h | c | |||
| 326.0 | 0.0895 | RG | FRII | LERG | l | c | ||
| 326.1 | 1.825 | RG | FRII | |||||
| 327.0 | 0.1048 | RG | FRII | HERG | yes | h | c | |
| 327.1 | 0.462 | RG | FRI | HERG | k | c-x | ||
| 330.0 | 0.55 | RG | FRII | HERG | yes | h;l | c | |
| 332.0 | 0.151019 | RG | FRII | HERG | yes | c | ||
| 334.0 | 0.5551 | QSO | LDQ | k;l | c | |||
| 336.0 | 0.926542 | QSO | c | |||||
| 337.0 | 0.635 | RG | FRII | yes | e | c-x | ||
| 338.0 | 0.030354 | RG | FRI | LERG | yes | igm | igm | c-x |
| 340.0 | 0.7754 | RG | FRII | c | ||||
| 341.0 | 0.448 | RG | FRII | HERG | yes | e;k | igm | c-x |
| 343.0 | 0.988 | QSO | c | |||||
| 343.1 | 0.75 | RG | FRII | c | ||||
| 345.0 | 0.5928 | QSO | CDQ | yes | k | igm | c-x | |
| 346.0 | 0.162012 | RG | FRI | HERG | yes | k | c | |
| 348.0 | 0.155 | RG | FRI | LERG | yes | igm | igm | c-x |
| 349.0 | 0.205 | RG | FRII | HERG | h | c-x | ||
| 351.0 | 0.37194 | RG | FRII | h | c | |||
| 352.0 | 0.8067 | RG | FRII | c | ||||
| 353.0 | 0.030421 | RG | FRII | LERG | yes | k:l:igm | igm | c-x |
| 356.0 | 1.079 | RG | FRII | e | c | |||
| 357.0 | 0.166148 | RG | FRII | LERG | yes | c | ||
| 368.0 | 1.131 | RG | FRII | c | ||||
| 371.0 | 0.051 | BLL | BL | - | k | c | ||
| 379.1 | 0.256 | RG | FRII | HERG | c | |||
| 380.0 | 0.692 | QSO | CDQ | k | c | |||
| 381.0 | 0.1605 | RG | FRII | HERG | c | |||
| 382.0 | 0.05787 | RG | FRII | HERG | c-x |
| 3CR | class | radio | optical | Cluster | Chandra | XMM-Newton | X-ray | |
|---|---|---|---|---|---|---|---|---|
| name | morph. | class | flag | detections | detections | obs. | ||
| 386.0 | 0.016885 | RG | FRI | LERG | yes | igm | c-x | |
| 388.0 | 0.0917 | RG | FRII | LERG | yes | e | c | |
| 389.0 | ? | UNID | - | - | x | |||
| 390.0 | ? | UNID | - | - | ||||
| 390.3 | 0.0561 | RG | FRII | HERG | k;h | c-x | ||
| 394.0 | ? | UNID | - | - | ||||
| 399.1 | ? | UNID | - | - | ||||
| 401.0 | 0.2011 | RG | FRII | LERG | yes | igm | c | |
| 402.0 | 0.025948 | RG | FRI | yes | k | c-x | ||
| 403.0 | 0.059 | RG | FRII | HERG | k;h | c | ||
| 403.1 | 0.0554 | RG | FRII | LERG | yes | c | ||
| 405.0 | 0.056075 | RG | FRII | yes | h;igm | igm | c-x | |
| 409.0 | ? | UNID | - | - | ||||
| 410.0 | 0.2485 | RG | FRII | c | ||||
| 411.0 | 0.467 | RG | FRII | HERG | c-x | |||
| 415.2 | ? | UNID | - | - | ||||
| 418.0 | 1.686 | QSO | ||||||
| 424.0 | 0.126988 | RG | FRI | LERG | yes | e | c | |
| 427.1 | 0.572 | RG | FRII | LERG | yes | l;igm | c | |
| 428.0 | ? | UNID | - | - | ||||
| 430.0 | 0.055545 | RG | FRII | LERG | yes | e | c | |
| 431.0 | ? | UNID | - | - | ||||
| 432.0 | 1.785 | QSO | c-x | |||||
| 434.0 | 0.322 | RG | FRII | yes | c | |||
| 433.0 | 0.1016 | RG | FRII | HERG | l | c | ||
| 435.0 | 0.471 | RG | FRII | c | ||||
| 436.0 | 0.2145 | RG | FRII | HERG | e;h | c-x | ||
| 437.0 | 1.48 | RG | FRII | e;h | c | |||
| 438.0 | 0.29 | RG | FRII | HERG | yes | igm | c | |
| 441.0 | 0.708 | RG | FRII | c | ||||
| 442.0 | 0.0263 | RG | FRI | LERG | yes | igm | c | |
| 445.0 | 0.055879 | RG | FRII | yes | h | c-x | ||
| 449.0 | 0.017085 | RG | FRI | LERG | yes | igm | igm | c-x |
| 452.0 | 0.0811 | RG | FRII | HERG | yes | h;l | igm | c-x |
| 454.0 | 1.757 | QSO | x | |||||
| 454.1 | 1.841 | RG | FRII | yes | ||||
| 454.2 | ? | UNID | - | - | ||||
| 454.3 | 0.859 | QSO | CDQ | k | c-x | |||
| 455.0 | 0.543 | QSO | c | |||||
| 456.0 | 0.233 | RG | FRII | HERG | c | |||
| 458.0 | 0.289 | RG | FRII | HERG | yes | h | c | |
| 459.0 | 0.22012 | RG | FRII | l | c-x | |||
| 460.0 | 0.268 | RG | FRII | LERG | yes | c-x | ||
| 465.0 | 0.030221 | RG | FRI-WAT | LERG | yes | k;igm | igm | c-x |
| 468.1 | ? | UNID | - | - | ||||
| 469.1 | 1.336 | RG | FRII | l | c-x | |||
| 470.0 | 1.653 | RG | FRII | h | c |