Improved Main Sequence Turnoff Ages of Young Open Clusters:
Multicolor UBV Techniques &
the Challenges of Rotation
Abstract
Main sequence turnoff ages in young open clusters are complicated by turnoffs that are sparse, have high binarity fractions, can be affected by differential reddening, and typically include a number of peculiar stars. Furthermore, stellar rotation can have a significant effect on a star’s photometry and evolutionary timescale. In this paper we analyze in 12 nearby open clusters, ranging from ages of 50 Myr to 350 Myr, how broadband UBV color-color relations can be used to identify turnoff stars that are Be stars, blue stragglers, certain types of binaries, or those affected by differential reddening. This UBV color-color analysis also directly measures a cluster’s E(B–V) and estimates its [Fe/H]. The turnoff stars unaffected by these peculiarities create a narrower and more clearly defined cluster turnoff. Using four common isochronal models, two of which consider rotation, we fit cluster parameters using these selected turnoff stars and the main sequence. Comparisons of the photometrically fit cluster distances to those based on Gaia DR2 parallaxes find that they are consistent for all clusters. For older (100 Myr) clusters, like the Pleiades and the Hyades, comparisons to ages based on the lithium depletion boundary method finds that these cleaned turnoff ages agree to within 10% for all four isochronal models. For younger clusters, however, only the Geneva models that consider rotation fit turnoff ages consistent with lithium-based ages, while the ages based on non-rotating isochrones quickly diverge to become 30% to 80% younger. This illustrates the importance of rotation for deriving ages in the youngest (100 Myr) clusters.
1. Introduction
Open clusters provide an ideal environment to study star formation, stellar physics, and nearly all aspects of stellar evolution. This is driven by their large sample of stars being at effectively the same initial composition, age, distance, and reddening. For characterizing processes of stellar evolution using clusters, one of the most important factors is cluster age. This allows multiple clusters across different ages to be used to trace the evolution of, for example, stellar rotation rates (e.g., Kawaler 1988, Barnes 2003), lithium abundances (e.g., Cummings et al. 2012, 2017), cluster metallicity or abundances (e.g., Reddy et al. 2016), and their populations of peculiar stars (e.g., Marco et al. 2007). The most straightforward method of analyzing cluster ages is simply through analysis of their highest mass stars that are beginning to evolve beyond the main sequence in the main sequence turnoff (hereafter MSTO). Plotting the cluster stars in a color-magnitude diagram (hereafter CMD) and fitting the main sequence, the MSTO, and, when available, the giants with a theoretical isochrone provides a cluster age.
Multiple challenges exist, however, with deriving precise cluster ages from fitting the MSTO. For example, the isochrones themselves are sensitive to the model assumptions, including how convection and overshoot are handled. Next, fitting isochrones is dependent on adopted cluster reddening, cluster chemical compositions, and cluster distances. Differential reddening and binarity can further compound the challenge of MSTO analysis. One of the most complex challenges for MSTO analysis is stellar rotation. The understanding of rotation and its models have improved (see the review in Maeder & Meynet 2000 and subsequent work by the Geneva group and Choi et al. 2016), but there remain limitations and inconsistencies between models. Rotation affects nearly all aspects of stellar evolution, including the observed characteristics of stars. MSTOs with stars spanning a large range of rotations and observation angles are significantly broadened (Georgy et al. 2014).
These MSTO challenges are the most important in younger clusters (200 Myr). Their MSTOs are defined by intermediate and higher mass stars, which are fewer in number, have high binarity fractions (Raboud 1996, Dunstall et al. 2015), and have rotation rates spanning from slow to nearly critical rotation (Huang et al. 2010). Such rapidly rotating stars not only undergo the effects of rotation but can also expel material into circumstellar decretion disks. These ‘Be’ stars are typically B dwarfs and produce Balmer emission lines. While they are very well studied objects, understanding their formation and evolution remains complex (see Rivinius et al. 2013). In general, however, they can either appear bright and blue or faint and red based on the angle of observation and the disk’s contribution to or occultation of the star’s light. These Be stars further broaden MSTO photometry, but even after their removal the current rotational models alone still cannot explain the full widths of young cluster MSTOs (e.g., Milone et al. 2015, Correnti et al. 2017).
A method to determine young cluster ages that bypasses many of these challenges is to derive ages from the rich sample of lower-mass cluster members. For example, the lithium depletion boundary (hereafter LDB) method uses lithium (hereafter Li) abundances of low-mass M dwarfs (e.g., D’Antona & Mazzitelli 1994, Jeffries & Naylor 2001). LDB ages are believed to be less sensitive to model assumptions (Soderblom et al. 2014), but they still have moderate sensitivity to magnetic fields and surface activity (e.g., Somers & Pinsonneault 2014). Additionally, the challenge of spectroscopically observing Li abundances in the lowest-mass members of a young cluster is difficult to overcome in all but the nearest and most well defined Galactic clusters. However, these LDB ages provide a valuable independent check of MSTO ages and methods.
In Cummings et al. (2016; hereafter Paper I), we used Johnson UBV color-colors of young cluster to analyze their reddening and metallicity, as is traditionally done, but we also used color-color analysis to identify higher-mass MSTO stars unaffected by peculiarities or differential reddening. The CMD analysis of these selected MSTO stars provided a uniformly analyzed set of cluster ages. These six clusters also had white dwarf members with spectroscopically determined masses and cooling ages, and combined with the cluster ages this gave each white dwarf’s progenitor evolutionary timescale, and hence its progenitor mass. These improved MSTO cluster ages gave an initial-final mass relation with observed scatter 50% smaller than previous relations.
Here we will improve this UBV color-color technique and more directly analyze which MSTO challenges it can mitigate, if not address, and reanalyze these six original clusters plus six additional young clusters. An advantage of this technique is that Johnson broadband UBV photometry of cluster MSTO stars is relatively easy to acquire, if not already available, compared to other techniques to analyze peculiarities that require either narrow-band photometry or spectroscopy of MSTO stars. More broadly speaking, while it will not be analyzed here, similar techniques can likely also be applied to color-color relations involving near-ultraviolet (NUV) filters like Sloan u and HST’s F336W.
The layout of the paper is as follows. In Section 2 we will describe four common model isochrones, and for the two that include rotation, we will look at how their predicted photometric effects of rotation compare. In Section 3 we will discuss 12 young open clusters and their UBV color-color diagrams, and use them to measure their reddening, estimate their metallicity, and identify peculiar types of higher-mass MSTO stars, in particular, those that could complicate age analysis. In Section 4 we will discuss the fitting methods of these cleaned cluster MSTOs, where these peculiar stars have been removed. We will also look at how the differences in stellar models affect the derived ages and distance moduli. In Section 5 we will compare the distance moduli of 10 of these 12 clusters, plus of 4 additional young and intermediate aged clusters, to those from the Gaia data release 2 (DR2; Gaia Collaboration et al. 2016, 2018a). We will also compare these MSTO ages to the LDB ages for five of these clusters. In Section 6 we will summarize our results and conclusions.
2. Stellar Models & Isochrones
In Paper I we photometrically analyzed six young clusters using both Yale-Yonsei isochrones (Yi et al. 2001; hereafter Y2 isochrones) and PARSEC isochrones (Bressan et al. 2012) version 1.2S111Available at http://stev.oapd.inaf.it/cgi-bin/cmd. In this paper we continue to use the original Y2 isochrones and the newly updated PARSEC isochrones (version 1.2S+COLIBRI PR16 from Marigo et al. 2017). These updated PARSEC isochrones include better post-main sequence evolution and improve the main sequence colors and matching.
To expand the analysis of cluster parameters and to consider the important effects of rotation, we will also compare to the MIST isochrones (Dotter 2016, Choi et al. 2016; version 1.1), which are based on Modules for Experiments in Stellar Astrophysics (MESA; Paxton et al. 2011, 2013, 2015). MIST has isochrones for both non-rotating stars and for stars initially rotating at 0.4 of their critical rotation velocity (hereafter ). Choi et al. (2016) applies these initial rotations only for stars more massive than 1.8 M⊙, followed by a gradual slow down to zero rotation from 1.8 to 1.2 M⊙. Rotation in these lower-mass stars was not considered by Choi et al. (2016) because they did not model magnetic braking, which becomes crucial for angular momentum loss in these lower masses (1.2 M⊙) with surface convection zones (Kraft 1967). For the higher-mass stars, the adoption of 0.4 of is appropriate based on cluster B-star observations (Huang et al. 2010), where there is a broad observed distribution spanning the full range of rotation rates and with a peak near 0.4 to 0.5 of vcrit. To further consider the effects of rotation in the MIST models, Choi et al. (2017) also give isochrones for stars initially rotating at 0.5 and 0.6 of , but they only include stellar parameters and not UBV photometry.
Driven by the differences in current rotational model predictions (see Section 2.1), here we also consider the Geneva stellar models (Ekström et al. 2012, Georgy et al. 2013, 2014; hereafter the SYCLIST models). The SYCLIST models model initial rotation rates from non-rotating to nearly critical rotation for stars from 1.7 to 15 M⊙. For the full stellar mass range they model non-rotating stars and those with initial rotations at 0.568 of their critical angular momentum, which is equivalent to 0.4 of based on the relation defined in Ekström et al. (2008). These SYCLIST models are important for considering the complete range of rotation’s potential effects, but the available isochrones only have 3 metallicities with no available interpolation at Z=0.002, 0.006, and 0.014 (Z=0.014 is their adopted solar Z). This limits our ability to apply isochrones of appropriate metallicity to the cluster analysis, and so we will use these for only clusters that are at or very near solar metallicity.
It is important to reiterate that for both MIST and SYCLIST models, these model rotation rates are initial rotation rates. Both models consider appropriate angular momentum loss during stellar evolution and its consequences, and we refer the reader to Choi et al. (2016) and Georgy et al. (2013), respectively, for detailed discussions of how each rotational model accounts for this important factor.
Comparing the detailed physics of all of these models is beyond the scope of this paper, but it is important to note how these models scale metallicity. Methods of deriving cluster [Fe/H], both spectroscopic and photometric, are all relative and insensitive to what solar composition (hereafter Z⊙) is adopted, but stellar isochrones use absolute Z-scale abundances. The Y2 isochrones adopt Z⊙=0.018 from Grevesse and Sauval (1998), while the PARSEC models adopt Z⊙=0.0152, the MIST models adopt Z⊙=0.0142, the SYCLIST models adopt Z⊙=0.014. Here we apply the same [Fe/H] to all isochrones matched to a given cluster, but we scale each isochrone’s Z abundance according to their adopted Z⊙. Like with [Fe/H], the color-color determination of cluster reddening (E(B–V)) is also insensitive to adopted composition, and we similarly apply the same reddening to all isochrones matched to a given cluster.
2.1. Effects of Rotation on Stellar Isochrones
Both the MIST and SYCLIST stellar evolutionary models account for rotation and angular momentum loss from the pre-main sequence to the asymptotic giant branch, if not beyond for a subset of MIST isochrones. The effects of rotation remain challenging to model, but it has been known to play an important role in nearly all aspects of stellar evolution (see Maeder & Maynet 2000). The magnitude of these effects remains sensitive to many factors, including the adopted efficiency of various types of rotational mixing and loss of angular momentum, which still remain poorly understood. We will consider throughout this paper the effects of rotation based on the MIST models, but we will also reference the SYCLIST models, which adopt more efficient rotational mixing and have typically stronger rotational effects.
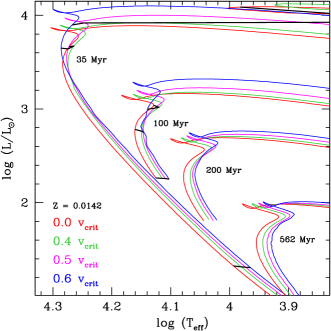
In Figure 1 we show MIST isochrones at ages of 35, 100, 200, and 562 Myr with no rotation and with initial rotation rates of 0.4, 0.5, and 0.6 of 222For reference to the SYCLIST models, they define their rotations in terms of angular momentum and not equatorial velocity. Based on the relation derived in Ekström et al. (2008), a rotation of 0.6 of is approximately 0.8 of the critical angular momentum of a star.. Rotation produces two generally competing factors in a uniform-age MSTO. First, rotation inflates the equatorial radius of a star, making it cooler but primarily conserving its total luminosity. This is seen throughout the main sequence and the MSTO. Second, rotation extends the lifetime of a star due to mixing additional hydrogen into its core. This does not significantly affect the main sequence colors, but as stars approach the MSTO at a given mass the slowest rotators begin to evolve redward while the fastest rotators remain bluer and on the main sequence longer. In Figure 1 this is seen most clearly at 35 Myr. When increasing from non-rotating to 0.4 of , the MSTO first becomes cooler because of radius inflation, but at these higher masses for rotations of 0.5 to 0.6 of the changes in evolutionary timescale begin to dominate and even with inflation they remain bluer. In Figure 1 we help illustrate these effects by drawing black lines connecting several equal mass examples across the MIST isochrones at 35 Myr and 100 Myr. For isochrones at 100 Myr and older the blue edge of the main sequence and MSTO model distribution are defined well by the non-rotating isochrones, but the MSTOs are more complex at younger ages.
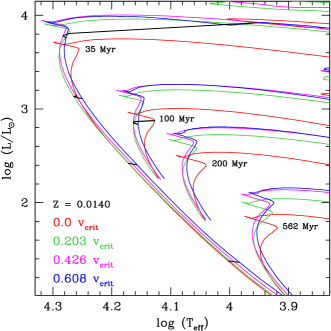
For rotating stars, the magnitude of radius inflation is relatively insensitive to the details of the rotational models. How much rotation affects the evolutionary timescale of a star, however, is very sensitive to the model’s adopted magnitude of rotational mixing. For comparison, Figure 2 shows a series of SYCLIST isochrones across a similar range of initial rotation rates, and for a given rotation these adopt more mixing. Hence, the main sequence variations appear comparable to those of the MIST models, but the SYCLIST MSTOs become more sensitive to rotation (Georgy et al. 2014). At the MSTOs for all ages the isochrones with rotation all deviate significantly from the non-rotating isochrone, and in these models the 0.426 of (0.6 of ) isochrone defines well the blue edge of each MSTO’s model distribution. To again help illustrate rotation’s effects, we draw a series of solid black lines connecting several equal-mass examples across isochrones at a given age.
Lastly, the luminosities and Teff plotted in Figure 1 and 2 are total output luminosity and mean Teff. With increasing rotation, a star becomes increasingly oblate, and with gravitational darkening, there are increasing variations of Teff across its surface with the poles being the hottest and the equator being the coolest. Therefore, a star’s observed color and magnitude become increasingly sensitive to the observed inclination angle (see Townsend et al. 2004, Georgy et al. 2014). Below rotations of 0.5 of these effects are not typically important, but they become moderate for stars at rotations from 0.5 to 0.6 of , especially for the extreme cases of 0o and 90o angles. At rotation rates of 0.7 of and faster, the effects of observation angle become significant.
3. Color-Color Analysis
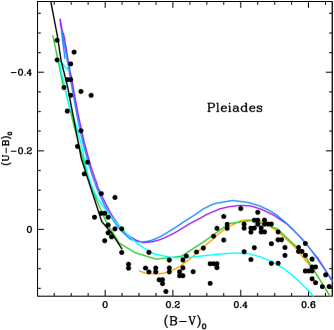
In Paper I we considered preliminary color-color (U–B versus B–V) techniques to address the challenges of higher-mass MSTOs and to identify likely problematic stars. Figure 3 shows the color-color diagram for the Pleiades MSTO and main sequence stars with photometry from Johnson & Mitchell (1958). Only stars with Gaia DR2 parallaxes and proper motions consistent with Pleiades membership are displayed. When plotting young cluster MSTO stars in color-color space ((B–V)0 0.1) they show a generally linear and consistent trend but also exhibit stars that deviate from this “normal” trend. Here we will analyze what these deviations may represent.
First, these hotter MSTO stars ((B–V)0 0.1) have a U–B versus B–V relation that is not sensitive to metallicity, unlike stars at redder colors. This results from three factors, first, at hotter temperatures the bound-free and free-free opacities dominate here rather than the more metal sensitive H- opacity. Second, the U band is full of metal lines in cooler stars, which causes strong line blanketing, but this is less important at these hotter temperatures. Third, while more metal-rich stars here still become marginally redder in B–V, they also become redder in U–B in a manner that shifts them along, rather than away from the U–B versus B–V relation (see the illustration of this in Figure 2 of Paper I). Furthermore, as a cluster ages the position of the color-color trend does not evolve or change meaningfully for main sequence stars or even for subgiants (e.g., Fitzgerald 1970; hereafter F70). When stars at the top of the MSTO evolve to the red in B–V they fold back to the red in U–B along the same color-color trend. A cluster’s age only affects how far its MSTO extends to the blue in U–B versus B–V.
Reddening is the only cluster parameter that affects the position of a young cluster’s MSTO color-color relation. Therefore, the MSTO color-colors provide a reddening that is independent of a cluster’s metallicity, age, and distance. This reddening sensitivity will also cause MSTO stars that are affected by differential reddening across the field of an open cluster to deviate from the primary cluster color-color data. In Figure 4 this color-color sensitivity to E(B–V) is illustrated. However, differential reddening is not the only source causing stars to deviate in color-color. We will discuss in Section 3.2 the effects on UBV color-color trends of binarity, stellar disks, chemically peculiar stars, rapid rotation, and classical blue stragglers, all of which are stars that can affect MSTO age fits.
3.1. Empirical Versus Theoretical Relations
Before we can analyze which stars have a normal color-color relation, we must define this relation. Additionally, with the color-color relation’s sensitivity to reddening, the method of applying the reddening to an empirical or theoretical reference is foundational to the cluster analysis. For E(B–V), like in Paper I, we again use its intrinsic dependence on (B–V)0 from Schmidt-Kaler (1961) as described in Fernie (1963). For E(U–B), in Paper I we simply adopted that E(U–B)=E(B–V)0.685. Here we use the transformation from E(B–V) to E(U–B) from Crawford & Madwewala (1976), using their version that is based on the interstellar absorption curves of Whitford (1958). This more detailed transformation from E(B–V) to E(U–B) is comparable to our Paper I adoption but also incorporates a sensitivity to a star’s intrinsic (B–V)0. This will have important effects on the analysis of clusters with moderate reddenings near E(B–V)=0.20. We acknowledge that variations in these reddening relations may exist in different regions of the sky (e.g., Turner 1989), but all of the clusters analyzed here have low to moderate reddening where the consequences of these potential variations are minimal.
When analyzing color-color relations, the well-studied Hyades fiducial is commonly adopted as an empirical Johnson UBV magnitude reference at a single age and metallicity (Figure 3; orange line). It can be used to measure the reddening and estimate the cluster metallicity in lower-mass stars. (See Paper I for the methods of measuring reddening and metallicity using the Hyades relation.) The metallicity corrected Hyades fiducial, however, cannot be used to analyze the higher-mass MSTO stars in young clusters because it is an intermediate-aged cluster where these stars have fully evolved.
The Y2 color-color isochrone (Figure 3; green line) at intermediate- and low-masses ((B–V)0 0.3) closely matches the metallicity corrected Hyades fiducial. For the Pleiades and other young clusters, matching the Y2 model to the higher-mass MSTO stars finds an identical reddening to that derived with matching the Hyades fiducial to the lower-mass main sequence (see Paper I and its Figure 2). Therefore, in Paper I we adopted the Y2 isochrones to directly measured reddening at the MSTO, insensitive to the adopted age and metallicity, and to identify the normal MSTO stars.
In this paper we want to improve this technique to photometrically identify normal MSTO stars at these higher masses. We first test whether we can use isochronal models consistent with our subsequent CMD isochronal age analysis (Section 4). For the updated PARSEC isochrones (Figure 3; purple line), they follow the general observed trends, but the U magnitudes are too bright in the intermediate-mass stars and are marginally too bright in the MSTO stars. This requires a lower reddening (E(B–V)=0.015 compared to E(B–V)=0.03) to match the Pleiades MSTO observations.
Analyzing the MIST isochrone models (Figure 3; blue line) shows a similar color-color trend to that seen in the PARSEC models, with comparable inconsistencies with observations. The MIST isochrones for stars initially rotating at 0.4 of are not shown, but they are consistent at all colors other than a moderate difference for stars ranging from (B–V)0 of 0.1 to 0.4. The rotational sensitivity in this range results from the Balmer jump, which is in the U band and peaks in strength near a (B–V)0 of 0.0. From (B–V)0 of 0.1 to 0.4 the Balmer jump has an important sensitivity to both temperature and surface gravity, and hence the color-color relation here is sensitive to rotation. At higher Teff, however, where these young MSTO stars fall, the Balmer jump’s sensitivity to surface gravity, and hence rotation, greatly diminishes. More direct observational evidence that surface gravity plays no major role is that the F70 empirical color-color relations for subgiants and giants at this higher Teff range are consistent with that of main sequence.
Lastly, the SYCLIST model isochrones provide a complete range of initial rotations from non-rotating to 0.95 of (or 0.812 of ). Across this entire range of rotations, the MSTO model colors-colors are again not affected by rotation. The general trends and fit reddenings are consistent with that of the Y2 isochrones and the Pleiades observations, but for intermediate-mass stars the U magnitudes are far too bright and rapidly become too faint in the lower-mass stars.
The B and V magnitudes across all of these models are generally consistent, so these color-color differences illustrate the remaining challenges of synthesizing U magnitudes from stellar models. This also suggests that while neither these higher-mass MSTO models nor observations yet show evidence for rotation strongly affecting color-color relations, a more complete understanding of U magnitudes are necessary to explicitly state this. For the rest of this paper, however, we will adopt that the color-color relations of these MSTO are not affected by rotation.
To address these synthetic U challenges, F70 provides a solution because they give an empirical color-color relation derived from observations of nearby field stars. Taking advantage of the color-color trends of these higher-mass stars being insensitive to distance, metallicity, age, and rotation, the variations of these parameters in field stars do not affect the empirical relation. Additionally, because the stars F70 used are relatively nearby field dwarfs, the effects of reddening are limited, but F70 still adopted reddening correction methods to increase their dereddened sample and improve statistics.
In Figure 3 the F70 empirical relation matches well with the observed Pleiades and very well with the Y2 isochrone at –0.07 (B–V)0 +0.07, but the F70 relation at the bluest colors has a more rapid decrease in U–B with decreasing B–V. This curvature is comparable to the curvature predicted in both the MIST and PARSEC isochrones. These bluest stars are the most age sensitive and provide the best MSTO ages. Therefore, the adoption of the empirical F70 relation and of more detailed reddening relations strongly improves the methods from Paper I.
3.2. Color-Color Effects of Be Stars, Peculiar Abundances, Binarity & Errors
Differences in rotation, age, and composition are all commonly used to help explain the observed widths in young cluster MSTOs. However, the color-color relations for such stars are comparably insensitive to all of these parameters, and their MSTOs still remain broadly distributed in this space. Therefore, this provides a valuable tool to consider what other effects or peculiarities may be playing a role in broadening these complex young cluster MSTOs in both color-color and CMD space.
The first two peculiarities that we will consider are common in higher-mass MSTO stars: rapidly rotating Be stars and blue stragglers, which in young clusters are commonly but not always the same stars (e.g., Marco et al. 2007). Be stars are well studied but remain challenging to fully explain. The light contributed from their disks, which result from their rapid rotation, cause them to vary photometrically both optically and in the NUV in ways that make them deviate from the standard color-color trends (see discussions in Rivinius et al. 2013). The UBV color-color models of Sigut & Patel (2013) can reproduce the generally observed variability and its dependence on inclination angle. Be stars can go through phases of having increased NUV flux and phases of having decreased NUV flux relative to a normal B star (Zorec et al. 1983). The magnitude of NUV deviation from normal appears to correlate with the observed emission line strength (Harmanec 1983). In general the NUV flux decreases occur in Be shell stars (those seen edge on) with the disk occulting light from the star and NUV flux increases occur in Be stars seen closer to pole on. The variability may be explained by variations in the density of their disk, which dissipates and refills over time, and that a Be star can go through periods of having a weak disk and relatively normal colors and magnitudes.
This large variability of Be stars is further illustrated by Ghosh et al. (1999), with their spectroscopic re-observations of B stars originally defined as Bn stars (have strong rotational broadening but no emission). They found during a short period of re-observations that 10% of the Bn sample now do have emission and appear as normal Be stars. Conversely, several well studied Be stars have been observed to undergo multi-year periods without emission (e.g., Bjorkman et al. 2002, Miroshnichenko et al. 2012). This illustrates that a star can be identified as a Be in earlier spectroscopic observations, but it may go through phases of otherwise normal colors and luminosities, and the opposite is also true. This variability cautions against the comparison of spectroscopic identification of Be stars and their emission strengths from one epoch to photometric observations from another epoch. After acknowledging this caveat, however, the sample of spectroscopically identified Be stars in the 12 clusters in this paper can test if Be stars can generally be identified through their broadband color-color deviations alone.
For blue stragglers that are not identified as Be stars, the clusters studied here have a moderate sample (9) of such stars. While there is no clear understanding of how or why their color-color relations may differ from “normal” MSTO stars, if at all, our current analysis can test this. If they uniformly appear abnormal, this will be a valuable insight.
B- and A-type dwarfs also commonly have peculiar surface abundances. These can be driven by diffusive processes that affect slower rotators (e.g., Michaud 1970), where this slow rotation is typically caused by magnetic fields in Ap stars (Stȩpień 2000) or binary interaction in Am stars. Am and Ap stars have colors that typically make them appear more metal-rich. Hence, like general metallicity variations, the color-color trends in the MSTO stars are not believed to be sensitive to these surface abundance peculiarities. In early A dwarfs where the color-color trend plateaus and metallicity sensitivity becomes important, however, these peculiar abundances are common. This can partly explain why the color-color distribution significantly broadens in A dwarfs in most clusters. These peculiar abundance stars systematically fall below the trend here with increasing line blanketing causing redder (U–B)0 at comparable (B–V)0 (Stȩpień & Muthsam 1980). Fast rotating B and A dwarfs can also show peculiar abundances where rotational mixing enhances, for example, N and He at the surface (e.g., Maeder & Meynet 2000). The SYCLIST models do not predict that these abundance peculiarities will affect the color-color trends themselves, but this likely needs further study.
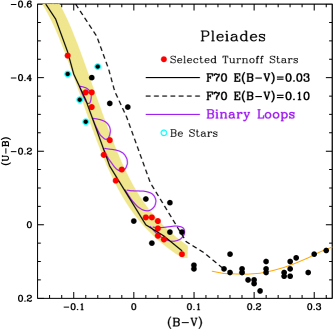
The effects of binarity are more complex in color-color space than in CMD space. In Figure 4, for primaries at five different masses/colors, we illustrate the effects of adding a companion ranging from an equal-mass companion to the lowest-mass companion. We base this on the main sequence photometric relations of the Y2 isochrones. These binary color-color trends create a complete loop because equal-mass companions will have the same colors while the lowest-mass companions will have such low luminosity that the integrated colors will be dominated by the primary. At the highest-mass primary considered, the effects are minor and mostly shift the integrated color-color along the normal relation and then back as the companion’s luminosity decreases. With decreasing primary mass the companion’s effects become more pronounced relative to the normal relation. This is because the color-color relation changes slope near a (B–V)0 of 0.0. If the primary is near this color, the secondary’s luminosity will contribute more meaningfully to the binary’s integrated colors as the secondary follows this slope change.
We define stars as consistent with the F70 relation if they are within the color-color band illustrated in Figure 4. The range of this band is based on the distribution of MSTO stars for all clusters analyzed, in addition to the distribution of Be stars and blue stragglers. The boundaries are created by shifting a smoothed F70 relation redward 0.017 magnitudes in (U–B)0 and blueward 0.020 magnitudes in (B–V)0. This band helps to define a sharp and consistent blue edge to the selected MSTO, and shifting the relation along two axes helps to account for the curvature in the relation. We define the faint end of the color-color selected MSTO stars at (U–B)0 = 0.06 and (B–V)0 = 0.06 because here metallicity effects become important and the complexity of the A dwarfs dominate. As seen in Figure 4 these cuts will not be sensitive to all binaries but will remove those with the largest affected colors. In Figure 4 we also show the four known Pleiades Be stars as data points outlined in cyan, all of which fall outside of the selected range. In Section 3.3 we will further analyze how this color-color range compares to previously identified Be stars, blue stragglers, and peculiar abundance stars in all 12 clusters.
Lastly, these are strict color-color cuts on these MSTO stars, and we note that the effects of random photometric errors may bring some peculiar stars to within the range of acceptance or cause otherwise normal stars to be cut. This is a challenge for photometrically defining normal versus peculiar MSTO stars, but this identification is not our final goal, the goal is measuring cluster parameters. We are using the same set of photometry for both the color-color and CMD analysis. If a normal MSTO star has large enough photometric error to cause it to fall outside the normal range and be removed during the color-color analysis, this error would also likely affect its CMD placement and potentially the cluster age fit. Low photometric errors are ideal and the photoelectric and CCD photometry used for all of these clusters (see Table 1) provides this in these bright MSTO stars, but the effects of random photometric errors on the final MSTO fits are mitigated with these methods.
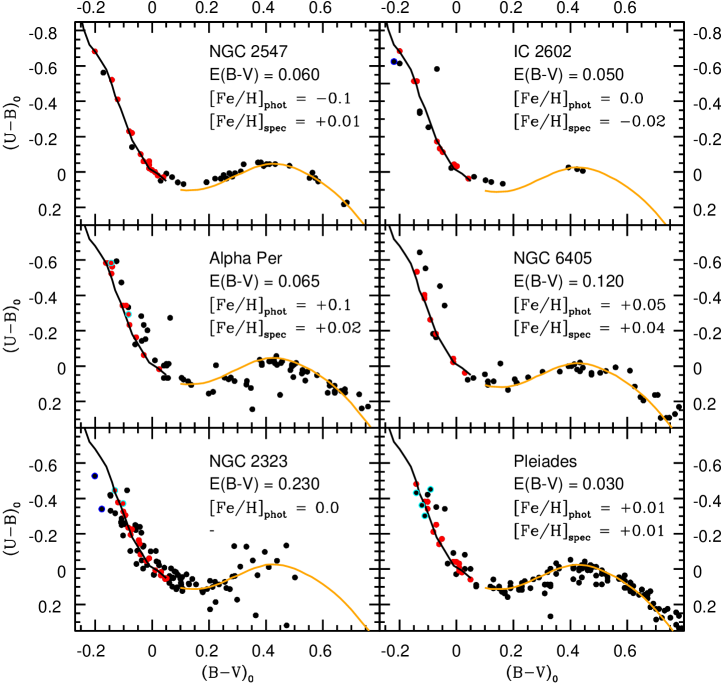
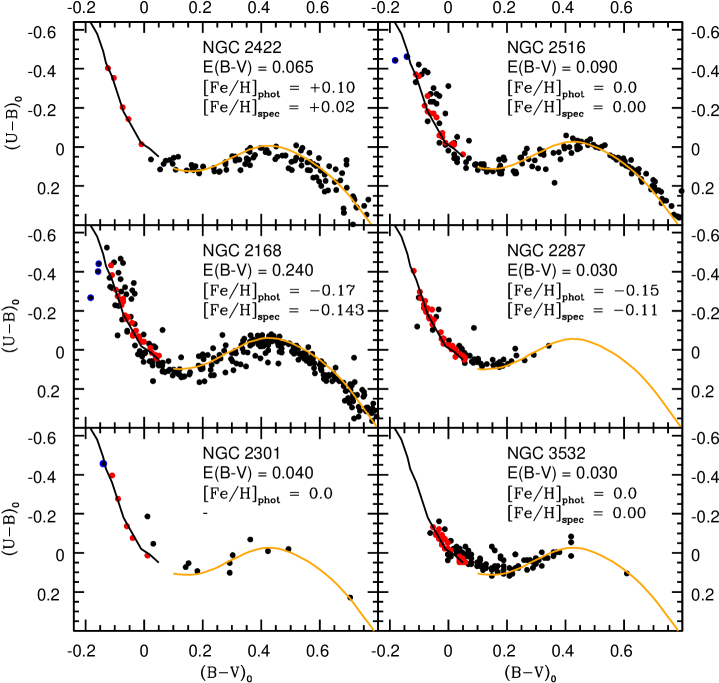
3.3. Analyzing Cluster Color-Color Parameters and Selecting Turnoff Stars
In Figures 5 and 6 we apply these color-color techniques to 12 young clusters ranging from the very young (20 Myr) NGC 2547 to the intermediate-aged (355 Myr) NGC 3532. For all clusters Gaia DR2 parallaxes and proper motions have been used to select likely cluster members. The fit reddenings based on matching the F70 trend to the MSTO stars are labeled. Our method fits the blue edge of the richest trend in the –0.1 (B–V)0 0.05 range and also considers the entirety of the reddening sensitive Hyades fiducial (orange line) fit of lower mass stars. This avoids basing the fit on the more complex and sparser bluer stars. In the clusters where differential reddening is important, focusing on the richest sequence of stars helps to define MSTO fits on the most common cluster reddening. The final MSTO stars falling in our selected color-color range based on the F70 relation are plotted in red. As a further reference in each cluster, we outline in cyan the previously identified Be stars and in blue the blue stragglers that are not Be stars. Nearly all fall outside of the color-color selected range.
In Figures 5 and 6 the photometrically matched [Fe/H] (i.e., that applied to the Hyades fiducial fit) and the spectroscopic [Fe/H] are labeled for comparison. They show reassuring consistency, or are within 0.1 dex, in all but one case. The final cluster parameters and the sources of the spectroscopic [Fe/H] are all given in Table 3. For clusters where spectroscopic [Fe/H] are taken from Cummings (2011) or Steinhauer & Deliyannis (2004), their derivations of [Fe/H] are dependent on the adopted E(B–V) and B–V. No adjustments were necessary for NGC 2168 from Steinhauer & Deliyannis (2004), but for NGC 2547, NGC 2422, and NGC 2516 from Cummings (2011) we have adjusted each cluster’s spectroscopic [Fe/H] based on how our fit E(B–V) and observed B–V differ from that originally adopted. For example, in the F and G dwarfs that were used in these sources a systematic decrease in (B–V)0 of 0.01 results in an increase in spectroscopically derived [Fe/H] of 0.02 dex.
Table 0 - Sources and Systematics
Cluster Phot (B–V) (U–B) V
Sources (Mag) (Mag) (Mag)
NGC 2547 1,2 +0.030 - +0.045
IC 2602 3,4 –0.035 - –0.065
Alpha Per 5,6 –0.005 - –0.050
NGC 6405 7,8 –0.020 –0.030 +0.020
NGC 2323 9,10 +0.015 - +0.010
Pleiades 11 - - -
NGC 2422 12,13 +0.010 +0.010 +0.080
NGC 2516 14,15 +0.010 +0.010 0.000
NGC 2168 16 - - -
NGC 2301 10,17 0.000 - 0.000
NGC 2287 18,19 –0.030 - –0.050
NGC 3532 20,21 +0.020 - 0.000
Table 1 - The Effects of Magnitude Systematics
E(B–V) [Fe/H]p [Fe/H]s (m–M)0
(Mag) (dex) (dex) (Mag)
U=+0.02 –0.005 +0.10 –0.01 –0.03
B=+0.02 +0.029 –0.20 +0.02 0.0
V=+0.02 –0.025 +0.10 –0.01 +0.05
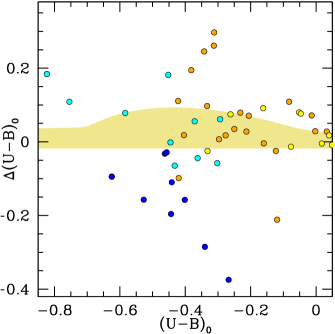
In Figure 7, we plot the (U–B)0 residuals relative to the F70 relation for all Be (cyan), Ap (orange), and Am (yellow) stars identified from these 12 clusters (WEBDA and SIMBAD databases). We also show in blue all MSTO stars that are blue stragglers but are not Be stars. The color-color selection range is displayed, but we note that the curvature on one edge is due to how this range was designed to follow the curvature of the F70 relation. Most Be stars in these clusters deviate from the F70 relation, and as expected they span from having either too much U flux or too little for a star at their B–V. Note in Figure 7 that the two bluest Be stars (from NGC 2422 and NGC 2516) fall outside of the plotted range in Figure 6, but they are shown here to clearly deviate from the F70 relation. Four of the Be stars, two from Alpha Per and two from NGC 2323, however, fall within this selected range. This is consistent with Be stars going through phases of normal or near normal colors, and we will further consider these four in the CMDs in Section 4.
More strikingly, the blue stragglers consistently show too little U flux in all cases with all falling well outside the selected range. We reiterate that these blue stragglers are all identified as cluster members based on Gaia DR2 data, so their colors are peculiar, but it is unclear why they have such red U–B colors relative to their B–V. We acknowledge that some of the blue stragglers with more moderate deviation may result from moderate differential reddening, but overall this reassures us of their peculiarity and the strength of this color-color selection technique. That they all fall redward in U–B color also further distinguishes them from Be stars, which more commonly show U excess.
Lastly, the peculiar abundance Am stars show minor scatter and Ap stars show larger scatter, but they predominantly fall within our selected range. This is consistent with metallicity changes causing their colors to shift along the F70 relation rather than away from it at these colors.
3.3.1 Systematic Photometric Errors
For three clusters in Figures 5 and 6 we have combined two different data sets to increase the depth of their analysis. Based on the stars that were in both sets, we measured the systematics differences shown in Table 1. Also shown in Table 1, for most other clusters we have matched their MSTO photometry to deeper BV photometry for the general CMD analysis (Section 4). Consistency between these combined photometric sets is important, and in all cases we adjust the deeper photometric data to match the zero point of the data set focusing on MSTO stars. Besides increased depth, these sample comparisons also give us an estimate of the systematic zero-point errors for these photometric data sets.
Table 2 - Open Cluster Parameters
Cluster E(B–V)a [Fe/H] [Fe/H] Y2 Age (m–M)0 PARSEC (m–M)0 MIST SYCLIST
Sources (Myr) Y2 (Myr) PARSEC (Myr) (Myr)
NGC 2547 0.0600.02 +0.01 1 - 8.040.15 9 7.980.15 10 6020
IC 2602 0.0500.02 –0.02 2 - 5.900.15 10 5.840.15 16 6020
Alpha Per 0.0650.03 +0.02 3 11020 6.100.06 8020 6.040.06 8520 9020
NGC 6405 0.1200.03 +0.04 4 12020 8.480.06 10020 8.420.06 10520 11020
NGC 2323 0.2300.05 0.00 - 14035 9.920.10 11535 9.860.10 12535 12035
Pleiades 0.0300.02 +0.01 5 14515 5.580.06 11515 5.520.06 13515 12515
NGC 2422 0.0650.02 +0.02 1 15520 8.530.12 15020 8.470.12 15020 14520
NGC 2516 0.0900.03 0.00 1 19525 8.110.12 16525 8.040.12 19525 18525
NGC 2168 0.2400.05 –0.143 6 19530 9.580.10 17530 9.520.10 18030 -
NGC 2287 0.0300.02 –0.11 2 20025 9.180.08 20025 9.110.08 20025 -
NGC 2301 0.0400.03 0.00 - 20030 9.650.10 20030 9.580.10 20530 18530
NGC 3532 0.0300.02 0.00 2 34030 8.330.14 34530 8.280.14 36030 34530
In Table 2 we consider what effects systematic shifts of +0.02 magnitudes in either U, B, or V will have on the color-color derived E(B–V). For shifts in all three magnitudes, the resulting total effect on (B–V)0 for cluster stars is weak because shifts in U weakly affect the fit E(B–V), and shifts in B or V result in comparable adjustments of B–V and the fit E(B–V). Therefore, when stellar parameters are estimated using these (B–V)0, the spectroscopic [Fe/H] are only weakly affected by these systematics. For the photometric estimate of [Fe/H], however, these 0.02 magnitudes shifts will have much stronger effects (0.10 to 0.20 dex). Lastly, after applying any of these systematic magnitude shifts to the photometry, in addition to the corresponding adjustments to the E(B–V) and spectroscopic [Fe/H] to the isochrone, the extinction corrected true distance modulus ((m–M)0) is also found to be weakly sensitive to these systematic errors. In all cases, these effects on E(B–V), [Fe/H], and (m–M)0 scale approximately linearly with the color shifts.
The strong sensitivity of the photometric estimate of [Fe/H] to systematic photometry errors illustrates one of its limitations. Reassuringly, all of the clusters analyzed here have both spectroscopic and photometric [Fe/H] in agreement, or within 0.1 dex. Minor photometric systematics are a likely cause for any remaining [Fe/H] disagreements, but these systematics will have little to no effect on the derivation of the other parameters. For the following CMD isochronal analyses, when available, each cluster’s more robust spectroscopic [Fe/H] has been adopted.
4. Color-Magnitude Diagrams
In young and relatively sparse cluster MSTOs with a lack of detailed rotation and inclination information, it is difficult to know which initial rotation rate to apply to the isochrones to best represent the MSTO stars. Even in the cases where this information is partially available, the uncertainties in rotational models limit age accuracies. The color-color techniques applied here, however, can also help mitigate these rotational MSTO challenges. For example, Bastian et al. (2017) found that in the rich Large Magellanic Cloud clusters NGC 1851 (80 Myr) and NGC 1856 (282 Myr), their MSTOs have a large fraction of Be stars with H emission resulting from their circumstellar disks. Estimates show that most B stars in a MSTO with rotations at or greater than 0.6 of will be Be stars (Rivinius et al. 2013 and references therein). Even though the color-color trends of rapidly rotating stars themselves are predicted to appear normal, the color-color analysis in Section 3.2 will select out active Be stars.
In general, therefore, these color-color techniques will have selected out the fastest rotators through their disk’s NUV flux. These fastest rotators are also the stars most sensitive to angle of observation, and so their removal limits the effects of that unknown parameter on the observed photometry. The final color-color selected MSTO stars will be slow and intermediate velocity rotators, which have moderate sensitivity to rotation, as shown in Figure 1 and 2, and only a minor sensitivity to angle of observation. That these should be expected to create a narrow MSTO is illustrated by the v sin i observed by Dupree et al. (2017) in the MSTO stars in the 200 Myr Large Magellanic Cloud cluster NGC 1866. They found narrow line MSTO stars are preferentially bluer, broad line stars are preferentially redder, and Be stars are the most broadly distributed on the rich MSTO. The rotational models, however, remain inconsistent in the details and this illustrates the remaining sensitivity to our understanding of rotation.
4.1. Color-Magnitude Diagram Isochrone Fitting
The MIST isochrone rotational models (Figure 1) argue that at ages 100 Myr and older, the MSTO stars with intermediate rotational velocities are consistently redder than the slowest (non) rotators. Therefore, MSTOs and their ages may best be found by fitting the blue edge of these color-color selected stars with non-rotating isochrones. This suggests the Y2 and PARSEC models, which do not consider rotation, also appropriately fit MSTO ages for those at 100 Myr and older. This is similar to the technique adopted in Paper I, where we also fit the blue edge of the MSTO because this allows us to preferentially fit single stars and minimize the effects of binaries that are also common at these masses. The photometric effects of intermediate rotation rates, however, in Figure 1 suggest that in the youngest clusters analyzed here (NGC 2547 and IC 2602), the non-rotating models may not provide accurate MSTO ages. We will still, nonetheless, fit them with non-rotating isochrones and test for systematic issues in their ages relative to other cluster age techniques in Section 5.2.
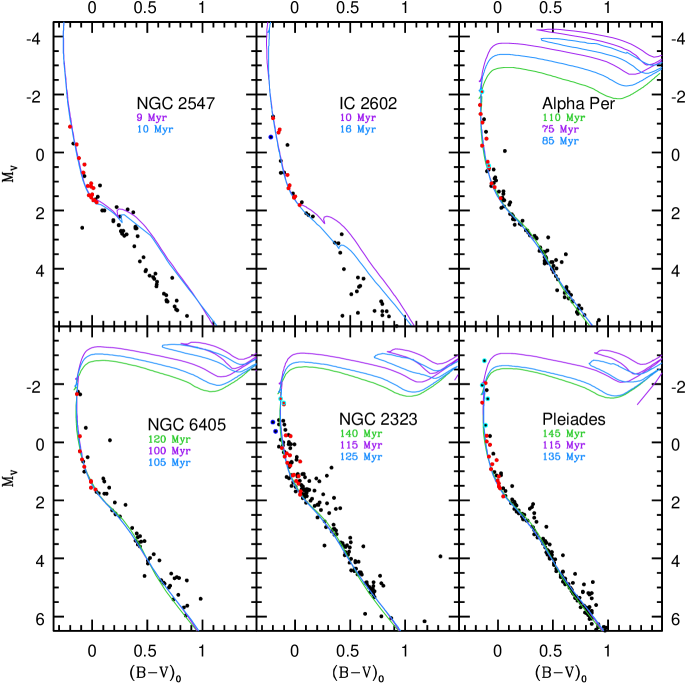
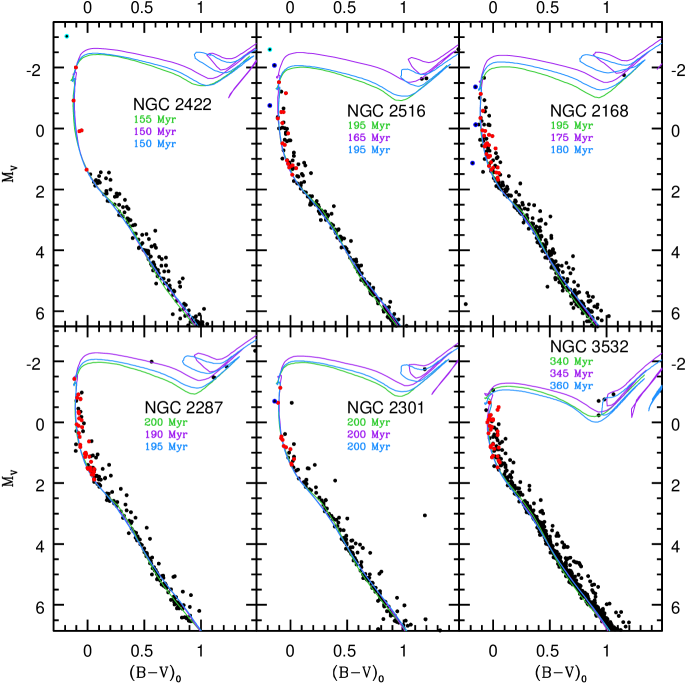
In Figures 8 and 9 we show the CMDs for these 12 clusters. For six of these clusters, these are updated fits of those analyzed in Paper I. The parameters are fit with the Y2 isochrones (green), the updated PARSEC isochrones (purple), and the non-rotating MIST isochrones (blue). The data points colored in red illustrate the same MSTO stars that have been selected with the color-color technique shown in Figures 5 and 6. Again, only likely cluster members based on Gaia DR2 parallaxes and proper motions are shown. For several clusters that are in rich Galactic fields, a few deviant stars that are likely non-members remain, but this shows that non-member contamination is very small and is not a concern in our analysis. For all isochrones the distance moduli are independently fit considering both the main sequence and the selected MSTO stars, but the distance moduli fit by the PARSEC and MIST models were indistinguishable.
To provide uniform MSTO age analysis, for each isochronal model we have fit the blue edge of the selected sample of MSTO stars. We used our own program that takes a grid of input isochrones at different ages and matches the best fitting isochrone age through orthogonal regression. This is a least squares technique that considers separation along both the absolute magnitude and color axes. However, when looking at an isochrone across a range of ages, the lower MSTO changes slowly with age while the upper MSTO changes very rapidly with age. Therefore, our program also measures each star’s sensitivity to age variations, relative to this input grid of isochrones, and weights its least squares input. For the youngest clusters (20 Myr) we consider age increments of 1 Myr, and for the older clusters (50 Myr) we consider age increments of 5 Myr.
For all clusters the color-color selected stars create better defined MSTO trends. These selections have also removed all clear blue stragglers (circled in blue) from the clusters. Additionally, in all but the sparsest clusters the distribution of selected MSTO stars show a consistent and well defined blue edge to the MSTO that matches well with the full extent of all three non-rotating isochronal models. These selected MSTOs are narrower but do remain too broad to simply be explained by binaries. We also note that the Be stars (circled in cyan) typically deviate significantly from the MSTO. However, as discussed in Section 3.3, four of these Be stars have color-colors consistent with our selection (see Alpha Per and NGC 2323). In these two cluster CMDs all of these Be stars are photometrically consistent with their cluster’s other selected MSTO stars and their photometry has marginal to no affect on our age fits. Overall, this may indicate that these Be stars have, or were photometrically observed during a phase of, relatively normal colors.
While both the MIST and PARSEC isochrones can also well match the blue edge of the MSTOs of the very young NGC 2547 and IC 2602, the limitations discussed above of using non-rotating isochrones to analyze ages of such young clusters is apparent. Below their MSTOs there is clear disagreement between the observed main sequence stars and each isochrone’s predicted pre-main sequence extending nearly to the MSTO. This will be discussed further in the Section 4.1.1.
Lastly, while all three isochrones consistently fit the shape of the MSTO stars and have similar main sequence trends, we note that their post main sequences have larger differences. Based on this and the limited number of giants in the older clusters here, which makes it difficult to define their trends, we have not adjusted our isochrone fits based on these giants. Nevertheless, we note the encouraging consistency between these independently fit isochrones and the giants in NGC 2516, NGC 2168, NGC 2301, NGC 2287, and NGC 3532.
In Table 3 we list for each cluster the derived reddening, the adopted metallicity, and for each isochrone the derived age and distance modulus. The photometric sources are given in Table 1. In Table 3 we also give the source of the adopted [Fe/H].
4.1.1 SYCLIST Isochrone Fits
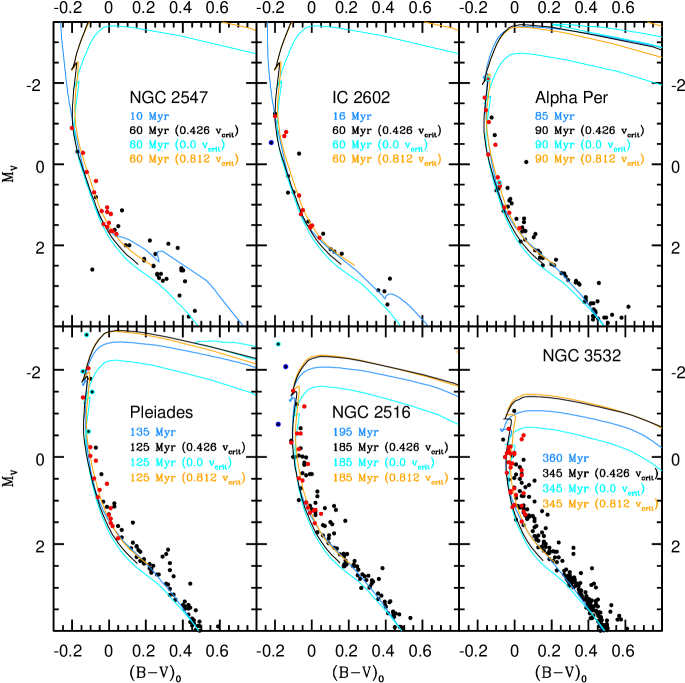
In Figure 10 for select clusters with solar, or nearly solar, metallicity we also fit these CMDs using SYCLIST isochrones. For matching to the intermediate main sequence (0.5 (B–V)0 1.0; region not shown in Figure 10) there is no meaningful difference between the non-rotating isochrones and those at 0.4 of . This is an important consideration because the MIST isochrones do not model rotation at these lower masses, and this suggests that the intermediate main sequence photometry that is valuable to the distance modulus measurements is not meaningfully affected by rotation. We also note that the distance moduli required to match the SYCLIST isochrones with the observations for all clusters are found to be indistinguishable from those used to match the Y2 isochrones.
Matching the SYCLIST models at the intermediate main sequence finds that, unlike all other models, the non-rotating SYCLIST isochrone (cyan) provides a typically poor match to the upper main sequence (0.06 (B–V)0 0.3) and to the selected MSTO, and in a manner where adjusting the age would not help. To match the observed photometry in the upper main sequence and the faint MSTO stars requires very rapid initial rotations of 0.95 of (0.812 ; orange). This velocity is abnormally large. We note that Royer et al. (2007) have found that the A dwarfs in this region are typically rotating at a higher fraction of their than B dwarfs, but it is unlikely that most of these selected faint MSTO stars and the A dwarfs are rotating at near critical velocity.
Based on typical B dwarf rotations from Huang et al. (2010) and the rotation sensitivity of the SYCLIST models shown in Figure 2, with the orthogonal minimization techniques discussed above we have fit the blue edge of these selected MSTO stars using SYCLIST isochrones with initial rotations of 0.6 of (0.426 of ). While these isochrones remain too faint at the upper main sequence and faintest MSTO stars, this rotation rate otherwise provides convincing fits of the blue edge of the MSTO.
For the sub-sample of clusters analyzed using SYCLIST models, we also give their SYCLIST-based ages in Table 3. These moderately rotating SYCLIST models fit comparable ages to the non-rotating MIST, Y2, and PARSEC isochrones for the clusters at 100 Myr and older. However, the SYCLIST models fit ages that are increasingly older relative to these non-rotating isochrones in the youngest clusters (100 Myr) analyzed here. These differences are clear in the young NGC 2547 and IC 2602, where as seen in Figure 8 these non-rotating isochrones fit MSTO ages that would place nearly all of the lower-mass stars below the MSTO on the pre-main sequence. In contrast to this, these significantly older cluster ages found with rotating SYCLIST models do predict main sequences consistent with observations.
5. Remaining Challenges & Comparisons
These color-color techniques, use of multiple isochrones, Gaia DR2 memberships, and consistent analysis across a broad range of cluster parameters have helped improve cluster MSTO age analysis. For the clusters at 100 Myr and older there is strong consistency of the age fits across all four isochrones, but there remain several important challenges. These include the broad differences between the SYCLIST models, including their non-rotating models, and all other isochrones. For example, at 100 Myr the MIST models (Figure 1) predict that the blue edge of the MSTO is defined by slowly (non) rotating stars but the SYCLIST models (Figure 2) predict that the blue edge of the MSTO is defined by moderately rotating (0.426 ) stars. Even though adopting these MSTO characteristics for the corresponding model results in consistent ages, both assumptions cannot be correct.
Comparisons to cluster parameters derived with independent methods, in particular those insensitive to many of the challenges discussed above, are valuable. These provide references for these general analysis techniques and for the differences found between different isochrones. This is one of the main advantages of testing these methods relative to nearby clusters that can be analyzed using a number of methods.
5.1. Comparison to Gaia-Based Distances
In addition to our membership analysis, Gaia DR2 provides a valuable check of distance moduli for nearby open clusters (Gaia Collaboration et al. 2018b).333We correct these cluster parallaxes for the Gaia DR2 systematic parallax error of 0.029 mas (Lindegren et al. 2018). These include ten of the clusters analyzed here, in addition to the Hyades and Praesepe analyzed similarly in Cummings et al. (2017), and NGC 1039 (M39) and NGC 6475 (M7) analyzed for this comparison using the same techniques applied in this paper. The photometric determination of distance moduli are dependent on multiple factors including the photometric UBV zero points, reddening determination, adopted composition, extinction ratio, photometric fitting errors, and adopted isochrones. Figure 11 and Table 4 show the direct comparison of Gaia-based distance moduli to the distance moduli derived from our Y2 and SYCLIST fits. We calculated the photometric-based true distance moduli by adopting an extinction correction of AV=3.1E(B–V). For all 14 clusters there is strong consistency (mean differential of –0.01 with a of 0.10 magnitudes), reassuring us that the determination of reddening, adopted composition, and the general techniques applied here are reliable.

Lastly, the distance moduli fit with PARSEC and MIST isochrones are 0.06 to 0.08 magnitudes lower than those determined with the Y2 and SYCLIST isochrones. Comparing the smaller PARSEC/MIST distance moduli for these 14 clusters results in a larger (–0.080.10 magnitudes) difference from the Gaia distances.
5.2. Comparison to Lithium Depletion Boundary Age Techniques
These MSTO derived ages can also be compared to cluster ages determined from Li abundances of low-mass cluster members (LDB ages; e.g., Jeffries & Naylor 2001). Dahm (2015), for example, has analyzed the lowest-mass stars in the Pleiades to identify the age sensitive luminosity where Li abundances rapidly change from fully Li depleted to Li rich. LDB ages provide a valuable age reference and are believed to be relatively insensitive to model assumptions like opacities, equations of state, metallicity, and rotation (Soderblom et al. 2014), but they are not completely independent of models (Tognelli et al. 2015). Based on differing pre-main sequence evolutionary models, for example, Dahm (2015) derives 3 Pleiades ages of 116 Myr (using Baraffe et al. 1998 models), 108 Myr (using Baraffe et al. 2015 models), and 103 Myr (using Chabrier et al. 2000 models). These ages are comparable to our MSTO age fits, where the PARSEC, MIST, and SYCLIST ages span a similar range of ages, but the LDB ages are approximately 15 Myr younger.
One challenge with LDB ages is that while the typical rotations in low-mass stars are not believed to play a direct role, in these stars with surface convection zones the rotation correlates with surface activity and results in radius inflation through induced magnetic fields (Somers & Stassun 2017). Therefore, low-mass stars that are initially rapidly rotating undergo less Li depletion because this inflation decreases their interior temperatures (Somers & Pinsonneault 2014). Additionally, this activity also affects a star’s photometric parameters at a given mass through inflation causing lower Teff and a rich coverage of starspots on their surface (Somers & Pinsonneault 2015). These factors are complex, however, and we need to better understand typical starspot coverage percentages. Accounting only for the photometric effects will decrease the standard LDB age by 10% (Juarez et al. 2014). By factoring in both the effects on photometry and Li depletion rate, Jackson & Jeffries (2014) and Somers & Pinsonneault (2015) predict that at the age of the Pleiades this will increase the standard LDB ages by as much as 20% and 10%, respectively. This can explain the systematic 15 Myr difference between the standard LDB ages and MSTO ages for the Pleiades.
In Table 4 the MSTO fit ages based on the PARSEC and SYCLIST isochrones are compared to the published LDB ages that have been corrected based on Jackson & Jeffries (2014) at 30% starspot coverage. All four isochrones derive quite similar ages for older clusters, but the differences become more significant in the youngest clusters analyzed here: NGC 2547 and IC 2602. The PARSEC and MIST non-rotating isochrones derive 9 and 10 Myr, respectively, for NGC 2547 and 10 and 16 Myr, respectively, for IC 2602. Our SYCLIST fits derive 60 Myr for NGC 2547 and 60 Myr for IC 2602. LDB ages for NGC 2547 and IC 2602 have been measured at 35 Myr (Jeffries & Oliveira 2005) and at 46 Myr (Dobbie, Lodieu & Sharp 2010), respectively. These LDB ages adopted standard models without rotation and activity. This gives LDB ages adjusted for activity of 45 Myr for NGC 2547 and of 59 Myr for IC 2602. These are significantly older than the MSTO ages fit using either the PARSEC or MIST isochrones, but they are consistent with the SYCLIST-based ages.
The cluster Alpha Per also has an LDB age determination of 9010 Myr (Stauffer et al. 1999). Adjusting for activity gives 107 Myr. Comparison to our Alpha Per MSTO ages again shows systematically younger ages based on the PARSEC and MIST isochrones and marginally better consistency with the SYCLIST models. Lastly, Martín et al. (2018) have measured an LDB age of 65070 Myr for the Hyades from its low mass L dwarfs. Neither Jackson & Jeffries (2014) nor Somers & Pinsonneault (2015) model the effects of rotation and magnetic fields at these older ages, but L dwarfs are less sensitive to these effects and any corrections are likely minor. This LDB age is consistent with the MSTO age fit in Cummings et al. (2017) using the Y2 isochrones of 635 Myr. Additionally, from Cummings et al. (in prep.) we have fit the Hyades with the PARSEC and MIST isochrones at 700 and 695 Myr, respectively. There are no available metal-rich SYCLIST isochrones, however, so we have not also fit the Hyades with these rotating models.
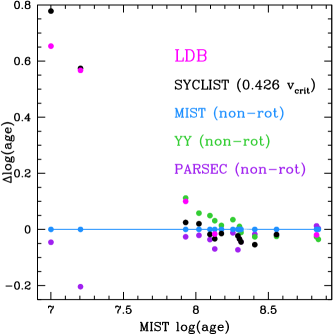
Overall, the clusters analyzed with these isochrones at 100 Myr provide ages reassuringly consistent with activity corrected LDB ages. In the youngest clusters, the rotating SYCLIST models remain consistent with the activity corrected LDB ages, but the non-rotating PARSEC and MIST isochrones increasingly underestimate these youngest cluster ages. In Figure 12 we illustrate all of these age comparisons.
Table 3 - Comparison to Gaia Distances and LDB Ages
Cluster MIST Age (m–M)0 SYCLIST Age (m–M)0 LDB Age (m–M)0
(Myr) (MIST) (Myr) (SYCLIST) (Myr) Gaia
NGC 2547 10 7.980.15 6020 8.040.15 45 7.9730.001
IC 2602 16 5.840.15 6020 5.900.15 59 5.9120.002
Alpha Per 8520 6.040.06 9020 6.100.06 107 6.2140.002
NGC 6405 10520 8.420.06 11020 8.480.06 - 8.3250.003
NGC 2323 12535 9.860.10 12035 9.920.10 - 9.9970.004
Pleiades 13515 5.520.06 12515 5.580.06 130 5.6640.002
NGC 2422 15020 8.470.12 14520 8.530.12 - 8.4210.002
NGC 2516 19525 8.040.12 18525 8.110.12 - 8.0880.001
NGC 2168 18030 9.520.10 - 9.580.10 - 9.7560.003
NGC 1039 20020 8.300.10 18520 8.360.10 - 8.5460.003
NGC 6475 25520 7.170.10 22520 7.230.10 - 7.2360.001
NGC 3532 36020 8.280.14 34520 8.330.14 - 8.4240.001
Hyades 68025 3.330.05 - 3.370.05 650 3.3840.007
Praesepe 70025 6.290.05 - 6.330.05 - 6.3500.001
6. Summary & Conclusions
Deriving MSTO ages in young clusters can be affected by binarity, rapid rotation, circumstellar disks, chemical peculiarities, blue stragglers, and differential reddening. Detailed spectroscopic analysis, or narrowband photometry, of the MSTO stars can help identify some types of peculiar stars. These are time consuming, however, and the effects of disks in Be stars are variable. Broadband UBV color-color analysis of MSTO stars is more direct and their color-colors are measurably affected by 1) stars with companions that significantly affect their colors, 2) stars affected by differential reddening, 3) rapidly rotating Be stars, and 4) blue stragglers. With this analysis the nature of the peculiarity that causes such a star to deviate cannot be determined, but this is not the goal. This method instead works as a simple and simultaneous way to identify well behaved MSTO stars that provide higher precision MSTO ages.
These selected MSTO stars create narrower MSTOs with blue edges that are consistently well fit by non-rotating models from Y2, PARSEC, and MIST. The predicted effects of rotation on the MSTOs are dependent on the rotational models, in addition to the effects of observation angle, but the fastest rotating MSTO stars have been selected out through their disks (Be status) and resulting peculiar U flux. The remaining slow and intermediate rotators are less sensitive to the effects of rotation and observation angle. Most of the widths of these narrower selected MSTOs can likely be explained by the remaining rotation rates, differences in observation angle, and binaries and chemical peculiar stars that these color-color techniques were insensitive to. Small age spreads within clusters may still be necessary to explain these remaining widths (e.g., Niederhofer et al. 2015), but a better understanding of rotation’s effects on MSTO photometry is necessary to quantify this.
For the case of the SYCLIST isochrones, in contrast to the other models, their non-rotating isochrones provide poor fits to the cluster MSTOs. In general, moderate to fast rotating SYCLIST isochrones are necessary to match the MSTO, and those at 0.426 of are used to fit cluster ages. For clusters older than 100 Myr, these SYCLIST age fits are reassuringly consistent with the non-rotating Y2, PARSEC, and MIST model fits, even though the methods of addressing rotation are fundamentally different. This is consistent with the recent findings of Gossage et al. (2018), where they created synthetic MSTOs based on variations in rotation rate and angle of observation and found the resulting ages for the Hyades, Praesepe, and the Pleiades are insensitive to the effects of rotation. For younger clusters, however, where the importance of rotation increases, the SYCLIST fit ages become significantly older than those found with non-rotating isochrones.
The fit distance moduli of these clusters are important checks of our derived parameters. Comparisons of the true distance moduli based on Y2 and SYCLIST isochrone fits to the distance moduli derived from Gaia DR2 parallaxes show good agreement (–0.010.10 magnitudes). This consistency is strong and shows that with a larger sample of clusters these comparisons can discriminate between the distance moduli derived with the Y2 and SYCLIST isochrones versus those from the PARSEC or MIST isochrones that are systematically closer (–0.080.10 magnitudes relative to Gaia). This would provide a valuable constraint on how main sequence luminosity and color depend on mass and metallicity.
LDB ages provide a valuable independent check of MSTO cluster ages. Taken from various sources, we have made corrections to these based on magnetic surface activity estimates and the resulting radius inflation. At the age of the Pleiades (125 Myr), this gives consistency between our MSTO ages from differing isochrones and LDB ages from differing models. The LDB ages of the much older Hyades (675 Myr) also remain consistent with our isochronal ages.
NGC 2547 and IC 2602, the youngest clusters we have analyzed, also have LDB ages and these provide an important check between the non-rotating PARSEC and MIST isochrones fits (ranging from 9 to 16 Myr) and the LDB ages based on surface activity corrections (45 and 59 Myr, respectively). Fitting these clusters with rotating MIST models at 0.5 or 0.6 of would moderately increase the cluster age fits (by 5 to 10 Myr) but not enough to bring them to agreement with the LDB ages. In contrast to this, fitting SYCLIST isochrones with initial rotations of 0.426 of to the MSTO provides isochronal ages (60 Myr) reassuringly consistent with their LDB ages. The moderately older Alpha Per (90 Myr) has all isochronal ages still generally consistent, but shows evidence of the non-rotating PARSEC and MIST ages beginning to diverge to younger fit ages than the SYCLIST and LDB ages.
Further work is necessary on evolutionary models and rotation, but here we have studied from several angles some of the challenges introduced by rotation and peculiar stars. These simple Johnson UBV color-color techniques, which should be just as applicable in other broadband systems with a NUV filter, help address the most significant rotational challenges and peculiarities. This improves the precision of cluster MSTO fitting. More work on observational constraints of rotation will be required to improve these models. For example, surface abundances in fast rotating stars and how they can trace rotational mixing (e.g., Boron, Venn et al. 2002, Profitt et al. 2016). Astroseismology of rapidly rotating stars can also help characterize the effects of rapid rotation on interior structure (e.g., Neiner et al. 2012). Additional techniques to observationally constrain rotational mixing are valuable, however, and our group is currently developing a novel technique.
Acknowledgments: This project was supported by the National Science Foundation (NSF) through grant AST-1614933. This research has made use of the WEBDA database, operated at the Department of Theoretical Physics and Astrophysics of the Masaryk University. This research has made use of the SIMBAD database, operated at CDS, Strasbourg, France. JDC would also like to thank Constantine Deliyannis and Jieun Choi for discussions on several of the ideas presented in this paper.
This work has made use of data from the European Space Agency (ESA) mission Gaia (https://www.cosmos.esa.int/gaia), processed by the Gaia Data Processing and Analysis Consortium (DPAC, https://www.cosmos.esa.int/web/gaia/dpac /consortium). Funding for the DPAC has been provided by national institutions, in particular the institutions participating in the Gaia Multilateral Agreement.
References
- Baraffe et al. (1998) Baraffe, I., Chabrier, G., Allard, F., & Hauschildt, P. H. 1998, A&A, 337, 403
- Baraffe et al. (2015) Baraffe, I., Homeier, D., Allard, F., & Chabrier, G. 2015, A&A, 577, A42
- Barnes (2003) Barnes, S. A. 2003, ApJ, 586, 464
- Bastian et al. (2017) Bastian, N., Cabrera-Ziri, I., Niederhofer, F., et al. 2017, MNRAS, 465, 4795
- Bjorkman et al. (2002) Bjorkman, K. S., Miroshnichenko, A. S., McDavid, D., & Pogrosheva, T. M. 2002, ApJ, 573, 812
- Boesgaard et al. (2003) Boesgaard, A. M., Armengaud, E., & King, J. R. 2003, ApJ, 582, 410
- Bressan et al. (2012) Bressan, A., Marigo, P., Girardi, L., et al. 2012, MNRAS, 427, 127
- Chabrier et al. (2000) Chabrier, G., Baraffe, I., Allard, F., & Hauschildt, P. 2000, ApJ, 542, 464
- Choi et al. (2016) Choi, J., Dotter, A., Conroy, C., et al. 2016, ApJ, 823, 102
- Choi et al. (2017) Choi, J., Conroy, C., & Byler, N. 2017, ApJ, 838, 159
- Claria (1982) Claria, J. J. 1982, A&AS, 47, 323
- Claria et al. (1998) Claria, J. J., Piatti, A. E., & Lapasset, E. 1998, A&A, 128, 131
- Clem et al. (2011) Clem, J. L., Landolt, A. U., Hoard, D. W., & Wachter, S. 2011, AJ, 141, 115
- Correnti et al. (2017) Correnti, M., Goudfrooij, P., Bellini, A., Kalirai, J. S., & Puzia, T. H. 2017, MNRAS, 467, 3628
- Crawford & Mandwewala (1976) Crawford, D. L., & Mandwewala, N. 1976, PASP, 88, 917
- Cummings (2011) Cummings, J. 2011, Ph.D. Thesis,
- Cummings et al. (2012) Cummings, J. D., Deliyannis, C. P., Anthony-Twarog, B., Twarog, B., & Maderak, R. M. 2012, AJ, 144, 137
- Cummings et al. (2016) Cummings, J. D., Kalirai, J. S., Tremblay, P.-E., & Ramirez-Ruiz, E. 2016, ApJ, 818, 84
- Cummings et al. (2017) Cummings, J. D., Deliyannis, C. P., Maderak, R. M., & Steinhauer, A. 2017, AJ, 153, 128
- Dachs & Kabus (1989) Dachs, J., & Kabus, H. 1989, A&A, 78, 25
- Dahm (2015) Dahm, S. E. 2015, ApJ, 813, 108
- D’Antona & Mazzitelli (1994) D’Antona, F., & Mazzitelli, I. 1994, ApJS, 90, 467
- Dobbie et al. (2010) Dobbie, P. D., Lodieu, N., & Sharp, R. G. 2010, MNRAS, 409, 1002
- Dotter (2016) Dotter, A. 2016, ApJS, 222, 8
- Dunstall et al. (2015) Dunstall, P. R., Dufton, P. L., Sana, H., et al. 2015, A&A, 580, A93
- Dupree et al. (2017) Dupree, A. K., Dotter, A., Johnson, C. I., et al. 2017, ApJ, 846, L1
- Eggen (1961) Eggen, O. J. 1961, RGOB, 27, 61
- Ekström et al. (2012) Ekström, S., Georgy, C., Eggenberger, P., et al. 2012, A&A, 537, A146
- Ekström et al. (2008) Ekström, S., Meynet, G., Maeder, A., & Barblan, F. 2008, A&A, 478, 467
- Fernandez & Salgado (1980) Fernandez, J. A., & Salgado, C. W. 1980, A&A, 39, 11
- Fernie (1963) Fernie, J. D. 1963, AJ, 68, 780
- Fitzgerald (1970) Fitzgerald, M. P. 1970, A&A, 4, 234
- Gaia Collaboration et al. (2016) Gaia Collaboration, Prusti, T., de Bruijne, J. H. J., et al. 2016, A&A, 595, A1
- Gaia Collaboration et al. (2018) Gaia Collaboration, Brown, A. G. A., Vallenari, A., et al. 2018a, arXiv:1804.09365
- Gaia Collaboration et al. (2018) Gaia Collaboration, Babusiaux, C., van Leeuwen, F., et al. 2018b, arXiv:1804.09378
- Georgy et al. (2013) Georgy, C., Ekström, S., Granada, A., et al. 2013, A&A, 553, A24
- Georgy et al. (2014) Georgy, C., Granada, A., Ekström, S., et al. 2014, A&A, 566, A21
- Ghosh et al. (1999) Ghosh, K. K., Apparao, K. M. V., & Pukalenthi, S. 1999, A&AS, 134, 359
- Gossage et al. (2018) Gossage, S., Conroy, C., Dotter, A., et al. 2018, arXiv:1804.06441
- Grevesse & Sauval (1998) Grevesse, N., & Sauval, A. J. 1998, SSRv, 85, 161
- Harmanec (1983) Harmanec, P. 1983, Hvar Observatory Bulletin, 7, 55
- Hoag et al. (1961) Hoag, A. A., Johnson, H. L., Iriarte, B., et al. 1961, Publications of the U.S. Naval Observatory Second Series, 17, 344
- Huang et al. (2010) Huang, W., Gies, D. R., & McSwain, M. V. 2010, ApJ, 722, 605
- Ianna et al. (1987) Ianna, P. A., Adler, D. S., & Faudree, E. F. 1987, AJ, 93, 347
- Jackson & Jeffries (2014) Jackson, R. J., & Jeffries, R. D. 2014, MNRAS, 445, 4306
- Jeffries & Naylor (2001) Jeffries, R. D., & Naylor, T. 2001, From Darkness to Light: Origin and Evolution of Young Stellar Clusters, 243, 633
- Jeffries & Oliveira (2005) Jeffries, R. D., & Oliveira, J. M. 2005, MNRAS, 358, 13
- Johnson & Mitchell (1958) Johnson, H. L., & Mitchell, R. I. 1958, ApJ, 128, 31
- Juarez et al. (2014) Juarez, A. J., Cargile, P. A., James, D. J., & Stassun, K. G. 2014, ApJ, 795, 143
- Kalirai et al. (2003) Kalirai, J. S., Fahlman, G. G., Richer, H. B., & Ventura, P. 2003, AJ, 126, 1402
- Kawaler (1988) Kawaler, S. D. 1988, ApJ, 333, 236
- Kılıçoğlu et al. (2016) Kılıçoğlu, T., Monier, R., Richer, J., Fossati, L., & Albayrak, B. 2016, AJ, 151, 49
- Kim et al. (2001) Kim, S.-L., Chun, M.-Y., Park, B.-G., et al. 2001, A&A, 371, 571
- Kraft (1967) Kraft, R. P. 1967, ApJ, 150, 551
- Lindegren et al. (2018) Lindegren, L., Hernandez, J., Bombrun, A., et al. 2018, arXiv:1804.09366
- Maeder & Meynet (2000) Maeder, A., & Meynet, G. 2000, ARA&A, 38, 143
- Marco et al. (2007) Marco, A., Negueruela, I., & Motch, C. 2007, Active OB-Stars: Laboratories for Stellare and Circumstellar Physics, 361, 388
- Marigo et al. (2017) Marigo, P., Girardi, L., Bressan, A., et al. 2017, ApJ, 835, 77
- Martín et al. (2018) Martín, E. L., Lodieu, N., Pavlenko, Y., & Béjar, V. J. S. 2018, ApJ, 856, 40
- Milone et al. (2015) Milone, A. P., Bedin, L. R., Piotto, G., et al. 2015, MNRAS, 450, 3750
- Michaud (1970) Michaud, G. 1970, ApJ, 160, 641
- Miroshnichenko et al. (2012) Miroshnichenko, A. S., Manset, N., Pasechnik, A. V., et al. 2012, Circumstellar Dynamics at High Resolution, 464, 187
- Mitchell (1960) Mitchell, R. I. 1960, ApJ 132, 68
- Naylor et al. (2002) Naylor, T., Totten, E. J., Jeffries, R. D., et al. 2002, MNRAS, 335, 291
- Neiner et al. (2012) Neiner, C., Mathis, S., Saio, H., et al. 2012, A&A, 539, A90
- Netopil et al. (2016) Netopil, M., Paunzen, E., Heiter, U., & Soubiran, C. 2016, A&A, 585, A150
- Niederhofer et al. (2015) Niederhofer, F., Georgy, C., Bastian, N., & Ekström, S. 2015, MNRAS, 453, 2070
- Paxton et al. (2011) Paxton, B., Bildsten, L., Dotter, A., et al. 2011, ApJS, 192, 3
- Paxton et al. (2013) Paxton, B., Cantiello, M., Arras, P., et al. 2013, ApJS, 208, 4
- Paxton et al. (2015) Paxton, B., Marchant, P., Schwab, J., et al. 2015, ApJS, 220, 15
- Prisinzano et al. (2003) Prisinzano, L., Micela, G., Sciortino, S., & Favata, F. 2003, A&A, 404, 927
- Proffitt et al. (2016) Proffitt, C. R., Lennon, D. J., Langer, N., & Brott, I. 2016, ApJ, 824, 3
- Prosser (1992) Prosser, C. F. 1992, AJ, 103, 488
- Prosser et al. (1996) Prosser, C. F., Randich, S., & Stauffer, J. R. 1996, AJ, 112, 649
- Raboud (1996) Raboud, D. 1996, A&A, 315, 384
- Reddy et al. (2016) Reddy, A. B. S., Lambert, D. L., & Giridhar, S. 2016, MNRAS, 463, 4366
- Rivinius et al. (2013) Rivinius, T., Carciofi, A. C., & Martayan, C. 2013, A&ARv, 21, 69
- Schmidt-Kaler (1961) Schmidt-Kaler, T. 1961, Astronomische Nachrichten, 286, 113
- Schuler et al. (2010) Schuler, S. C., Plunkett, A. L., King, J. R., & Pinsonneault, M. H. 2010, PASP, 122, 766
- Sharma et al. (2006) Sharma, S., Pandey, A. K., Ogura, K., et al. 2006, AJ, 132, 1669
- Sigut & Patel (2013) Sigut, T. A. A., & Patel, P. 2013, ApJ, 765, 41
- Soderblom et al. (2014) Soderblom, D. R., Hillenbrand, L. A., Jeffries, R. D., Mamajek, E. E., & Naylor, T. 2014, Protostars and Planets VI, 219
- Somers & Pinsonneault (2014) Somers, G., & Pinsonneault, M. H. 2014, ApJ, 790, 72
- Somers & Pinsonneault (2015) Somers, G., & Pinsonneault, M. H. 2015, ApJ, 807, 174
- Somers & Stassun (2017) Somers, G., & Stassun, K. G. 2017, AJ, 153, 101
- Stauffer et al. (1999) Stauffer, J. R., Barrado y Navascués, D., Bouvier, J., et al. 1999, ApJ, 527, 219
- Steinhauer & Deliyannis (2004) Steinhauer, A., & Deliyannis, C. P. 2004, ApJ, 614, L65
- Stȩpień (2000) Stȩpień, K. 2000, A&A, 353, 227
- Stepien & Muthsam (1980) Stepien, K., & Muthsam, H. 1980, A&A, 92, 171
- Sung & Bessell (1999) Sung, H., & Bessell, M. S. 1999, MNRAS, 306, 361
- Sung et al. (2002) Sung, H., Bessell, M. S., Lee, B.-W., & Lee, S.-G. 2002, AJ, 123, 290
- Terzan et al. (1987) Terzan, A., Turati, C., & Ounnas, C. 1987, A&AS, 67, 309
- Tognelli et al. (2015) Tognelli, E., Prada Moroni, P. G., & Degl’Innocenti, S. 2015, MNRAS, 449, 3741
- Townsend et al. (2004) Townsend, R. H. D., Owocki, S. P., & Howarth, I. D. 2004, MNRAS, 350, 189
- Turner (1989) Turner, D. G. 1989, AJ, 98, 2300
- Venn et al. (2002) Venn, K. A., Brooks, A. M., Lambert, D. L., et al. 2002, ApJ, 565, 571
- Wenger et al. (2000) Wenger, M., Ochsenbein, F., Egret, D., et al. 2000, A&AS, 143, 9
- Whitford (1958) Whitford, A. E. 1958, AJ, 63, 201
- Whiteoak (1961) Whiteoak, J. B. 1961, MNRAS, 123, 245
- Yi et al. (2001) Yi, S., Demarque, P., Kim, Y.-C., et al. 2001, ApJ, 136, 417
- Zorec et al. (1983) Zorec, J., Briot, D., & Divan, L. 1983, A&A, 126, 192