FLUX DENSITY VARIATIONS AT 3.6 CM IN THE MASSIVE STAR-FORMING REGION W49A
Abstract
A number of ultracompact H ii regions in Galactic star forming environments have been observed to vary significantly in radio flux density on timescales of 10–20 years. Theory predicted that such variations should occur when the accretion flow that feeds a young massive star becomes unstable and clumpy. We have targeted the massive star-forming region W49A with the Karl G. Jansky Very Large Array (VLA) for observations at 3.6 cm with the B-configuration at resolution, to compare to nearly identical observations taken almost 21 years earlier (February 2015 and August 1994). Most of the sources in the crowded field of ultracompact and hypercompact H ii regions exhibit no significant changes over this time period. However, one source, W49A/G2, decreased by 20% in peak intensity (from 714 mJy/beam to 573 mJy/beam), and 40% in integrated flux (from 0.1090.011 Jy to 0.0670.007 Jy), where we cite 5 errors in peak intensity, and 10% errors in integrated flux. We present the radio images of the W49A region at the two epochs, the difference image that indicates the location of the flux density decrease, and discuss explanations for the flux density decrease near the position of W49A/G2.
1 INTRODUCTION
W49 is a radio source consisting of the high mass star forming region W49A and the supernova remnant W49B, located kpc away (Zhang et al., 2013). The star forming region W49A is one of the largest and most active sites of high mass star formation in the Galaxy (Stock et al., 2014), and one of the richest clusters known (Smith et al., 2009). W49A contains 45 H ii regions spread across a few parsecs, of which 13 are classified as ultracompact (UC) H ii regions (0.05 pc , see De Pree et al. (1997)). Recent studies have made attempts to quantify the YSO population (e.g. Saral et al. (2015), Eden et al. (2018)), and mapped the molecular gas in the region (Galván-Madrid et al., 2013). The large number of UC H ii regions distributed over a small region of space, as well as the presence of high velocity water maser outflows, makes W49A ideal for studying massive star formation and the early evolution of H ii regions. The radio appearance of W49A is made up of two well-defined peaks, referred to as W49 North (W49N) and W49 South (W49S). In W49N, there are 10 UC H ii regions, each associated with one or more O stars, and arranged in a ring 2 pc in diameter (Welch et al., 1987). Source W49A/A has a bipolar morphology, which suggests ionized outflow (De Pree et al., 1997). Source W49A/G, which is in fact made up of at least 5 smaller components, contains the most luminous H2O maser outflow in the Galaxy (Walker et al., 1982).
The lifetime of an UC H ii region is estimated to be about 105 years, based on head counts of UC H ii regions in the Galactic disk (Wood & Churchwell, 1989). This lifetime is approximately 10 times longer than would be expected if UC H ii regions simply expand at the thermal sound speed, given the number of OB stars in the Galaxy. Different theories have been proposed to reconcile this lifetime problem, including thermal pressure confinement (De Pree et al., 1995), turbulent pressure confinement (Xie et al., 1996), disk photo-evaporation (Hollenbach et al., 1994), moving star bow shocks (Mac Low et al., 1991), and mass-loaded stellar winds (Dyson et al., 1995). None of these models successfully accounts for the observed lifetime of UC H ii regions, source morphologies, and a number of other constraints.
A model in which UC H ii region radio emission might vary with time has been proposed by Keto (2002), Keto (2007) and Peters et al. (2010a). In particular, Peters et al. (2010a) used numerical simulations of star formation, which account for heating from both ionizing and non-ionizing radiation, to show that the accretion flows that form massive stars become gravitationally unstable, resulting in dense clumps and filaments. The fixed radiation fields of high mass stars ionize varying volumes of gas, depending on their density. Therefore, when high-density clumps interacting with stars temporarily boost the local recombination rate, the H ii region surrounding the star can shrink. As a result, the H ii regions associated with a star that is still accreting material can flicker between UC and hypercompact (HC) states, rather than monotonically expanding as previously assumed. This model potentially solves the lifetime problem, as the accretion process continues for 10 times longer than the free expansion time. Independent observations of radio recombination lines (RRLs) associated with hypercompact and UC H ii regions indicate that some of the most compact H ii regions continue to accrete material after the H ii region has formed (Klaassen et al., 2017).
In detail, the model proposed by Peters et al. (2010a) predicted that UC H ii regions can experience a change of 5% yr-1 in flux density. These variations in flux density can be observed on the timescales of available archival observations from powerful radio interferometers. Galván-Madrid et al. (2011) used the models from Peters et al. (2010a) to predict a 15% probability for an increase in flux density, and a 6% probability for a decrease in flux density over a 20 year time span, with statistical uncertainties of 2–3%. There is strong observational evidence of such flux density variations of several H ii regions obtained serendipitously from analysis of multi-epoch observations, including NGC 7538 (Franco-Hernandez et al., 2004), G24.78+0.08 (Galván-Madrid et al., 2008), Orion BN/KL (Rivilla et al., 2015) and NGC 6334I (Hunter et al., 2018).
W49A is the second Galactic massive star forming (MSF) region in which the authors have looked for flux density variations in regions containing a large numbers of sources in a single field of view. De Pree et al. (2014) previously reported detections of flux density variations in the Sgr B2 Main and North regions. We detected changes at 7 mm in 2 of 41 ultracompact (UC) and hypercompact (HC) H ii regions, or 5% of sources. At 1.3 cm, we detected flux density changes in 4 of 41 UC and HC H ii regions, or about 10% of sources. These percentages are roughly consistent with the predictions of Galván-Madrid et al. (2011), which posited that 10% of sources should have detectable flux density variations in a period of 10 years.
In this paper, we present new B-configuration Karl G. Jansky Very Large Array (VLA)111The National Radio Astronomy Observatory is a facility of the National Science Foundation, operated under cooperative agreement by Associated Universities, Inc. 3.6 cm images of the W49A star forming region taken in 2015. Archival B-configuration VLA 3.6 cm observations of W49A from 1994 have allowed us to search for flux density variations in individual UC and HC H ii regions between 1994 and 2015. In Section 2, we describe the VLA observations. In Section 3 we report the detection of a significant flux density decrease in one source, W49A/G2. In Section 4 we discuss possible explanations for the detected flux density variations. In the current study of W49A, we have detected a flux density change in 1 of 13 known UC and HC H ii regions, or 8% of sources. The detected flux density decrement is most likely the result of a high density clump interacting with a star in the G2b or G2c sub regions.
2 OBSERVATIONS AND DATA REDUCTION
2.1 Observations
W49A was observed with the VLA in the B-configuration at 8.309 GHz (3.6 cm) on August 27, 1994 and February 8, 2015. The 1994 observations totaled 4.3 hours, with 3.6 hours on source, while the 2015 observations totaled 3 hours, with 2.1 hours on source. The remaining time for both observations was split between the flux density, phase and bandpass calibrator sources. The 1994 data were separated into 63 channels, each with a 97.7 kHz bandwidth. The 2015 data were separated into 16 spectral windows (hereafter SPW), with each SPW separated into 128 channels, each channel being 125 kHz wide. Detailed parameters for both observations are given in Table 1.
| Parameter | 1994 | 2015 |
|---|---|---|
| Project Code | AD324 | 15A-089 |
| Date | 1994 August 27 | 2015 February 8 |
| Total Observing Time (hr) | 4.3 | 3 |
| Time on source (hr) | 3.6 | 2.1 |
| Number of Antennas | 27 | 27 |
| Rest frequency (GHz) | 8.3094 | 8.3094 |
| LSR central velocity (km s-1) | -53 | 8 |
| Total bandwidth(MHz) | 6.125 | 16 |
| Number of channels | 63 | 128 |
| Channel separation (kHz, km s-1) | 97.7 | 125 |
| Flux density calibrator | 3C 286 | 3C 286 |
| Phase calibrator | J1925+2106 | J1925+2106 |
| Bandpass calibrator | J0319+4130 (3C 84) | J0319+4130 (3C 84) |
| FWHM of synthesized beam | 072065, -63 | 071062, -62 |
| RMS noise (mJy/beam) | 0.78 | 0.62 |
Note. — Both images were convolved to a circular 080 beam before image subtraction as described in the text. The offset in LSR central velocity is the result of centering the 1994 observations between the H92 and He92 Radio Recombination Lines.
2.2 Data Reduction of VLA 1994 Observations
Multi-configuration observations of the W49A massive star-forming region made with the VLA in the B, C, and D-configurations were reported in De Pree et al. (1997). These 1994 observations were previously imaged using the Astronomical Image Processing System (AIPS). In order to eliminate the possibility of any differences in the 1994 and 2015 source flux densities due to differences in software implementation of imaging and deconvolution algorithms, the B-configuration data from 1994 were downloaded from the VLA archive and re-calibrated using the Common Astronomy Software Application (CASA) package. The line-free continuum data were then imaged with uniform weighting and self-calibrated, with three phase and one phase and amplitude self-calibration to improve the signal-to-noise ratio in the resulting image. The final image had an rms noise of 0.58 mJy/beam, and a synthesized beam size of 072 x 065 (FWHM), BPA63o.
2.3 Data Reduction of VLA 2015 Observations
The B-configuration 2015 data presented here are part of a larger multi-configuration (A, B, C, and D) dataset that will be fully imaged and analyzed in an upcoming paper. Here, we present the data reduction of only the portion of these 2015 observations that were to be compared to the 1994 data. From the larger dataset, SPW 11 (centered at 8.309 GHz) from the B-configuration observations was separated for calibration and imaging, as this most closely matched the 1994 observations with the old VLA correlator. The 2015 data were flagged and calibrated using standardized CASA-based calibration techniques. A line-free continuum data set was generated from the flagged and calibrated data, and was imaged, cleaned and self calibrated using three cycles of phase-only self-calibration and one cycle of phase and amplitude self-calibration using CASA, with the same parameters as the reprocessed 1994 data. The final image has an rms noise level of 0.52 mJy/beam, and a synthesized beam 071 x 063 (FWHM), BPA 62o.
3 RESULTS
3.1 Aligning and Normalizing Images
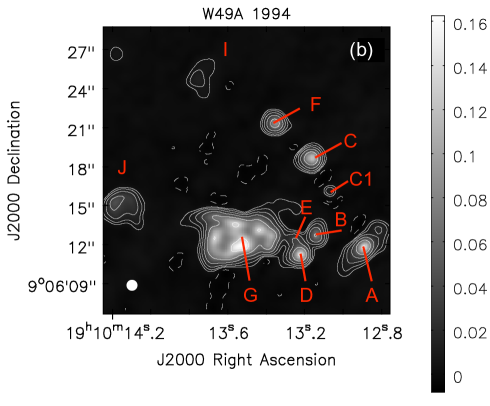
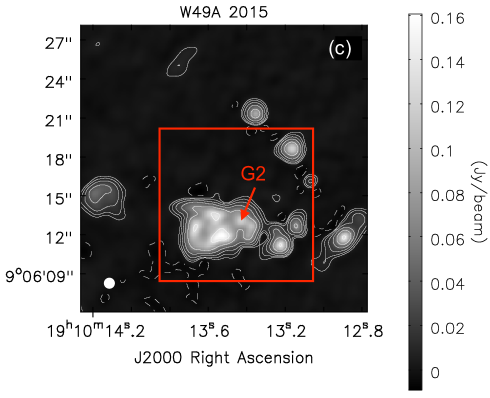
Using CASA, the 1994 and 2015 images were aligned, normalized and convolved to the same resolution before subtraction. We first regridded the 1994 image from B1950 coordinates to J2000 coordinates, and then regridded to the image size of the 2015 image. We then convolved the two images to a 08 (circular) beam size and normalized the two images. The normalization factor was determined by taking the ratio of the flux densities of 8 of the brightest sources in the central W49N region from the two epochs. The entire 2015 image was multiplied by the resulting factor of 1.062. This normalization factor lies within the expected mutual uncertainties for the absolute flux scales of the two data sets. We then aligned the images, selecting two UC H ii regions in the 2015 image as reference points. The regridding and alignment processes introduced only small (001) shifts. Figure 1a shows the 3.6 cm radio emission from the W49N region as observed in 2015, overlaid on the SMA-observed surface density maps obtained from CO-isotopologue line ratios (Galván-Madrid et al., 2013). Figures 1b and 1c show the 1994 and 2015 convolved and normalized images of the central region of W49A, in the region boxed in Fig. 1a. Source names in Fig. 1a and 1b are from De Pree et al. (1997).

3.2 3.6 cm Difference Images
Finally, we subtracted the 2015 image from the 1994 image to generate a final difference image. The positional accuracy of the difference image is 01, determined from NRAO-VLA documentation that states typical positional accuracy from standard calibration techniques is at 10% of the synthesized beam, or in the case of these data, 0.1″. Figure 2a shows the difference image (contours) superimposed on the convolved 2015 B-configuration image (greyscale). The region of this image is shown as a box in Fig. 1c. The rms noise in the difference image was measured to be 1.2 mJy/beam. Dashed contours are plotted at the -15, -12.5, and -10 levels, while solid contours were plotted at the 10, 12.5, and 15 levels. There are two locations in the difference image that exceed the 10 level, and both of those regions which show a decrease can be seen in Figure 2a. A single contour (10 decrease) is associated with source G5, and a more significant decrease (15) on the eastern side of source G2. The first contour was plotted at the 10 level to ensure that we identified only the most significant regions of flux density change between the two epochs. In the Discussion below, we consider only the change associated with the G2 region.
As an additional check on the flux density change detected in the difference image, individual sources shown in Fig. 1b were fitted with 2D Gaussians in CASA, and Table 2 shows the peak intensity (mJy/beam) and integrated flux (Jy) of 9 of the 11 UC and hypercompact H ii regions in W49N with peak intensities greater than 10 in the image maps. The remaining two sources (G1 and E) are not included in this table as the resolution of the B-configuration image (08) was not sufficient to fit these weaker sources in the crowded central W49N region. Errors in Table 2 are 5 in peak intensity and 10% in integrated flux. We also tabulate the ratio in peak intensity (2015/1994) and integrated flux (2015/1994), with the errors shown being the errors in the input images added in quadrature.
The result of image differencing shown in Figure 2a is confirmed by this sample of source peak intensities and integrated fluxes listed in Table 2. Only source G2 shows a significant change in peak intensity, with a 20% decrease in peak intensity and and a 40% decrease in integrated flux. The remaining sources have nearly constant values between the two epochs within the uncertainties, and are consistent with experiencing no change in flux density between the two observations separated by 21 years. Thus, in the current study of W49A, we have detected a flux density change in 1 of 13 known UC and HC H ii regions, or 8% of sources.
| Source | Peak Intensity (PI, mJy/beam) | Integrated Flux (IF, Jy) | PI Ratio (2015/1994) | IF Ratio (2015/1994) |
|---|---|---|---|---|
| W49A B | ||||
| 1994 | 0.0640.004 | 0.1020.010 | 1.10.1 | 1.10.1 |
| 2015 | 0.0690.003 | 0.1090.011 | ||
| W49A C | ||||
| 1994 | 0.1230.004 | 0.2180.022 | 1.00.1 | 1.10.1 |
| 2015 | 0.1220.003 | 0.2290.023 | ||
| W49A C1 | ||||
| 1994 | 0.0160.004 | 0.0190.002 | 1.30.3 | 1.20.2 |
| 2015 | 0.0210.003 | 0.0230.002 | ||
| W49A D | ||||
| 1994 | 0.1370.004 | 0.2370.024 | 1.00.1 | 1.00.1 |
| 2015 | 0.1340.003 | 0.2310.023 | ||
| W49A F | ||||
| 1994 | 0.0870.004 | 0.1320.013 | 1.00.1 | 1.00.1 |
| 2015 | 0.0850.003 | 0.1250.013 | ||
| W49A G2 | ||||
| 1994 | 0.0710.004 | 0.1090.011 | 0.800.1 | 0.60.1 |
| 2015 | 0.0570.003 | 0.0670.007 | ||
| W49A G3 | ||||
| 1994 | 0.1620.004 | 1.170.12 | 1.00.1 | 1.00.1 |
| 2015 | 0.1570.003 | 1.140.11 | ||
| W49A G4 | ||||
| 1994 | 0.1420.004 | 0.870.09 | 1.00.1 | 0.90.1 |
| 2015 | 0.1450.003 | 0.800.08 | ||
| W49A G5 | ||||
| 1994 | 0.0590.004 | 0.0820.008 | 1.10.1 | 1.00.1 |
| 2015 | 0.0620.003 | 0.0780.008 |
4 DISCUSSION
The G source appears to contain many of the most compact H ii regions in W49A (Smith et al., 2009; De Pree et al., 2000), suggesting these sources are among the youngest and most rapidly accreting in the region, and therefore the most likely to undergo radio flux density changes (Galván-Madrid et al., 2011). The 3.6 cm continuum peak of G2 is also located to the NE of the origin of a high velocity outflow traced in water masers (Smith et al., 2009; Gwinn et al., 1992), indicating that this is a highly active, disturbed and young region.
While the B-configuration 3.6 cm data presented here do not have sufficient spatial resolution to separate the known sub-sources of G2, we note that higher frequency, higher spatial resolution (7 mm) observations have indicated the presence of three sub-sources: G2a, G2b and G2c (De Pree et al., 2004, 2000). Figure 2b shows a detail image of the region around the detected decrease in 3.6 cm flux density in the G2 region (contours), overlaid with the 7mm continuum emission associated with the G2 sub-sources (pseudocolor). The locations of the nearest 7 mm continuum sources (G1, G2a, G2b and G2c) are indicated in Fig. 2b. The region of the detected decrease in 3.6 cm continuum emission is closest to the 7 mm source labeled G2c, offset by approximately 0.25″. This offset is larger than the nominal alignment between the 3.6 cm data and the 7 mm data (0.1″), which may have a number of possible explanations. First, the 7 mm data and early epoch 3.6 cm data are not concurrent. The 7 mm observations were made in 1995, 1998 and 2001, while the first epoch of the 3.6 cm data from which the difference image was made were observed in 1993-94. Thus, it is possible that the decrement (observed at 3.6 cm between 1993-94 and 2015) is from a region that had no detectable 7 mm emission by the time of its first high resolution observation in 1998 with the VLA. Second, the two images have very different resolutions (08 at 3.6 cm and 005 at 7 mm), and many of the UC sources are optically thick at 3.6 cm, resulting in sources that are centrally brightened at 3.6 cm and edge brightened in the higher resolution (and higher frequency) 7 mm images. Some of the offset thus may be due to the differing resolution and frequency of the two images. Finally, flux decrements interpreted in the context of Peters et al. (2010a), are not expected to occur at the exact peaks of UC H ii regions at all wavelengths, since the decrement position depends on the local position of fast recombination, and the optical depths are different at 3.6 cm and 7 mm.
Sources G2a and G2b have rising spectral indices (S) between 3.3 mm and 13 mm (1.1 and 0.8 respectively, De Pree et al. (2000)), and spectral indices with 1.0 are predicted for hypercompact H ii regions in analytical models (Keto et al., 2008), and simulations of gravitationally unstable accretion (Peters et al., 2010b). In addition, G2a and G2b have broad Radio Recombination Lines (RRLs), with VFWHM=5910 and 5814 km/s respectively (De Pree et al., 2004). While the spectral resolution in these observations is low (10.3 km/s), both G2a and G2b appear to have multiply-peaked spectra, also indicative of ionized outflow, and an early evolutionary stage.
Source G2c is the source closest (in projection) to the observed 3.6 cm decrement (025), and it is is located within the HPBW of the 3.6 cm decrement position. Sub-source G2c has an elongated shape that may indicate the presence of a bipolar ionized outflow from a high mass star in this region, and no detected RRL emission. Smith et al. (2009) discuss the detection of a compact mid-IR source (G:IRS1) to the SW of the G2a and G2b sources. While not coincident with any known UC H ii regions, G:IRS1 is coincident with a hot molecular core. Indeed, Figure 1a shows that G:IRS1 coincides with an extension in dense gas structures reported in Galván-Madrid et al. (2013) at the center of the W49N ‘ring’ of HC HII regions. As in many high mass star forming regions, it is clear that star formation activity in W49N is highly clustered, even on scales of 0.1 pc. Figure 9 in Smith et al. (2009) suggests a model that would place the flux density decrease in the location of a flattened rotating cloud core, a ready source of material for accretion events.
Peters et al. (2010a) suggest that when the accretion rate of a protostar suddenly increases due to an increase in the ambient density, the surrounding H ii region can contract, and then re-expand again over decade to century timescales (Galván-Madrid et al., 2011). An accretion event associated with source G2c, or a nearby source no longer observable to its NE, is the most likely source of the flux density variation detected in the 3.6 cm data between 1994 and 2015.
5 CONCLUSIONS
Observations of the W49A region at 3.6 cm at epochs in 1994 and 2015 have allowed a careful comparison of H ii region emission over a nearly 21 year period. One source, G2 (at 08 resolution) was found to exhibit a significant decrease in both peak intensity (20%) and integrated flux (40%). This decrease in flux density is consistent with a star’s radiation being shielded by a high-density clump approaching the star in a gravitationally unstable accretion flow, resulting in an increased recombination rate and reduced volume of ionized gas. Source G2c (detected at 7 mm) is possibly associated with this flux density decrease, but there is a 025 offset between the position of the flux density decrease detected at 3.6 cm and the 7 mm position of G2c.
Variable H ii sources like those found in Sgr B2 and W49A should continue to be monitored in order to further constrain the model of gravitationally unstable accretion (Peters et al., 2010a). High resolution molecular imaging with the Atacama Large Millimeter/submillimeter Array (ALMA) or the SubMillimeter Array (SMA) of these regions will further clarify the interplay between ionizing stars and the associated molecular material.
The authors acknowledge thorough and helpful comments from an anonymous referee. CGD and M-MML acknowledge support from NSF RUI award 1615311. RGM acknowledges support from UNAM-PAPIIT program IA102817.
References
- De Pree et al. (1995) De Pree, C. G., Rodriguez, L. F., Goss, W. M. 1995. RMAA, 31, 39
- De Pree et al. (1997) De Pree, C. G., Mehringer, D. M., Goss, W. M. 1997. ApJ, 482, 307
- De Pree et al. (2000) De Pree, C. G., Wilner, D. J., Goss et al., 2000, ApJ, 540, 308
- De Pree et al. (2004) De Pree, C. G.; Wilner, D. J.; Mercer, A. J., et al. 2004. ApJL, 600, 286
- De Pree et al. (2014) De Pree, C. G., Peters, T., Mac Low, M.-M., et al. 2014. ApJL, 781, L36
- De Pree et al. (2015) De Pree, C. G., Peters, T., Mac Low, M. M. et al, 2015, ApJ, 815, 123
- Dyson et al. (1995) Dyson, J. E., Williams, R.J.R., Redman, M.P. 1995. MNRAS, 277, 700
- Eden et al. (2018) Eden, D. J., Moore, T. J. T., Urquhart, J. S., et al. 2018, MNRAS, 477, 3369
- Franco-Hernandez et al. (2004) Franco-Hernandez, R., Rodriguez, L. 2005, ApJ, 604, L105
- Galván-Madrid et al. (2008) Galván-Madrid, R., Rodriguez, L. F., Ho, P., et al. 2008, ApJL, 674, L33
- Galván-Madrid et al. (2009) Galván-Madrid, R.; Keto, E.; Zhang, Q., et al. 2009. ApJL, 706, 1036
- Galván-Madrid et al. (2011) Galván-Madrid, R., Peters, T. Keto, E., et al. 2011, MNRAS, 416, 1033
- Galván-Madrid et al. (2013) Galván-Madrid, R., Liu, H. B., Zhang, Z.-Y., et al. 2013, ApJ, 779, 121
- Gwinn et al. (1992) Gwinn, C. R., Moran, J. M., & Reid, M. J. 1992, ApJ, 393, 149
- Hunter et al. (2018) Hunter, T. R., Brogan, C. L., MacLeod, G. C., et al. 2018, ApJ, 854, 170
- Hollenbach et al. (1994) Hollenbach, D., Johnstone, D., Lizano, S., Shu, F. 1994. ApJ, 428, 654
- Keto (2002) Keto, E. R., 2002, ApJ, 568, 754
- Keto (2007) Keto, E. R., 2007, ApJ, 666, 976
- Keto et al. (2008) Keto, E., Zhang, Q., & Kurtz, S. 2008, ApJ, 672, 423
- Klaassen et al. (2017) Klaassen, P. D., Johnston, K. G., Urquhart, J. S., et al. 2018, A&A 611, A99
- Kurtz et al. (1994) Kurtz, S., Churchwell, E., Wood, D.O.S., 1994. ApJL 91, 659
- Mac Low et al. (1991) Mac Low, M.-M., van Buren, D., Wood, D. O. S., & Churchwell, E. 1991, ApJ, 369, 395
- Peters et al. (2010a) Peters, T., Banerjee, R., Klessen, R. S., et al., 2010a, ApJ, 711, 1017
- Peters et al. (2010b) Peters, T., Mac Low, M.-M., Banerjee, R. et al. 2010b, ApJ, 719, 831
- Rivilla et al. (2015) Rivilla, V. M. Chandler, C. J., Sanz-Forcada, J. S., et al. 2015, ApJ, 808, 146
- Saral et al. (2015) Saral, G., Hora, J. L., Willis, S. E., et al. 2015, ApJ, 813, 25
- Smith et al. (2009) Smith, N., Whitney, B. A., Conti, P. S., De Pree, C. G., Jackson, J. M., 2009, MNRAS, 399, 952
- Stock et al. (2014) Stock, D. J., Peeters, E., Choi, W. D.-Y., & Shannon, M. J. 2014, ApJ, 791, 99
- Tenorio-Tagle (1979) Tenorio-Tagle, G., 1979, A&A, 71, 59
- Walker et al. (1982) Walker, R. C., Matsakis, D. N., Garcia-Barreto, J. A. 1982. ApJ, 255, 128
- Welch et al. (1987) Welch, L. Mw., Dreher, J. W., Jackson, J.M., et.al. 1987. Sci 238, 4833
- Wood & Churchwell (1989) Wood, D.O., Churchwell, E. 1989. ApJL, 69, 83
- Xie et al. (1996) Xie, T., Mundy, L. G., Vogel, S. N., & Hofner, P. 1996, ApJ, 473, L131
- Zhang et al. (2013) Zhang, B., Reid, M. J., Menten, K. M., Zheng, X. W., Brunthaler, A., Dame, T. M., Xu, Y., 2013, ApJ, 775, 79