observations of the rapidly oscillating Ap star 33 Lib (HD 137949): new frequencies and unique non-linear interactions
Abstract
We present the analysis of short cadence data of the rapidly oscillating Ap (roAp) star, 33 Librae (HD 137949). The precision afforded to the data allow us to identify at least 11 pulsation modes in this star, compared to the three previously reported. Reoccurring separations between these modes leads us to suggest a large frequency separation, , of Hz, twice that reported in the literature. Other frequency separations we detect may represent the small frequency separation, , but this is inconclusive at this stage due to magnetic perturbation of the frequencies. Due to the highly non-linear pulsation in 33 Lib, we identify harmonics to four times the principal frequency. Furthermore, we note a unique occurrence of non-linear interactions of the 11 identified modes. The frequency separations of the modes around the principal frequency are replicated around the first harmonic, with some interaction with the second harmonic also. Such a phenomenon has not been seen in roAp stars before. With revised stellar parameters, linear non-adiabatic modelling of 33 Lib shows that the pulsations are not greater than the acoustic cutoff frequency, and that the -mechanism can excite the observed modes. Our observations are consistent with 33 Lib having a rotation period much larger than 88 d as presented in the literature.
keywords:
asteroseismology – stars: chemically peculiar – stars: magnetic field – stars: oscillations – stars: individual: 33 Lib – techniques: photometric.1 Introduction
There exists a rare subclass of the chemically peculiar A stars which shows rapid oscillations in short cadence photometric and spectroscopic observations. These stars, known as roAp stars, were discovered by Kurtz (1982) through targeted photometry of a selection of Ap stars. Since then, only 61 of these objects have been discussed in the literature (for catalogues see Smalley et al., 2015; Joshi et al., 2016).
The chemical peculiarities in the Ap stars are a result of radiative elevation of, most significantly, singly and doubly ionised rare earth elements in the presence of a strong, stable, global, magnetic field (up to about 30 kG, e.g. Babcock, 1960) which suppresses convection. Typically, but not always, the radiatively elevated elements form chemical spots in the atmosphere of the star around the magnetic poles, and can show abundances of some elements greater that one million times solar (Ryabchikova et al., 2004). Due to the high stability of the magnetic field, these spots are also stable which can allow for the rotation period of the star to be measured through modulation of its mean light curve. A further property of the magnetic field in Ap stars is that it is misaligned with the rotation axis leading to an observed variable magnetic field strength as the star rotates. This model of understanding the observations of Ap stars is known as the oblique or rigid rotator model (Stibbs, 1950). Finally, the strong magnetic field in the Ap stars is thought to be the reason for their slow rotation when compared to their non-magnetic counter parts (Abt & Morrell, 1995; Stȩpień, 2000); rotation periods of a few of days to decades or centuries are not uncommon (Mathys, 2015).
The pulsations in the rapidly oscillating Ap stars are apparent in the period range min with amplitudes up to 34 mmag in -band observations (Holdsworth et al., 2018a). Their variability is thought to be driven by the -mechanism acting in the H i ionisation zone causing the excitement of high-overtone pressure modes (p modes; Balmforth et al., 2001; Saio, 2005). However, work by Cunha et al. (2013) has shown that turbulent pressure is also a viable driving mechanism, especially for those roAp stars pulsating with frequencies above their theoretical acoustic cutoff frequency. The ever increasing number of roAp stars with pulsations higher than the cutoff frequency (see figure 12 of Holdsworth et al., 2018b, for cases) shows a need for an improved understanding of the driving mechanisms in the roAp stars.
One of the goals of asteroseismology is the determination of fundamental stellar parameters through precise stellar models. This is achieved through the measurement of the large and/or small frequency separations ( and , respectively). To first order, the asymptotic relation for high-order p modes, which applies to the roAp stars, is given by Tassoul (1980) as , where is the radial overtone of the mode, is the angular degree of the mode, is the inverse of the sound travel time across the stellar diameter and is a correction term that depends essentially on the properties of the surface layers,. Gabriel et al. (1985) expressed as a function of stellar parameters such that Hz where is the gravitational constant. However, the application of this relation to the roAp stars is complicated by the presence of a magnetic field. Even a ‘weak’ field of only a few kG can perturb a pulsation frequency by between Hz ( d-1; Dziembowski & Goode, 1996; Bigot et al., 2000; Cunha & Gough, 2000; Saio & Gautschy, 2004; Saio, 2005; Cunha, 2006). The value has been measured for about 15 roAp stars, with varying degrees of agreement with spectroscopic and/or interferometric fundamental parameters (e.g. Martinez et al., 1991; Mkrtichian & Hatzes, 2005; Bruntt et al., 2009; Sachkov et al., 2011; Perraut et al., 2013).
In this paper we present our analysis of Kepler/K2 observations of the well known roAp star 33 Librae.
2 33 Librae (HD 137949)
33 Librae is a bright (), well studied roAp star. We present a compilation of 33 Lib’s properties in Table 1. The parameters shown in this table are mostly found in the work of Shulyak et al. (2013) where a detailed study of several bright Ap stars was conducted. We note that Kochukhov & Bagnulo (2006) also presented parameters of many chemically peculiar stars, but derive their results through a homogeneous study, rather than from a star-by-star study which is preferable. The radius, and therefore luminosity, provided by Shulyak et al. (2013) were calculated using the Hipparcos parallax of mas from van Leeuwen (2007). Given the release of Gaia DR2 data on this star, we provide an updated estimation of the radius and luminosity using the new parallax of mas (Gaia Collaboration et al., 2016; Gaia Collaboration et al., 2018). We use the updated values throughout the remainder of this paper.
| Parameter | Value | Reference |
| Mass (M⊙) | Shulyak et al. (2013) | |
| Radius (R⊙) | Shulyak et al. (2013) | |
| This work∗ | ||
| Temperature (K) | Shulyak et al. (2013) | |
| Luminosity (L⊙) | Shulyak et al. (2013) | |
| This work∗ | ||
| Surface gravity () | Shulyak et al. (2013) | |
| Parallax (mas) | Gaia Collaboration et al. (2016); Gaia Collaboration et al. (2018) | |
| (kG) | Mathys (2017) | |
| Rotation period (d) | Romanyuk et al. (2014) | |
| Mathys (2017) | ||
| ∗Scaled from Shulyak et al. (2013) results using the Gaia DR2 parallax. | ||
Observations of 33 Lib presented by Kurtz (1982) revealed the presence of only one pulsation mode, with a period of 8.27 min ( d-1). However later observations made in 1987 provided enough evidence for Kurtz (1991) to suggest a second frequency at about d-1 and also gave the first detection of the harmonic to the principal frequency. In discovering this second frequency, Kurtz (1991) suggested that the large frequency separation, the frequency difference between modes of the same angular degree but consecutive overtone, in this star is about 40 Hz.
Later, Hatzes et al. (1999) and Mkrtichian et al. (2003) observed 33 Lib spectroscopically for the first time with the 2-d coudé spectrograph at the McDonald Observatory. They found that, as with other roAp stars, the pulsation radial velocity (RV) amplitude varied with spectral region and line strength. Furthermore, Mkrtichian et al. (2003) found at least one radial node in the upper atmosphere of 33 Lib; a conclusion drawn from the anti-phase relation between pulsations measured predominantly in Nd ii and Nd iii. Those findings were confirmed by Kurtz et al. (2005a) and Ryabchikova et al. (2007), with Kurtz et al. detecting a further frequency in spectroscopic observations at 152.84 d-1. An attempt to verify that new frequency in photometry was presented by Kurtz et al. (2005c) but to no avail.
Through a spectroscopic study of 10 roAp stars, Kochukhov et al. (2007) highlighted 33 Lib as atypical for showing double wave RV variations in its pulsation frequency and a significant amplitude in its harmonic. Our photometric observations may provide a reason for this atypical behaviour.
Sachkov et al. (2011) performed an analysis of spectroscopic data spanning over 5 yr. They were able to confirm the second frequency at d-1and find a different third frequency at d-1. With the inclusion of this third frequency, the authors claimed to have a “perfect” solution to the 5-yr RV curve suggesting mode stability.
Most recently, Ofodum & Okeke (2018) presented the results of a 39 h -band photometric campaign of 33 Lib from 2013. They suggested there is significant amplitude modulation on a night-by-night basis, however they do not have the resolution to resolve closely spaced modes to discount beating. Analysis of their full data set showed a significant decrease in the amplitude of the principal mode when compared to the results of Kurtz (1982) and Kurtz (1991), which could be indicative of a long period rotational modulation. Finally, they presented a new frequency in 33 Lib at d-1, a frequency split from the principal by d-1. They proposed this second frequency could be a rotationally split side lobe, suggesting a rotation period of d.
Most of the detailed work published on 33 Lib is a result of spectroscopic observations. It is well known that spectroscopic observations of roAp stars are able to detect lower amplitude modes than photometric campaigns as a result of the atmospheric location of the pulsation. However, Holdsworth (2016) showed that observations have the necessary precision to detect low amplitude pulsation modes usually only seen spectroscopically. This provides us with confidence that the data presented in this work will be the definitive data set of 33 Lib for many years.
3 observations
33 Lib was observed by the Kepler Space Telescope (Borucki et al., 2010) during campaign 15 of its mission (Howell et al., 2014) in the short cadence (SC) mode. The campaign started on 2017 August 23 and ended 2017 November 19, covering a total of d.
3.1 Data reduction
To construct the light curve, we retrieved the target pixel file from the MAST server and created our own custom mask for the target following the method of Bowman et al. (2018). Our mask is larger than the standard to account for spacecraft motion and the target moving on the CCD. Although this has the disadvantage of potentially contaminating the light curve with background stars, 33 Lib is by far the brightest star in the frame at over 2 000 times brighter than the second brightest star within a 50 arcsec radius according to the simbad database. Once created, we used the custom mask to extract the light curve using kepextract routine from the pyke tools (Still & Barclay, 2012).
Due to the nature of the mission, the light curve is dominated by the drift of the telescope which is corrected for every h. In an attempt to remove these signatures, we employed the kepsff task in the PyKE tools which implements the technique of Vanderburg & Johnson (2014) to correct for the motion systematics of the spacecraft. This successfully reduced the effect, but did not completely remove it. To arrive at our final data set, we cleaned the light curve of obvious outliers which were uncorrected by the kepsff task, and then iteratively prewhitened the light curve to remove most of the low-frequency noise. Our final science light curve consists of 118 728 points.
Our treatment of the low-frequency signals also removes any astrophysical information in this frequency range too, i.e. signals from rotational variations or low-frequency pulsation modes. However, 33 Lib is a well studied star with an estimated rotational period of, in most cases, several years (Mathys et al., 1997; Mathys, 2017). We show, in Table 1, another estimate of the rotation period of d by Romanyuk et al. (2014) and find that Wolff (1975) suggested a period of d. Neither of these measurements include an error and as such we are dubious of their validity. Most recently, Ofodum & Okeke (2018) suggested a rotation period of d, however this was conjecture based on the possible detection of one rotationally split side lobe to the pulsation. Furthermore, our later pulsation analysis is in favour of the longer estimates of the rotation period for 33 Lib.
4 Pulsation analysis
To investigate the full range of possible pulsational variability of 33 Lib, we calculate a Fourier transform to the Nyquist frequency of the data set, namely d-1. The result of this is shown in Fig 1. Clearly evident in the amplitude spectrum is the principal peak at d-1, and its first harmonic at twice that frequency. Even at the scale of Fig. 1, the other pulsations signatures first discovered with spectroscopy are evident around the principal frequency.

Also apparent in Fig. 1 are very high-frequency peaks ( d-1). Close inspection of these peaks shows all but one of them to be non-symmetrical and highly jagged, indicating that they are either aliases of frequencies higher than the Nyquist frequency (which we think unlikely) or are not astrophysical in nature. The only ‘clean’ peak occurs at a frequency of d-1 which is the third harmonic of the principal peak (i.e. ). It is not surprising that we have harmonics of the principal mode in this star. The roAp stars are known to show non-sinusoidal variations and, at the precision of Kepler data, the detections of higher harmonics is not uncommon (e.g. Holdsworth et al., 2016).
In Fig. 2 we show a zoomed view of the frequency range around the principal frequency. Evident in the top panel is the principal mode, with a few further low-amplitude modes clearly present. In the bottom panel, we show the amplitude spectrum after the principal peak has been removed which reveals the presence of further modes.


To extract all pulsation frequencies from the light curve we iteratively perform a non-liner least-squares fit to the data and prewhiten each detected frequency. The results of this procedure are shown in Table 2. We are able to confidently identify 11 peaks which are significant (i.e. S/N) and have a ‘clean’ appearance.
| ID | Frequency | Amplitude | Phase |
|---|---|---|---|
| (d-1) | (mag) | (rad) | |
Fig. 3 shows the final amplitude spectrum after the subtraction of the frequencies in Table 2. There are still some signatures of variability present. However, a combination of their low signal-to-noise and non-clean appearance lead us to note their presence, but not include them in further analysis.

We do not detect two of the previously published frequencies presented in Sec. 1, namely the spectroscopically found frequency at d-1 from Kurtz et al. (2005a), nor the -band photometric frequency at 173.92 d-1 found by Ofodum & Okeke (2018). These non-detections could be a result of short mode growth and decay time-scales or energy transfer between modes, as is seen in other roAp stars (e.g. Kreidl et al., 1991; White et al., 2011).
The oblique pulsator model (Kurtz, 1982; Takata & Shibahashi, 1994, 1995; Bigot & Dziembowski, 2002; Bigot & Kurtz, 2011), which describes the pulsations seen in the roAp stars, predicts the presence of sidelobes to the pulsation frequency(ies) that are split by exactly the rotation frequency of the star. This is a result of the varying aspect at which the pulsation poles are viewed, leading to an apparent amplitude modulation of the mode(s). In our data, we do not detect rotational sidelobes to any of the pulsation peaks implying that either (i) the rotation period is longer than the duration of the data set or (ii) our line-of-sight and geometry of the star is such that we view the modes at constant co-latitude (within a few degrees). Although the latter is possible, our observations favour the long rotation period hypothesis, discussed below, which supports the claim that the rotation period is longer than the 6.34 d, 7.018 d and 23.26 d found in the literature (Ofodum & Okeke, 2018; Romanyuk et al., 2014; Wolff, 1975, respectively).
To test the stability of the principal pulsation mode over the observations, we split the light curve into segments of 25 pulsation cycles, or 0.144 d. We then calculate the amplitude and phase of the pulsation at fixed frequency. This test will provide us with an indication of potential rotational variation seen in the pulsation amplitude, and whether a pulsation node crosses the line-of-sight (as indicated by a phase reversal). The results of the test are shown in Fig. 4.
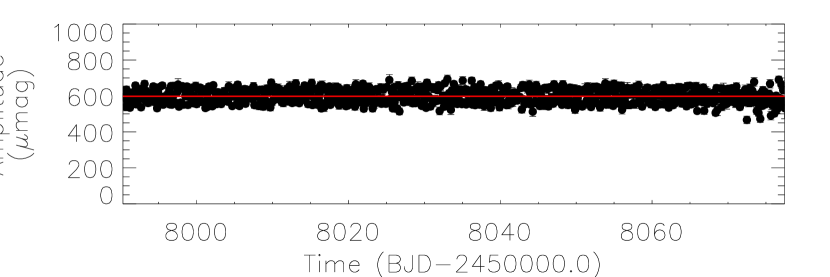

The top panel of Fig. 4 shows no large amplitude variations over the observations, but there is significant scatter about the mean (red) line. The bottom panel also shows no significant change in the pulsation phase of the principal frequency over the length of the observations. These two results demonstrate that a pulsation node does not cross the line-of-sight, and that there is no significant modulation of the mode amplitude over the observations in agreement with a long rotation period. Although these results do not rule out the latter case discussed above (i.e. our view of the pulsation mode), we discuss below a possible indication of long term amplitude variations and suggest a test to confirm this.
As 33 Lib was one of the first roAp stars discovered (Kurtz, 1982) there is a long time base of observations to check for amplitude modulation of the principal mode. However, this task is complicated by the different passband of the data. Using the conversion between and filters presented in Holdsworth et al. (2016) for HD 24355, we suggest that the amplitude measured here would have a amplitude of mmag. This is much greater than mmag presented by Kurtz (1982) and 1.5 mmag shown by Kurtz et al. (2005c), and a significant increase of the mmag presented by Ofodum & Okeke (2018). However the same amplitude ratio for HD 24355 in the different filters may not apply to 33 Lib. Amplitude ratios vary significantly between different roAp stars (Medupe & Kurtz, 1998), and the broadband K2 filter makes comparison with narrowband filter ratios nontrivial. Although an increase in amplitude could be real, new observations are required to confirm this change. Continued monitoring of the principal mode in 33 Lib could have the ability to provide the rotation period of this star.
4.1 Frequency separations
33 Lib is known to be a multimode pulsating roAp star. Kurtz (1991) suggested that the frequency separation between and could be the large frequency separation, i.e. Hz. Sachkov et al. (2011) found a slightly smaller separation between and of Hz. They argued that both this separation and twice its value are inconsistent with what would be expected for the large separation, given the star’s global parameters. In fact, considering the parameters from Shulyak et al. (2013) in Table 1 and the scaling of the large separation with the global parameters (see Sec. 1), we find that the expected is Hz. This is far from the separations presented by Kurtz (1991) and Sachkov et al. (2011), and is also far from twice those values.
With the photometry, and the presence of many more modes, we revisit the determination in 33 Lib. We calculate the differences between all of the frequencies shown in Table 2. We note, in Table 3, frequency differences that reoccur, and the corresponding frequency IDs. For clarity, we also show a labeled schematic plot of these frequencies in Fig. 5.
| ID | Frequency | Frequency |
|---|---|---|
| (d-1) | (Hz) | |

We have easily identified the value quoted in the literature. Considering that we have four modes separated by Hz, we suggest that the large separation for 33 Lib is actually twice the value quoted in the literature, i.e. =78.9 Hz. Taking the stellar mass as M⊙, such a large separation would correspond to a radius of R⊙, when applying the scaling from Sec. 1. This seismic radius is within of the radius inferred from the Gaia parallax (see Table 1), but still smaller than that observed.
To test the previously suggested value of Hz, we perform the same calculation and arrive at an expected stellar radius of R⊙which is even further way from that derived from the Gaia parallax. We are confident, therefore, that the value for 33 Lib is Hz.
In this context, it should be recalled that the magnetic field can perturb the frequencies by as much as Hz (Cunha & Gough, 2000; Saio & Gautschy, 2004; Saio, 2005; Cunha, 2006). However, except at particular frequencies, where significant jumps in the magnetic perturbations occur, the perturbation for a given mode degree increases slightly with frequency. Hence the large separations are expected to be less perturbed, increasing by a few Hz at the most, compared to the non-magnetic case. In practice this means that the non-magnetic large separation needed to compute the stellar mean density may be slightly smaller. To obtain the Gaia derived radius (given a mass of M⊙), the non-perturbed large separation required is Hz. This value is further away from the observed value given the magnetic perturbation. If we assume a more reasonable non-perturbed large separation of Hz, then we require a minimum stellar mass of M⊙ to regain the Gaia derived radius (within the errors), which is consistent with the observations.
Furthermore, there are two other frequencies of note; the separation of d-1 (28.94 Hz) and 0.91 d-1 (10.52 Hz). From our current observations, we are unsure if either of these frequencies represent the small separation, . A value of Hz is large for a main-sequence star and is more representative of a zero-age main-sequence star, whereas Hz is more applicable to the main-sequence. Previous studies of the small separation in roAp stars have found values around Hz (e.g. Mkrtichian et al., 2008; Saio et al., 2010). However, the magnetic perturbations mentioned above will also perturb the small separations. As combines modes of different angular degrees, the perturbation may actually be more significant, and, in practice, both the values observed in 33 Lib may be plausible.
One further issue with a large frequency separation of Hz is that it requires alternating modes of different angular degrees (e.g. ) with almost exact spacing (the difference being on the order of nHz). However, even in the absence of a magnetic field this exact spacing is generally not expected. For example, in the study of Cir, Bruntt et al. (2009) have shown that non-magnetic models may predict an exact spacing only in a specific frequency range. Moreover the magnetic perturbations would be expected to make that spacing even more different, because they would affect modes of different angular degrees differently. Clearly, detailed modelling of 33 Lib taking into account the magnetic field is needed to identify the observed modes, verify the consistency of model and observed large separation and establish the value of the small separation.
4.2 Beating
In producing the top panel of Fig. 4, we notice that there is some deviation from a constant amplitude in this star. Closer inspection of the data used to create Fig. 4 reveals a periodic variation in the amplitude on a relatively short time scale. The strongest signatures in the amplitude spectrum of this data, shown in Fig. 6, are at frequencies of d-1, d-1 and d-1. These frequencies correspond to the frequency separations shown in Table 3. This shows that there is beating of these closely spaced peaks, as one would expect. We fold the amplitude data shown in Fig. 4 on the dominant frequency (3.4091 d-1) and show this folded amplitude curve in Fig. 7. The scatter seen in the plot is due to the presence of the two other frequencies.

.

The beating signal detected here may potentially hamper efforts to measure the rotation period of 33 Lib through long-term monitoring of the amplitude of its principal pulsation mode. Given a sufficient data length, the effect of beating will be averaged out, which must be considered in any attempt to derive the rotation period in this way.
4.3 Analysis of the harmonics
As previously stated, we are able to detect up to the third harmonic of the principal pulsation. For information, we present the extracted harmonics in Table 4.
| ID | Frequency | Amplitude | Phase |
|---|---|---|---|
| (d-1) | (mag) | (rad) | |
More interesting than the harmonics themselves is the presence of other peaks in their vicinity. This is most apparent around but also occurs at . One would expect that harmonics of the other modes around would appear in the amplitude spectrum at two times their frequency. However this is not the case. In Fig. 8 we show an amplitude spectrum around the first harmonic peak, and a schematic of the extracted frequencies that are presented in Table 5.


| ID | Frequency | Amplitude | Phase | Calculated difference |
|---|---|---|---|---|
| (d-1) | (mag) | (rad) | (d-1) | |
We find that the frequencies about the harmonic can all be described by combinations of the principal frequency and the other peaks in that frequency range, suggesting that there is significant non-linear mode coupling occurring in 33 Lib. To test how closely a combination frequency is to the observed frequency, we calculate the expected frequency and find the difference to the observed frequency. The last column in Table 5 shows the difference between these expected and observed frequencies.
The agreement, often between , implies that our assumption of non-linear interactions is correct. We perform this check in the ‘ideal’ case, where the frequencies and errors are true representations of the intrinsic frequencies. However the length of the observations means that the Rayleigh resolution is no better than about d-1 (Hz) so we argue that all the frequencies in Table 5 are in agreement with the expected results of non-linear mode coupling.
In the case of non-linear interactions, we expect to find the same pattern of frequencies repeated in the low-frequency range too (see e.g. Kurtz et al., 2015; Bowman, 2017), i.e. around . To investigate this, we use the raw long cadence data (as the noise level is lower) of 33 Lib which has been subjected to only the kepsff routine to remove the thruster firings and no iterative pre-whitening of low-frequencies. We find no significant peaks at the expected frequencies however the noise in the this region of light curves is significantly higher and may hide the frequencies that we are searching for.
We pursue this line of enquiry by force fitting, using linear least squares, the expected frequencies to the light curve. As we know the expected frequencies of the peaks, we are able to search in the noise for their presence since the formal amplitude noise is approximately a quarter of the amplitude of the highest peaks. In force fitting a frequency of 3.4094 d-1, we are able to suggest the presence of a peak at . Although not robustly significant, the presence of the peak here supports our argument of non-linear coupling. Despite the tentative detection of difference frequencies, the significant detection of sum frequencies detected in 33 Lib is the first observation of such a phenomenon in the roAp stars.
It is apparent from the amplitudes presented in Table 5 that the precision of the data needs to be in the micro-magnitude range to detect non-linear mode coupling in this star. The most precise ground-based observations of an roAp star achieved a precision of 14 mag (Kurtz et al., 2005b) which would not have been sufficient to detect the coupled frequencies seen in 33 Lib. It is clear that, currently, only space-based observatories are capable of obtaining such precision. Of the multi-periodic roAp stars observed by Kepler, KIC 8677585 also shows multiple occurrences of the same separation between some modes around the principal frequency and at the harmonic, which the authors interpret as the large frequency separation (Balona et al., 2013). There are, however, some frequency patterns around the harmonic which are combinations of the frequencies about the principal, although the authors do not mention (or perhaps notice) this. We propose that the roAp star KIC 8677585 is also showing non-linear coupling, and the low-frequency peak thought to be a pulsation in this star is actually just a signature of beating between the high-frequency modes.
5 Modelling
The mechanism responsible for the driving of roAp pulsations has been a matter of debate since these pulsators were first discovered. The instability strip and frequency properties derived based on the excitation by the -mechanism acting on the H i ionization zone in models with envelope convection assumed to be suppressed by the magnetic field (Cunha, 2002) can explain the oscillations observed in most of the roAp stars known. However, in some roAp stars, the observed frequencies seem to be too high to be explained by this mechanism, requiring an alternative driving agent, such as the turbulent pressure proposed to explain the pulsations observed in the roAp star Cir (Cunha et al., 2013), whose radius had previously been determined from interferometry (Bruntt et al., 2008). It is important to note that testing whether the -mechanism may be responsible for the excitation of pulsations in a given roAp star requires an accurate determination of the star’s classical parameters, in particular, the stellar radius. An example of this is the roAp star 10 Aql, whose frequencies were previously thought to be too high to be explained by the -mechanism. Measurement of 10 Aql’s radius by interferometry (Perraut et al., 2013) has, however, demonstrated that the frequency region where this star exhibits pulsations can be reconciled with the region where they are predicted to be excited by the -mechanism (Cunha et al., 2013).
33 Lib is one of the stars that were previously thought to have pulsation frequencies too high to be driven by the -mechanism. However, the new parallax and consequent downward revision of the star’s radius brings that conclusion into question. To test whether this mechanism may be responsible for the observed pulsations we have carried out a linear, non-adiabatic stability analysis based on the star’s updated global parameters (see Table 1). The analysis followed closely that performed by Cunha et al. (2013). We have considered four different case studies. The first (standard) case is for an equilibrium model with a surface helium abundance of and an atmosphere that extends to a minimum optical depth of , and the pulsations are computed with a fully reflective boundary condition. The other three cases are all similar to this one, except that the above options are modified one at the time to: ; ; transmissive boundary condition (for further details on the models see Cunha et al., 2013). In all cases the envelope convection was assumed to be suppressed by the magnetic field at all latitudes, as in Cunha (2002), providing the most favourable scenario for excitation.
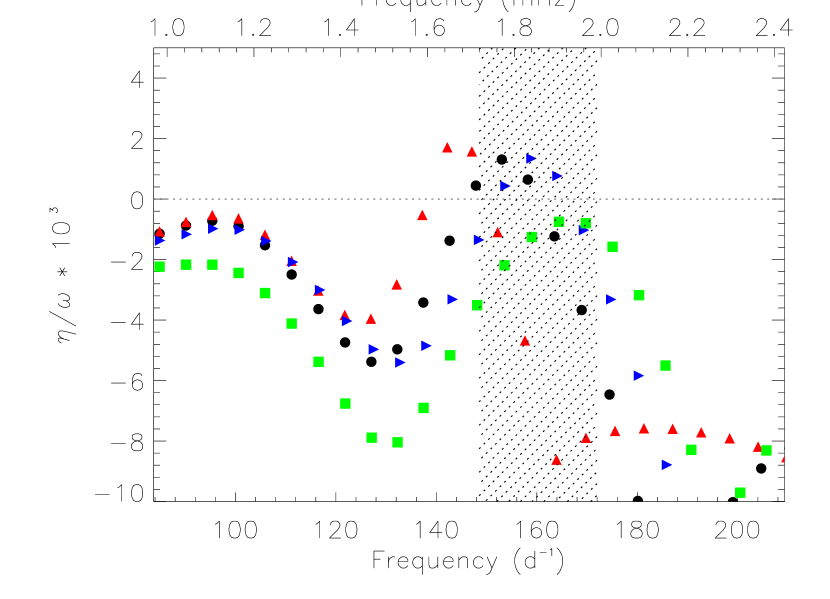
Fig. 9 presents the growth rates, , relative to the real part of the angular oscillation frequencies, as a function of the cyclic frequencies, for the four cases considered. Excitation is expected whenever the growth rates are positive. Also shown is the frequency region where oscillations are observed in 33 Lib (diagonally hatched region). Overall, the observed frequency range coincides with the frequency range where oscillations are expected to be excited by the -mechanism. We thus conclude that this mechanism can explain the pulsations exhibited by 33 Lib and emphasise the importance of having accurate stellar parameters before concluding about the need for an alternative driving agent.
6 Summary and Conclusions
We have presented the analysis of the most precise data for the well known roAp star 33 Librae. observations over 88 d have allowed us to identify 11 pulsation modes in this star, far more than previously detected. We also find harmonics of the principal mode up to showing how non-linear the pulsation is in 33 Lib.
Due to the detection of so many previously unidentified modes, we have been able to find many modes separated by the same frequency. We surmise that one of these frequencies, d-1, represents half of the large frequency separation, providing Hz, which is appropriate for a star on the main-sequence. Of the other two frequency separations, one may represent the small frequency separation, with the other being the difference between the two separations. Confident confirmation of these suggestions will come with detailed, star specific, modelling.
Even after removing the 11 frequencies from the data, the amplitude spectrum (Fig. 3) still shows some significant variability. We have neglected to fit and remove these signatures as none show a clean sinc-like profile which is perhaps a result of amplitude/frequency variability at these very low amplitudes (mag). If detailed modelling can predict frequencies that we have not extracted here (Table 2), revisiting the peaks in Fig. 3 may be useful.
The most intriguing result of this analysis is the repetition of the frequency spacings of the principal peak around its harmonic(s). One would expect that frequencies at the harmonic are separated by twice the value of the separation around the principal frequency. The close to exact spacings suggest that there is significant non-linear mode coupling between the frequencies. We surmise that the harmonics of the frequencies through to have too low amplitudes to be detected, and that the non-linear mode coupling is dominant here. This is the first time that such non-linear interactions have been seen in an roAp star.
As previously discussed, the oblique pulsator model predicts amplitude modulation of the pulsation mode and side lobes to the mode separated by the rotation frequency. One can argue that we detect both of these model predictions in 33 Lib; the frequencies split from by d-1 could represent a quintuplet expected for a quadrupole mode. The unequal side lobe amplitudes and a missing side lobe at could be a result of either the Coriolis force, unfavourable geometry, mode distortion or a combination of all three. However, we argue here that the separation frequency and the beat period are not representative of the rotation frequency of this star. Such a rotation frequency, given the stellar parameters in Table 1, would mean that 33 Lib is rotating at per cent critical velocity. Such a velocity is unusual for A stars in general, and unheard of in the Ap stars (Abt & Morrell, 1995; Royer et al., 2007). We are therefore confident in our conclusion that the frequency of d-1 represents , and the amplitude modulation shown in Fig. 7 is a result of beating of modes separated by .
Finally, our linear, non-adiabatic modelling of 33 Lib, with the revised stellar parameters based on the Gaia parallax, has shown that this star is not pulsating above its theoretical acoustic cutoff frequency as previously thought. With a smaller radius and lower luminosity values, we are able to find models in which oscillations are excited by the -mechanism. This result reinforces the need for accurate stellar parameters when modelling the pulsations observed in the roAp stars.
Acknowledgements
DLH acknowledges financial support from the Science and Technology Facilities Council (STFC) via grant ST/M000877/1 and the National Research Foundation (NRF) of South Africa. MSC is supported by Fundação para a Ciência e a Tecnologia (FCT) through national funds (UID/FIS/04434/2013) and by FEDER through COMPETE2020 program (grants POCI-01-0145-FEDER-007672 and POCI-01-0145-FEDER-030389) and through the Investigador FCT contract No IF/00894/2012/CP0150/CT0004. The research leading to these results has received funding from the European Research Council (ERC) under the European Union’s Horizon 2020 research and innovation programme (grant agreement No 670519: MAMSIE). This work has made use of data from the European Space Agency (ESA) mission Gaia (https://www.cosmos.esa.int/gaia), processed by the Gaia Data Processing and Analysis Consortium (DPAC, https://www.cosmos.esa.int/web/gaia/dpac/consortium). Funding for the DPAC has been provided by national institutions, in particular the institutions participating in the Gaia Multilateral Agreement. We thank the referee for a careful consideration of the manuscript and complimentary comments and suggestions.
References
- Abt & Morrell (1995) Abt H. A., Morrell N. I., 1995, ApJS, 99, 135
- Babcock (1960) Babcock H. W., 1960, ApJ, 132, 521
- Balmforth et al. (2001) Balmforth N. J., Cunha M. S., Dolez N., Gough D. O., Vauclair S., 2001, MNRAS, 323, 362
- Balona et al. (2013) Balona L. A., et al., 2013, MNRAS, 432, 2808
- Bigot & Dziembowski (2002) Bigot L., Dziembowski W. A., 2002, A&A, 391, 235
- Bigot & Kurtz (2011) Bigot L., Kurtz D. W., 2011, A&A, 536, A73
- Bigot et al. (2000) Bigot L., Provost J., Berthomieu G., Dziembowski W. A., Goode P. R., 2000, A&A, 356, 218
- Borucki et al. (2010) Borucki W. J., et al., 2010, Science, 327, 977
- Bowman (2017) Bowman D. M., 2017, Amplitude Modulation of Pulsation Modes in Delta Scuti Stars, doi:10.1007/978-3-319-66649-5.
- Bowman et al. (2018) Bowman D. M., Buysschaert B., Neiner C., Pápics P. I., Oksala M. E., Aerts C., 2018, preprint, (arXiv:1805.01799)
- Bruntt et al. (2008) Bruntt H., et al., 2008, MNRAS, 386, 2039
- Bruntt et al. (2009) Bruntt H., et al., 2009, MNRAS, 396, 1189
- Cunha (2002) Cunha M. S., 2002, MNRAS, 333, 47
- Cunha (2006) Cunha M. S., 2006, MNRAS, 365, 153
- Cunha & Gough (2000) Cunha M. S., Gough D., 2000, MNRAS, 319, 1020
- Cunha et al. (2013) Cunha M. S., Alentiev D., Brandão I. M., Perraut K., 2013, MNRAS, 436, 1639
- Dziembowski & Goode (1996) Dziembowski W. A., Goode P. R., 1996, ApJ, 458, 338
- Gabriel et al. (1985) Gabriel M., Noels A., Scuflaire R., Mathys G., 1985, A&A, 143, 206
- Gaia Collaboration et al. (2016) Gaia Collaboration et al., 2016, A&A, 595, A1
- Gaia Collaboration et al. (2018) Gaia Collaboration Brown A. G. A., Vallenari A., Prusti T., de Bruijne J. H. J., Babusiaux C., Bailer-Jones C. A. L., 2018, preprint, (arXiv:1804.09365)
- Hatzes et al. (1999) Hatzes A. P., Kanaan A., Mkrtichian D., 1999, in Hearnshaw J. B., Scarfe C. D., eds, Astronomical Society of the Pacific Conference Series Vol. 185, IAU Colloq. 170: Precise Stellar Radial Velocities. p. 183
- Holdsworth (2016) Holdsworth D. L., 2016, Information Bulletin on Variable Stars, 6185
- Holdsworth et al. (2016) Holdsworth D. L., Kurtz D. W., Smalley B., Saio H., Handler G., Murphy S. J., Lehmann H., 2016, MNRAS, 462, 876
- Holdsworth et al. (2018a) Holdsworth D. L., et al., 2018a, MNRAS, 473, 91
- Holdsworth et al. (2018b) Holdsworth D. L., Saio H., Bowman D. M., Kurtz D. W., Sefako R. R., Joyce M., Lambert T., Smalley B., 2018b, MNRAS, 476, 601
- Howell et al. (2014) Howell S. B., et al., 2014, PASP, 126, 398
- Joshi et al. (2016) Joshi S., et al., 2016, A&A, 590, A116
- Kochukhov & Bagnulo (2006) Kochukhov O., Bagnulo S., 2006, A&A, 450, 763
- Kochukhov et al. (2007) Kochukhov O., Ryabchikova T., Weiss W. W., Landstreet J. D., Lyashko D., 2007, MNRAS, 376, 651
- Kreidl et al. (1991) Kreidl T. J., Kurtz D. W., Bus S. J., Kuschnig R., Birch P. B., Candy M. P., Weiss W. W., 1991, MNRAS, 250, 477
- Kurtz (1982) Kurtz D. W., 1982, MNRAS, 200, 807
- Kurtz (1991) Kurtz D. W., 1991, MNRAS, 249, 468
- Kurtz et al. (2005a) Kurtz D. W., Elkin V. G., Mathys G., 2005a, MNRAS, 358, L6
- Kurtz et al. (2005b) Kurtz D. W., et al., 2005b, MNRAS, 358, 651
- Kurtz et al. (2005c) Kurtz D. W., Handler G., Ngwato B., 2005c, Information Bulletin on Variable Stars, 5647
- Kurtz et al. (2015) Kurtz D. W., Shibahashi H., Murphy S. J., Bedding T. R., Bowman D. M., 2015, MNRAS, 450, 3015
- Martinez et al. (1991) Martinez P., Kurtz D. W., Kauffmann G. M., 1991, MNRAS, 250, 666
- Mathys (2015) Mathys G., 2015, in Balega Y. Y., Romanyuk I. I., Kudryavtsev D. O., eds, Astronomical Society of the Pacific Conference Series Vol. 494, Physics and Evolution of Magnetic and Related Stars. p. 3
- Mathys (2017) Mathys G., 2017, A&A, 601, A14
- Mathys et al. (1997) Mathys G., Hubrig S., Landstreet J. D., Lanz T., Manfroid J., 1997, A&AS, 123, 353
- Medupe & Kurtz (1998) Medupe R., Kurtz D. W., 1998, MNRAS, 299, 371
- Mkrtichian & Hatzes (2005) Mkrtichian D. E., Hatzes A. P., 2005, A&A, 430, 263
- Mkrtichian et al. (2003) Mkrtichian D. E., Hatzes A. P., Kanaan A., 2003, MNRAS, 345, 781
- Mkrtichian et al. (2008) Mkrtichian D. E., Hatzes A. P., Saio H., Shobbrook R. R., 2008, A&A, 490, 1109
- Ofodum & Okeke (2018) Ofodum C. N., Okeke P. N., 2018, New A, 65, 67
- Perraut et al. (2013) Perraut K., et al., 2013, A&A, 559, A21
- Romanyuk et al. (2014) Romanyuk I. I., Semenko E. A., Kudryavtsev D. O., 2014, Astrophysical Bulletin, 69, 427
- Royer et al. (2007) Royer F., Zorec J., Gómez A. E., 2007, A&A, 463, 671
- Ryabchikova et al. (2004) Ryabchikova T., Nesvacil N., Weiss W. W., Kochukhov O., Stütz C., 2004, A&A, 423, 705
- Ryabchikova et al. (2007) Ryabchikova T., Sachkov M., Kochukhov O., Lyashko D., 2007, A&A, 473, 907
- Sachkov et al. (2011) Sachkov M., Hareter M., Ryabchikova T., Wade G., Kochukhov O., Shulyak D., Weiss W. W., 2011, Monthly Notices of the Royal Astronomical Society, 416, 2669
- Saio (2005) Saio H., 2005, MNRAS, 360, 1022
- Saio & Gautschy (2004) Saio H., Gautschy A., 2004, MNRAS, 350, 485
- Saio et al. (2010) Saio H., Ryabchikova T., Sachkov M., 2010, MNRAS, 403, 1729
- Shulyak et al. (2013) Shulyak D., Ryabchikova T., Kochukhov O., 2013, A&A, 551, A14
- Smalley et al. (2015) Smalley B., et al., 2015, MNRAS, 452, 3334
- Stȩpień (2000) Stȩpień K., 2000, A&A, 353, 227
- Stibbs (1950) Stibbs D. W. N., 1950, MNRAS, 110, 395
- Still & Barclay (2012) Still M., Barclay T., 2012, PyKE: Reduction and analysis of Kepler Simple Aperture Photometry data, Astrophysics Source Code Library (ascl:1208.004)
- Takata & Shibahashi (1994) Takata M., Shibahashi H., 1994, PASJ, 46, 301
- Takata & Shibahashi (1995) Takata M., Shibahashi H., 1995, PASJ, 47, 219
- Tassoul (1980) Tassoul M., 1980, ApJS, 43, 469
- Vanderburg & Johnson (2014) Vanderburg A., Johnson J. A., 2014, PASP, 126, 948
- White et al. (2011) White T. R., Bedding T. R., Stello D., Kurtz D. W., Cunha M. S., Gough D. O., 2011, MNRAS, 415, 1638
- Wolff (1975) Wolff S. C., 1975, ApJ, 202, 127
- van Leeuwen (2007) van Leeuwen F., 2007, A&A, 474, 653