Forward Elastic Scattering and Pomeron Models
Abstract
Recent data from LHC13 by the TOTEM Collaboration have indicated an unexpected decrease in the value of the parameter and a value in agreement with the trend of previous measurements at 7 and 8 TeV. These data at 13 TeV are not simultaneously described by the predictions from Pomeron models selected by the COMPETE Collaboration, but show agreement with the maximal Odderon dominance, as recently demonstrated by Martynov and Nicolescu. Here we present a detailed analysis on the applicability of Pomeron dominance by means of a general class of forward scattering amplitude, consisting of even-under-crossing leading contributions associated with single, double and triple poles in the complex angular momentum plane and subleading even and odd Regge contributions. The analytic connection between and is obtained by means of singly subtracted dispersion relations and we carry out fits to and data in the interval 5 GeV - 13 TeV. The data set comprises all the accelerator data below 7 TeV and we consider two independent ensembles by adding either only the TOTEM data or TOTEM and ATLAS data at the LHC energy region. In the data reductions to each ensemble the uncertainty regions are evaluated with both one and two standard deviation ( 68 % and 95 % CL, respectively). Besides the general analytic model, we investigate four particular cases of interest, three of them typical of outstanding models in the literature. We conclude that, within the experimental and theoretical uncertainties and both ensembles, the general model and three particular cases are not able to describe the and data at 13 TeV simultaneously. However, if the discrepancies between the TOTEM and ATLAS data are not resolved, one Pomeron model, associated with double and triple poles and with only 7 free parameters, seems not to be excluded by the complete set of experimental information presently available.
pacs:
13.85.-t, 13.85.Lg, 11.10.Jj, 13.85.DzI Introduction
In elastic hadron-hadron collisions, the forward scattering is characterized by two physical observables, the total cross section, , and the parameter. In terms of the scattering amplitude and its Mandelstam variables ( and , energy and momentum transfer squared in the c.m. system), the former is given by the optical theorem, which at high energies can be expressed by pred
| (1) |
and the later, associated with the phase of the amplitude, is defined by
| (2) |
where indicates the forward direction.
Since the real and imaginary parts of the amplitude can be formally correlated by means of dispersion relations, Eqs. (1) and (2) provide a fundamental physical connection between the phase of the amplitude () and the total probability of the hadronic interaction (), as a function of the energy. However, despite their rather simple analytic forms, the investigation of these two quantities in terms of the energy, constitute a long-standing challenge in the study of the hadronic interactions giulia .
In the experimental context, to access the forward and near forward region demands complex and sophisticated instrumentation and data analyses. In addition, the difficulties grow progressively as the energy increases. For example, the parameter is determined in the region of interference between the Coulomb and hadronic interactions, which are of the same magnitude at values of the momentum transfer proportional to the inverse of the total cross section (see for example block , Sect. 4). As a consequence of the rise of at the highest energies, it becomes extremely difficult to reach this region as the energy increases.
In the theoretical QCD context, this deep (extreme) infrared region () is not expected to be accessed by perturbative techniques. A crucial point concerns the absence of a nonperturbative approach able to predict the energy dependence of and from first principles and without model assumptions.
In the phenomenological context, beyond classes of models including other physical quantities444For recent reviews see, for example, giulia ; block ; dremin ., and are usually investigated by means of amplitude analyses, an approach based on the Regge-Gribov theory and analytic -Matrix concepts. In this formalism collins ; fr , the singularities in the complex angular momentum -plane (-channel) are associated with the asymptotic behavior of the elastic scattering amplitude in terms of the energy (-channel). In the general case, associated with a pole of order , the contribution to the imaginary part of the forward amplitude in the -channel is , where is the intercept of the trajectory (see Appendix B in fms17b for a recent short review). Therefore, for the total cross section we have
and the following possibilities connecting the singularities (-plane) and the asymptotic behavior:
-
•
simple pole () at , with constant;
-
•
simple pole () at ;
-
•
double pole () at , with ;
-
•
triple pole () at , with .
For an elastic particle-particle and antiparticle-particle scattering, given the above inputs for , through Eq. (1), the even and odd contributions associated with are defined (Crossing) and the corresponding real parts are obtained by means of dispersion relations (Analyticity), leading to in Eq. (2).
Historically, the leading contribution to at the highest energies has been associated with an even-under-crossing object named Pomeron (from a QCD viewpoint, a color singlet made up of two gluons in the simplest configuration) fr . Typical Pomeron models consider contributions associated with either a simple pole at (for example, Donnachie and Landshoff dl79 and some QCD-inspired models bghp ) or a triple pole at (as selected in the detailed analysis by the COMPETE Collaboration compete1 ; compete2 and used in the successive editions of the Review of Particle Physics, by the Particle Data Group (PDG) pdg16 ).
However, recently, new experimental information on and from LHC13 were reported by the TOTEM Collaboration totem1 ; totem2 :
| (3) |
indicating an unexpected decrease in the value of the parameter and in agreement with the trend of previous measurements at 7 and 8 TeV. Indeed, recent investigation concerning bounds on the rise of , including all TOTEM data at 7 and 8 TeV and the L parameterization fms17a , has predicated at 13 TeV the value 110.7 1.2 mb, which is in full agreement with the above measurement. However, for at 13 TeV the extrapolation yielded 0.1417 0.0047, indicating complete disagreement with the data and far above the experimental result (see Table 4 in fms17a ). Moreover, the results (3) are not simultaneously described by all the predictions of the Pomeron models from the detailed analysis by the COMPETE Collaboration in 2002 compete1 , as pedagogically shown in Figure 18 of totem2 ).
Remarkably, the odd-under-crossing asymptotic contribution, introduced by Lukaszuk and Nicolescu odderon and named Odderon oddname (from a QCD viewpoint, a color-singlet made up of three gluons in the simplest configuration) braun , provides quite good descriptions of the experimental data, as predicted by the Avila-Gauron-Nicolescu model agn and demonstrated recently in the analyses by Martynov and Nicolescu martynico1 ; martynico2 .
On the other hand, also recently, the above data at 13 TeV have been analyzed by Khoze, Martin and Ryskin in the context of a QCD-based multichannel eikonal model (Pomeron dominance), tuned in 2013 with data up to 7 TeV kmr14 . The analysis indicates that the data at 13 TeV are reasonably described without an odd-signature term kmr1 . Moreover, the authors also argument that the maximal Odderon is inconsistent with the black-disk limit kmr2 . Very recently, subsequent articles have also discussed possible effects related to Odderon contributions in different contexts kmr .
In view of all these recent information and the fact that forward amplitude analyses have favored the Pomeron dominance, at least, up to 8 TeV, it seems important to develop detailed tests on the applicability of the Pomeron models by means of a general class of forward scattering amplitudes. With that in mind, we have already reported two forward analyses with Pomeron dominance and including, for the first time, the TOTEM data at 13 TeV. In the first work, two models have been tested, without taking into account the uncertainty regions in the data reductions blm18a (as in the Martynov and Nicolescu analyses martynico1 ; martynico2 ). We concluded that the models are not able to satisfactorily describe the and data at 13 TeV. In the second analysis, we have considered one Pomeron model with 6 free parameters and have evaluated the uncertainty regions with confidence level (CL) of 90 %. We have concluded that the model seems not to be excluded by the bulk of experimental data presently available blm18b .
In this paper, we shall extend our investigation in several important aspects. The main point is to consider classes of even leading contributions by incorporating different components of several models and investigating the effect of several combinations, with focus on the uncertainties involved in the data reductions. To this end, we shall treat a general parameterization for consisting of constant, power, logarithmic and logarithmic squared functions of the energy, together with even and odd Reggeons ( and trajectories, respectively) for the low energy region. The analytic connection with is obtained by means of even and odd singly subtracted dispersion relations. We carry out fits to and data on and in the interval 5 GeV - 13 TeV through the general parameterization as well as four particular cases, three of them typical of outstanding models in the literature.
However, there is an intrinsic difficulty with this kind of analysis deserving attention from the beginning. In what concerns the and data, despite the great expectations with the LHC, the experimental information presently available are characterized by discrepancies between the measurements of by the TOTEM Collaboration and by the ATLAS Collaboration at 7 TeV and mainly at 8 TeV. Some consequences of these discrepancies have already been discussed by Fagundes, Menon and Silva fms17a and by us in blm18b . In their first analysis, Martynov and Nicolescu present arguments for not including the ATLAS data martynico1 , which, however, have been included in their second analysis martynico2 . We shall return to these important topics along the paper.
It should be also noted that the uncertainties in the TOTEM measurements of are essentially systematic (uniform distribution) and not statistical (Gaussian distribution). This fact puts limitations in a strict interpretation of the test of goodness-of-fit. This point is discussed in certain detail in Ref. fms17b , Table 1 and Appendix A, specially Sect. A.1.
Here, to address the above question and as in previous analyses fms17a ; fms17b ; blm18a ; blm18b , we shall adopt two variants for defining our data set: all the experimental data below 7 TeV (above 5 GeV) and two independent ensembles by adding either only the TOTEM data at 7, 8 and 13 TeV (ensemble T) or by including also the ATLAS data at 7 and 8 TeV (ensemble T+A). In addition, in order to investigate and stress the importance of the uncertainty regions in the fit results, we shall consider data reductions with two different CL, associated with both one and two standard deviations (), namely 68.27 % and 95.45 % CL respectively.
Taking into account the aforementioned critical remarks related to the LHC data, as well as, within the theoretical and experimental uncertainties and both ensembles, our main conclusions from the data reductions are the following: (1) the general analytic model and three particular cases cannot describe, simultaneously, the and data at 13 TeV; (2) one particular Pomeron model, with only 7 free parameters and associated with double and triple poles, seems not to be excluded by the bulk of experimental data presently available; (3) for this Pomeron model additional tests on the effect of the subtraction constant and the energy cutoff for data reductions, select the constant as a free fit parameter and cutoff at 5 GeV. These results corroborate our previous conclusion blm18a , now with 1 and 2 .
The manuscript is organized as follows. The analytic models are introduced in Sect. 2 and the fit procedures and results are presented in Sect. 3. In Sect. 4 we discuss all the results and in Sect. 5 we present our conclusions and final remarks. In an Appendix it is treated some additional tests together with discussions on the results.
II Analytic Models
As commented in our introduction, in the Regge-Gribov theory, simple, double and triple poles in the complex angular momentum plane are associated with power, logarithmic and logarithmic squared functions of the energy for the total cross section. In this context, for and scattering, we consider a general parameterization for consisting of two Reggeons (even and odd under crossing) and four (even) Pomeron contributions:
| (4) |
where for , for , while , , , , are free fit parameters associated with the secondary Reggeons, , , , , are the free parameters associated with Pomeron components and is an energy scale to be discussed in what follows.
The analytic results for have been obtained by means of singly subtracted derivative dispersion relations bks , taking into account an effective subtraction constant :
| (5) | |||||
As discussed in detail in Appendix C of fms17b (and quoted references), avoids the full high-energy approximation in dispersion relation approaches.
Here, following fms17b ; fms17a ; blm18a ; blm18b , we consider the energy scale fixed at the physical threshold for scattering states,
where is the proton mass (see Sect. 4.3 in ms13b for discussions on this choice).
Eqs. (4) and (5) bring enclosed analytic structures similar to those appearing in some well known models, as for example, Donnachie and Landshoff (DL) dl79 , Block and Halzen (BH) bh1 , COMPETE and PDG parameterizations (COMPETE) compete1 ; compete2 ; pdg16 . We shall consider four particular cases, distinguished by the corresponding Pomeron contributions (), defined and denoted as follows.
-
•
Model I: (DL-type)
-
•
Model II: , (COMPETE-type)
-
•
Model III: , (BH-type)
-
•
Model IV: (hybrid power-log)
We note that models II and III are analytically similar. The difference concerns the phenomenological interpretation of the singularities as single and double poles. Also, in the BH analyses the energy scale is fixed (as we consider here) and in the COMPETE case it is treated as a free fit parameter.
As far as we know, model IV was never considered in the literature. Its use here is related to tests on the power law (single pole) in the attempt to describe simultaneously the and the data at 13 TeV. We shall return to this point in Sect. IV.B.
III Fits and Results
III.1 Ensembles and Data Reductions
The data above 5 GeV and below 7 TeV have been collected from the PDG database pdg16 , without any kind of data selection or sieve procedure (we have used all the published data by the experimental collaborations). The data at 7 and 8 TeV by the TOTEM and ATLAS Collaborations can be found in fms17b , Table 1, together with further information and complete list of references. The TOTEM data at 13 TeV are those in (3) totem1 ; totem2 .
As commented in our introduction, given the tension between the TOTEM and ATLAS measurements on at 7 TeV and mainly 8 TeV, we shall consider two ensembles of and data above 5 GeV, both comprising the same dataset in the region below 7 TeV. We then construct:
-
•
Ensemble TOTEM (T) by adding only the TOTEM data at 7, 8 and 13 TeV;
-
•
Ensemble TOTEM + ATLAS (T + A) by adding to ensemble T the ATLAS data at 7 and 8 TeV.
The fits were performed with the objects of the TMinuit package and using the default MINUIT error analysis minuit . We have carried out global fits using a fitting procedure, where the value of is distributed as a distribution with degrees of freedom. The global fits to and data were performed adopting an interval corresponding, in the case of normal errors, to the projection of the hypersurface containing first 68 % of probability, and in a second step, 95 % of probability, namely 1 and 2 .
As a convergence criteria we consider only minimization results which imply positive-definite covariance matrices, since theoretically the covariance matrix for a physically motivated function must be positive-definite at the minimum. As tests of goodness-of-fit we shall adopt the chi-square per degree of freedom and the integrated probability bev .
III.2 Fit Results
The data reductions with the general model given by Eqs. (4) and (5) did not comply with the above convergence requirements and thus can not be regarded as a possible solution. This may be due to an excessive number of free parameters. On the other hand, in the particular cases given by Models I, II, III and IV, the convergence criteria were reached.
In each case, the values of the free fit parameters with uncertainty of 1 , together with the corresponding statistical information, are displayed in Table I in case of ensemble T and Table II within ensemble T+A.
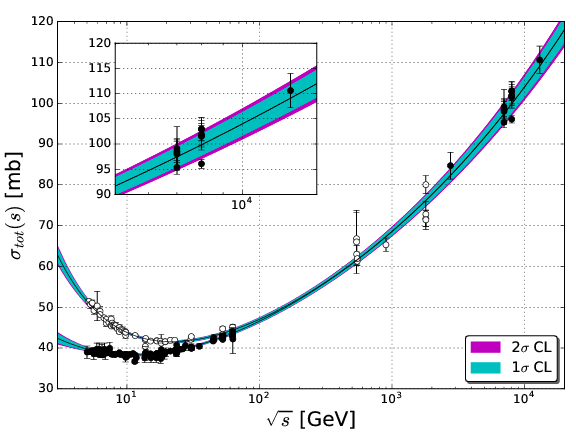
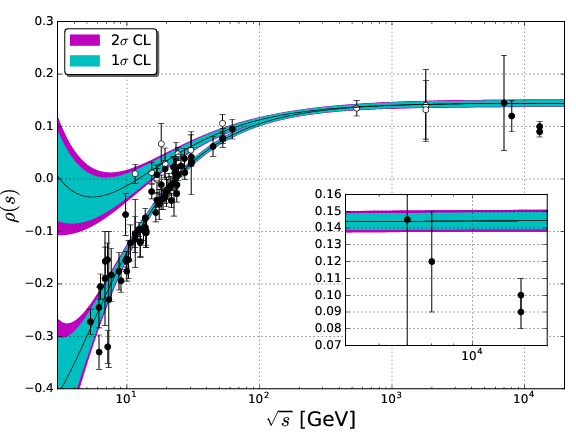
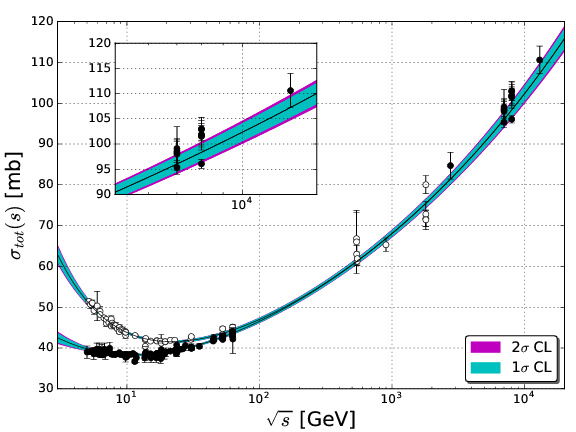
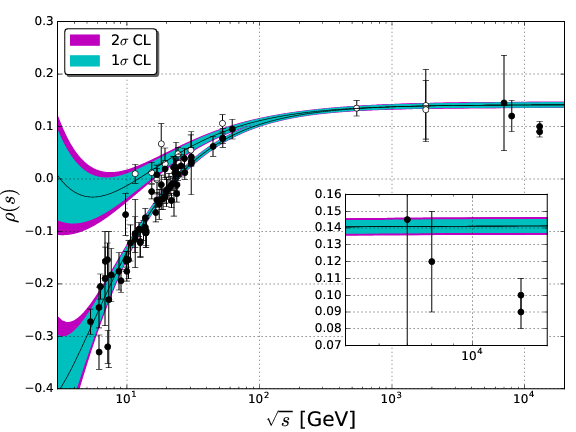
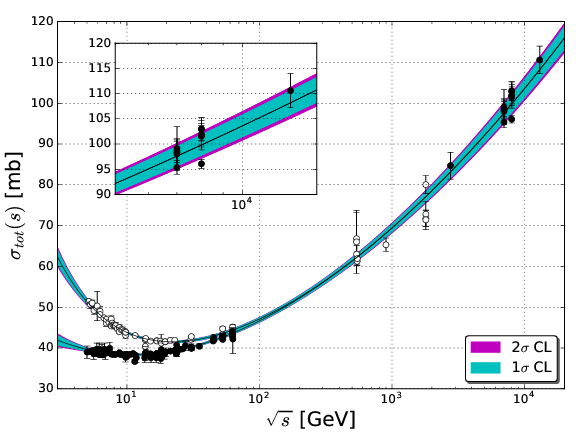
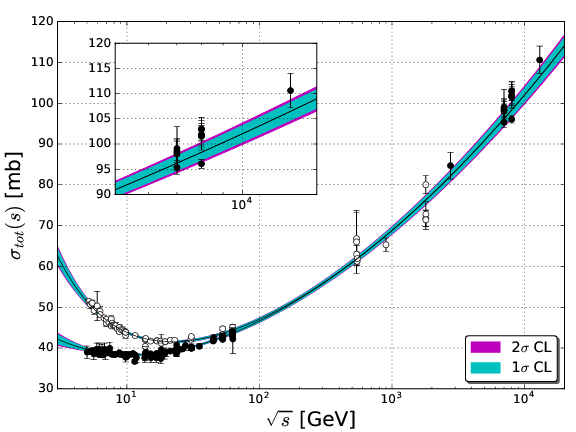
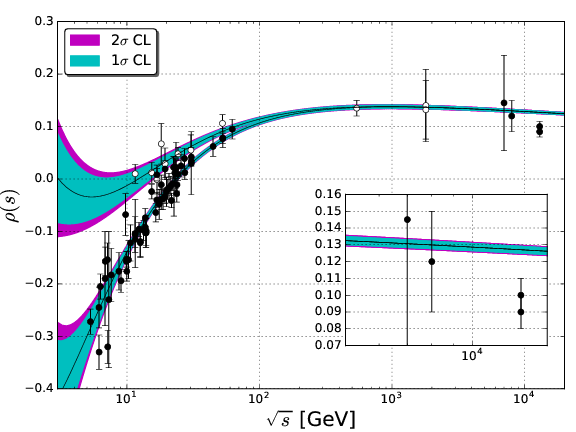
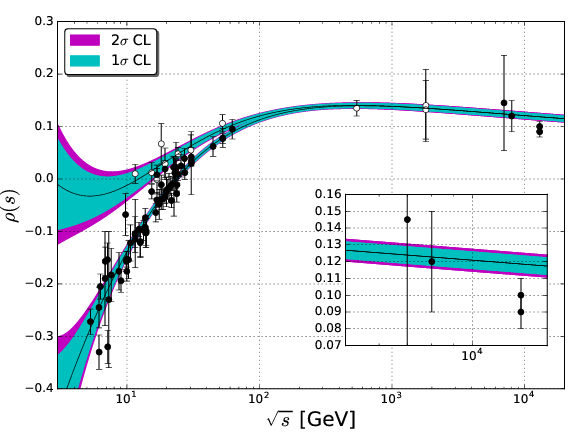
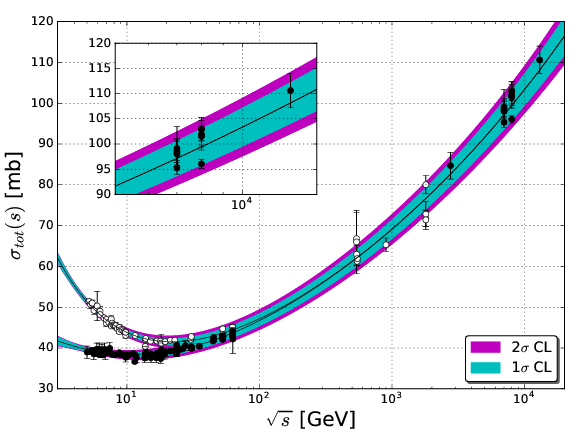
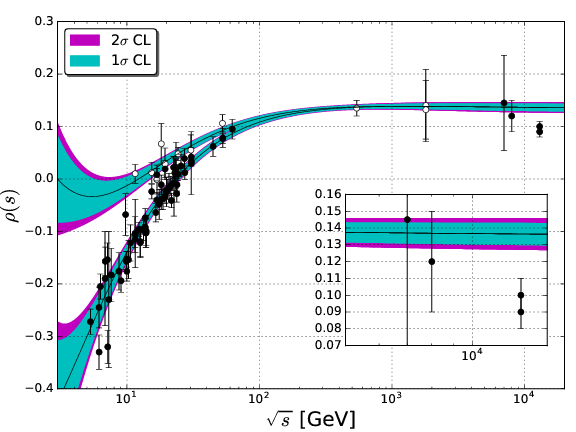
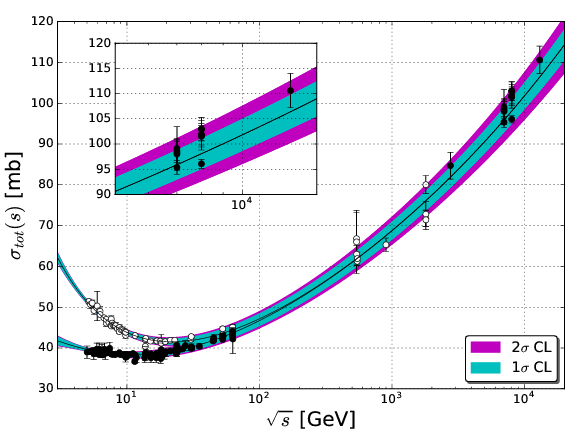
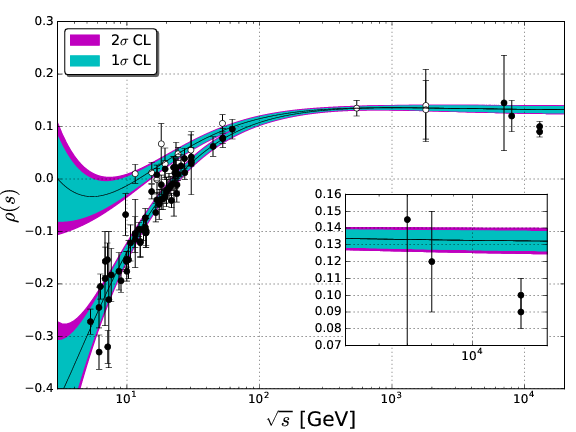
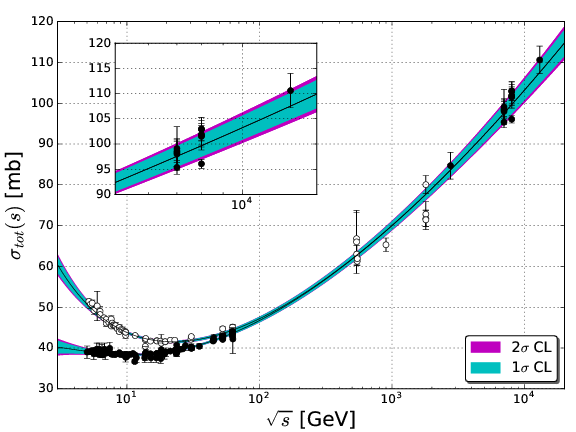
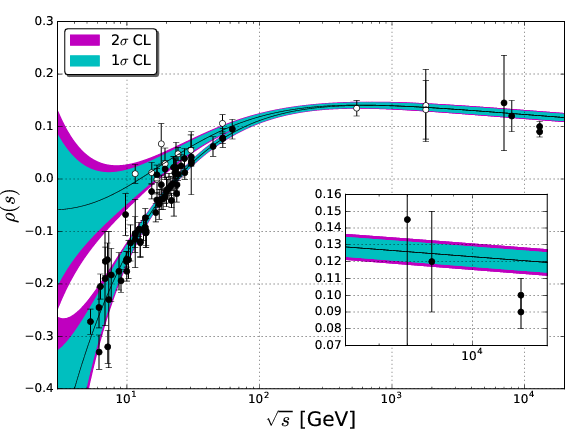
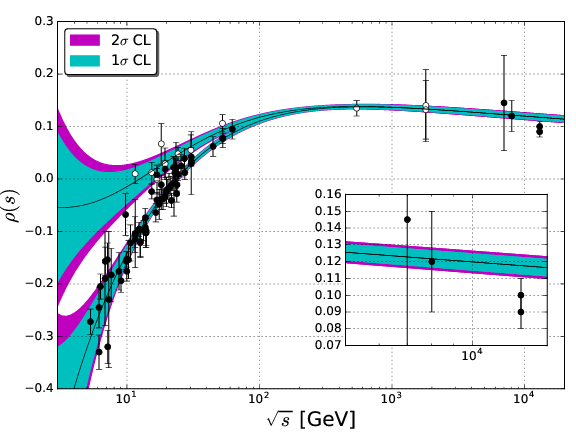
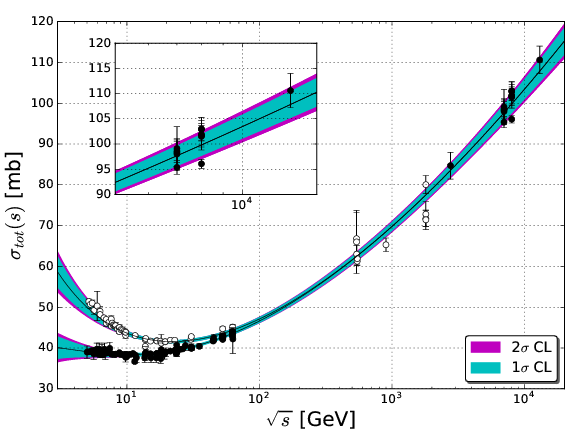
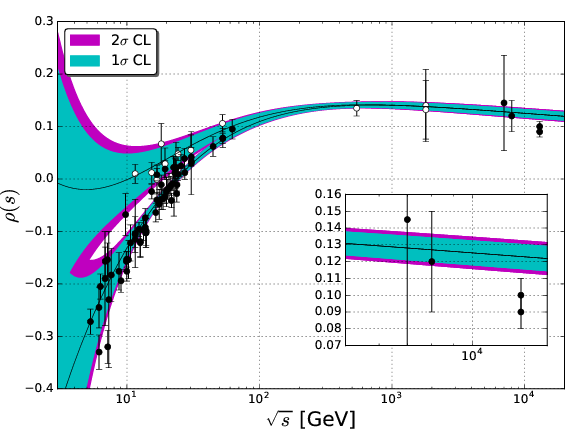
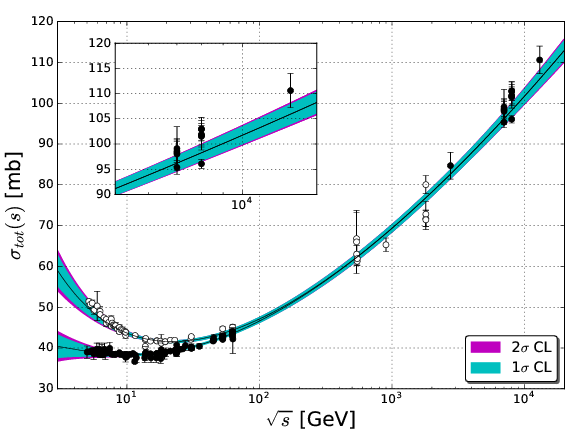
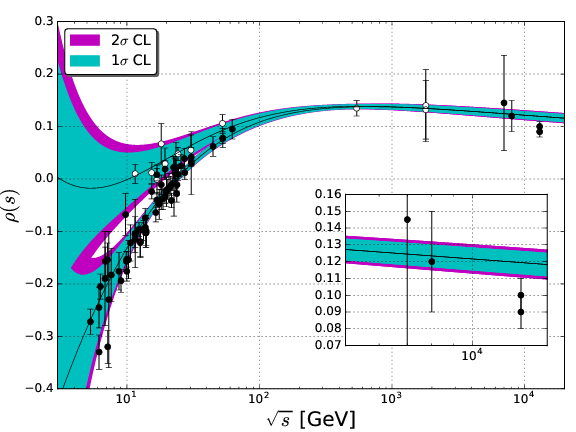
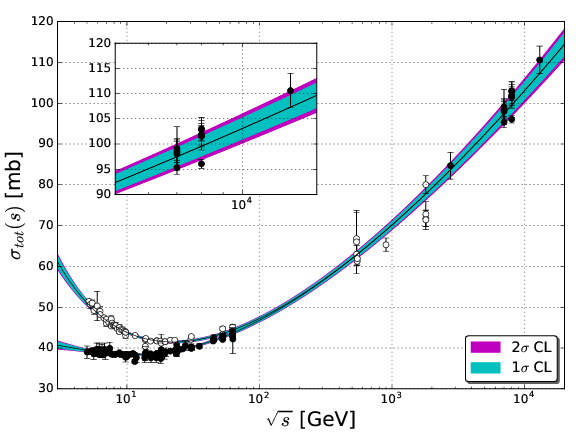
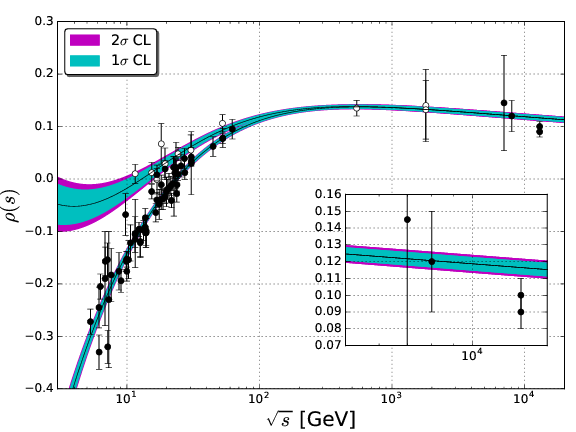
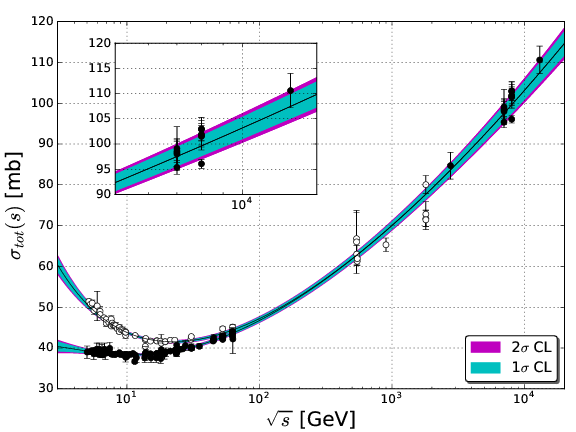
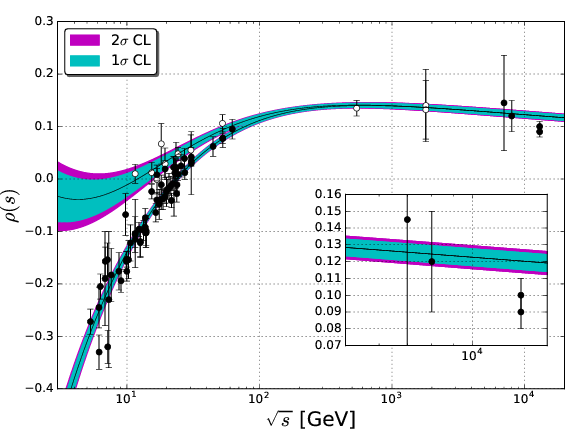
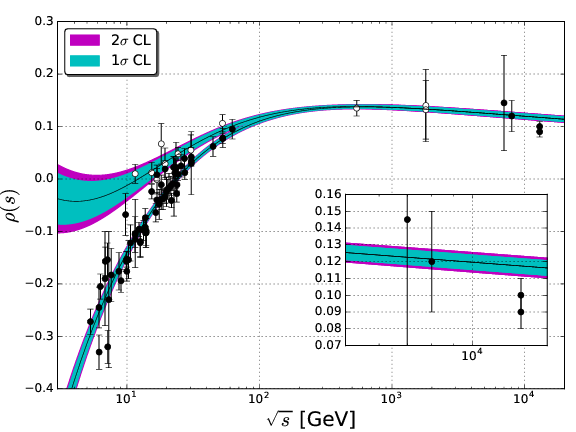
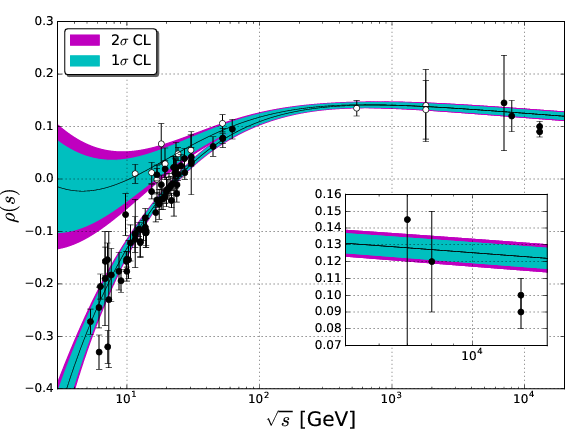
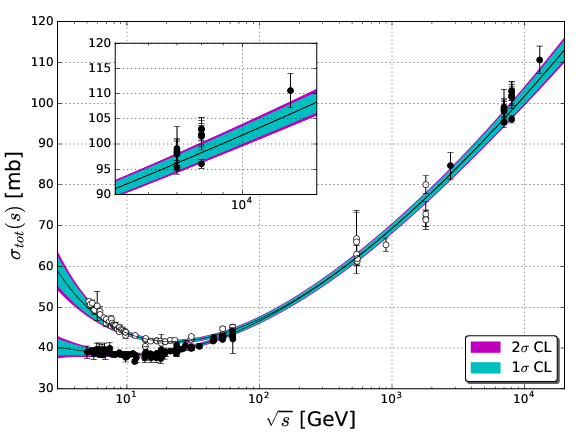
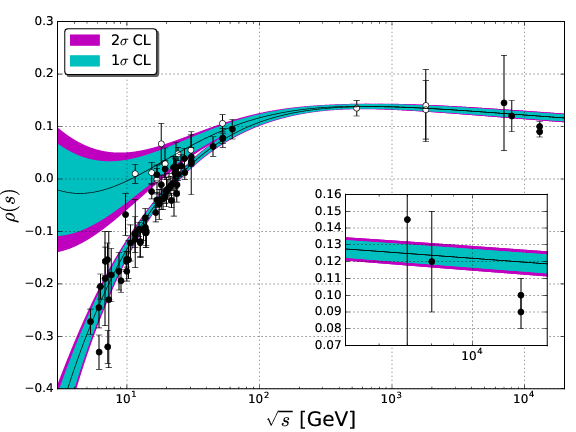
Through error propagation from the fit parameters, we determine the uncertainty regions for the theoretical results (curves), within 1 and 2 . The results for and with models I, II, III and IV (ensembles T and T+A) are compared with the experimental data in Figures 1, 2, 3 and 4, respectively. In each Figure, the insets highlight the LHC energy region.
| Model: | I | II | III | IV |
|---|---|---|---|---|
| (mb) | 41.4 1.8 | 32.2 1.8 | 58.8 1.5 | 51.5 7.1 |
| 0.378 0.028 | 0.392 0.049 | 0.229 0.017 | 0.296 0.037 | |
| (mb) | 17.0 2.0 | 17.0 2.1 | 16.9 2.0 | 17.0 2.1 |
| 0.545 0.037 | 0.545 0.037 | 0.543 0.036 | 0.544 0.037 | |
| (mb) | - | 29.6 1.2 | - | - |
| (mb) | 21.62 0.73 | - | - | 9.6 7.5 |
| 0.0914 0.0030 | - | - | 0.108 0.019 | |
| (mb) | - | - | 3.67 0.34 | 2.4 1.6 |
| (mb) | - | 0.251 0.010 | 0.132 0.024 | - |
| (mbGeV2) | 69 47 | 55 50 | 20 44 | 45 47 |
| 248 | 248 | 248 | 247 | |
| 1.273 | 1.193 | 1.210 | 1.249 | |
| 2.3 10-3 | 2.0 10-2 | 1.4 10-2 | 4.8 10-3 | |
| Figure: | 1 | 2 | 3 | 4 |
| Model: | I | II | III | IV |
|---|---|---|---|---|
| (mb) | 41.4 1.8 | 32.3 2.0 | 59.1 1.5 | 53.1 9.6 |
| 0.386 0.028 | 0.412 0.045 | 0.234 0.016 | 0.291 0.044 | |
| (mb) | 17.0 2.1 | 17.0 2.0 | 16.9 2.0 | 17.0 2.1 |
| 0.545 0.037 | 0.545 0.036 | 0.543 0.036 | 0.544 0.038 | |
| (mb) | - | 30.20 0.90 | - | - |
| (mb) | 22.01 0.64 | - | - | 8.0 10 |
| 0.0895 0.0024 | - | - | 0.110 0.033 | |
| (mb) | - | - | 3.81 0.30 | 2.8 2.1 |
| (mb) | - | 0.2438 0.0077 | 0.119 0.020 | - |
| (mbGeV2) | 73 48 | 64 50 | 23 43 | 46 48 |
| 250 | 250 | 250 | 249 | |
| 1.307 | 1.227 | 1.234 | 1.273 | |
| 7.9 10-4 | 8.2 10-3 | 6.9 10-3 | 2.3 10-3 | |
| Figure: | 1 | 2 | 3 | 4 |


IV Discussion
On the basis of the fit results in Tables I and II and Figures 1-4, let us first separate our discussion in two topics related to ensembles (Sub-sec. A) and models (Sub-sec. B). After that we shall discuss a selected model in more detail (Sub-sec. C).
IV.1 Ensembles T and T+A
Ensemble T+A encompasses all the experimental data presently available on forward and scattering at high energies. However, as commented in our introduction and discussed in fms17a and blm18b , the TOTEM and ATLAS data at 7 and 8 TeV present discrepant values. In special, at 8 TeV, the ATLAS measurement of differs from the latest TOTEM result at this energy by 3 standard deviation,
On the one hand, TOTEM published 4 measurements at 7 TeV and 5 at 8 TeV (all consistent among them) and ATLAS only one point at each energy. On the other hand, the ATLAS uncertainties in these results are much smaller then the TOTEM uncertainties. For example, at 8 TeV, if the ATLAS uncertainty is considered, the aforementioned ratio results 7.5 standard deviation. Besides the TOTEM results for being larger than the ATLAS values at 7 and 8 TeV, the TOTEM data indicate a rise of the total cross section faster than the ATLAS data fms17a .
Obviously, these facts make any amplitude analyses more difficult and put serious limitations in secure interpretations of the results and unquestionable conclusions that may be reached. It is expected that these discrepancies might be resolved through further re-analyses and/or new data, but it can also happen that these systematic differences may persist. We recall the discrepancies characterizing the experimental information at the highest energy reached in scattering, namely 1.8 TeV. The CDF and E710 results differ by 2.3 standard deviation (respect the E710 uncertainty) and predictions from most phenomenological models lies between these points.
Anyway, presently we understand that ensemble T+A is the effective representative of the experimental information available, so that an efficient model should be able to access all points within the corresponding uncertainties. More precisely, the predicted uncertainty region must present agreement with the error bars of the experimental points, by reaching all of them, even if in a barely way, but never excluding one or another data, namely TOTEM or ATLAS results.
On the basis of these comments and before discussing the efficiency of each model in the fit results, three characteristics of ensembles T and T+A in our data reductions deserve to be highlighted.
-
•
From the Figures, for all models the main visual difference in the results within ensembles T and T+A concerns at the highest energies but not at these energies. Indeed, for example, with model I (Fig. 1) the uncertainty region in the fit result for at 13 TeV within ensemble T goes through the lower error bar, the central value and half of the upper error bar, but within ensemble T+A, goes through only the lower error bar; on the other hand, for at 13 TeV the uncertainty regions within T and T+A are essentially the same, lying far above the experimental data and error bars. Analogous behaviors can be seen in Figs. 2, 3 and 4. This is a consequence of the large number of experimental data on at the highest energies (mainly LHC region) as compared with those respect to .
-
•
From Tables I and II, in all cases (independently of the ensemble or model), for 250, the lies in the region 1.2 - 1.3 and the integrated probability . Taking into account the discrepant values between TOTEM and ATLAS data, the fits can be considered as reasonably accurate.
-
•
For models I, II and III the integrated probability is one order of magnitude smaller within ensemble T+A than within T and for model IV nearly 1/2. This is a consequence of the aforementioned tension between the TOTEM and ATLAS data at 7 and mainly 8 TeV.
IV.2 Models
First, notice that from the Figures and within the uncertainties, all models present quite good descriptions of the experimental data up to 7 TeV, as expected. Therefore, let us focus the discussion in the region 8 - 13 TeV (mainly 13 TeV) and in the goodness of the fits.
-
1.
Model I (DL-type)
The fit result in Fig. 1 is in plenty agreement with the datum at 13 TeV within ensemble T and the uncertainty region crosses the lower error bar in case of ensemble T+A. However, for the curves do not decrease in the region GeV (see insets) and even with 2 the results at 13 TeV lie far above the upper error bars. Within both ensembles the integrated probability is the smallest among the models (). We conclude that this model is not in agreement with the TOTEM data at 13 TeV.
-
2.
Model II (COMPETE-type)
From Fig. 2 and ensemble T, the fit result (uncertainty region) for at 13 TeV crosses the central value and the lower error bar and reaches half this bar within ensemble T+A. For , the curves decrease in the region GeV, but as in the previous case, the uncertainty regions lie far above the upper error bars (insets). We conclude this model does not present a satisfactory description of the new data at 13 TeV.
-
3.
Model III (BH-type)
From the Tables, the integrated probability is one of the highest among the models. From Fig. 3, for and ensemble T+A, the uncertainty region with 1 reaches the upper error bar of the ATLAS datum at 8 TeV and the lower bar of the TOTEM datum at 13 TeV (similar with 2 in case of ensemble T). For the curves present the faster decrease among the models in the region GeV (insets) and at 13 TeV, with 2 , the uncertainty region reaches the upper extremum of the error bar with ensemble T+A (barely reach this point with ensemble T). We understand that this model is not excluded by the bulk of experimental data presently available.
-
4.
Model IV (Hybrid power-log)
Based on the disagreement of Model I with the TOTEM data at 13 TeV and given the efficiency of the power law (simple pole Pomeron) below 13 TeV, we have tested hybrid contributions by adding either a double pole or triple pole contributions. In the latter case the fits did not converge and in the former case the fit results are presented in Tables I and II and Figure 4. In this case we have one more parameter (as compared with 7 parameters in the other 3 models), resulting in lager uncertainty regions. For the uncertainty regions with 1 encompass all the experimental data at the LHC energy region. However, from the Tables the integrated probabilities are the smallest among the models and although the results for (Figure 4) present a small decrease in the region GeV, the uncertainty regions lie far above the TOTEM data. We conclude that the model does not present agreement with the TOTEM data at 13 TeV.
IV.3 Conclusions on the Pomeron Models and Further Tests
Based on the above discussion, we understand that models I, II and IV are not able to describe simultaneously the TOTEM data on and at 13 TeV. On the other hand, taking into account the bulk of experimental data presently available (ensemble T+A) and the uncertainties in both theoretical and experimental results, model III seems not to be excluded.
Looking for possible improvements in the efficiency of Model III, we have also developed further tests with some variants. Here, in all fits we have considered the energy cutoff at = 5 GeV and the subtraction constant as a free fit parameter. In order to investigate the effect of the energy cutoff and the role of the subtraction constant we have also carried out fits without this parameter, namely by fixing and rising the energy cutoff to 7.5 and 10 GeV. The results are presented in the Appendix, together with a short discussion. Taking into account the energy region analyzed, 5 GeV - 13 TeV and the and scattering, we did not find remarkable or considerable improvements. Indeed, with the cutoff at 5 GeV, the results with and without the subtraction constant are similar, with integrated probability slightly greater in case of free and the uncertainty region reaching the extreme of the upper error bar of at 13 TeV (ensemble T+A).
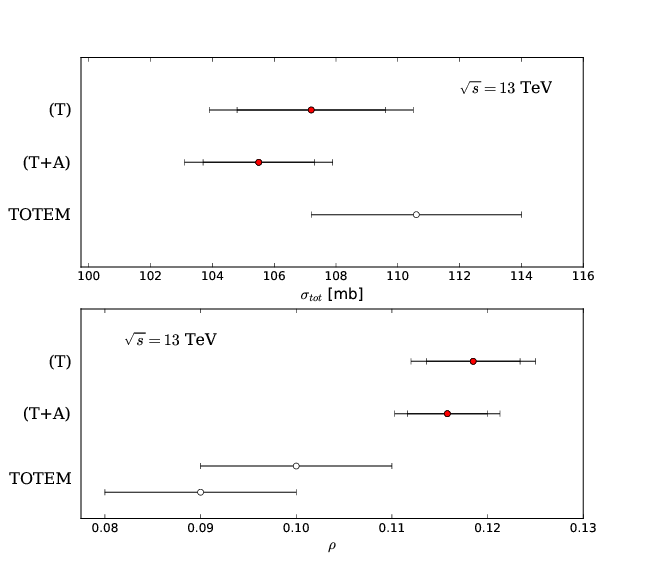
Therefore, we select as our best result those obtained here with model III, cutoff at 5 GeV and the subtraction constant as a free fit parameter (Fig. 3 and Tables I and II). For this case we present in Figure 5 a detail of the predictions for and at 13 TeV and the experimental data; the numerical values are given in Table III, together with the corresponding predictions at 14 TeV and uncertainties associated with 1 and also 2 .
| (mb) | ||||||||
|---|---|---|---|---|---|---|---|---|
| (TeV) | Ensemble | Central | Central | |||||
| 13 | T | 107.2 | 2.4 | 3.3 | 0.1185 | 0.0049 | 0.0065 | |
| T+A | 105.5 | 1.8 | 2.4 | 0.1158 | 0.0042 | 0.0055 | ||
| 14 | T | 108.4 | 2.5 | 3.3 | 0.1179 | 0.0049 | 0.0065 | |
| T+A | 106.7 | 1.8 | 2.5 | 0.1152 | 0.0042 | 0.0055 | ||
V Conclusions and Final Remarks
We have presented a forward amplitude analysis on the experimental data presently available from and scattering in the energy region 5 GeV - 13 TeV. The analysis consists of tests with different analytic parameterizations for and , all of them characterized by Pomeron leading contributions (even-under-crossing). The data reductions show that most models present no simultaneous agreement with the recent and measurements at 13 TeV by the TOTEM Collaboration. Different models and variants have been tested and among them, Model III (two simple poles Reggeons, one double pole and one triple pole Pomerons), with only seven free fit parameters, led to the best results.
Two aspects have been stressed along the paper. The first concerns the TOTEM results at 13 TeV, indicating an expected rise of the total cross section but an unexpected decrease in the value of the parameter. The extrapolation from the recent analysis with data up to 8 TeV, discussed in our introduction, shows clearly the plenty agreement with the result and the overestimation of the data fms17a . Note also that the value here obtained for the Pomeron intercept with Model I and Ensemble T, = 0.0914 0.0039 (Table I) is consistent with results of fits up to 8 TeV, for example those obtained in ms13b : = 0.0926 0.0016. However, the Model I result for at 13 TeV is in complete disagreement with the TOTEM data (Figure 1).
The second aspect concerns the tension between the TOTEM and ATLAS data at 7 TeV and mainly at 8 TeV, discussed in certain detail in the previous sections. That led us to consider separately the two ensembles denoted T (excluding the ATLAS data) and T+A (including the ATLAS data). We have shown that these discrepancies play an important role in the interpretations of the fit results.
Another aspect deserves attention when interpreting the data reductions. As discussed in Appendix A of fms17b , the TOTEM uncertainties are essentially systematic (uniform distribution) and not statistical (Gaussian distribution). Therefore, a model result crossing the central value of an experimental result may have a limited significance on statistical grounds.
The unexpected decrease in the value has been well described in the recent analyses by Martynov and Nicolescu. The first paper treated only the TOTEM data martynico1 and in the second one the ATLAS data have been included martynico2 . The are similar in both cases, namely 1.075 without ATLAS and 1.100 including ATLAS, corresponding to an increase of 2.3 %. For at 13 TeV, in both cases the curves seems to cross the central value of the experimental points (one symbol in Figures 2 and 3 of martynico2 ). However, for with ATLAS excluded the curve crosses the lower error bar at 13 TeV, but lies above the error bars of the ATLAS data at 7 TeV and mainly 8 TeV. With ATLAS included, the curve crosses the ATLAS data, but lies below the lower error bar of the TOTEM data at 8 TeV and mainly 13 TeV (Figure 3 of martynico2 ) . Summarizing, the curve does not reach the upper error bars of the ATLAS data on at 7 and 8 TeV in the former case and does not reach the lower error bar of the TOTEM datum at 13 TeV in the latter case.
In what concerns our results with Model III, the are also similar in both cases: 1.210 (T) and 1.234 (T+A), corresponding to an increase slightly small, 2.0 %. The uncertainty regions of the fit results do not cross the central values of the data at 13 TeV, but barely reach the upper error bar. However, the same is true for the ATLAS datum on at 8 TeV. Therefore, we conclude that the agreement between the phenomenological model and the experimental points is reasonably compatible within the uncertainties. In other words, in case of fits to ensembles T or T + A (all the experimental data presently available) and within the uncertainties, the Pomeron model III, with 7 free fit parameters, seems not to be excluded by the experimental data presently available on forward and elastic scattering.
In the theoretical context, the Odderon is a well-founded concept in perturbative QCD braun . Despite the consistent phenomenological description of the unexpected decrease of the parameter at 13 TeV, the Odderon model predicts a crossing in the and total cross sections at high energies. Although in agreement with high-energy theorems cross , it seems still lacking a pure (model independent) nonperturbative QCD explanation (from first principles) for an asymptotic rise of the total cross section faster for hadron-hadron than for antihadron-hadron collisions.
Finally, we understand that further re-analysis and new experimental data at 13 TeV and 14 TeV, by the TOTEM and ATLAS collaborations, shall be crucial for confronting, in a conclusive way, the possible dominance of Odderon or Pomeron in forward elastic hadron scattering at high energies.
Acknowledgements.
This research was partially supported by the Conselho Nacional de Desenvolvimento Científico e Tecnológico (CNPq). EGSL acknowledges the financial support from the Rede Nacional de Altas Energias (RENAFAE). *Appendix A Further Tests with Model III
In Sect. III the fits through model III to ensembles T and T+A were carried out with energy cutoff at 5 GeV and the subtraction constant as a free fit parameter (Tables I and II and Figure 3). In what follows, we consider two variants related to the energy cutoff and the subtraction constant. Firstly, still with the subtraction constant as a free fit parameter, we develop fits with energy cutoff at 7.5 and 10 GeV. The results are displayed in Table IV and Figures 6 and 7. In a second step the subtraction constant is fixed at zero and the fits are developed with energy cutoff at 5, 7.5 and 10 GeV. The results are shown in Table V and Figures 8, 9 and 10. As before, in all the cases we employ ensembles T and T+A and CL with one and two standard deviations.
| Ensemble | T | T+A | |||
|---|---|---|---|---|---|
| (GeV) | 7.5 | 10 | 7.5 | 10 | |
| (mb) | 57.5 2.1 | 55.8 4.0 | 57.9 2.1 | 56.5 4.1 | |
| 0.217 0.023 | 0.202 0.037 | 0.224 0.021 | 0.212 0.037 | ||
| (mb) | 16.8 2.7 | 15.1 4.6 | 16.8 2.7 | 15.1 4.8 | |
| 0.542 0.046 | 0.520 0.070 | 0.542 0.046 | 0.520 0.072 | ||
| (mb) | 3.48 0.44 | 3.25 0.66 | 3.66 0.38 | 3.48 0.59 | |
| (mb) | 0.143 0.030 | 0.156 0.040 | 0.128 0.024 | 0.138 0.035 | |
| (mbGeV2) | -15 74 | 4.17 116 | -9.5 73 | 14.3 117 | |
| 205 | 164 | 207 | 166 | ||
| 1.217 | 1.213 | 1.253 | 1.263 | ||
| 1.8 10-2 | 3.3 10-2 | 7.8 10-3 | 1.2 10-2 | ||
| Figure | 6 | 7 | 6 | 7 | |
| Ensemble | T | T+A | |||||
|---|---|---|---|---|---|---|---|
| (GeV) | 5 | 7.5 | 10 | 5 | 7.5 | 10 | |
| (mb) | 58.6 1.3 | 57.7 1.8 | 55.8 3.1 | 58.8 1.3 | 58.0 1.8 | 56.2 3.1 | |
| 0.226 0.015 | 0.219 0.019 | 0.202 0.029 | 0.231 0.014 | 0.225 0.018 | 0.209 0.028 | ||
| (mb) | 17.0 1.8 | 16.6 2.3 | 15.2 4.2 | 17.1 1.8 | 16.6 2.3 | 15.3 4.3 | |
| 0.547 0.032 | 0.538 0.038 | 0.521 0.064 | 0.548 0.032 | 0.539 0.038 | 0.522 0.063 | ||
| (mb) | 3.62 0.30 | 3.51 0.38 | 3.24 0.53 | 3.76 0.26 | 3.67 0.33 | 3.44 0.47 | |
| (mb) | 0.135 0.022 | 0.141 0.026 | 0.157 0.033 | 0.122 0.018 | 0.127 0.021 | 0.140 0.029 | |
| 249 | 206 | 165 | 251 | 208 | 167 | ||
| 1.210 | 1.213 | 1.206 | 1.238 | 1.248 | 1.256 | ||
| 1.3 10-2 | 2.0 10-2 | 3.7 10-2 | 6.1 10-3 | 8.8 10-3 | 1.4 10-2 | ||
| Figure | 8 | 9 | 10 | 8 | 9 | 10 | |
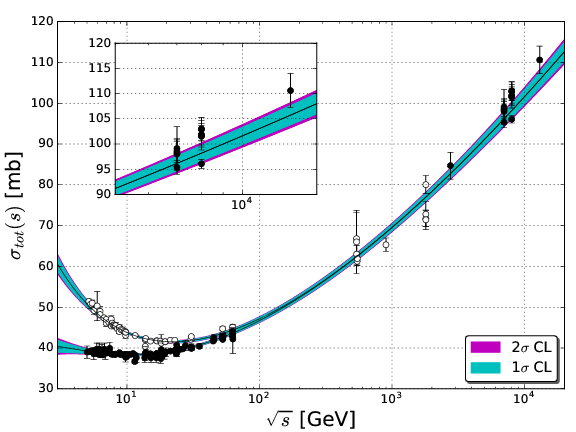


For K as a free fit parameter, comparison of Table I (cutoff at 5 GeV) with Table IV (cutoffs at 7.5 and 10 GeV), shows that for both ensembles, rising the cutoff results in a slightly increase in and from Figures 3, 6 and 7, the uncertainty regions become larger, mainly at lower energies. The same effect is observed by fixing (Table V and Figures 8, 9 and 10). The rise of the cutoff does not led to an improvement in the fit results, within the uncertainty region, at 13 TeV.
For cutoff at 5 GeV, the results with free (Table I, Figure 3) and fixed (Table V, Figure 8) show the following features:
-
•
within both ensembles, the integrated probability is slightly larger for free;
-
•
for at 13 TeV and ensemble T, the distance between the minimum of the uncertainty region and the extreme of the upper error bar is smaller with free than with ;
-
•
for at 13 TeV, ensemble T+A and , the uncertainty region lies slightly above the extreme of the upper error bar (Figure 8) and for free the uncertainty region reaches this point (Figure 3).
In conclusion, the rising of the cutoff does not lead to improvements in the fit results, neither fixing . The results with free and cutoff at 5 GeV present best agreement with the TOTEM data at 13 TeV.
References
- (1) V. Barone and E. Predazzi, High-Energy Particle Diffraction (Spring-Verlag, Berlin, 2002).
- (2) G. Pancheri and Y.N. Srivastava, Eur. Phys. J. C 77, 150 (2017).
- (3) M.M. Block, Phys. Rep. 436, 71 (2006).
- (4) I.M. Dremin, Phys. Usp. 56, 3 (2013); J. Kašpar, V. Kundrát, M. Lokajíček, and J. Procházka, Nucl. Phys. B 843, 84 (2011); R. Fiore, L. Jenkovszky, R. Orava, E. Predazzi, A. Prokudin, and O. Selyugin, Int. J. Mod. Phys. A 24, 2551 (2009).
- (5) S. Donnachie, G. Dosch, P.V. Landshoff, and O. Natchmann, Pomeron Physics and QCD (Cambridge University Press, Cambridge, 2002).
- (6) J.R. Forshaw and D.A. Ross, Quantum Chromodynamics and the Pomeron (Cambridge University Press, Cambridge, 1997); P.D.B. Collins, An Introduction to Regge Theory & High Energy Physics (Cambridge University Press, Cambridge, 1977).
- (7) D.A. Fagundes, M.J. Menon, and P.V.R.G. Silva, Int. J. Mod. Phys. A 32, 1750184 (2017).
- (8) A. Donnachie and P.V. Landshoff, Phys. Lett. B 727, 500 (2013); A. Donnachie and P.V. Landshoff, Z. Phys. C 2, 55 (1979); Erratum: Z.Phys. C 2, 372 (1979).
- (9) P.C. Beggio and E.G.S. Luna, Nucl. Phys. A 929 230 (2014); D.A. Fagundes, E.G.S. Luna, M.J. Menon, and A.A. Natale, Nucl. Phys. A 886, 48 (2012); E.G.S. Luna, Phys. Lett. B 641 171 (2006); E.G.S. Luna, A.F. Martini, M.J. Menon, A. Mihara, and A.A. Natale, Phys. Rev. D 72, 034019 (2005); M.M. Block, E.M. Gregores, F. Halzen, and G. Pancheri, Phys. Rev. D 60, 054024 (1999).
- (10) J.R. Cudell et al (COMPETE Collaboration), Phys. Rev. D 65, 074024 (2002).
- (11) J.R. Cudell et al. (COMPETE Collaboration), Forward observables at RHIC, the Tevatron run II and the LHC, arXiv:hep-ph/0212101; B. Nicolescu et al. (COMPETE Collaboration), Analytic Amplitudes for Hadronic Forward Scattering: COMPETE Update, arXiv:hep-ph/0209206; J.R. Cudell et al. (COMPETE Collaboration), Phys. Rev. Lett. 89, N. 20, 201801 (2002).
- (12) C. Patrignani et al. (Particle Data Group), Review of Particle Physics, Chin. Phys. C 40, 100001 (2016).
- (13) G. Antchev et al. (TOTEM Collaboration), First measurement of elastic, inelastic and total cross-section at TeV by TOTEM and overview of cross-section data at LHC energies, preprint CERN-EP-2017-321; arxiv:1712.06153.
- (14) G. Antchev et al. (TOTEM Collaboration), First determination of the parameter at = 13 TeV - probing the existence of a colourless three-gluon bound state, preprint CERN-EP-2017-335.
- (15) D.A. Fagundes, M.J. Menon, and P.V.R.G. Silva, Nucl. Phys. A 966, 185 (2017).
- (16) L. Lukaszuk and B. Nicolescu, Lett. Nuovo Cim. 8, 405 (1973).
- (17) D. Joynson, E. Leader, B. Nicolescu, and C. Lopez, Nuovo Cim. A 30, 345 (1975).
- (18) C. Ewerz, The Odderon: Theoretical status and experimental tests, IFUM-837-FT, arXiv:hep-ph/0511196; C. Ewerz, The Odderon in quantum chromodynamics, HD-THEP-02-35, arXiv:hep-ph/0306137; M.A. Braun, Odderon and QCD, DESY-98-055, arXiv:hep-ph/9805394.
- (19) R. Avila, P. Gauron, and B. Nicolescu, Eur. Phys. J. C 49, 581 (2007).
- (20) E. Martynov and B. Nicolescu, Phys. Lett. B 778, 414 (2018).
- (21) E. Martynov and B. Nicolescu, Evidence for maximality of strong interactions from LHC forward data, e-Print: arXiv:1804.10139 [hep-ph].
- (22) V.A. Khoze, A.D. Martin, and M.G. Ryskin, Int. J. Mod. Phys. A 30, 1542004 (2015); V.A. Khoze, A.D. Martin, and M.G. Ryskin, Eur. Phys. J. C 74, 2756 (2014).
- (23) V.A. Khoze, A.D. Martin, and M.G. Ryskin, Phys. Rev. D 97, 034019 (2018).
- (24) V.A. Khoze, A.D. Martin, and M.G. Ryskin, Phys. Lett. B 780, 352 (2018).
- (25) P. Lebiedowicz, O. Nachtmann, and A. Szczurek, Phys. Rev. D 98, 014001 (2018); E. Gotsman, E. Levin, and I. Potashnikova, CGC/saturation approach: secondary Reggeons and =Re/Im dependence on energy, arXiv:1807.06459 [hep-ph]; T. Csorgo, R. Pasechnik, and A. Ster, Odderon and substructures of protons from a model-independent Levy imaging of elastic proton-proton and proton-antiproton collisions, arXiv:1807.02897 [hep-ph]; V.A. Khoze, A.D. Martin, and M.G. Ryskin, Elastic and diffractive scattering at the LHC, arXiv:1806.05970 [hep-ph]; S.M. Troshin and N.E. Tyurin, Implications of the measurements by TOTEM at the LHC, arXiv:1805.05161 [hep-ph]; W. Broniowski, L. Jenkovszky, E. Ruiz Arriola, and I. Szanyi, Hollowness in and scattering in a Regge model, arXiv:1806.04756 [hep-ph].
- (26) M. Broilo, E.G.S. Luna, and M. J. Menon, Leading Pomeron Contributions and the TOTEM Data at 13 TeV, proceedings XIV Hadron Physics - 2018, arxiv:1803.06560 [hep-ph].
- (27) M. Broilo, E.G.S. Luna, and M.J. Menon, Phys. Lett. B 781, 616 (2018).
- (28) R.F. Ávila and M.J. Menon, Nucl. Phys. A 744, 249 (2004); J.B. Bronzan, G.L. Kane, and U.P. Sukhatme, Phys. Lett. 49, 272 (1974).
- (29) M.J. Menon, P.V.R.G. Silva, J. Phys. G: Nucl. Part. Phys. 40, 125001 (2013); J. Phys. G: Nucl. Part. Phys. 41, 019501 (2014) [corrigendum].
- (30) M.M. Block and F. Halzen, Phys. Rev. D 86, 014006 (2012); Phys. Rev. D 86, 051504 (2012).
- (31) F. James, MINUIT Function Minimization and Error Analysis, Reference Manual, Version 94.1, CERN Program Library Long Writeup D506 (CERN, Geneva, Switzerland, 1998).
- (32) P.R. Bevington and D.K. Robinson, Data Reduction and Error Analysis for the Physical Sciences (Boston, MA: McGraw-Hill, 1992).
- (33) G. Grunberg and T.N. Truong, Phys. Rev. Lett. 31, 63 (1973).