Optimizing the tight-binding parametrization of
the quasi-one-dimensional superconductor K2Cr3As3
Abstract
We study the tight-binding dispersion of the recently discovered superconductor K2Cr3As3, obtained from Wannier projection of Density Functional Theory (DFT) results. In order to establish quantitatively the actual degree of quasi-one-dimensionality of this compound, we analyze the electronic band structure for two reduced sets of hopping parameters: one restricted to the Cr-As tubes and another one retaining a minimal number of in-plane hoppings. The corresponding total and local density of states of the compound are also computed with the aim of assessing the tight-binding results with respect to the DFT ones. We find a quite good agreement with the DFT results for the more extended set of hopping parameters, especially for what concerns the orbitals that dominate at the Fermi level. Accordingly, we conclude that one cannot avoid taking into account in-plane hoppings up to the next-nearest-neighbors cells even only to describe correctly the Fermi surface cuts and the populations along the direction. Such a choice of a minimal number of hopping parameters directly reflects in the possibility of correctly describing correlations and magnetic interactions.
I Introduction
Systems such as heavy fermion compounds (Stewart, 1984; Amato, 1997; Movshovich et al., 2001), high transition-temperature cuprate superconductors (Van Harlingen, 1995; Timusk and Statt, 1999; Norman, Pines, and Kallin, 2005; Lee, Nagaosa, and Wen, 2006; Armitage, Fournier, and Greene, 2010; Rice, Yang, and Zhang, 2012; Avella, 2014; Keimer et al., 2015; Avella et al., 2016; Novelli et al., 2017; Avella, 2018), strontium ruthenate superconductors (Mackenzie and Maeno, 2003; Ovchinnikov, 2003; Cuoco, Forte, and Noce, 2006a, b; Forte, Cuoco, and Noce, 2010; Autieri, Cuoco, and Noce, 2012; Malvestuto et al., 2013; Autieri, Cuoco, and Noce, 2014; Granata et al., 2016) and iron-pnictide superconductors (Mazin et al., 2008; Stewart, 2011) have been investigated very thoroughly due to their unconventional properties determined by the existence of a superconductive phase that appears close to a magnetic one when the latter is suppressed by applying an external agent, such as for instance pressure. In recent years, this type of investigation has been extended to the search of superconductivity in Cr pnictides, although chromium is one of the few metallic elements that doesn’t superconduct even under high pressures (Bao et al., 2015). Accordingly, the discovery of superconductivity in chromium arsenide (CrAs) was only recent and rather unexpected. CrAs exhibits a superconducting transition of K for a critical pressure of Kbar, where its magnetically ordered phase is completely suppressed (Wu et al., 2010, 2014; Kotegawa et al., 2014). Then, another family of superconducting CrAs-based compounds has been discovered, that of A2Cr3As3, where A is K (Bao et al., 2015), Rb (Tang et al., 2015a) or Cs (Tang et al., 2015b).
It is worth noting that while CrAs is a 3D compound and superconducts only under a sizable pressure, A2Cr3As3 are considered quasi-1D superconductors at ambient pressure. In particular, K2Cr3As3 has a K, an hexagonal crystal structure at room temperature with =9.9832 Å and =4.2304 Å, and [(Cr3As3)2-] double-walled subnanotubes separated by columns of K+ ions (Bao et al., 2015). This material is very peculiar because it is considered quasi-one dimensional and, at the same time, it is a superconductor: superconductivity is not so frequent in quasi-one dimensional compounds due to the Peierls instability (Peierls, 1955; van Smaalen, 2005). As regards K2Cr3As3, a large specific heat coefficient of 70-75 mJ K-2 mol-1 indicates strong electron correlations, while a linear temperature dependence of the resistivity from 7 to 300 K supports the hypothesis of a Tomonaga-Luttinger liquid behavior (Bao et al., 2015), as foreseeable for fermions confined in 1D. On the other hand, Kong et al. report a T3 dependence of resistivity from 10 to 40 K (Kong, Bud’ko, and Canfield, 2015) and therefore the degree of unidimensionality of the system is still under current debate.
All experiments point to an unconventional type of superconductivity: an upper critical field that is 3-4 times the Pauli limit (Bao et al., 2015), the absence of the Hebel-Schlichter coherence peak in just below (Zhi et al., 2015) and a linear temperature dependence of the penetration depth for (Pang et al., 2015). Muon spin rotation measurements show results consistent with a -wave model with line nodes. The weak evidence of a spontaneous appearance of an internal magnetic field below the transition temperature is probably another proof that the superconducting state is not conventional (Adroja et al., 2015). The Debye temperature is found to be 220 K, the specific heat jump at the superconducting transition is 2.2 and the upper critical field is anisotropic with different amplitudes between fields parallel and perpendicular to the rodlike crystals (Kong, Bud’ko, and Canfield, 2015). NMR measurements on the compound show evidence for a strong enhancement of Cr spin fluctuations above in the subnanotubes based on the nuclear spin-lattice relaxation rate (Zhi et al., 2015).
From a theoretical point of view, first-principles calculations indicate that the ground state is paramagnetic and that the Cr- orbitals dominate close to the Fermi level, with three bands crossing to form one 3D Fermi surface sheet and two quasi 1D-sheets (Jiang, Cao, and Cao, 2015). Wu et al predict that both K2Cr3As3 and Rb2Cr3As3 exhibit strong frustrated magnetic fluctuations and are close to a novel in-out coplanar magnetic ground state (Xian-Xin et al., 2015). They also report that frustrated magnetism is very sensitive to the -axis lattice constant and can thus be suppressed by increasing pressure (Xian-Xin et al., 2015). Moreover, three- and six- band models have been built and they show in both weak and strong coupling limits that a triplet -wave pairing is the leading pairing symmetry for physically realistic parameters (Wu et al., 2015; Zhang et al., 2016). Zhou et al have obtained, for A2Cr3As3 (A=K, Rb or Cs), that at small the pairing comes from 3D band and has spatial symmetry , with line nodes in the gap function, while at large a fully gapped -wave state, dominates at the quasi-1D -band (Yi, Chao, and Fu-Chun, 2017).
In this paper, we study the electronic properties of K2Cr3As3 by implementing a tight-binding reduction procedure onto state-of-the-art DFT calculations in order to contribute to clarify the issue of the quasi-one-dimensionality of the compound. We obtain the band structure and the total and local density of states (DOS) considering two reduced sets of hopping parameters and compare them with the DFT results to establish the minimal number of in-plane hopping amplitudes necessary to get a reasonable agreement and an adequate description of the properties of the material. The hopping parameters have been extracted by means of the Wannier procedure applied to the DFT results. The paper is organized as follows: in the next section, we describe our tight-binding procedure and show the band structure obtained considering the two reduced sets of hopping parameters. In Sec. III, we focus on the total and the local DOS to check the reliability of the results from the previous section with respect to the DFT ones. In Sec. IV, we draw our conclusions and make some final remarks.
| set | primitive cells |
|---|---|
| A | , , , , |
| B | set A , , , , |
| , , , |
II Band structure
To study the electronic properties of the material, we start from the following tight-binding Hamiltonian
| (1) |
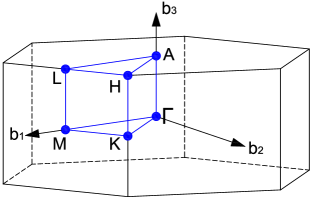
in which and indicate the positions of Cr or As atoms in the crystal, is the spin, and are the orbital indices. The two terms take into account the on-site energies and the hopping processes between Cr and As orbitals, respectively. The Hamiltonian corresponds to a matrix because we have to consider the orbitals of the Chromium and the orbitals of the Arsenic and the primitive cell contains six Cr and six As atoms. As we have already discussed in the introduction, the hopping parameters are obtained by the DFT overlap integrals of the orbitals. Diagonalizing the Hamiltonian, we obtain the corresponding band structure, whose behavior will be discussed referring to the high symmetry path in the hexagonal Brillouin zone chosen according to the notation of Ref. Setyawan and Curtarolo, 2010 (see Fig. 1). In what follows, we use the notation where is a lattice vector in the direct space.
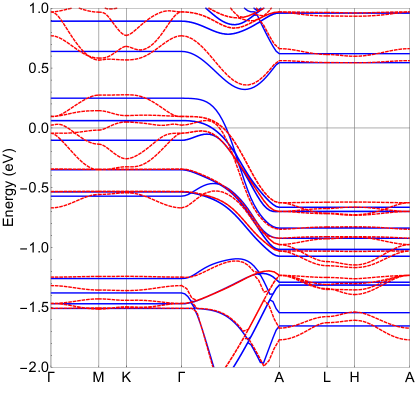
We analyze two cases that differ only for the chosen set of hopping parameters with the aim of assessing the degree of quasi-one dimensionality of the material. In the first case, we take into account only the hoppings between the orbitals of the atoms that lie within a single sub-nanotube extending along the axis. Accordingly, we limit ourselves to consider the hoppings between the primitive cells in set A of Tab. 1. In Fig. 2, we report the comparison between the band structure obtained in this case and the DFT spectrum. We can clearly see that this choice of hoppings not only misses completely the in-plane band structure, but it does not even allow to describe correctly the band structure along the axis. This unveils an overlooked relevance of in-plane virtual processes that affect the -axis physics.
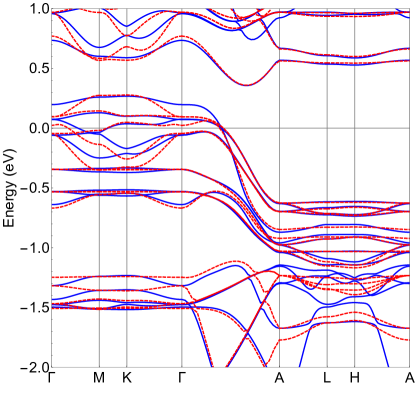
Accordingly, in the second case we have also taken into account the in-plane hoppings between primitive cells in set B of Tab. 1. In Fig. 3, we show how the agreement improves substantially not only for the in-plane paths, which was expected, but also for the -A line of the Brillouin zone, that is for the direction. This demonstrates that it is necessary to take into account not only the -axis hopping processes, but also several in-plane ones to get a qualitatively good description of the band structure.
In the next section, we will check whether this reduced set of hoppings (set B) is also sufficient to obtain a qualitatively correct description, that is in agreement with the DFT results, of the orbital populations close to the Fermi surface.
| 1 | 0.255 | 0.349 | 0.306 | |||
| 2 | 0.162 | 0.127 | 0.116 | |||
| 3 | 0.017 | 0.028 | 0.022 | |||
| 4 | 0.087 | 0.104 | 0.087 |
III Density of states
We obtain the total DOS from the usual definition:
| (2) |
in which is the energy dispersion of Hamiltonian (1) and the sum is carried out on the N values of momenta in the Brillouin zone; our numerical grid contains -points. The delta functions in Eq. (2) have been approximated by Gaussian functions with a variance of .
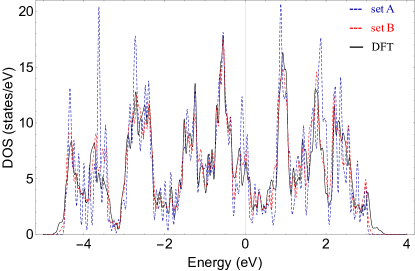
In Fig. 4, we report the total DOS obtained taking hopping parameters related to set A and B of Tab. 1, together with the DFT results: set B leads to a very good qualitative agreement with the latter, this showing that this set of hoppings manages to catch correctly also the overall populations close to the Fermi level, in contrast to set A, which exhibits evident limitations.
We can now check, by projecting the total DOS onto the Cr and As orbitals, if we obtain a correct description of the local orbital occupations close to the Fermi level. To this purpose, we have reported in Tab. 2 the values of the projected densities of states (PDOSs) at the Fermi level, and its contribution to the total DOS, related to (i) the Cr- symmetrical orbitals with respect to the basal plane (), (ii) the Cr- antisymmetrical orbitals () and (iii) the As- orbitals, for the previous three cases: set A, set B and DFT. We notice that the value for each class, labelled by , has been obtained by averaging over all orbitals and atoms in the unit cell belonging to the class. We clearly find that the symmetrical orbitals with respect to the basal plane dominate, in agreement to what reported in Ref. Jiang, Cao, and Cao, 2015, and that the values found for set B are evidently much closer to those coming from DFT (all discrepancies below ) with respect to those obtained for set A (discrepancies up to ). We conclude that set B is the minimal number of hoppings necessary to achieve a proper description of the band structure along the direction as well as of its orbital occupations.
It is worth noting that, as already reported in the literature (Jiang, Cao, and Cao, 2015), the orbital characterization of the spectrum reveals a high degree of covalency between the Cr- and the As- orbitals, as it happens for the CrAs (Autieri et al., 2017; Autieri and Noce, 2017; Autieri et al., 2018). This opens up a new quest for the minimal number of effective bands necessary to describe qualitatively, but also quantitatively, the system, at least close to the Fermi level. We are currently investigating this aspect too.
IV Conclusions
We have used a tight-binding model, obtained through the Wannier projection of DFT results, to study the electronic properties of K2Cr3As3 in order to explore its degree of unidimensionality. We have then analyzed the band structure and the total and the local DOS of the compound taking into account not only the usually considered hoppings along the -axis, but also those up to the next-nearest-neighbor primitive cells in the plane. Only adding these latter, we managed to achieve a good qualitative agreement with the DFT spectrum near the Fermi level, demonstrating that the system does not exhibit a genuine one-dimensional character. Consequently, this study gives clear hints on the minimal number of hopping parameters needed to perform further studies and understand the role of correlations, magnetic interactions and spin-orbit as well as the mechanism and the nature of the superconductivity in this material. A more detailed analysis of the electronic properties of the compound, aiming to derive a reliable minimal effective band model, is underway.
Acknowledgements.
This work was supported by CNR-SPIN via the Seed Project CAMEO.References
- Stewart (1984) G. R. Stewart, Rev. Mod. Phys. 56, 755 (1984).
- Amato (1997) A. Amato, Rev. Mod. Phys. 69, 1119 (1997).
- Movshovich et al. (2001) R. Movshovich, M. Jaime, J. D. Thompson, C. Petrovic, Z. Fisk, P. G. Pagliuso, and J. L. Sarrao, Phys. Rev. Lett. 86, 5152 (2001).
- Van Harlingen (1995) D. J. Van Harlingen, Rev. Mod. Phys. 67, 515 (1995).
- Timusk and Statt (1999) T. Timusk and B. Statt, Rep. Prog. Phys. 62, 61 (1999).
- Norman, Pines, and Kallin (2005) M. R. Norman, D. Pines, and C. Kallin, Advances in Physics 54, 715 (2005).
- Lee, Nagaosa, and Wen (2006) P. A. Lee, N. Nagaosa, and X.-G. Wen, Rev. Mod. Phys. 78, 17 (2006).
- Armitage, Fournier, and Greene (2010) N. P. Armitage, P. Fournier, and R. L. Greene, Rev. Mod. Phys. 82, 2421 (2010).
- Rice, Yang, and Zhang (2012) T. M. Rice, K.-Y. Yang, and F. C. Zhang, Reports on Progress in Physics 75, 016502 (2012).
- Avella (2014) A. Avella, Advances in Condensed Matter Physics 2014, 515698 (2014).
- Keimer et al. (2015) B. Keimer, S. A. Kivelson, M. R. Norman, S. Uchida, and J. Zaanen, Nature 518, 179 (2015).
- Avella et al. (2016) A. Avella, C. Buonavolontà, A. Guarino, M. Valentino, A. Leo, G. Grimaldi, C. de Lisio, A. Nigro, and G. Pepe, Phys. Rev. B 94, 115426 (2016).
- Novelli et al. (2017) F. Novelli, G. Giovannetti, A. Avella, F. Cilento, L. Patthey, M. Radovic, M. Capone, F. Parmigiani, and D. Fausti, Phys. Rev. B 95, 174524 (2017).
- Avella (2018) A. Avella, Physica B 536, 713 (2018).
- Mackenzie and Maeno (2003) A. P. Mackenzie and Y. Maeno, Rev. Mod. Phys. 75, 657 (2003).
- Ovchinnikov (2003) S. G. Ovchinnikov, Physics-Uspekhi 46, 21 (2003).
- Cuoco, Forte, and Noce (2006a) M. Cuoco, F. Forte, and C. Noce, Phys. Rev. B 73, 094428 (2006a).
- Cuoco, Forte, and Noce (2006b) M. Cuoco, F. Forte, and C. Noce, Phys. Rev. B 74, 195124 (2006b).
- Forte, Cuoco, and Noce (2010) F. Forte, M. Cuoco, and C. Noce, Phys. Rev. B 82, 155104 (2010).
- Autieri, Cuoco, and Noce (2012) C. Autieri, M. Cuoco, and C. Noce, Phys. Rev. B 85, 075126 (2012).
- Malvestuto et al. (2013) M. Malvestuto, V. Capogrosso, E. Carleschi, L. Galli, E. Gorelov, E. Pavarini, R. Fittipaldi, F. Forte, M. Cuoco, A. Vecchione, and F. Parmigiani, Phys. Rev. B 88, 195143 (2013).
- Autieri, Cuoco, and Noce (2014) C. Autieri, M. Cuoco, and C. Noce, Phys. Rev. B 89, 075102 (2014).
- Granata et al. (2016) V. Granata, L. Capogna, F. Forte, M.-B. Lepetit, R. Fittipaldi, A. Stunault, M. Cuoco, and A. Vecchione, Phys. Rev. B 93, 115128 (2016).
- Mazin et al. (2008) I. I. Mazin, D. J. Singh, M. D. Johannes, and M. H. Du, Phys. Rev. Lett. 101, 057003 (2008).
- Stewart (2011) G. R. Stewart, Rev. Mod. Phys. 83, 1589 (2011).
- Bao et al. (2015) J.-K. Bao, J.-Y. Liu, C.-W. Ma, Z.-H. Meng, Z.-T. Tang, Y.-L. Sun, H.-F. Zhai, H. Jiang, H. Bai, C.-M. Feng, Z.-A. Xu, and G.-H. Cao, Phys. Rev. X 5, 011013 (2015).
- Wu et al. (2010) W. Wu, X. Zhang, Z. Yin, P. Zheng, N. Wang, and J. Luo, Science China Physics, Mechanics and Astronomy 53, 1207 (2010).
- Wu et al. (2014) W. Wu, J. Cheng, K. Matsubayashi, P. Kong, F. Lin, C. Jin, N. Wang, Y. Uwatoko, and J. Luo, Nature Communications 5, 5508 (2014).
- Kotegawa et al. (2014) H. Kotegawa, S. Nakahara, H. Tou, and H. Sugawara, Journal of the Physical Society of Japan 83, 093702 (2014), https://doi.org/10.7566/JPSJ.83.093702 .
- Tang et al. (2015a) Z.-T. Tang, J.-K. Bao, Y. Liu, Y.-L. Sun, A. Ablimit, H.-F. Zhai, H. Jiang, C.-M. Feng, Z.-A. Xu, and G.-H. Cao, Phys. Rev. B 91, 020506 (2015a).
- Tang et al. (2015b) Z.-T. Tang, J.-K. Bao, Z. Wang, H. Bai, H. Jiang, Y. Liu, H.-F. Zhai, C.-M. Feng, Z.-A. Xu, and G.-H. Cao, Science China Materials 58, 16 (2015b).
- Peierls (1955) R. Peierls, Quantum Theory of Solids (Oxford University Press, London, 1955).
- van Smaalen (2005) S. van Smaalen, Acta Crystallographica Section A 61, 51 (2005).
- Kong, Bud’ko, and Canfield (2015) T. Kong, S. L. Bud’ko, and P. C. Canfield, Phys. Rev. B 91, 020507 (2015).
- Zhi et al. (2015) H. Z. Zhi, T. Imai, F. L. Ning, J.-K. Bao, and G.-H. Cao, Phys. Rev. Lett. 114, 147004 (2015).
- Pang et al. (2015) G. M. Pang, M. Smidman, W. B. Jiang, J. K. Bao, Z. F. Weng, Y. F. Wang, L. Jiao, J. L. Zhang, G. H. Cao, and H. Q. Yuan, Phys. Rev. B 91, 220502 (2015).
- Adroja et al. (2015) D. T. Adroja, A. Bhattacharyya, M. Telling, Y. Feng, M. Smidman, B. Pan, J. Zhao, A. D. Hillier, F. L. Pratt, and A. M. Strydom, Phys. Rev. B 92, 134505 (2015).
- Jiang, Cao, and Cao (2015) H. Jiang, G. Cao, and C. Cao, Scientific Reports 5, 16054 (2015).
- Xian-Xin et al. (2015) W. Xian-Xin, L. Cong-Cong, Y. Jing, F. Heng, and H. Jiang-Ping, Chinese Physics Letters 32, 057401 (2015).
- Wu et al. (2015) X. Wu, F. Yang, C. Le, H. Fan, and J. Hu, Phys. Rev. B 92, 104511 (2015).
- Zhang et al. (2016) L.-D. Zhang, X. Wu, H. Fan, F. Yang, and J. Hu, EPL (Europhysics Letters) 113, 37003 (2016).
- Yi, Chao, and Fu-Chun (2017) Z. Yi, C. Chao, and Z. Fu-Chun, Science Bulletin 62, 208 (2017).
- Setyawan and Curtarolo (2010) W. Setyawan and S. Curtarolo, Computational Materials Science 49, 299 (2010).
- Autieri et al. (2017) C. Autieri, G. Cuono, F. Forte, and C. Noce, Journal of Physics: Condensed Matter 29, 224004 (2017).
- Autieri and Noce (2017) C. Autieri and C. Noce, Philosophical Magazine 97, 3276 (2017).
- Autieri et al. (2018) C. Autieri, G. Cuono, F. Forte, and C. Noce, Journal of Physics: Conference Series 969, 012106 (2018).