Protein escape at the ribosomal exit tunnel: Effects of native interactions, tunnel length and macromolecular crowding
Abstract
How fast a post-translational nascent protein escapes from the ribosomal exit tunnel is relevant to its folding and protection against aggregation. Here, by using Langevin molecular dynamics, we show that non-local native interactions help decreasing the escape time, and foldable proteins generally escape much faster than same-length self-repulsive homopolymers at low temperatures. The escape process, however, is slowed down by the local interactions that stabilize the -helices. The escape time is found to increase with both the tunnel length and the concentration of macromolecular crowders outside the tunnel. We show that a simple diffusion model described by the Smoluchowski equation with an effective linear potential can be used to map out the escape time distribution for various tunnel lengths and various crowder concentrations. The consistency between the simulation data and the diffusion model however is found only for the tunnel length smaller than a cross-over length of 90 Å to 110 Å, above which the escape time increases much faster with the tunnel length. It is suggested that the length of ribosomal exit tunnel has been selected by evolution to facilitate both the efficient folding and efficient escape of single domain proteins. We show that macromolecular crowders lead to an increase of the escape time, and attractive crowders are unfavorable for the folding of nascent polypeptide.
I Introduction
Partially folded protein conformations can be found at the ribosome during protein translation and after translation before the full release of a nascent protein from the ribosomal exit tunnel. The folding during translation, namely cotranslational folding, occurs when a nascent polypeptide chain undergoes elongation due to biosynthesis (for reviews, see e.g. Refs.Fedorov and Baldwin (1997); Cabrita, Dobson, and Christodoulou (2010); Fedyukina and Cavagnero (2011)), while the post-translational folding is associated with a full-length protein. In both cases, the behavior of the nascent polypeptide is strongly influenced by the ribosome, especially by the ribosomal exit tunnel through which the nascent chain traverses to the cytosol or to another cellular compartment. The length of the ribosomal exit tunnel spans from 80 Å to 100 Å, depending on where the exit end is defined, whereas its width varies between 10 Å and 20 Å Voss et al. (2006). Such a geometry allows for the formation of an -helix or a -hairpin inside the tunnel Lu and Deutsch (2005), and also promotes the -helix formation Ziv, Haran, and Thirumalai (2005), but would hardly accommodate even a small tertiary structure Kosolapov and Deutsch (2009). The tunnel was also suggested to have a recognitive function leading to a translation arrest of certain amino acid sequences, such as the SecM sequence Nakatogawa and Ito (2002). Cotranslational folding has been characterized with vectorial folding Fedorov and Baldwin (1997), i.e. the folding events proceed from the N- to the C-terminus; the non-equilibrium effect of a growing chain Marenduzzo et al. (2005); and the impact of the varying codon-dependent translation rate Zhang, Hubalewska, and Ignatova (2009); Siller et al. (2010); O’Brien, Vendruscolo, and Dobson (2014); Nissley and O’Brien (2014). Furthermore, folding of nascent proteins is assisted by the action of ribosome-associated molecular chaperones Frydman (2001); Wegrzyn and Deuerling (2005). All these effects are indicative of a highly conditional and coordinated folding of nascent protein at the ribosome, which is clearly different from refolding Anfinsen (1972) of a denatured protein in aqueous solvent. There have been experiments Evans, Sander, and Clark (2008); Ugrinov and Clark (2010); Kaiser et al. (2011) as well as simulations Chwastyk and Cieplak (2015a, b); Bui and Hoang (2016) showing that the folding efficiency of proteins is improved under biosynthesis conditions. It was also suggested that the impact of cotranslational folding is evolutionarily imprinted on the protein native states, as seen with an increased helix propensity Marenduzzo et al. (2005) and a decreased compactness Alexandrov (1993) of the chain near the C-terminus in the statistical analyses of protein structures from the protein data bank (PDB).
While cotranslational folding is progressively understood, little is known about post-translational folding at the ribosome. The latter is considered to take place after the protein C-terminus is released from the peptidyl transferate center (PTC), where the peptide bonds are formed. Certainly, protein must escape from the ribosomal tunnel to fully acquire the native conformation. A too slow escape would decrease the productivity of the ribosome, while a too fast escape would make the nascent protein vulnerable to aggregation Dobson (2003), as the partially folded protein may still have a large exposure of hydrophobic segments. In a recent study Bui and Hoang (2016), by using MD simulations, we have shown that post-translational folding at the exit tunnel is concomitant with the escape process and that the tunnel induces a vectorial folding of the full-length protein. Such a folding has a greatly reduced number of pathways and leads to an improved folding efficiency. Interestingly, it has been also shown Bui and Hoang (2016) that the escape time distribution of protein can be captured by a simple one-dimensional diffusion model of a particle in a linear potential field with an exact solution of the Smoluchowski equation.
The purpose of the present study is to explore the protein escape at the ribosomal exit tunnel with a focus on several effects, namely the role of native interactions, the impact of tunnel length and the influence of macromolecular crowders Minton (2001); Zhou, Rivas, and Minton (2008). We use the same approach as given in our previous work Bui and Hoang (2016), that is to consider simple coarse-grained models for the protein, the exit tunnel and the crowders, which enable multiple simulations of protein growth and escape by using the Langevin equation. The diffusion model for protein escape previously introduced Bui and Hoang (2016) is improved in this study by considering an absorbing boundary condition. We find that escape time reflects well the changes in the system properties, such as the native contact map, the tunnel length and the crowder concentration with a remarkable consistency between simulations and the theoretical diffusion model. Interestingly, the dependence of the escape time on the tunnel length suggests an explanation for the observed length of the exit tunnel in real ribosomes. Our results obtained with attractive crowders provide an insight into the effect of ribosome-associated chaperones on the escape and folding of nascent proteins at the ribosome.
II Methods
II.1 Models of nascent protein, ribosomal exit tunnel and macromolecular crowders
As a nascent protein we will focus on the B1 domain of protein G of length amino acids with the PDB code of 1pga, denoted as GB1. The protein is considered in a Go-like model Go (1983); Hoang and Cieplak (2000a, b); Clementi, Nymeyer, and Onuchic (2000), in which each amino acid is considered a single bead centered at the position of the Cα atom. We adopt the same Go-like model as given in our previous work Bui and Hoang (2016) except that with a 10-12 Lennard-Jones (LJ) potential for native contact interactions. In addition, we consider three types of native contact maps, denoted as C1, C2 and C3, for the model. The C1 map is defined by a cut-off distance of 7.5 Å between the Cα atoms in the native conformation. The C2 and C3 maps are obtained based on an all-atom consideration Cieplak and Hoang (2002) of the protein PDB structure: contact between two amino acids is identified if there are least two non-hydrogen atoms belonging to the two amino acids, found at a distance shorter than times the sum of their atomic van der Waals radii. C2 map has whereas C3 has . The choice of is such that the C2 map has the same number of native contacts and the C1 for the GB1 protein. The interaction between a pair of amino acids forming a native contact takes the form of a 10-12 LJ potential Clementi, Nymeyer, and Onuchic (2000)
| (1) |
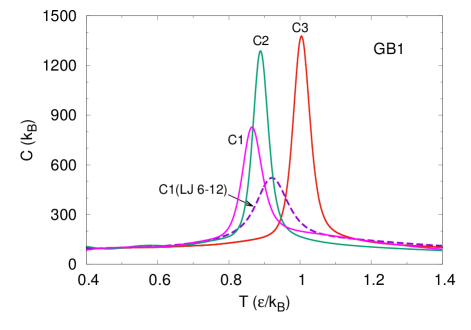
where is an energy unit in the system corresponding to the strength of the LJ potential, is the distance between residues and , and is the corresponding distance in the native state. The use of 10-12 LJ potential makes the folding transition more cooperative Kaya and Chan (2000) than the 6–12 LJ potential (used in previous work Bui and Hoang (2016)) as indicated by the height of the specific heat peak (see Fig. S1 of the supplementary material). Additionally, we will consider also a number of small single-domain proteins to study the effects of native interactions and the tunnel length on the escape process.
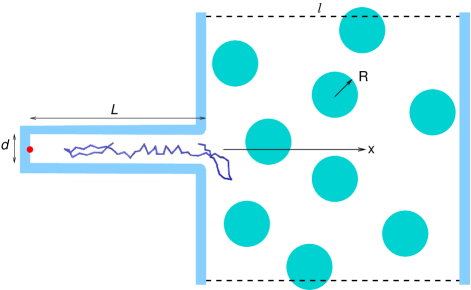
The ribosomal tunnel is modeled as a hollow cylinder of repulsive walls with diameter Å and length (Fig. 1). It has been shown Bui and Hoang (2016) that this diameter allows for the formation of an -helix and a -hairpin inside the tunnel but not tertiary structures. In the present study, is allowed to changed between 0 and 140 Å. The cylinder has one of its circular bases open and attached to a repulsive flat wall mimicking the ribosome’s outer surface. Macromolecular crowders are modeled as soft spheres of radius Å ( is chosen approximately equal to the radius of gyration of GB1, Å). Assume that the axis is the tunnel axis, the crowders are confined between the ribosome’s wall and another wall parallel to it at a distance Å along the direction. Periodic boundary conditions are applied for the and directions with a box size equal to . The crowders’ volume fraction is given by , with the number of crowders.
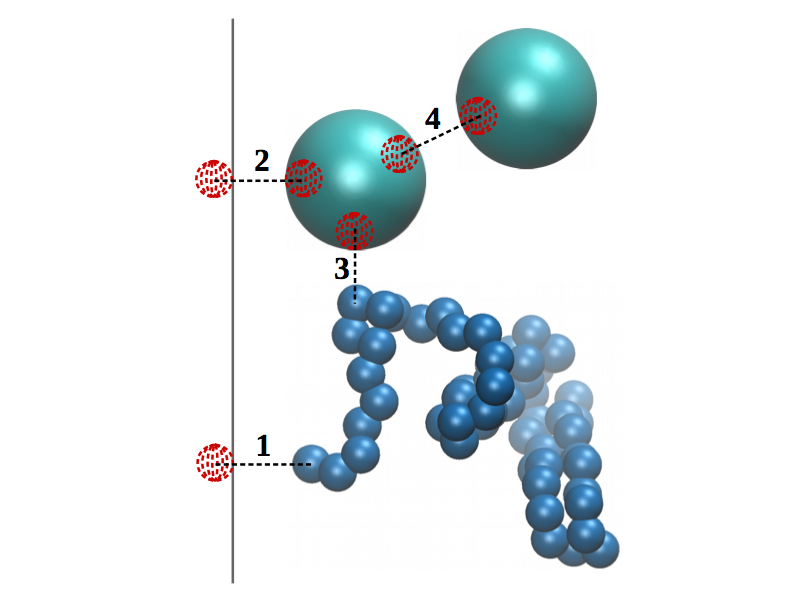
The interactions between an amino acid and a wall, between a crowder and a wall, and between two crowders are all repulsive and given in the form of a shifted and truncated LJ potential
| (2) |
where Å is a characteristic length equal to the typical diameter of an amino acid; is the distance between an amino acid and the nearest virtual residue Bui and Hoang (2016) of diameter , embedded under the surface a wall or a crowder, or between two such virtual residues (see Fig. 2 for the definition of virtual residue).
Additionally, we will consider also a case in which the crowders are weakly attractive to amino acids with the interaction given by the 6–12 LJ potential
| (3) |
with energy parameter .
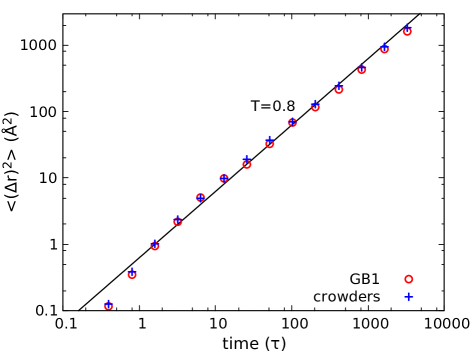
The motions of the protein and the crowders are simulated by using the Langevin equations Bui and Hoang (2016); Hoang and Cieplak (2000a). One assumes that all amino acids have the same mass, , while the crowders has a molecular mass equal to the mass of the protein, i.e. . Similarly, the friction coefficient of amino acid is , whereas that of crowder is . The Langevin equations are integrated by using a Verlet algorithm introduced in Ref. Bui and Hoang (2016) with time step , where is the time unit in the system. In the simulations we use , for which the dynamics of the system are in the overdamped limit Bui and Hoang (2016); Klimov and Thirumalai (1997). Fig. 3 shows that the employed dynamics lead to the same diffusion characteristics for a folded protein and for crowders in the solution. These characteristics are also close to that of a Brownian motion for times larger than .
Following previous work Bui and Hoang (2016), the nascent protein is grown inside the tunnel at the PTC from the terminus to the terminus with the growth time per amino acid . This growth speed is sufficiently slow to produce fully translated conformations of similar structural characteristics to those obtained by a much slower growth speed Bui and Hoang (2016). The escape time is measured from the moment the protein has grown to its full length until all of its amino acids are escaped from the tunnel.
II.2 Diffusion model of protein escape
Our previous study Bui and Hoang (2016) has shown that the protein escape at the exit tunnel in absence of crowders is a downhill process corresponding to a free energy which monotonically decreases along a reaction coordinate associated with the escape degree, such as the number of residues outside the tunnel or the position of the C-terminus. Such a process is consistent with the diffusion of a particle in an one-dimensional external potential field where is a decreasing function of . This diffusion process is described by the Smoluchowski equation Van Kampen (1992)
| (4) |
where is a conditional probability density of finding the particle at position and at time , given that it was found previously at position at time ; is diffusion constant, assumed to be position independent; and is the inverse temperature with the Boltzmann constant. Assume that the external potential field has a linear form, , with a constant. For a nascent protein at the tunnel, the constant presents an average slope of the dependence of the free energy of the protein on the escape coordinate. In such a case, a solution of Eq. (4) for an unconstrained particle is given by
| (5) |
given that the initial condition is . This solution gives the mean displacement of the particle
| (6) |
with a diffusion speed equal to . For a Brownian particle, depends on the temperature and on the friction coefficient according to the Einstein’s relation
| (7) |
The escape time of nascent protein at the tunnel corresponds to the first passage time (FPT) of a diffused particle subject to the initial condition at and an absorbing boundary condition at . The latter condition is given as
| (8) |
The FPT distribution for this absorbing boundary condition can be found in Ref. Cox and Miller (1965) and is given by
| (9) |
Using the distribution in Eq. (9) one obtains the mean escape time
| (10) |
and the standard deviation
| (11) |
It follows that the ratio is independent of . Note that both and diverges when , for which becomes the heavy-tailed Lévy distribution. It can be expected that and may depend on and on the crowders’ volume fraction . These dependences will be investigated in the present study.
III Results and Discussion
III.1 Effect of native interactions
Our previous study Bui and Hoang (2016) has shown that the folding of nascent proteins speeds up their escape process at the ribosomal tunnel. Here, we investigate how this enhancement is sensitive to the details of native interactions and how the escape of a protein is different from that of a homopolymer. For this investigation, we fix the length of the tunnel to be Å and consider the protein without crowders.
We consider the protein GB1 with three different native contact maps, C1, C2 and C3, as described in the Methods section. Both the C1 and C2 maps have 102 native contacts, but of which only 72 contacts are common. The C2 map has more long-range contacts than the C1 one. The relative contact order (CO) Plaxco, Simons, and Baker (1998) of the C2 map (), is higher than that of the C1 map (). The C3 map has 120 contacts (CO ) and includes all the contacts in the C2 map. The folding temperature of a free protein without the tunnel is defined as the temperature of the maximum of the specific heat peak (Fig. S1 of the supplementary material) and equal to 0.866, 0.888 and 1.004 for the models with C1, C2 and C3 contact maps, respectively. We consider also two homopolymers of the same length as the GB1 protein (). The first one is a self-repulsive homopolymer with a repulsive potential of for the interaction between any pair of non-consecutive beads. The second homopolymer is a self-attractive one with the 12-10 LJ potential, given by Eq. (1), for the attraction between the beads. Note that the self-repulsive homopolymer can be considered as representing an intrinsically disordered protein, with regards to an important class of proteins that do not fold in vivo Wright and Dyson (2015).
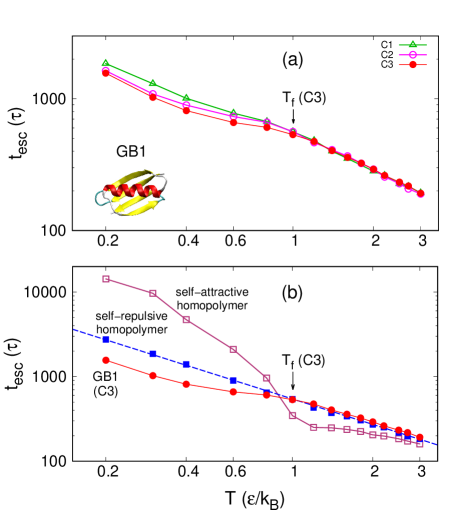
Fig. 4a shows the dependence of the median escape time, , on temperature for the GB1 protein with the three native contact maps. It is shown that for temperatures roughly larger than , all three contact maps lead to almost the same escape times. For , differences in the escape times are found among the models, even though the dependences of on are of similar shape for all the three models. The model with the C3 map has the smallest escape times, indicating that the larger number of native contacts the faster is the escape of the protein. On the other hand, the model with C2 map has smaller than the model with the C1 map, despite that they have the same number of native contacts. This result indicates that the escape time also depends on the details of the native contact map, and a protein with more long-range contacts would have a faster escape from the tunnel.
Fig. 4b compares the escape times of the GB1 protein with the C3 native contact map with the two homopolymers. It shows that for , the protein has the escape time slightly larger but close to that of the self-repulsive homopolymer, as expected for an unfolded chain. For , the protein escapes faster than the homopolymer with self-repulsion, reconfirming the favorable effect of folding on the escape process. The self-attractive homopolymer shows a very different behavior of the escape time than the self-repulsive one. In particular, for temperatures lower than an intermediate temperature of about , the self-attractive homopolymer has a much larger escape time than the self-repulsive one; while an opposite trend is seen for , for which the self-attractive polymer escapes faster than the other one. We find that for , the full-length homopolymer starts the escape process with a collapsed conformation completely fitted inside the tunnel. From this conformation, the polymer diffuses very slowly in the tunnel until a part of it emerges from the tunnel. For , the polymer begins to escape with a conformation having a small part found outside the tunnel. We have checked that the self-attractive homopolymer has a collapse transition temperature , thus below this temperature but above 0.9 , its escape process is accelerated by the collapse of the chain. Above the collapse transition temperature, the escape time of the self-attractive homopolymer is smaller but approaching that of the self-repulsive one as temperature increases. Note that below the collapse transition temperature, the size of the collapsed polymer still depends on temperature. Thus, the temperature of 0.9 , at which a rapid change in the escape time is seen, should be understood as specific to the polymer length and the tunnel length considered. At this temperature, the typical size of the self-attractive homopolymer along the tunnel axis approximately matches that of the tunnel.
The result of the self-attractive homopolymer shows that the collapse of the chain accelerates the escape process only when the chain has a part found outside the tunnel. It indicates the relative size of the polymer to the tunnel length and also temperature are relevant to the escape behavior of the polymer. We find that protein behaves similarly on increasing the tunnel length, as will be shown in the next subsection.
Only for the self-repulsive homopolymer, the escape time is proportional to for the whole range of temperature. As is approximately constant on changing temperature (see Fig. 12 of this study and also Ref. Bui and Hoang (2016)), it follows from Eq. (10) that the diffusion coefficient of the self-repulsive homopolymer is proportional to , consistent with the Einstein’s relation for Brownian particle (Eq. (7)). Deviation from this Brownian behavior on changing temperature thus is observed for the protein and the self-attractive homopolymer due to the fact that they adopt different compact conformations during the escape process at temperatures below their folding or collapse transition temperatures.
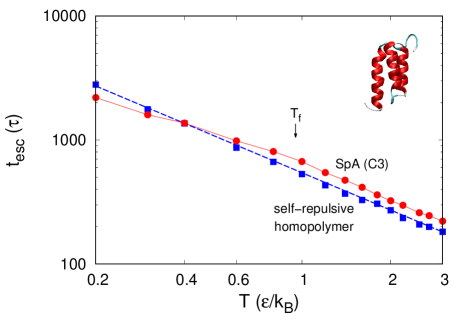
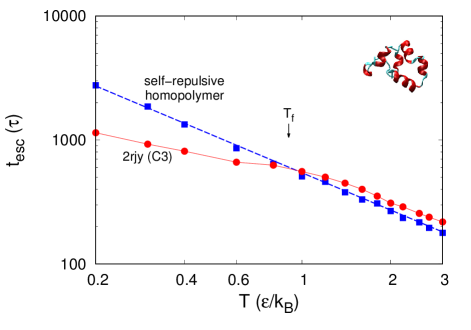
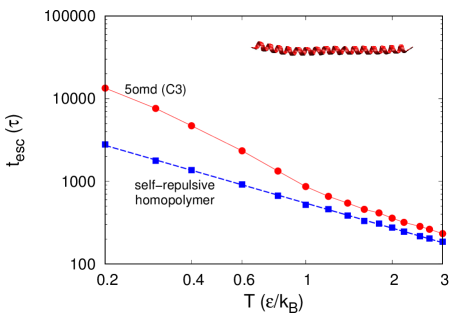
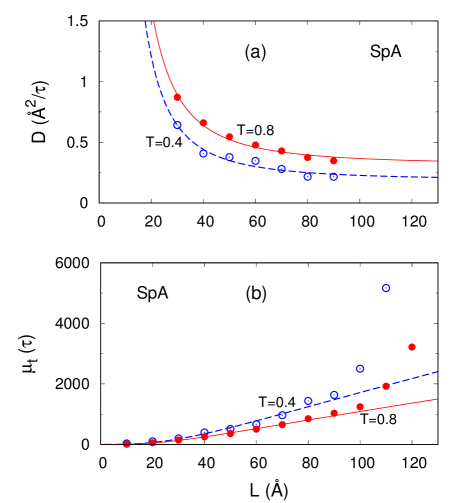
We have calculated the escape time for a number of small single-domain proteins other than GB1 with different native state topologies. Fig. 5 shows the dependence of the median escape time on temperature for the Z domain of Staphylococcal protein (SpA) of length . The native state of SpA is a three-helix bundle (Fig. 5, inset). It is shown that at high temperatures, the escape time of SpA is higher than the escape time of a same-length self-repulsive homopolymer. However, for , the relative difference between the two escape times decreases with temperature, and for , the protein escape faster than the homopolymer. Thus, the folding of SpA enhances its escape process. We have found that another helix bundle with the PDB code 2rjy also escapes faster then the homopolymer at temperatures lower than (see Fig. S2 of supplementary material). On the other hand, a single -helix escapes more slowly than the self-repulsive homopolymer at all temperatures (see Fig. S3 of supplementary material). These results suggest that local interactions stabilizing the -helix slow down the escape process and the latter is accelerated only by the non-local interactions.
Note that the Go-like model includes local potentials on the bond angles and dihedral angles favoring native conformation while the homopolymer model does not. Even at temperatures higher than , these interactions still have some effect on the local conformations. For -helical proteins, they make the escaping protein conformations less extended and more rigid than those of the self-repulsive homopolymer. This effect explains why -helical proteins escape more slowly than the self-repulsive homopolymer for , at least for up to 3 as shown in Fig. 5. It can be expected that for much higher temperatures, at which the local potentials become unimportant, the escape time of protein approaches that of the homopolymer.
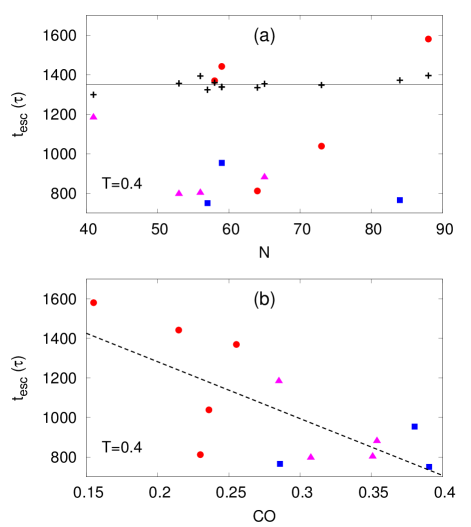
The different effects of local and non-local interactions on the escape time of proteins can also be seen in Fig. 6. Fig. 6b shows that at a temperature favorable for folding, , the escape time of protein to a considerable degree is correlated with the relative contact order. Fig. 6a shows that the escape time of protein is uncorrelated with the chain length, whereas that of the self-repulsive homopolymer is almost independent on the chain length. Fig. 6a also shows that the / and all- proteins have smaller escape time than the same-length homopolymers, whereas the all- proteins may have smaller or larger escape time than the homopolymers. We have checked that among the all- proteins considered, the larger the number of non-local contacts, the faster the protein escapes.
III.2 Effect of tunnel length
We study now the dependence of the escape time on the length of the ribosomal tunnel, which is considered as an adjustable parameter in our model. For this investigation, we have carried out simulations for the GB1 protein with the tunnel length varied between 10 and 130 Å, and analyzed the statistics of the escape times using the insights from the diffusion model. From here on, for simplicity, we consider only the Go-like model with the C3 native contact map for protein GB1.
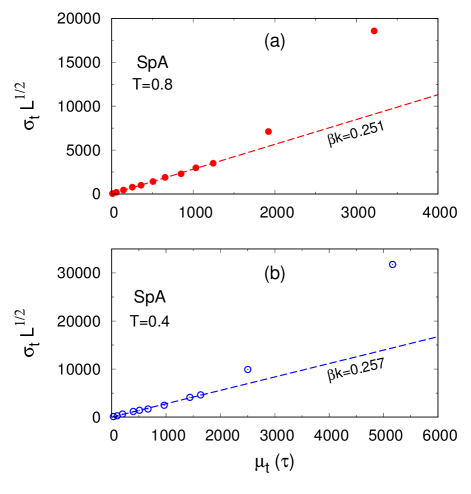
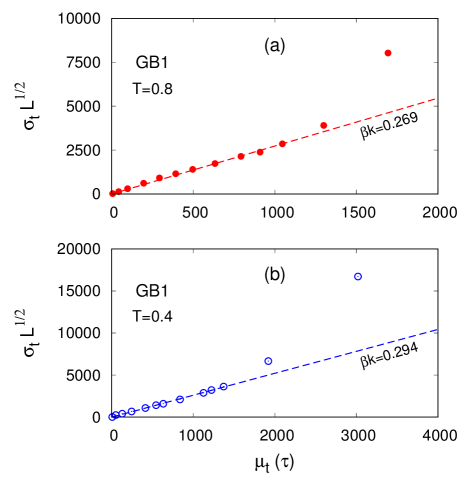
The diffusion model predicts that the ratio between the standard deviation of the escape time, , and the mean escape time, , is given by
| (12) |
and thus depends only on and . Fig. 7 shows that the dependence of on for GB1 obtained by the simulations at two different temperature below is almost linear for Å. This linear dependence indicates that is constant on changing , for Å. The fits of the simulation data to Eq. (12) show that Å-1 for and Å-1 for . Thus, the values of are not the same but quite close for the two temperatures considered. Fig. 7 shows that for Å, the dependence of on strongly deviates from the linear dependence obtained for smaller , indicating that quickly decreases on increasing . Thus, the diffusion properties of the protein changes qualitatively at the tunnel length of Å. We call the latter the cross-over length for the diffusion of protein at the tunnel.
By fitting the distribution of the escape time obtained from the simulations to that given by Eq. (9) with the values of as given in Fig. 7, one obtains the effective diffusion constant of the protein at the tunnel for Å. Fig. 8a shows that decreases with . This dependence reflects the facts that the protein has a changing shape when escaping from the tunnel, and that the shape depends on . When is increased, the initial conformation of the full-length protein at the tunnel becomes more extended leading to a slower diffusion. Fig. 8b shows that the mean escape time increases with . As indicated by Eq. (10), the growth of the escape time on increasing is due to both the longer diffusion distance (which is equal to ) and the slower diffusion speed. Fig. 8b also shows that for Å, the escape time increases with much faster than for Å, in consistency with the change in diffusion properties shown in Fig. 7.
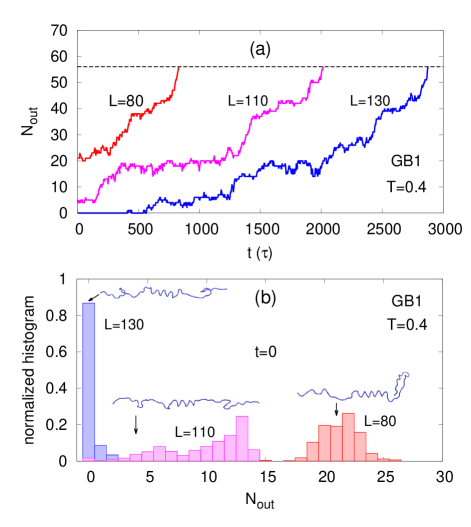
The cross-over in the diffusion properties and the escape time observed at Å for GB1 is related to the relative size of a tunnel compared to that of a protein. If the tunnel length is such that the protein, presumably with most of the secondary structures formed, can be found completely inside the tunnel, then the escape of the protein is much slower than the case of a shorter tunnel length, in which the protein cannot fit itself entirely in the tunnel. The tunnel length of 110 Å thus is related to the size of GB1, such that it can merely have a small part outside the tunnel at the moment the chain is released from the PTC. The escape process is accelerated only by the folding of the escaped part of the protein at the tunnel. Fig. 9a shows that in typical escape processes, the number of amino acid residues escaped from the tunnel, , has similar trends in the time evolution for different tunnel lengths , except that has different values at , the moment a full-length protein begins the escape process. Fig. 9b shows that the distribution of at strongly depends on . For Å, the protein is mostly found completely inside the tunnel, i.e. . On the other hand, for Å, the protein always has a significant part outside the tunnel with essentially ranging from 18 to 26. For the cross-over length Å, varies between 0 and 15. The cross-over length approximately corresponds to the smallest tunnel length for which can have a zero value.
In consistency with the above mechanism, we find that a similar cross-over of the diffusion properties and the escape time on increasing the tunnel length is observed for the three-helix bundle protein SpA. For SpA, the cross-over occurs at Å (see Figs. S4 and S5 of supplementary material), quite close to the cross-over length for GB1, and is consistent with the fact the both proteins are single domain and of similar size. The shorter cross-over length for SpA is a little shorter than for GB1 due to the fact that SpA can form more -helices inside the tunnel, leading to a shorter size than GB1. Interestingly, the real length of ribosomal exit tunnel falls between 80 Å and 100 Å, very close to our estimates of the cross-over length for the GB1 and SpA proteins. Note that the latter are among the smallest single domain proteins. It is suggested that the ribosome’s tunnel length has been selected to facilitate an efficient escape of small single domain proteins. Our study indicates that the cross-over tunnel length increases with the protein size, thus large proteins would have no problem of escaping the ribosomal tunnel from the viewpoint of diffusibility.
III.3 Effect of macromolecular crowding
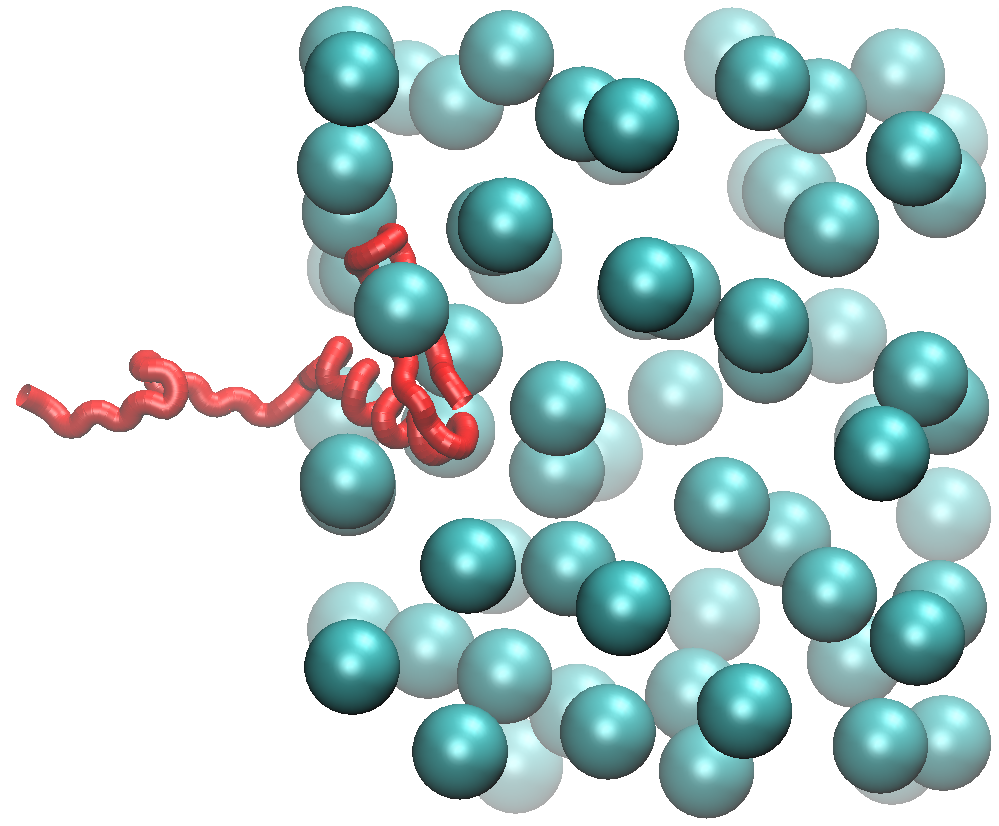
We proceed now study the escape of nascent protein in the presence of a crowd of macromolecules outside the ribosomal tunnel. For this investigation, we fix the tunnel length to be Å and consider various volume fractions of the crowders. A snapshot of an escaping protein molecule entering the solution of crowders is shown in Fig. S6 of supplementary material.
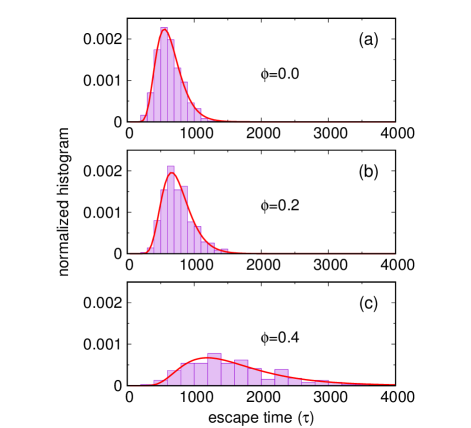
First, we consider the case in which the interaction between the crowders and amino acids are purely repulsive. Fig. 10 shows histograms of the escape time obtained by the simulations for the GB1 protein at for the crowders’ volume fraction , 0.2 and 0.4. It is shown that as increases the histogram is more spread and shifted toward higher time values, meaning that the escape time is longer and more disperse in the presence of crowders. The histograms of the escape time are found to be consistent with the distribution function given by Eq. (9) of the diffusion model. The fits to this function give us the effective values of and for different crowder concentrations.
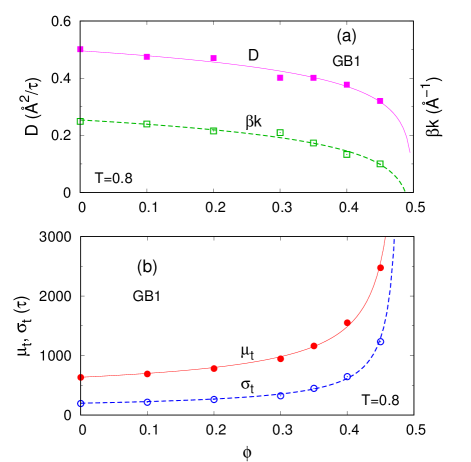
Fig. 11a shows that both and decrease with . We find that both and can be approximately described with a logarithmic dependence on in the following forms:
| (13) | |||||
| (14) |
where and are the values of and , respectively, at ; and are the fitting parameters; and is a cut-off volume fraction, beyond which the full escape of the protein becomes impossible. We find that is a good estimate. The above logarithmic dependences suggest that the effect of the crowders on the escape process of protein has an entropic origin, as can be considered as the effective volume fraction accessible to the escaping protein in the space outside the tunnel. Note that entropy loss due to excluded volume is also the primary effect of crowding and confinement on protein stability Minton (2001); Zhou, Rivas, and Minton (2008). Having the functions given in Eqs. (13, 14), one can calculate the mean and the standard deviation of the escape time from Eqs. (10,11) of the diffusion model. Fig. 11b shows that the mean escape time and the dispersion of the escape time obtained from simulations at various also agree with the diffusion model.
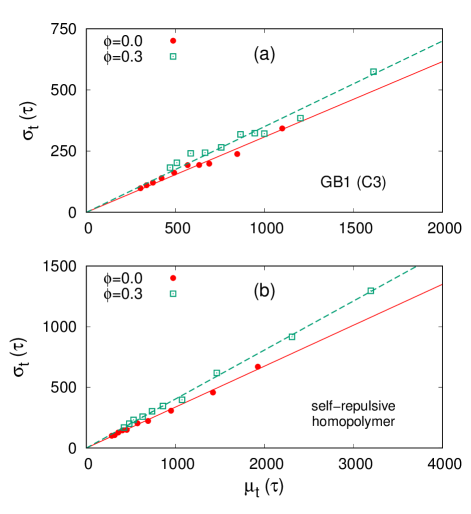
Fig. 12 shows that the standard deviation of the escape time, , depends almost linearly on the the mean escape time, , for both the protein and the self-repulsive homopolymer at various temperatures, indicating that is constant for each system on changing the temperature. The value of however depends on the volume fraction of the crowders, as indicated by the slopes of the fits shown in Fig. 12. One finds that decreases when increases from 0 to 0.3 for both the protein and the polymer, indicating that diffusion is slower in the presence of crowders. Again here, one also finds that for both cases, with and without crowders, the value of for GB1 is larger than for the self-repulsive homopolymer, confirming the enhancing effect of folding on the escape of protein.
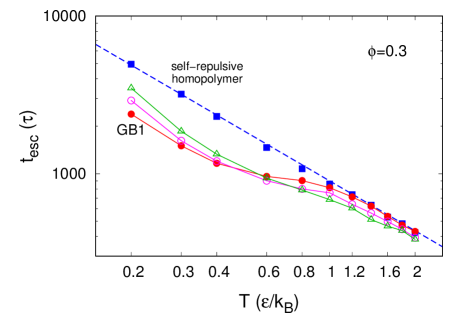
Fig. 13 shows the dependence of the median escape time on temperature for the protein GB1 and the self-repulsive homopolymer in the presence of repulsive crowders at the volume fraction . It is shown that the log-log plot of this dependence for both the protein and the homopolymer has similar characteristics to that found in Fig. 4 for the case without crowders, except that the escape times are longer with the crowders. For the homopolymer, the escape time decreases with temperature linearly in the log-log plot with a slope close to , indicating that the diffusion constant of the polymer also depends linearly on temperature like for the case without crowders. In the presence of repulsive crowders, the escape times of protein at high temperatures are close to those of the self-repulsive homopolymer. At low temperatures, favorable for folding, the protein has significant shorter escape times than the polymer, indicating that the impact of folding on the escape time is not affected by the crowders.
Fig. 13 also shows the escape times of protein in the presence of attractive crowders with two different interaction strengths, and , of the attraction between crowder and amino acid. It can be seen that the attractive crowders make the escape faster than the repulsive crowders, but only at high and intermediate temperatures. At low temperatures (), the protein escapes more slowly in the presence of attractive crowders than of the repulsive ones. Furthermore, the escape time also increases when the attraction strength increases at low temperatures. The reason for this increase is that, in contrast to repulsive crowders, attractive crowders destabilize the native interactions in protein. Thus, folding is less favorable in the presence of attractive crowders leading to a weaker enhancement of folding on the escape speed. Fig. 14 shows that the distributions of the root mean square deviation (rmsd) from the native state and the radius of gyration of protein conformations obtained at the moment of full escape from the tunnel are shifted towards higher values when switching from repulsive crowders to attractive crowders.
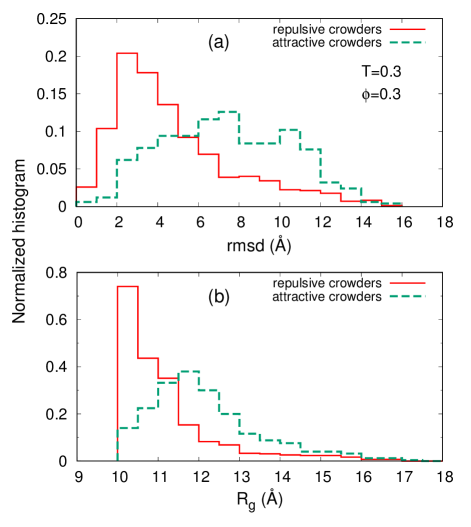
It is believed that ribosome-associated chaperones, such as the trigger factor (TF) in prokaryotes or the Hsp70 Ssb and NAC (nascent chain-associated complex) in eukaryotes, are of particular importance in guiding nascent proteins to fold correctly Wegrzyn and Deuerling (2005). The binding of these chaperones to the ribosome effectively leads to a very high concentration of chaperones near the exit tunnel Witt (2009), promoting their interaction with nascent polypeptide. As a result, the chaperones quickly bind to unfolded, hydrophobic segments of the polypeptide before these segments can fold or misfold, keeping the nascent chain unfolded. Our simulations with attractive crowders show a similar effect, as indicated in Fig. 14, that attractive crowders make the fully released protein conformation less native-like and less compact than in the case with repulsive crowders. Our simulations predict that the escape time of nascent protein increases in the presence of chaperones due to both their crowding effect and their attractive interaction with hydrophobic segments.
IV Conclusion
Post-translational escape of nascent protein at the ribosome is a stochastic process governed by protein native interactions, the geometry of the ribosomal exit tunnel and macromolecular crowders outside the tunnel. We have shown that non-local native interactions speed up the escape process at temperatures favorable for folding, while the local interactions responsible for the formation of -helices slow it down. As a consequence, proteins with a content of -sheets tend to escape faster than those with only -helices in the native state. Increasing the tunnel length or the concentration of crowders also slows down the protein escape. In the view that the concomitant folding and escape of nascent protein at the exit tunnel are beneficial for both the productivity of the ribosome and the protection of nascent protein against aggregation, it can be conjectured that the protein synthesis machinery has been evolved to facilitate both the folding and the escape of nascent proteins. In support of this conjecture, we have shown that real ribosomal exit tunnel has adopted the length that is close to a cross-over length of the tunnel, beyond which the protein escape falls into a regime of a much slower diffusion for small single domain proteins.
Our study shows that repulsive crowders outside the tunnel induce an entropic effect on the diffusion properties of protein at the tunnel, leading to increased escape times but does not change the enhancing effect of folding on the escape process. The latter effect is changed only in the case of attractive crowders, whose attraction to amino acids competes with native interactions in the nascent polypeptide. Due to this competition the fully escaped protein conformation is more extended and less native-like. The unfavorable effect of attractive crowders on the folding of nascent protein is also reflected on the increased escape times at low temperatures, as shown in our study. It is suggested that the ribosome-associated chaperones induce similar effects on nascent polypeptides as found with attractive crowders.
Low-dimensional diffusion models have been successfully applied to study complex dynamics Kramers (1940); Zwanzig (1988); Peters et al. (2013). Our work proves that the simple diffusion model considered is useful for understanding the escape of protein at the exit tunnel. The results suggest that intrinsically disordered proteins, considered as the self-repulsive homopolymer in our study, have longer escape time than foldable proteins with a significant number of long-range contacts, and their diffusion is the most akin to that of a Brownian particle.
This research is funded by Vietnam National Foundation for Science and Technology Development (NAFOSTED) under Grant No. 103.01-2016.61.
Supplementary Material
See supplemental material for the specific heats for the Go-like model of GB1 with different native contact maps, the dependence of the escape time on temperature for the helical protein 2rjy and a single -helix, the dependence of the dispersion of the escape time on the mean escape time for SpA, the dependence the diffusion constant and the mean escape time on the tunnel length for SpA, and a snapshot of an escaping protein entering a solution of macromolecular crowders.
References
- Fedorov and Baldwin (1997) A. N. Fedorov and T. O. Baldwin, J. Biol. Chem. 272, 32715 (1997).
- Cabrita, Dobson, and Christodoulou (2010) L. D. Cabrita, C. M. Dobson, and J. Christodoulou, Curr. Opin. Struct. Biol. 20, 33 (2010).
- Fedyukina and Cavagnero (2011) D. V. Fedyukina and S. Cavagnero, Ann. Rev. Biophys. 40, 337 (2011).
- Voss et al. (2006) N. Voss, M. Gerstein, T. Steitz, and P. Moore, J. Mol. Biol. 360, 893 (2006).
- Lu and Deutsch (2005) J. Lu and C. Deutsch, Nat. Struct. Mol. Biol. 12, 1123 (2005).
- Ziv, Haran, and Thirumalai (2005) G. Ziv, G. Haran, and D. Thirumalai, Proc. Natl. Acad. Sci. USA 102, 18956 (2005).
- Kosolapov and Deutsch (2009) A. Kosolapov and C. Deutsch, Nat. Struct. Mol. Biol. 16, 405 (2009).
- Nakatogawa and Ito (2002) H. Nakatogawa and K. Ito, Cell 108, 629 (2002).
- Marenduzzo et al. (2005) D. Marenduzzo, T. X. Hoang, F. Seno, M. Vendruscolo, and A. Maritan, Phys. Rev. Lett. 95, 098103 (2005).
- Zhang, Hubalewska, and Ignatova (2009) G. Zhang, M. Hubalewska, and Z. Ignatova, Nat. Struct. Mol. Biol. 16, 274 (2009).
- Siller et al. (2010) E. Siller, D. C. DeZwaan, J. F. Anderson, B. C. Freeman, and J. M. Barral, J. Mol. Biol. 396, 1310 (2010).
- O’Brien, Vendruscolo, and Dobson (2014) E. P. O’Brien, M. Vendruscolo, and C. M. Dobson, Nat. Comm. 5, 2988 (2014).
- Nissley and O’Brien (2014) D. A. Nissley and E. P. O’Brien, J. Am. Chem. Soc. 136, 17892 (2014).
- Frydman (2001) J. Frydman, Ann. Rev. Biochem. 70, 603 (2001).
- Wegrzyn and Deuerling (2005) R. D. Wegrzyn and E. Deuerling, Cell. Mol. Life Sci. 62, 2727 (2005).
- Anfinsen (1972) C. B. Anfinsen, Biochem. J. 128, 737 (1972).
- Evans, Sander, and Clark (2008) M. S. Evans, I. M. Sander, and P. L. Clark, J. Mol. Biol. 383, 683 (2008).
- Ugrinov and Clark (2010) K. G. Ugrinov and P. L. Clark, Biophys. J. 98, 1312 (2010).
- Kaiser et al. (2011) C. M. Kaiser, D. H. Goldman, J. D. Chodera, I. Tinoco, and C. Bustamante, Science 334, 1723 (2011).
- Chwastyk and Cieplak (2015a) M. Chwastyk and M. Cieplak, J. Chem. Phys. 143, 045101 (2015a).
- Chwastyk and Cieplak (2015b) M. Chwastyk and M. Cieplak, J. Phys. Cond. Matt. 27, 354105 (2015b).
- Bui and Hoang (2016) P. T. Bui and T. X. Hoang, J. Chem. Phys. 144, 095102 (2016).
- Alexandrov (1993) N. Alexandrov, Prot. Sci. 2, 1989 (1993).
- Dobson (2003) C. M. Dobson, Nature 426, 884 (2003).
- Minton (2001) A. P. Minton, J. Biol. Chem. 276, 10577 (2001).
- Zhou, Rivas, and Minton (2008) H.-X. Zhou, G. Rivas, and A. P. Minton, Annu. Rev. Biophys. 37, 375 (2008).
- Go (1983) N. Go, Ann. Rev. Biophys. Bioeng. 12, 183 (1983).
- Hoang and Cieplak (2000a) T. X. Hoang and M. Cieplak, J. Chem. Phys. 112, 6851 (2000a).
- Hoang and Cieplak (2000b) T. X. Hoang and M. Cieplak, J. Chem. Phys. 113, 8319 (2000b).
- Clementi, Nymeyer, and Onuchic (2000) C. Clementi, H. Nymeyer, and J. N. Onuchic, J. Mol. Biol. 298, 937 (2000).
- Cieplak and Hoang (2002) M. Cieplak and T. X. Hoang, Int. J. Mod. Phys. C 13, 1231 (2002).
- Kaya and Chan (2000) H. Kaya and H. S. Chan, Prot. Struct. Func. Bio. 40, 637 (2000).
- Klimov and Thirumalai (1997) D. Klimov and D. Thirumalai, Phys. Rev. Lett. 79, 317 (1997).
- Van Kampen (1992) N. G. Van Kampen, Stochastic Processes in Physics and Chemistry, 3rd ed. (Elsevier, 1992).
- Cox and Miller (1965) D. R. Cox and H. D. Miller, “The theory of stochastic processes,” (Chapman and Hall, 1965) pp. 219–223.
- Plaxco, Simons, and Baker (1998) K. W. Plaxco, K. T. Simons, and D. Baker, J. Mol. Biol. 277, 985 (1998).
- Wright and Dyson (2015) P. E. Wright and H. J. Dyson, Nat. Rev. Mol. Cell Biol. 16, 18 (2015).
- Witt (2009) S. N. Witt, Prot. Pep. Lett. 16, 631 (2009).
- Kramers (1940) H. A. Kramers, Physica 7, 284 (1940).
- Zwanzig (1988) R. Zwanzig, Proc. Natl. Acad. Sci. USA 85, 2029 (1988).
- Peters et al. (2013) B. Peters, P. G. Bolhuis, R. G. Mullen, and J.-E. Shea, J. Chem. Phys. 138, 054106 (2013).
Supplementary Material for: “Protein escape at the ribosomal exit tunnel: effects of native interactions, tunnel length and macromolecular crowding”, P.T. Bui and T.X. Hoang