Galvanomagnetic properties of the putative type-II Dirac semimetal PtTe2
Abstract
Platinum ditelluride has recently been characterized, based on angle-resolved photoemission spectroscopy data and electronic band structure calculations, as a possible representative of type-II Dirac semimetals. Here, we report on the magnetotransport behavior (electrical resistivity, Hall effect) in this compound, investigated on high-quality single-crystalline specimens. The magnetoresistance (MR) of PtTe2 is large (over at K in T) and unsaturated in strong fields in the entire temperature range studied. The MR isotherms obey a Kohler’s type scaling with the exponent = 1.69, different from the case of ideal electron-hole compensation. In applied magnetic fields, the resistivity shows a low-temperature plateau, characteristic of topological semimetals. In strong fields, well-resolved Shubnikov – de Haas (SdH) oscillations with two principle frequencies were found, and their analysis yielded charge mobilities of the order of and rather small effective masses of charge carriers, and . However, the extracted Berry phases point to trivial character of the electronic bands involved in the SdH oscillations. The Hall effect data corroborated a multi-band character of the electrical conductivity in PtTe2, with moderate charge compensation.
Introduction
Topological semimetals (TSs) form an outstanding group of materials characterized by perfect linear dispersion of some bulk electronic states.[1, 2] In accordance with presence or absence of Lorentz invariance, one discriminates type-I and type-II systems.[3] In the latter class of TSs, Dirac cone is strongly tilted with respect to Fermi level.[4] Both type-I and type-II TSs can be composed from Dirac or Weyl fermions, depending on what kind of symmetries is preserved.[5] Nontrivial electronic structures of TSs give rise to unusual electronic transport properties, commonly considered being highly prospective for various electronic devices of new kind. A hallmark feature of TSs is chiral magnetic anomaly (CMA), which manifests itself as a negative magnetoresistance (MR) observed when electric and magnetic fields are collinear.[6] Actually, negative MR was found in many TSs, more often in type-I materials [7, 8, 9, 10, 11] but also in a few type-II systems.[12] Another smoking-gun signature of TSs is the existence of topological surface states, which have a form of Fermi-arcs.[1, 2] Their presence was confirmed experimentally in a large number of TSs, among them Cd3As2,[13] MoTe2,[14] WTe2[15] and TaAs.[16]
Type-II topological semimetallic states have been revealed in several transition metal dichalcogenides and in MA3 (M = V, Nb, Ta; A = Al, Ga, In) icosagenides.[17, 3, 18, 14, 4, 19, 20] Within the former group of compounds, MoTe2 and WTe2 have been classified as type-II Weyl semimetals,[14, 21] whereas platinum and palladium dichalcogenides have been established via angle-resolved photoemission spectroscopy (ARPES) experiments to represent the family of type-II Dirac semimetals.[3, 18, 22] The TSs nature of PdTe2 is reflected in its peculiar magnetotransport behavior.[23, 24] In turn, no comprehensive study on the electronic transport properties of the Pt-bearing counterpart has been reported in the literature up to date. In this work, we investigated the galvanomagnetic properties of PtTe2 with the main aim to discern features appearing due to the alleged nontrivial topology of its electronic band structure.
Results and discussion
Electrical resistivity, magnetic field-induced plateau and magnetoresistance
Figure 1a shows the results of electrical resistivity, , measurements performed on single-crystalline sample of PtTe2, as a function of temperature, , with electric current, , flowing within the hexagonal plane. The overall behavior of indicates a metallic character of the compound. The resistivity decreases from the value of at K to at K, yielding the residual resistivity ratio RRR = equal to 142. The magnitudes of both and RRR indicate high crystallinity of the specimen measured (RRR is approximately 5 times larger than that reported for PtTe2 in Ref.[18]). As displayed in Fig. 1a (note the red solid line), in the whole temperature range covered, can be very well approximated with the Bloch-Grüneisen (BG) law:
| (1) |
where is the residual resistivity, accounting for scattering conduction electrons on crystal imperfections, while the second term represents electron-phonon scattering ( stands for the Debye temperature). The least-squares fitting yielded the parameters: , K, and . The value of is smaller than , expected for simple metals, yet similar to exponents determined for several monopnictides.[25, 26, 27]
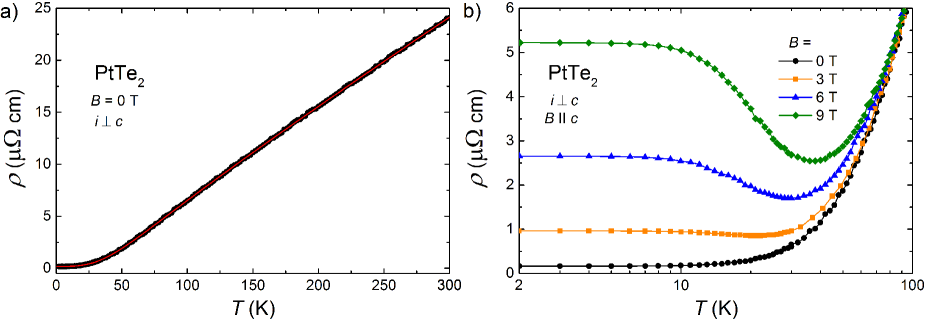
The temperature dependencies of the electrical resistivity of PtTe2 measured in transverse magnetic field ( axis and axis) are gathered in Fig. 1b. In non-zero , is a non-monotonous function of temperature, showing an upturn below a certain slightly field-dependent temperature , and then forming a plateau at the lowest temperatures. With increasing magnetic field, the magnitude of the resistivity in the turn-on and plateau regions distinctly increases. Similar behavior was considered as a fingerprint of the presence of nontrivial topology in the electronic structure of several TSs.[28, 29, 30, 31] Another possible explanation of this type of magnetic field governed changes in is a metal-insulator transition.[32, 29, 33] However, as discussed first for WTe2,[34] and afterwards, e.g., for rare-earth monopnictides,[35, 36, 37, 26, 27, 38, 25, 39, 40, 41] the magnetic field induced upturn in may appear also in trivial semimetals, which are close to perfect charge carriers compensation. We presume that the latter mechanism is also fully appropriate for the electrical transport behavior in PtTe2.
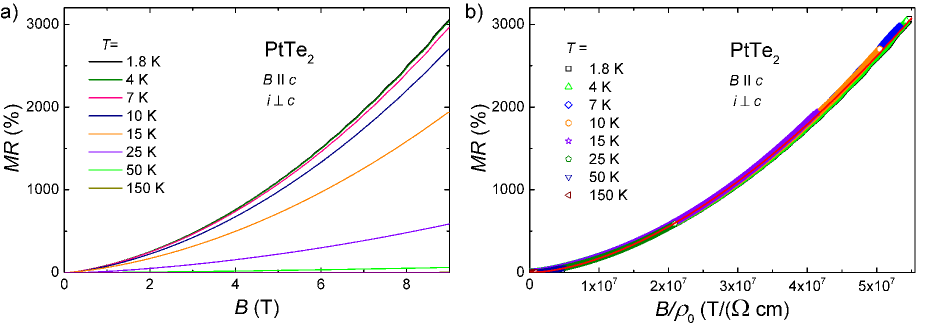
In order to examine the actual nature of the galvanomagnetic behavior observed for PtTe2, transverse magnetoresistance, MR = , measurements were performed at several constant temperatures in the configuration axis and axis. As can be inferred from Fig. 2a, in T, MR taken at K achieves a giant value of , which is an order of magnitude larger than MR determined in the same conditions for the related system PdTe2,[23] and almost equal to that reported for the type-II Weyl semimetal MoTe2.[42] With increasing temperature, MR measured in T does not change significantly up to about 10 K (i.e., in the plateau region of ), and then decreases rapidly. However, even at = 150 K, MR remains exceptionally large exceeding in 9 T. At each of the temperatures studied, MR shows no tendency towards saturation in strong fields. MR behavior similar to that of PtTe2 was established before for several TSs.[23, 42, 28, 30, 43, 44] However, unsaturated MR can be also attributed to perfect or almost perfect carrier compensation in a semimetallic material.[45]
Remarkably, as demonstrated in Fig. 2b, the MR isotherms of PtTe2 obey the Kohler’s rule in the entire temperature range studied. This finding rules out the scenario of metal-insulator transition as a possible mechanism of the magnetic field driven changes in the electrical transport of PtTe2. The MR data collapse onto a single curve, which can be approximated by the expression: MR , with the exponent (note the red solid line in Fig. 2b). While is expected for materials with perfect electron-hole balance, and the obtained value is also smaller than reported for WTe2,[34] it is similar to those found for some monopnictides, which were reported as trivial semimetals fairly close to charge compensation.[37, 26, 40]
Quantum oscillations
In order to characterize the Fermi surface in PtTe2, we investigated quantum oscillations in (Shubnikov – de Haas effect) at a few different temperatures. Fig. 3a shows the oscillatory part of the electrical resistivity, , obtained by subtraction of the second-order polynomial from the experimental data, plotted as a function of reciprocal magnetic field, . As can be inferred from this figure, the SdH oscillations remain discernible at temperatures up to at least K, however, their amplitudes systematically decrease with increasing temperature. Fast Fourier transform (FFT) analysis, the results of which are presented in Fig. 3b, disclose four features at the oscillations frequencies ( represents the Fermi surface pocket label). The most prominent peak occurs at T, and the corresponding Fermi surface pocket will be labeled thereinafter as . The next feature occurs at T and it is the second harmonic frequency of . Then, the peak with its maximum at T can be attributed to another Fermi surface pocket, labeled in what follows. Eventually, the very weak maximum centered at T likely arises as the third harmonics of . It is worthwhile noting that the FFT spectrum of PtTe2 is very similar to that reported for PdTe2 in Ref.[23] but differs from the FFT data shown for the same compound in Ref.[24] Using the Onsager relation , where stands for the area of Fermi surface cross-section, one finds for the two pockets in PtTe2 the values and . Assuming circular cross-sections, the corresponding Fermi wave vectors are and . Then, if we assume that both Fermi surface pockets are spherical, which is poor approximation, the carrier densities in these two pockets would be equal to cm-3 and cm-3.
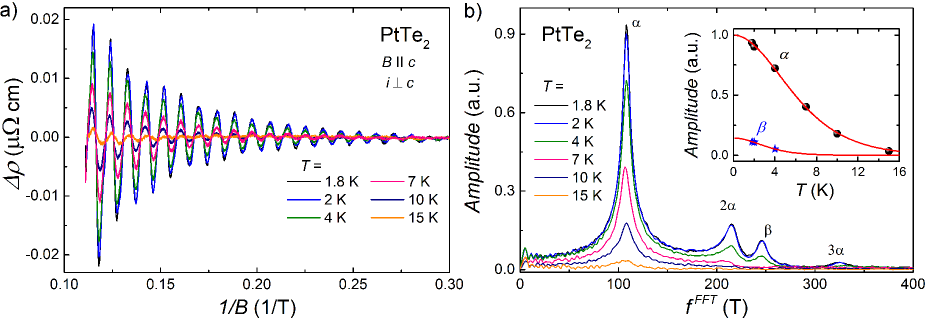
The electronic structure calculated for PtTe2[3, 18] comprises three bands crossing the Fermi level, one hole-like band, located at the center of the Brillouin zone, and two electron-like bands. The fact that we observed experimentally only two principle frequencies is probably due to very small size of the third Fermi surface pocket or might arise owing to somewhat lower position of the Fermi level in the single crystal studied. From the comparison of the values of obtained from the FFT analysis and sizes of the calculated electronic bands,[3] one may presume that the Fermi surface pocket corresponds to one of the electron-like bands and the Fermi surface pocket represents the hole-like band.
The inset to Fig. 3b displays the temperature variations of the FFT amplitudes, , corresponding to the and Fermi surface pockets in PtTe2. The gradual damping of both oscillations with rising temperature can be described by formula:[46]
| (2) |
where is the effective cyclotron mass of charge carriers, T was calculated as ( T and T are the borders of the magnetic field window in which the FFT analysis was performed), and T/K was obtained from the relationship ( stands for the free electron mass, and is the Boltzmann constant). The fitting shown in the inset to Fig. 3b yielded and . It is worth noting that the effective mass determined for the Fermi surface pocket in PtTe2 is almost equal to that reported for the Pd-bearing counterpart.[23]
In the next step, we attempted to determine the phase shift, , in the SdH oscillations, which is directly related to the Berry phase, , of the carries involved. There are known a few methods of extracting , and the proper interpretation of their values remains debatable.[47, 48, 49, 50] The most reliable approach is direct fitting to the experimental data of the Lifshitz-Kosevich (LK) function:[46]
| (3) |
where is the harmonic number, is the oscillation frequency, and stands for the Dingle temperature. In Fig. 4a, there is shown the result of fitting the LK function to the oscillating resistivity of PtTe2 observed at K (note the red solid line). As discussed above, at this temperature, the FFT spectrum comprises three peaks, and thus the sum in Eq. 3 consists of as many as three contributions. In order to reduce the total number of free parameters in this equation, the effective masses were fixed at the values obtained from Eq. 2 (see above). With this simplification, one obtained the parameters: = 108.1 T, K and for the band, and = 246 T, K and for the band. Remarkably, the so-obtained values of are almost identical to those derived from the afore-described FFT analysis, hence confirming the internal consistency of the approach applied. Using the Dingle temperatures, the quantum relaxation time, , could be calculated from the relation to be equal to s and s for the and bands, respectively. Then, the quantum mobility of charge carriers, , were estimated from the relationship to be and for the and bands, respectively.
The phase shift in Eq. 3 is generally a sum , where represents the dimension-dependent correction to the phase shift.[49] In two-dimensional (2D) case, this parameter amounts zero, while in three-dimensional (3D) case is equal to , and its sign depends on type of charge carriers and kind of cross-section extremum. Supposing that the SdH oscillations in PtTe2 originate from 3D bands with carriers moving on their maximal orbits, one can set for electrons and for holes. With this assumption, the Berry phases and were obtained for the and bands, respectively.
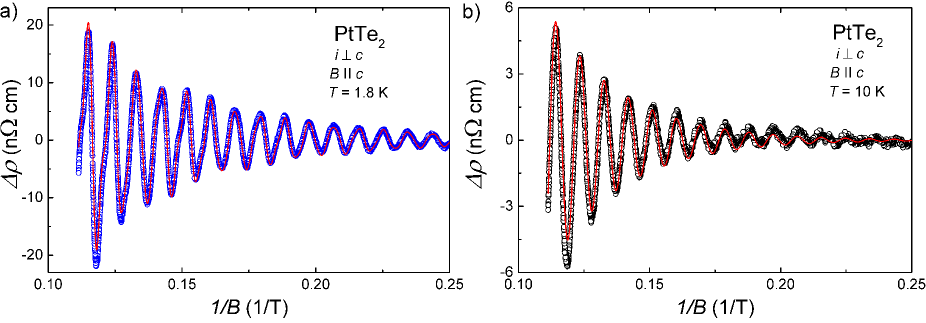
To check the reliability of the LK analysis performed, Eq. 3 was also used to describe the experimental data measured at K. At this temperature, just one peak in the FFT spectrum is discernible (see Fig. 3b), which corresponds to the Fermi surface pocket. The result of fitting the LK formula is presented in Fig. 4b (note the red solid line), and the so-derived values of the parameters are: = 108.1 T, K and . Notably, the agreement between the values obtained at K and K is perfect. The value of implies . Clearly, with increasing temperature, the Dingle temperature increases and consequently the quantum charge carriers mobility becomes smaller, which is probably due to increasing the scattering rate. In turn, the Berry phase of the band was found almost independent of temperature. All the parameters obtained from the LK approach to the magnetotransport in PtTe2 are gathered in Table 1.
| band | ||||||||
|---|---|---|---|---|---|---|---|---|
| (K) | (T) | (T) | () | (K) | (s) | () | ||
| 1.8 | 108 | 108.1 | 0.11 | 9.1 | 2138 | |||
| 246 | 246 | 0.21 | 5 | 2038 | ||||
| 10 | 108 | 108.5 | 0.11 | 12.6 | 1544 |
Another commonly applied technique for Berry phase derivation is using Landau level (LL) fan diagrams. Though in case of multi-frequency oscillations this method is obstructed by possible superposition of the quantum oscillation peaks that hinders precise determination of the Landau level index for a given frequency,[51] we made an attempt to construct the LL fan diagram for the Fermi pocket in PtTe2. As it is apparent from Fig. 3b, the FFT maximum occurring at T is fairly well separated from the other FFT peaks, and hence one could filter this oscillation with reasonably high accuracy. For PtTe2 one finds ( is the Hall resistivity discussed in the next section), and therefore the maxima in the oscillatory resistivity measured at K (see Fig. 4a) were numbered by integers, , and the minima by half-integers, . The result of this approach is shown in the main panel of Fig. 5. A linear fit of the LL indices (note the solid line) gives an intercept of 0.62, which corresponds to the Berry phase . In turn, the slope of this straight line defines the oscillation frequency T.
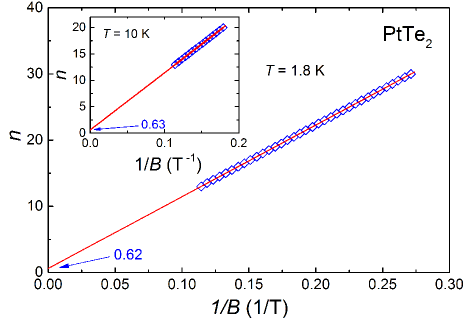
At K, the electrical resistivity of PtTe2 oscillates in the transverse magnetic field with only one frequency (cf. Fig. 3b), so building the LL fan diagram is straightforward. As can be inferred from the inset to Fig. 5, the LL indices plot yields the intercept 0.63, which is almost the same as that obtained at the lower temperature. Also, the slope of the straight line ( T) is identical with that determined at 1.8 K, and furthermore it is very close to the FFT value (see Table 1). Most importantly, all the parameters extracted from the LL indices plots are in perfect agreement with the quantities obtained for the Fermi pocket from the LK analysis, which unambiguously corroborates the correctness of both techniques applied for PtTe2.
Hall effect
The results of Hall resistivity measurements, performed on single-crystalline PtTe2 with electric current flowing within the basal plane of the hexagonal unit cell and magnetic field applied along the axis, are shown in Fig. 6a. At 2 K, behaves in a rather complex manner. In weak magnetic fields, it is negative and exhibits a shallow minimum. Near 2 T, the Hall resistivity changes sign to positive, and then its magnitude increases with increasing . The isotherm measured at 25 K shows a fairly similar field variation, yet the positive contribution in strong fields remains too small to cause sign reversal. At higher temperatures, one observes a gradual straightening of the with rising . The overall behavior of the Hall effect in PtTe2 confirms the multi-band character of the electrical transport in this material. It is worth recalling that very similar Hall response was observed for the closely related compound PdTe2.[24]
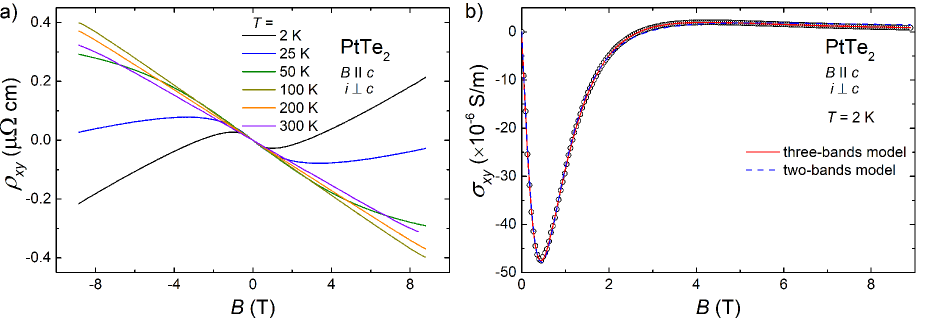
For quantitative analysis of the experimental data, first a two-bands Drude model was applied. For this purpose, measured at K was converted to the Hall conductivity , as displayed in Figure 6b. Next, was fitted by the formula:
| (4) |
where and , and stand for the carrier concentrations and the carrier mobilities of electron- and hole-like bands, respectively. As can be inferred from Fig. 6b, the so-obtained approximation of the measured data (note the blue dashed line) is not ideal. An obvious reason for the discrepancy between the experiment and the two-band model could be contribution from another band, the presence of which was revealed in the ab-initio calculations of the electronic structure of PtTe2.[18, 3]
Therefore, in the next step, the Hall conductivity was analysed in terms of a three-bands model:
| (5) |
where and account for the carrier concentration and the carrier mobility, respectively, of another electron-like band in PtBi2. The result of fitting Eq. 5 to the experimental data is shown as red solid line in Fig. 6b. Clearly, the obtained description is much better than that with the two-bands model.
| Model | ||||||
|---|---|---|---|---|---|---|
| (cm-3) | () | (cm-3) | () | (cm-3) | () | |
| two-bands | 7179 | 17373 | - | - | ||
| three-bands | 4740 | 19240 | 2564 |
The fitting parameters derived in the two approaches are listed in Table 2. Both models yielded large carriers concentrations of the order of . It is worth noting that very similar charge densities were found in the Dirac semimetal PtBi2.[52] On the contrary, for the type-II Weyl semimetal WTe2 the carrier concentrations were reported to be up to two orders of magnitude larger than those in PtTe2.[53] As regards the level of carrier compensation, the two-bands model yielded considerable charge imbalance given by the ratio , however the three-bands model led to fairly balanced scenario . Recently, similar degree of electron-hole compensation was established, e.g., in semimetallic monobismuthides YBi and LuBi.[27] The mobilities of charge carriers in PtTe2 were found very high, especially that obtained for one of the electron-like Fermi surface pockets (). Though the latter value is not such large as the carriers mobilities in Cd3As2 (Ref.[54]) or NbP (Ref.[28]), it exceeds the values reported for type-II Weyl semimetals MoTe2,[42] WTe2,[55] and WP2.[53] It is worth noting that the carriers mobility derived from the Hall effect data are larger than the quantum mobilities determined in the analyses of the SdH oscillations. Similar finding was reported for other TSs, like Cd3As2,[54] ZrSiS,[56] WP2,[43] and PtBi2.[52] The discrepancy likely arises due to the fact that the quantum mobility is affected by all possible scattering processes, whereas the Hall mobility is sensitive to small-angle scattering only.[46]
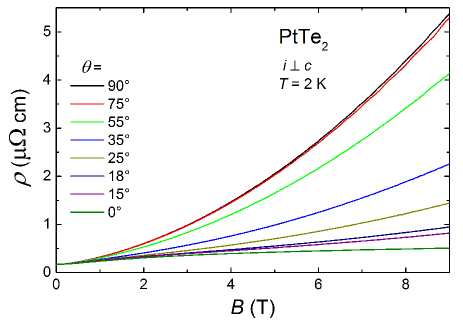
Angle-dependent magnetoresistance
In order to check whether PtTe2 demonstrates CMA, angle-dependent magnetotransport measurements were performed at = 2 K. In these experiments, electric current was always flowing within the hexagonal plane, while the angle between current and magnetic field direction was varied from () to (). As can be inferred from Fig. 7, the electrical resistivity rapidly decreases on deviating from the transverse configuration, and eventually for the longitudinal geometry measured in = 9 T is about an order of magnitude smaller than that for .
Clearly, the longitudinal MR experiments did not provide any evidence for CMA in PtTe2. A possible source for that may be large contribution of non-Dirac states to the measured resistivity. At odds with the Drude theory, which predicts zero MR for ,[57] in several materials sizeable positive longitudinal MR was observed. Among the theories which interpret this phenomenon,[58, 59, 60, 61] that accounting for Fermi surface anisotropy[61] seems appropriate for PtTe2. Within the latter approach, positive longitudinal MR up to can be expected for strongly anisotropic systems. In consequence, CMA would be discernible only if its negative contribution to the longitudinal MR is larger than the positive term due to trivial electronic bands.
Conclusions
Our comprehensive investigations of the galvanomagnetic properties of the alleged type-II Dirac semimetal PtTe2, performed on high-quality single crystals, have not provided any definitive proof of the the presence of Dirac states in this material. The conclusion was hampered by the existence of trivial bands at the Fermi level, which significantly contribute to the electrical transport. In particular, CMA effect was not resolved, and transverse MR was found to obey the Kohler’s scaling. From the analysis of the Hall effect and the SdH oscillations, very high mobilities of charge carriers with small effective masses were extracted. However, the derived Berry phases, different from the value of expected for Dirac fermions, indicate that the SdH effect is governed predominantly by trivial electronic states. This finding is in concert with the electronic band structure calculations, which showed that the Dirac point in PtTe2 is located below the Fermi level.[3] Further investigations performed on suitably doped or pressurized material might result in observation of clear contribution of Dirac states to its transport properties, caused by appropriate tuning the chemical potential. Based on the hitherto obtained results, PtTe2 can be classified as a semimetal with moderate degree of the charge carriers compensation.
Methods
Single crystals of PtTe2 were grown by flux method. High-purity constituents (Pt 5N, Te 6N), taken in atomic ratio 1:20, were placed in an alumina crucible covered by molybdenum foil strainer and capped with another inverted alumina crucible. This set was sealed inside a quartz tube under partial Ar gas atmosphere. The ampoule tube was heated up to 1150∘C, held at this temperature for 24 hours, then quickly cooled down to 850∘C at a rate of 50∘C/h, kept at this temperature for 360 hours, followed by slow cooling down to 550∘C at a rate of 5∘C/h. Subsequently, the tube was quenched in cold water. Upon flux removal by centrifugation, multitude of single crystals with typical dimensions mm3 were isolated. Their had metallic luster and were found stable against air and moisture.
Chemical composition of the single crystals obtained was checked by energy-dispersive X-ray analysis using a FEI scanning electron microscope equipped with an EDAX Genesis XM4 spectrometer. The average elemental ratio Pt : Te = 35.2(5) : 64.8(3) was derived, in accord with the expected stoichiometry. The crystal structure of the single crystals was examined by X-ray diffraction on a KUMA Diffraction KM-4 four-circle diffractometer equipped with a CCD camera, using graphite-monochromatized Cu-K radiation. The hexagonal CdI2-type crystal structure (space group , Wyckoff No. 164) reported in Ref.[62] was confirmed, with the lattice parameters very close to the literature values.
Crystallinity and orientation of the crystal used in the electrical transport studies was checked by Laue backscattering technique employing a Proto LAUE-COS system. Due to the layered crystal structure of PtTe2 it was possible to obtain very thin samples by scotch-tape technique with their surface corresponding to the plane of the hexagonal unit cell of the compound. Rectangular-shaped specimen with dimensions mm3 was cut from the cleaved single crystal using a scalpel. Electrical contacts were made from m thick silver wires attached to the sample using silver epoxy paste. Electrical transport measurements were carried out within the temperature range K and in magnetic field up to 9 T using a conventional four-point ac technique implemented in a Quantum Design PPMS platform.
References
- [1] Hasan, M. Z., Xu, S.-Y., Belopolski, I. & Huang, S.-M. Discovery of Weyl fermion semimetals and topological Fermi arc states. \JournalTitleAnn. Rev. Cond. Mat. Phys. 8, 289–309 (2017).
- [2] Armitage, N. P., Mele, E. J. & Vishwanath, A. Weyl and Dirac semimetals in three dimensional solids. \JournalTitleRev. Mod. Phys. 90, 015001 (2017).
- [3] Yan, M. et al. Lorentz-violating type-II Dirac fermions in transition metal dichalcogenide PtTe2. \JournalTitleNat. Commun. 8, 257 (2017).
- [4] Soluyanov, A. A. et al. Type-II Weyl semimetals. \JournalTitleNature 527, 495–498 (2015).
- [5] Yang, B.-J. & Nagaosa, N. Classification of stable three-dimensional Dirac semimetals with nontrivial topology. \JournalTitleNat. Commun. 5, 4898 (2014).
- [6] Nielsen, H. B. & Ninomiya, M. The Adler-Bell-Jackiw anomaly and Weyl fermions in a crystal. \JournalTitlePhys. Lett. B 130, 389–396 (1983).
- [7] Li, C. Z. et al. Giant negative magnetoresistance induced by the chiral anomaly in individual Cd3As2 nanowires. \JournalTitleNature Communications 6, 10137 (2015).
- [8] Li, Q. et al. Chiral magnetic effect in ZrTe5. \JournalTitleNature Physics 12, 550 (2016).
- [9] Hirschberger, M. et al. The chiral anomaly and thermopower of Weyl fermions in the half-Heusler GdPtBi. \JournalTitleNature Materials 15, 1161 (2016).
- [10] Niemann, A. C. et al. Chiral magnetoresistance in the Weyl semimetal NbP. \JournalTitleSci. Rep. 7, 43394 (2017).
- [11] Xiong, J. et al. Evidence for the chiral anomaly in the Dirac semimetal Na3Bi. \JournalTitleScience 350, 413 (2015).
- [12] Lv, Y.-Y. et al. Experimental observation of anisotropic Adler-Bell-Jackiw anomaly in type-II Weyl semimetal WTe1.98 crystals at the quasiclassical regime. \JournalTitlePhysical Review Letters 118, 096603 (2017).
- [13] Wang, L.-X., Li, C.-Z., Yu, D.-P. & Liao, Z.-M. Aharonov–Bohm oscillations in Dirac semimetal Cd3As2 nanowires. \JournalTitleNature Communications 7, 10769 (2016).
- [14] Deng, K. et al. Experimental observation of topological Fermi arcs in type-II Weyl semimetal MoTe2. \JournalTitleNat. Phys. 12, 1105–1110 (2016).
- [15] Li, P. et al. Evidence for topological type-II Weyl semimetal WTe2. \JournalTitleNature Communications 8, 2150 (2017).
- [16] Lv, B. Q. et al. Experimental discovery of weyl semimetal TaAs. \JournalTitlePhysical Review X 5, 031013 (2015).
- [17] Chang, T.-R. et al. Type-II symmetry-protected topological Dirac semimetals. \JournalTitlePhys. Rev. Lett. 119, 026404 (2017).
- [18] Zhang, K. et al. Experimental evidence for type-II Dirac semimetal in PtSe2. \JournalTitlePhys. Rev. B 96, 125102 (2017).
- [19] Autès, G., Gresch, D., Troyer, M., Soluyanov, A. A. & Yazyev, O. V. Robust type-II Weyl semimetal phase in transition metal diphosphides P2 (=Mo, W). \JournalTitlePhys. Rev. Lett. 117, 066402 (2016).
- [20] Huang, H., Zhou, S. & Duan, W. Type-II Dirac fermions in the PtSe2 class of transition metal dichalcogenides. \JournalTitlePhys. Rev. B 94, 121117 (2016).
- [21] Bruno, F. Y. et al. Observation of large topologically trivial Fermi arcs in the candidate type-II Weyl semimetal WTe2. \JournalTitlePhys. Rev. B 94, 121112 (2016).
- [22] Noh, H.-J. et al. Experimental realization of type-II Dirac fermions in a PdTe2 Superconductor. \JournalTitlePhys. Rev. Lett. 119, 016401 (2017).
- [23] Wang, Y. et al. De Hass-van Alphen and magnetoresistance reveal predominantly single-band transport behavior in PdTe2. \JournalTitleSci. Rep. 6, 31554 (2016).
- [24] Fei, F. et al. Nontrivial Berry phase and type-II Dirac transport in the layered material PdTe2. \JournalTitlePhys. Rev. B 96, 041201 (2017).
- [25] Sun, S., Wang, Q., Guo, P.-J., Liu, K. & Lei, H. Large magnetoresistance in LaBi: Origin of field-induced resistivity upturn and plateau in compensated semimetals. \JournalTitleNew J. Phys. 18, 082002 (2016).
- [26] Pavlosiuk, O., Kleinert, M., Swatek, P., Kaczorowski, D. & Wiśniewski, P. Fermi surface topology and magnetotransport in semimetallic LuSb. \JournalTitleSci. Rep. 7, 12822 (2017).
- [27] Pavlosiuk, O., Swatek, P., Kaczorowski, D. & Wiśniewski, P. Magnetoresistance in LuBi and YBi semimetals due to nearly perfect carrier compensation. \JournalTitlePhysical Review B 97, 235132 (2018).
- [28] Shekhar, C. et al. Extremely large magnetoresistance and ultrahigh mobility in the topological Weyl semimetal candidate NbP. \JournalTitleNat. Phys. 11, 645 (2015).
- [29] Li, Y. et al. Resistivity plateau and negative magnetoresistance in the topological semimetal TaSb2. \JournalTitlePhys. Rev. B 94, 121115 (2016).
- [30] Singha, R., Pariari, A. K., Satpati, B. & Mandal, P. Large nonsaturating magnetoresistance and signature of nondegenerate Dirac nodes in ZrSiS. \JournalTitleProc. Natl. Acad. Sci. 114, 2468 (2017).
- [31] Hosen, M. M. et al. Tunability of the topological nodal-line semimetal phase in ZrSi-type materials (=S, Se, Te). \JournalTitlePhys. Rev. B 95, 161101 (2017).
- [32] Zhao, Y. et al. Anisotropic magnetotransport and exotic longitudinal linear magnetoresistance in WTe2 crystals. \JournalTitlePhys. Rev. B 92, 041104 (2015).
- [33] Du, X., Tsai, S.-W., Maslov, D. L. & Hebard, A. F. Metal-insulator-like behavior in semimetallic bismuth and graphite. \JournalTitlePhys. Rev. Lett. 94, 166601 (2005).
- [34] Wang, Y. L. et al. Origin of the turn-on temperature behavior in WTe2. \JournalTitlePhys. Rev. B 92, 180402 (2015).
- [35] Zeng, L.-K. et al. Compensated semimetal LaSb with unsaturated magnetoresistance. \JournalTitlePhys. Rev. Lett. 117, 127204 (2016).
- [36] Niu, X. H. et al. Presence of exotic electronic surface states in LaBi and LaSb. \JournalTitlePhys. Rev. B 94, 165163 (2016).
- [37] Pavlosiuk, O., Swatek, P. & Wiśniewski, P. Giant magnetoresistance, three-dimensional Fermi surface and origin of resistivity plateau in YSb semimetal. \JournalTitleSci. Rep. 6, 38691 (2016).
- [38] Kumar, N. et al. Observation of pseudo-two-dimensional electron transport in the rock salt-type topological semimetal LaBi. \JournalTitlePhys. Rev. B 93, 241106 (2016).
- [39] Ghimire, N. J., Botana, A. S., Phelan, D., Zheng, H. & Mitchell, J. F. Magnetotransport of single crystalline YSb. \JournalTitleJ. Phys. Condens. Matter 28, 235601 (2016).
- [40] Han, F. et al. Separation of electron and hole dynamics in the semimetal LaSb. \JournalTitlePhys. Rev. B 96, 125112 (2017).
- [41] Xu, J. et al. Origin of the extremely large magnetoresistance in the semimetal YSb. \JournalTitlePhys. Rev. B 96, 075159 (2017).
- [42] Chen, F. C. et al. Extremely large magnetoresistance in the type-II Weyl semimetal MoTe2. \JournalTitlePhys. Rev. B 94, 235154 (2016).
- [43] Kumar, N. et al. Extremely high magnetoresistance and conductivity in the type-II Weyl semimetals WP2 and MoP2. \JournalTitleNat. Commun. 8, 1642 (2017).
- [44] Wang, X. et al. Evidence of both surface and bulk Dirac bands and anisotropic nonsaturating magnetoresistance in ZrSiS. \JournalTitleAdvanced Electronic Materials 2, 1600228 (2016).
- [45] Ziman, J. Principles of the Theory of Solids (Cambridge University Press, 1972).
- [46] Shoenberg, D. Magnetic Oscillations in Metals (Cambridge University Press, 1984).
- [47] Ando, Y. Topological insulator materials. \JournalTitleJ. Phys. Soc. Jpn. 82, 102001 (2013).
- [48] Wang, C. M., Lu, H. Z. & Shen, S. Q. Anomalous phase shift of quantum oscillations in 3D topological semimetals. \JournalTitlePhys. Rev. Lett. 117, 077201 (2016).
- [49] Li, C. et al. Rules for phase shifts of quantum oscillations in topological nodal-line semimetals. \JournalTitlePhys. Rev. Lett. 120, 146602 (2018).
- [50] Taskin, A. A. & Ando, Y. Berry phase of nonideal Dirac fermions in topological insulators. \JournalTitlePhys. Rev. B 84, 035301 (2011).
- [51] Hu, J. et al. Berry phase and Zeeman splitting of Weyl semimetal TaP. \JournalTitleSci. Rep. 6, 18674 (2016).
- [52] Gao, W. et al. Extremely large magnetoresistance in a topological semimetal candidate pyrite PtBi2. \JournalTitlePhys. Rev. Lett. 118, 256601 (2017).
- [53] Wang, A. et al. Large magnetoresistance in the type-II Weyl semimetal WP2. \JournalTitlePhys. Rev. B 96, 121107 (2017).
- [54] Liang, T. et al. Ultrahigh mobility and giant magnetoresistance in the Dirac semimetal Cd3As2. \JournalTitleNat. Mater. 14, 280–284 (2015).
- [55] Luo, Y. et al. Hall effect in the extremely large magnetoresistance semimetal WTe2. \JournalTitleAppl. Phys. Lett. 107, 182411 (2015).
- [56] Hu, J. et al. Nearly massless Dirac fermions and strong Zeeman splitting in the nodal-line semimetal ZrSiS probed by de Haas–van Alphen quantum oscillations. \JournalTitlePhys. Rev. B 96, 045127 (2017).
- [57] Pippard, A. Magnetoresistance in Metals (Cambridge University Press, 2009).
- [58] Miller, D. & Laikhtman, B. Longitudinal magnetoresistance of superlattices caused by barrier inhomogeneity. \JournalTitlePhys. Rev. B 54, 10669 (1996).
- [59] Argyres, P. N. & Adams, E. N. Longitudinal magnetoresistance in the quantum limit. \JournalTitlePhys. Rev. 104, 900 (1956).
- [60] Stroud, D. & Pan, F. P. Effect of isolated inhomogeneities on the galvanomagnetic properties of solids. \JournalTitlePhys. Rev. B 13, 1434 (1976).
- [61] Pal, H. K. & Maslov, D. L. Necessary and sufficient condition for longitudinal magnetoresistance. \JournalTitlePhys. Rev. B 81, 214438 (2010).
- [62] Faruseth, S., Selte, K. & Kjekshus, A. Redetermined crystal structures of NiTe2, PdTe2, PtS2, PtSe2, and PtTe2. \JournalTitleActa Chem. Scand. 19, 257 (1965).
Author contributions statement
D.K. conceived the experiments and performed preliminary electrical transport studies. O.P. conducted the experiments and analysed the data. Both authors contributed to discussion of the results and writing the manuscript.