The DESY II Test Beam Facility 111Paper dedicated to the memory of our colleague Ulrich Kötz
Abstract
DESY Hamburg operates a test beam facility with three independent beam lines at the DESY II synchrotron. It is world-wide one of very few facilities providing test beams in the GeV range. To this end, it offers electron/positron beams with user-selectable momenta from 1-. The available infrastructure for the users is unique, including a high field solenoidal magnet and permanently installed high-precision pixel beam telescopes. This publication gives a detailed description of the facility, the available infrastructure, and the simulated and measured performance.
keywords:
DESY , Test Beam , Infrastructure1 Introduction
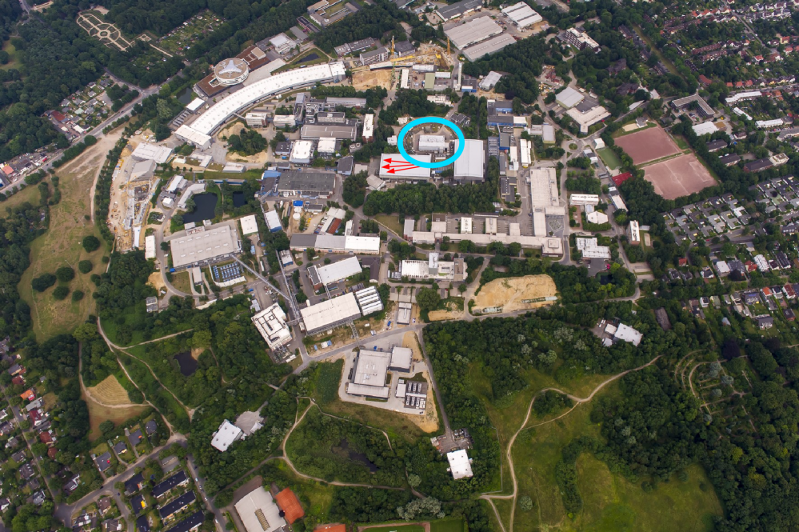
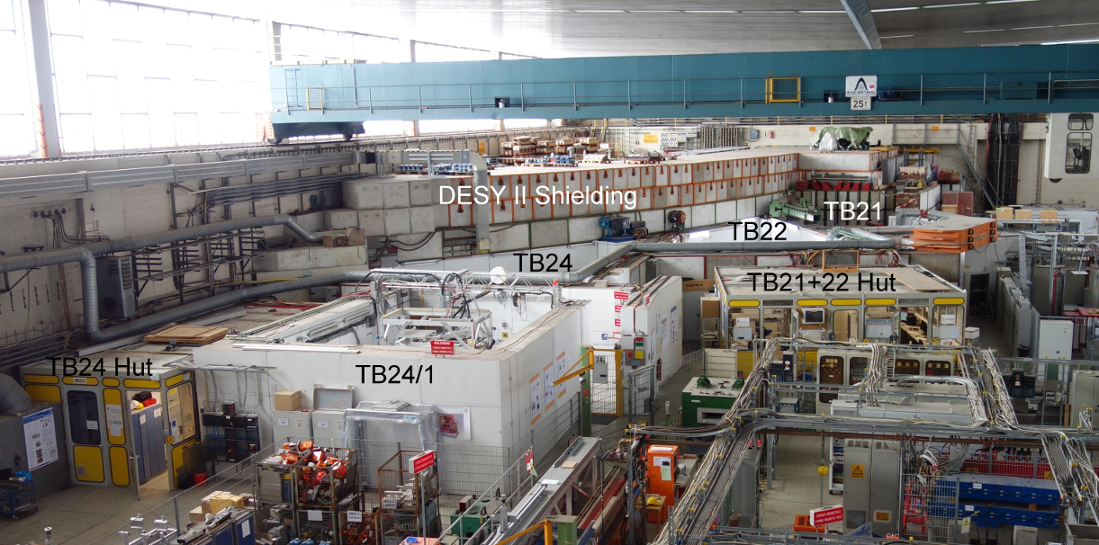
DESY (Deutsches Elektronen-Synchrotron)222http://www.desy.de operates a test beam facility at its campus at Hamburg-Bahrenfeld (Fig. 1). The facility offers three independent beam lines with electron or positron particles with selectable momenta from 1- and is located in building 27 (“Halle 2”), one of the experimental halls at DESY. The beam lines are attached to the DESY II synchrotron, which typically runs electron beams with an oscillating energy from 0.45-. This Test Beam Facility is one of the few worldwide that offers users access to multi-GeV beams. It has essential infrastructure for the development and testing of nuclear and particle physics detectors and generic detector R&D.
After the start-up of the original DESY electron synchrotron in 1964 the developments and studies of new detector components were done by using the primary beam when not used for the recognized experiments. The place behind the pair spectrometer in beam line 24 was a popular location which also provided an energy measurement of the electrons. With the installation of DESY II this possibility ceased to exist and the current facility started serving the test beam needs of the community.
Since its inception and start of operation simultaneously to the start of DESY II in 1987, the usage of the DESY II Test Beam Facility has continuously increased. At the same time, there were continuous investments into this facility and more infrastructure added, including a high-field solenoid and two high-precision pixel beam telescopes. All of these are available to all users of the facility.
The EU has supported both access and enhancements to the DESY II Test Beam Facility within the FP6-EUDET [1], the FP7-AIDA [2] and the Horizon 2020-AIDA2020 [3] grants. The transnational access offers travel support for users from outside Germany thus enabling further groups to use the facility.
This paper is organized as follows: first an overview of the DESY II synchrotron is given (Sec. 2), then the test beam generation (Sec. 3), the beam line instrumentation (Sec. 4), and the individual beam areas (Sec. 5) are explained. All additional test beam infrastructure, like magnets and beam telescopes, is then described in detail (Sec. 6). The performance of the DESY II Test Beam Facility is presented by the results of different measurements (Sec. 7) and is compared to simulations of the test beam (Sec. 8), It is concluded with a report on the user community (Sec. 9) and a summary and an outlook on future improvements (Sec. 10).
2 The DESY II Synchrotron
More than thirty years ago, on the 22nd of March 1985, the first electron beam in DESY II was circulated [4, 5]. After the final connection of all transport lines and magnet circuits, from spring 1987 on, DESY II has delivered electron or positron beams with high stability and reliability up to beam energy to DORIS, PETRA, HERA and the DESY II Test Beam Facility.
DESY II is installed in the DESY tunnel. It is long and has an average radius of (Fig. 2). The tunnel houses the DESY II synchrotron and the DESY III proton synchrotron, which served as an proton injector for HERA and was decommissioned in 2007. As DESY III has been re-using most infrastructure from the original DESY synchrotron including the dipole magnets, DESY II was designed from scratch.
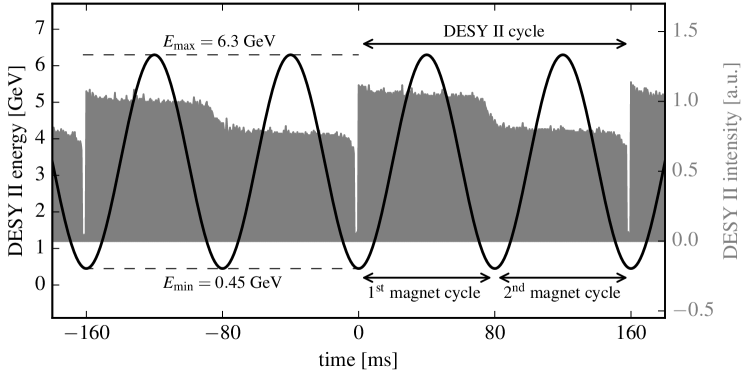
The magnet system of DESY II consists of five circuits: the dipole circuit, two quadrupole, and two sextupole circuits. All of the circuits operate synchronously with a sinusoidally oscillating current with a frequency of which corresponds to a magnet cycle (Fig. 3). 24 horizontal and 24 vertical DC corrector coils allow orbit manipulation at lower beam energies. The optical lattice is formed by 8 3 FODO cells. Two independent HF systems —each consisting of one klystron and four 7-cell PETRA-type cavities— can be operated either individually in single mode or both together for reaching higher beam energies.
The DESY II standard operation without an extraction stores a bunch of electrons for two magnet cycles which defines the DESY II cycle (Fig. 3): One bunch of about 1010 electrons or positrons is injected on-axis at from the linear accelerator LINAC II (LINear ACcelerator) via the small storage ring PIA (Positron Intensity Accumulator) shortly after the time of minimal fields, and is accelerated to typically , with a possible maximum of . The beam is typically stored for two magnet cycles or one DESY II cycle and is dumped about after injection, just before the next injection (Fig. 3). It is important to note, that the beam get accelerated twice to the maximum energy of with one deceleration to in between which causes beam losses for the second magnet cycle (Fig. 3). The life-time at low energies is additionally affected by the number of test beam targets in the primary beam (Sec. 3.1), and other machine effects like the tunes and the HF settings.
Nowadays DESY II is the injector for PETRA III and the the DESY II beam can be completely extracted during the acceleration cycle. When PETRA III runs in standard operation with the constant current or so-called “top-up” mode, DESY II has to deliver beam every few minutes (Fig. 24 in Sec. 7.1.1). When reaching the beam energy of within the first magnet cycle the beam is extracted and DESY II stays empty until the next injection. Further and as a consequence, the DESY II magnet circuits have to run continuously, consuming roughly electrical power. The DESY II HF power of about for the default operation is only switched on if beam has been requested by PETRA III or the DESY II Test Beam Facility.
For the last several years, DESY II has been running in a completely automated operation mode without any manual actions by the operators. Beam requests from all users of PETRA III and the DESY II Test Beam Facility are detected to set all necessary parameters for the requested operation mode. DESY II has an availability of close to during this operation.
3 Test Beam Generation
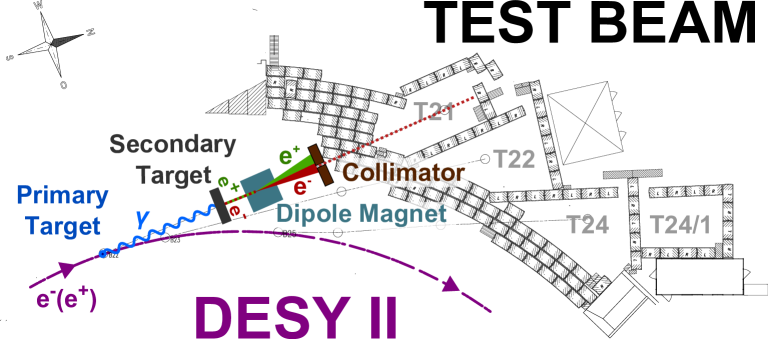
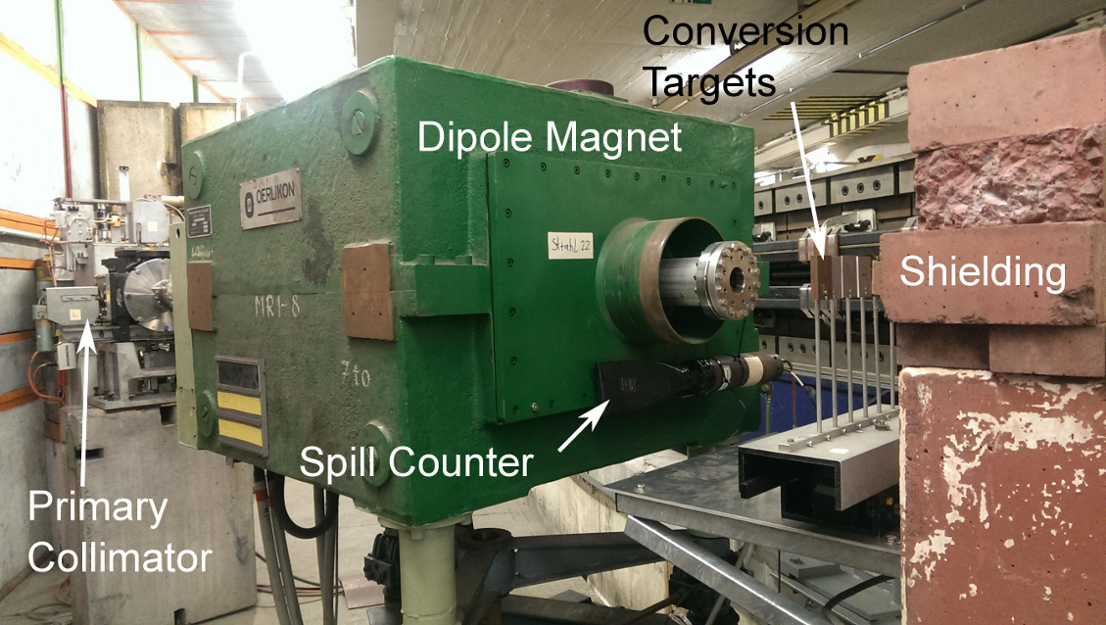
At the DESY II Test Beam Facility, the test beams are generated by a double conversion instead of using a direct extraction of the primary beam in DESY II. Initially bremsstrahlung photons are generated by a fiber target positioned in the DESY II beam orbit. These photons hit the secondary target generating electron/positron pairs. Depending on the polarity and strength of the magnetic field of the following dipole magnet, the test beam particles reaching the test beam areas are electrons or positrons with a certain momentum. There are three independent beam lines, called TB21, TB22 and TB24, named after the positions of the primary targets located behind the quadrupoles QF21, QF22 and QF24 respectively. A schematic view of the beam generation and the three beam lines is shown in Figure 4.
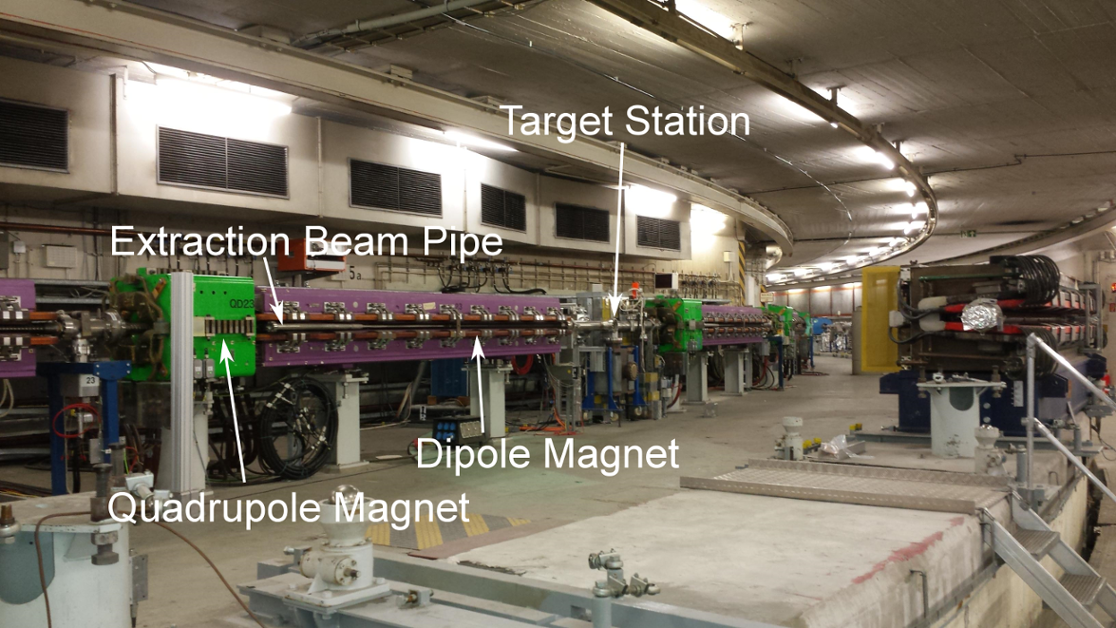
Before describing all individual elements of one beam line in detail, an overview of the beam generation is given. The primary target is a several thick fiber (Sec. 3.1) which can be positioned at the main DESY II orbit in order to produce the highest rate of bremsstrahlung photons. Since the fiber is fixed on the orbit it intercepts the beam over the full DESY II magnet cycle (Sec. 2): photons are generated by electrons from the injection energy of up to full energy of (see Fig. 32 in Sec.8). These bremsstrahlung photons travel along an extraction beam pipe tangentially to the DESY II orbit and then leave the DESY II vacuum through a thick aluminum exit window. They travel through the air for up to and then hit the secondary targets (Sec. 3.2), where electrons and positrons are generated through the pair production process. A high vacuum beam line starts right after the secondary target. The electrons and positrons then pass through a dipole magnet (Sec. 3.3), which allows selection of the particle flavor and momentum depending on the polarity and strength of the field. The selected particles then travel in an evacuated beam pipe and can be collimated by the controllable primary collimator (Sec. 3.4). After passing the beam shutter (Sec. 3.5) the test beam particles enter the test beam areas located in Hall 2 (Sec. 5). Inside the beam areas an exchangeable fixed-size secondary collimator is located (Sec. 5.1), along with shielding elements acting as beam dumps (Sec. 5.2).
3.1 Primary Targets
For each beam line a primary target station is installed inside the vacuum pipe. A station consists of up to six carbon fibers. The fibers are each about thick and long and each fiber is glued between the two prongs of a metal fork. Three long forks and three short forks are mounted on a hexagonal target holder, the so-called “revolver” (Fig. 5). The revolver can be rotated to select one of the six fibers. The selected fiber can be horizontally moved in the DESY II beam orbit to generate bremsstrahlung.
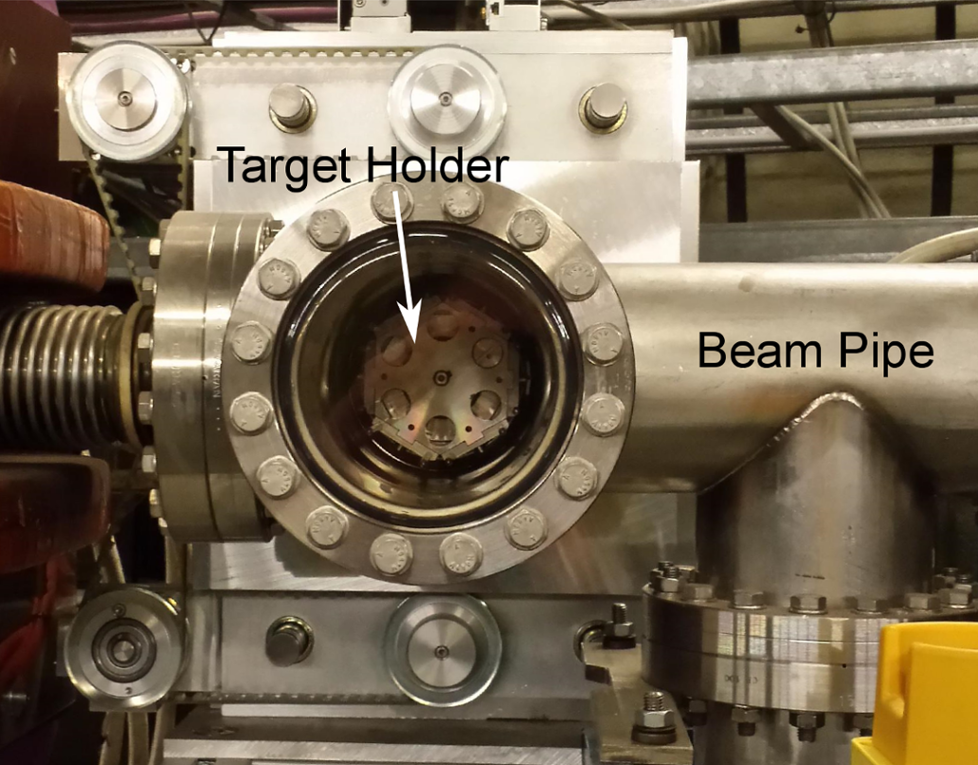
A detailed drawing of an entire target station is shown in Figure 8. The target stations can be remotely controlled via a CAN bus interface. They are fully integrated in the accelerator control software and can be controlled using a simple GUI. The selected fiber usually remains in the DESY II beam orbit, unless there are special beam tests performed or there is maintenance during the shutdown. While the status is visible to the test beam users, the operation of the primary target control is restricted to the shift crews in the DESY accelerator control room (BKR).
3.2 Secondary Targets
The secondary targets are located inside the DESY II tunnel right in front of the test beam dipole magnets. The bremsstrahlung photons hit this target and produce electron-positron pairs as well as a non-negligible neutron background. Each station has up to eight different targets allowing the user to adjust the particle rates and yields to their needs. The available target options for each beam line are listed in Table 1.
| Target No. | TB21 | TB22 | TB24 |
| 1 | Cu | Cu | Cu Wire |
| 2 | Cu | Cu | Cu |
| 3 | Cu | Cu | Cu |
| 4 | Al | Al | Al |
| 5 | Al | Al | Al |
| 6 | Al | Al | Al |
| 7 | Cu Wire | Cu | Cu Wire |
The secondary target stations for each beam line can be remotely controlled by the users from the test beam huts. One of the secondary target stations is shown in Figure 6.
3.3 Test Beam Magnets
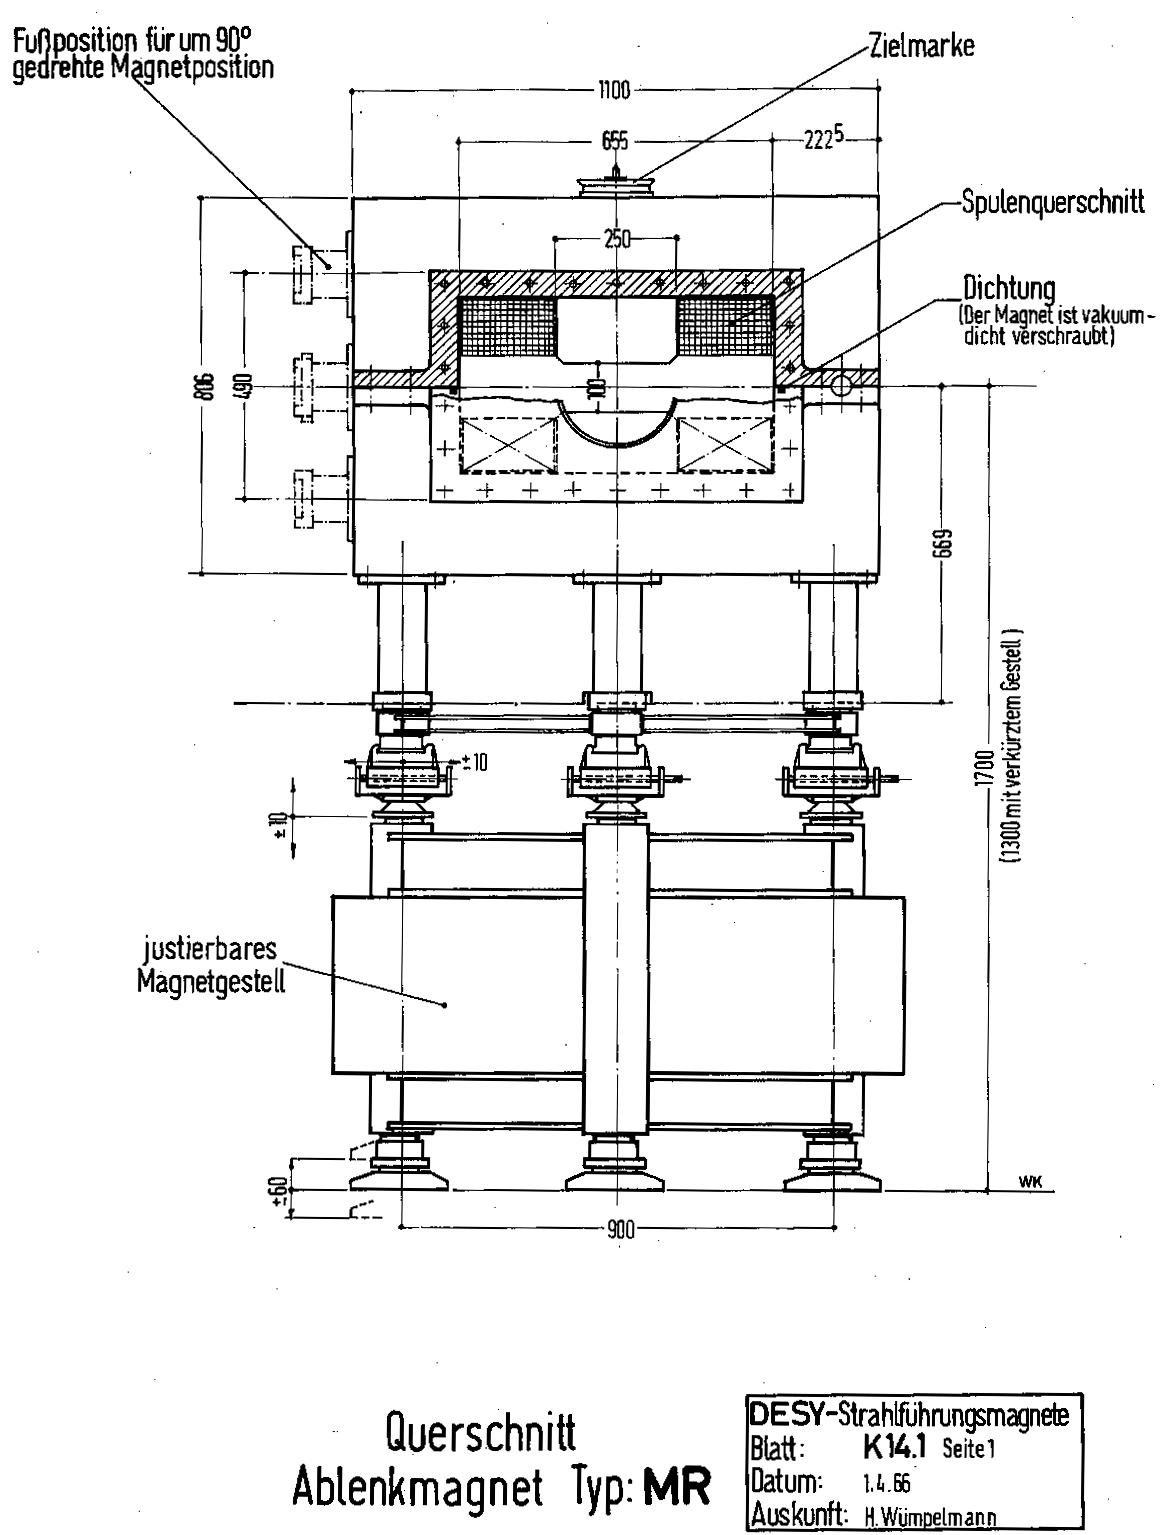
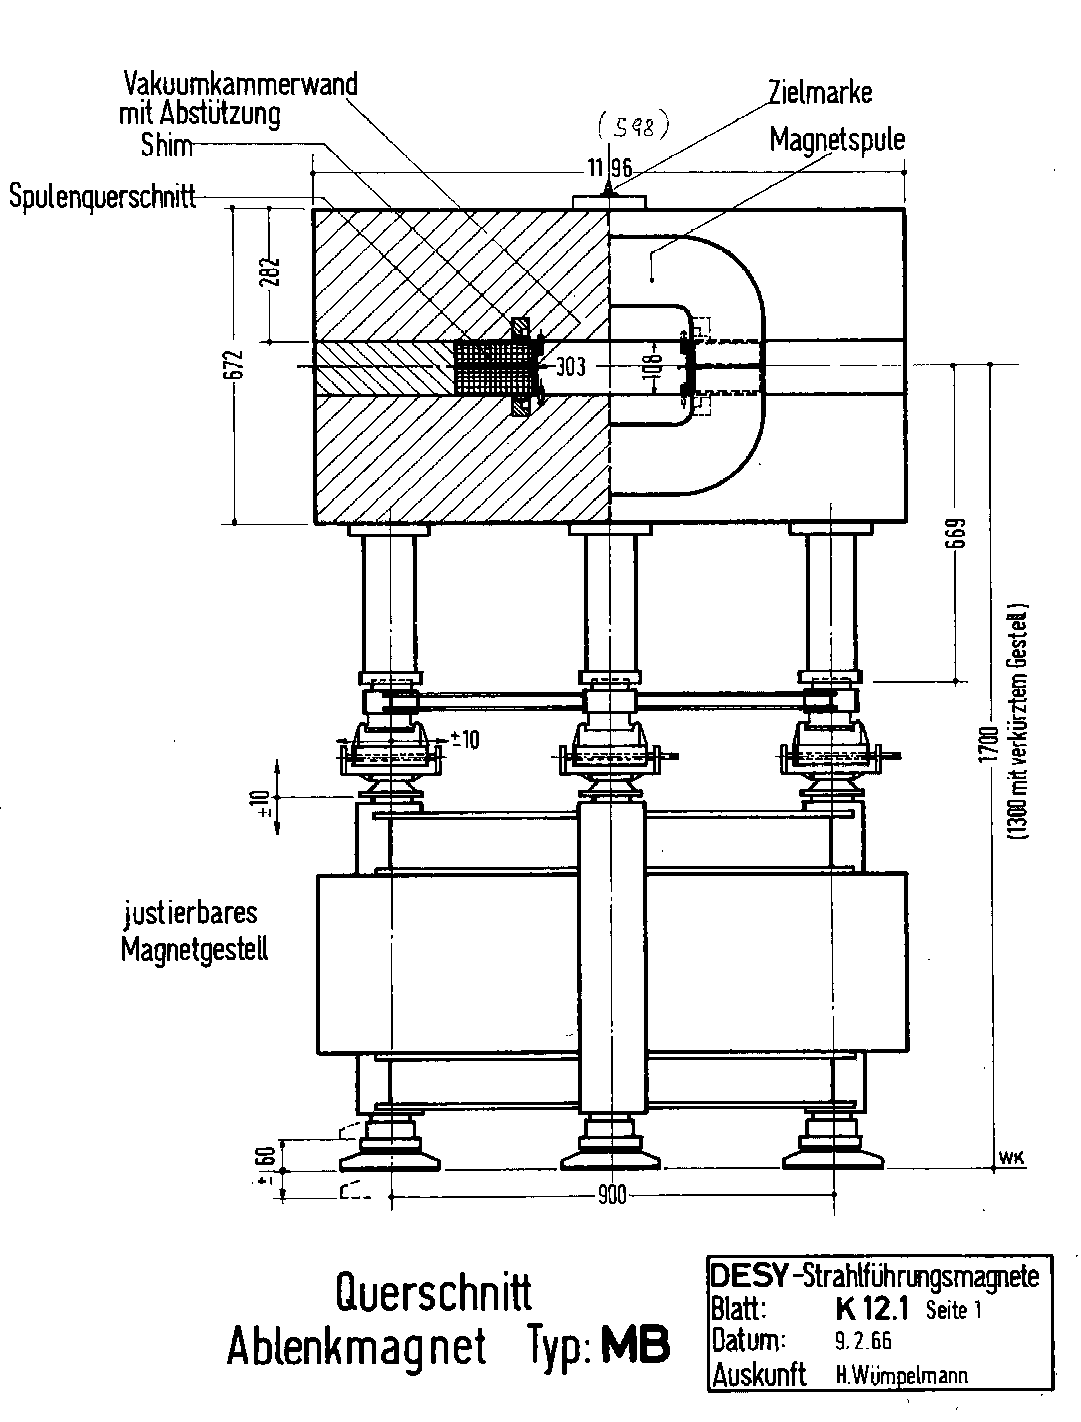
The test beam magnets are dipole magnets (“DESY Typ MR”), located behind the secondary target, and are used to bend particles of the desired momentum and charge. The integrated length of the magnet is and the entry window to the evacuated beam pipe is right in the center of the dipole field, ensuring a very homogeneous magnetic field. The maximum field of the dipole is with a maximum current of .
| MR | MB | |
| Imax (A) | 375 | 1500 |
| B at Imax (T) | 1.38 | 2.24 |
| P at Imax (kW) | 25 | 400 |
| integrated length (mm) | 710 | 1029 |
| Weight (t) | 7 | 7.5 |
| Usable Aperture | ||
| vertical (mm) | 100 | 108 |
| horizontal(mm) | 220 | 303 |
For TB24, there is an additional magnet (“DESY Typ MB”) in front of the test beam dipole magnet, which is required due to geometrical reasons. The particles need to be bent further in order to reach the corresponding beam area. The maximum field of the dipole is with a maximum current of . Table 2 summarizes the key parameters of both magnets. Pictures of a MR magnet and a MB magnet are shown in Figure 6. The technical drawings of these two magnets are shown in Figure 9(a) and 9(b).
The user can remotely control the individual magnets from either huts or the accelerator control room and select the appropriate particle momentum by selecting the corresponding current from the magnet power supplies (Tab. 3).
| Particle Momentum (GeV/c) | TB21/TB22 ER/400 (A) | TB24 ER/400 (A) | TB24 MK1500 (A) |
|---|---|---|---|
| 1.0 | 37.46 | 37.46 | 66.92 |
| 2.0 | 74.92 | 74.92 | 133.84 |
| 3.0 | 112.39 | 112.39 | 200.76 |
| 4.0 | 149.85 | 149.85 | 267.68 |
| 5.0 | 187.31 | 187.31 | 334.60 |
| 6.0 | 224.80 | 224.80 | 401.51 |
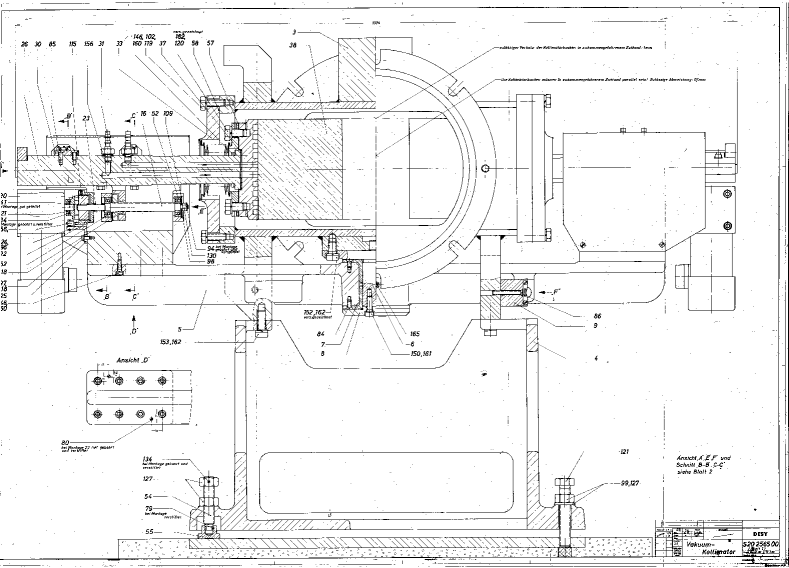
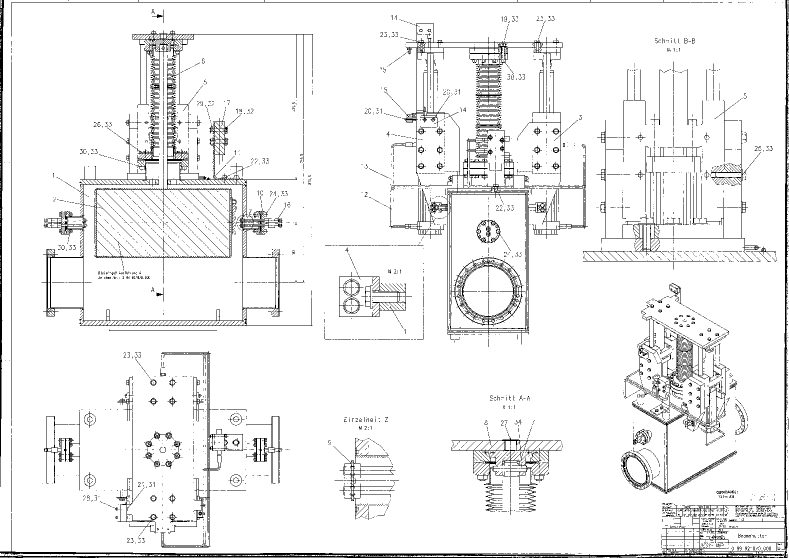
3.4 Primary Collimator
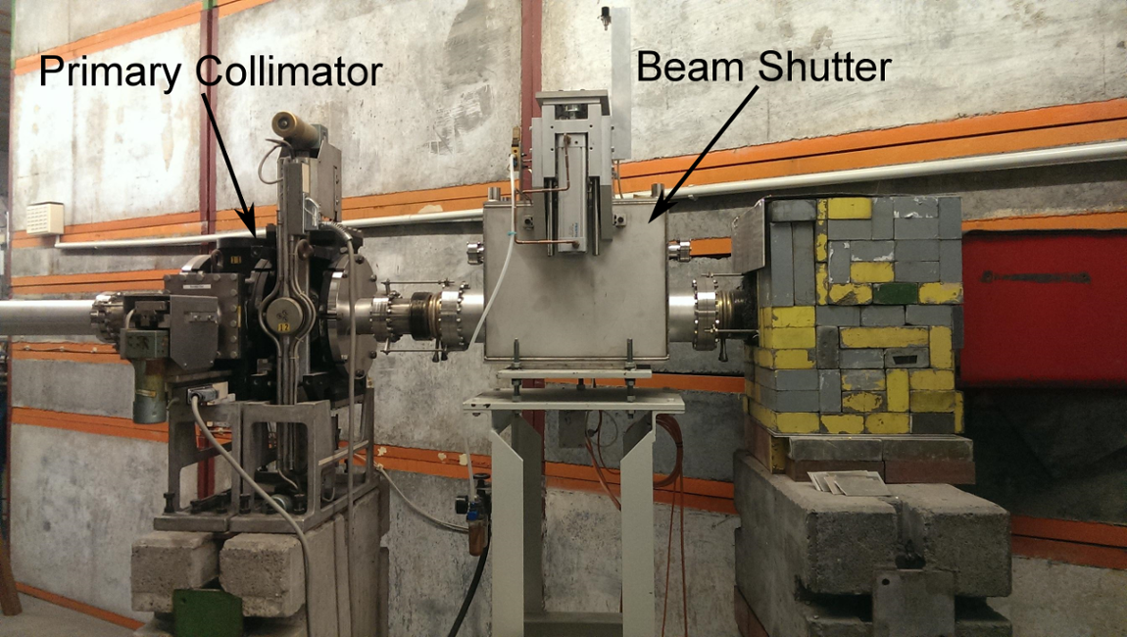
The primary collimator is located behind the momentum defining magnet (Fig. 7). It is a combination of a horizontal and a vertical collimator unit. The main part of each unit is a pair of motorized thick jaws made out of tungsten (Fig. 10). The jaw position can be remotely controlled from the hut. The option to cool the jaws with water is not necessary due to the low beam intensities and therefore not being used.
3.5 Test Beam Shutter
Directly before the opening in the shielding wall of the accelerator a beam shutter is placed in each beam line (Fig. 7) to switch off the beam to the corresponding test beam area and to enable safe access to it. It is controlled by the safety interlock system. Its main part is a long lead block with a diameter of diameter that is moved by compressed air (Fig. 11).

4 Beam Line Instrumentation
Each beam line is equipped with various monitoring systems to indicate the beam rate: so-called spill counters and beam monitors (Sec. 4.1). There is not installed an independent instrumentation to measure the test beam momentum permanently. However different methods were used to periodically cross-check the calibration of the current of the corresponding Test Beam Magnet (see Sec. 3.3) to select a certain test beam momentum (Sec. 4.2).
4.1 Monitoring the Beam Rate
The DESY II Test Beam Facility has currently no option for monitoring the beam generation directly inside the beam pipe. However, at each beam line at least two monitoring systems serve as guidance for beam operators to maximize the individual test beam rates by positioning fibers properly: Spill counters located at the beam line can measure the background photon radiation, beam monitors located in the test beam areas behind the vacuum pipe measure the passage of beam particles.
4.1.1 Spill Counter
Information about the bremsstrahlung beam is determined from background radiation which accompanies the photon beam after production or after the secondary target (see Sec. 3.2). All beam lines have scintillator counters mounted close to the primary photon and secondary electron beam. The background rate associated with the spill from DESY II is measured using these counters. An additional spill counter based on Cherenkov light has been successfully operated directly in the beam at beam line 21. This counter is positioned after the conversion targets. A photomultiplier tube (PMT) in the shadow of heavy concrete shielding detects the Cherenkov light produced by electron positron pairs in a long air radiator.
Since both type of spill counters are located after the targets but before the dipole magnet and the collimators, there is no information on the momentum or on the shutter status. Therefore they indicate that a test beam is produced by the targets, but do not indicate whether it propagates all the way through to the beam area.
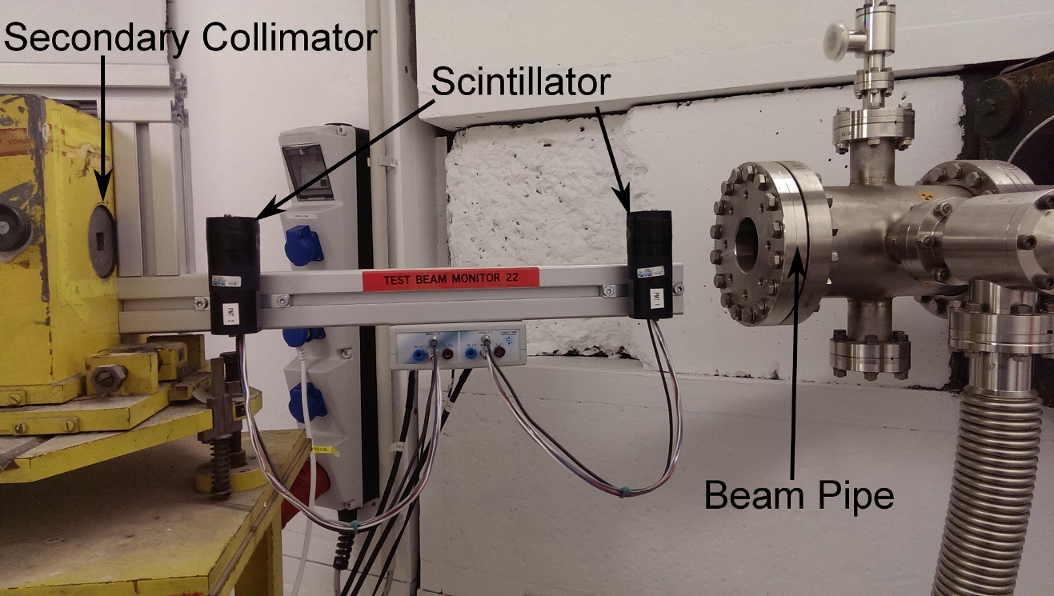
4.1.2 Beam Monitor
A set of two scintillation counters has been installed just in front of the secondary collimator in each experimental test beam area [6]. These counters are large and thick and measure in coincidence the particle rate of the incoming beam right after leaving the evacuated beam pipe (Fig. 12).
4.2 Momentum Calibration
The momentum of the test beam and therefore the current of the corresponding test beam magnet (see Tab. 3 in Sec. 3.3) have occasionally been calibrated using a non-permanent lead glass counter setup. However, the energy resolution of the lead glasses is not sufficient to provide a permanent measurement to determine the momentum of single particles on an event by event basis. In addition, the pixel telescope together with the large MD magnet in TB21 was used as a spectrometer to confirm the momentum calibration by measuring the particle deflection by the magnet and determining the momentum of test beam particles (see Sec. 7.3).
4.3 Integration in the DESY-wide Machine Control System
For DESY II and PETRA III several machine parameters are measured and are recorded, time-stamped and archived using the TINE Accelerator Control and Monitoring system [8]. One important parameter for the DESY II Test Beam Facility which is used for some of the performance measurements (see Sec. 7) is the DESY II beam intensity which is measured by using the DESY II beam monitoring system. The system consists of monitors at three locations along the DESY II beam pipe, which inductively measure the beam current which is converted in numbers of particles. Within in one DESY II cycle (see Fig. 3) the intensity is measured after injection and after reaching .
Important DESY II Test Beam Facility parameters like target positions, beam shutter states, magnet currents and the rates from the beam monitors (Sec. 4.1.2) are also stored in the system. DESY II Test Beam Facility users can run the TINE tools being available in the beam huts to access the archives and extract all relevant machine conditions.
5 Test Beam Areas
There are three user areas available at the DESY II Test Beam Facility corresponding to the three beam lines TB21, TB22 and TB24. The area of TB24 is subdivided into two subsequent areas, TB24 and TB24/1. This is done by using a second shutter system which allows working in TB24/1 while beam is available in TB24. For each area, there is a hut available, which also houses all the user controls for the corresponding beam line and provides network connectivity. A drawing of the areas and the huts is depicted in Figure 4, the corresponding view from the north in Figure 13.
All user areas provide power distribution boxes with both two-phase (CEE 7/7) and three-phase outlets (IEC 60309 3L+N+PE /). Furthermore each area has several sets of patch panels that provide connectivity to the huts, minimizing the amount of cabling which needs to be performed by the user. There are panels for high-voltage using SHV connectors and Coax-RG58 connector for signals. For data transmission there are panels with CAT7 Ethernet and RJ45 connectors providing a local network and panels with both single-mode (OS2) and multi-mode (OM3) fibers and LC connectors.
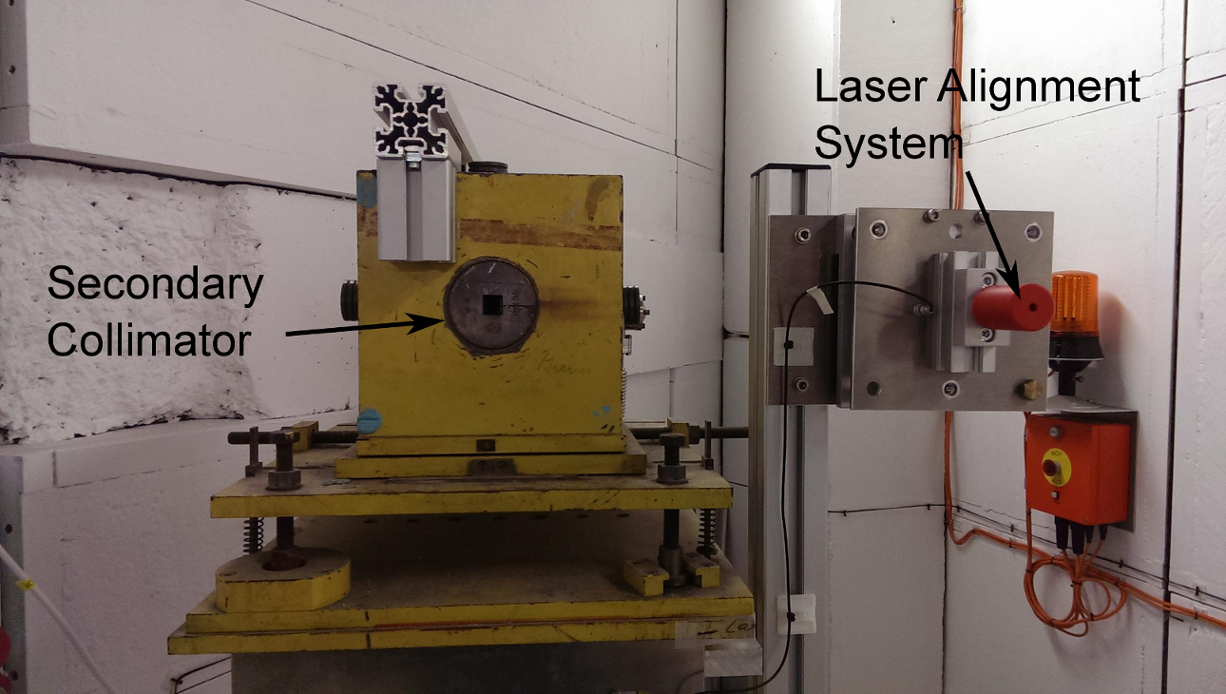
Remote-controllable stages with a capacity of up to can be installed in all areas allowing users to mount their devices. All areas also provide a IP-based CCTV system, cooling water and nitrogen gas. Finally, a laser alignment system is installed in each test beam area using Class 1M line lasers. The system provides the users with a tool to align their devices with the beam axis. Horizontal and vertical alignment are supported and can be individually enabled.
The following sections describe two of the last beam line components which are located in each beam area: the secondary collimator (Sec. 5.1) and the shielding and beam dumps (Sec. 5.2).
5.1 Secondary Collimator
In each beam line, a secondary collimator is installed right after the end of the evacuated beam pipe, which can be used to further collimate the beam (Fig. 14). It uses lead insets with different bore diameters and shapes, which can be manually selected. The beam monitors (see Sec. 4) are installed just after the end of the evacuated beam pipe and before the secondary collimator. Various lead insets with windows sizes ranging from to are available.
5.2 Shielding and Beam Dumps
In all test beam areas, the walls are made out of shielding concrete blocks where the electron beams end. This is sufficient to limit the doses outside the areas below which corresponds to the legal limit for persons not occupationally exposed to radiation. To reduce the dose even further, additional beam dumps have been installed in front of the walls.
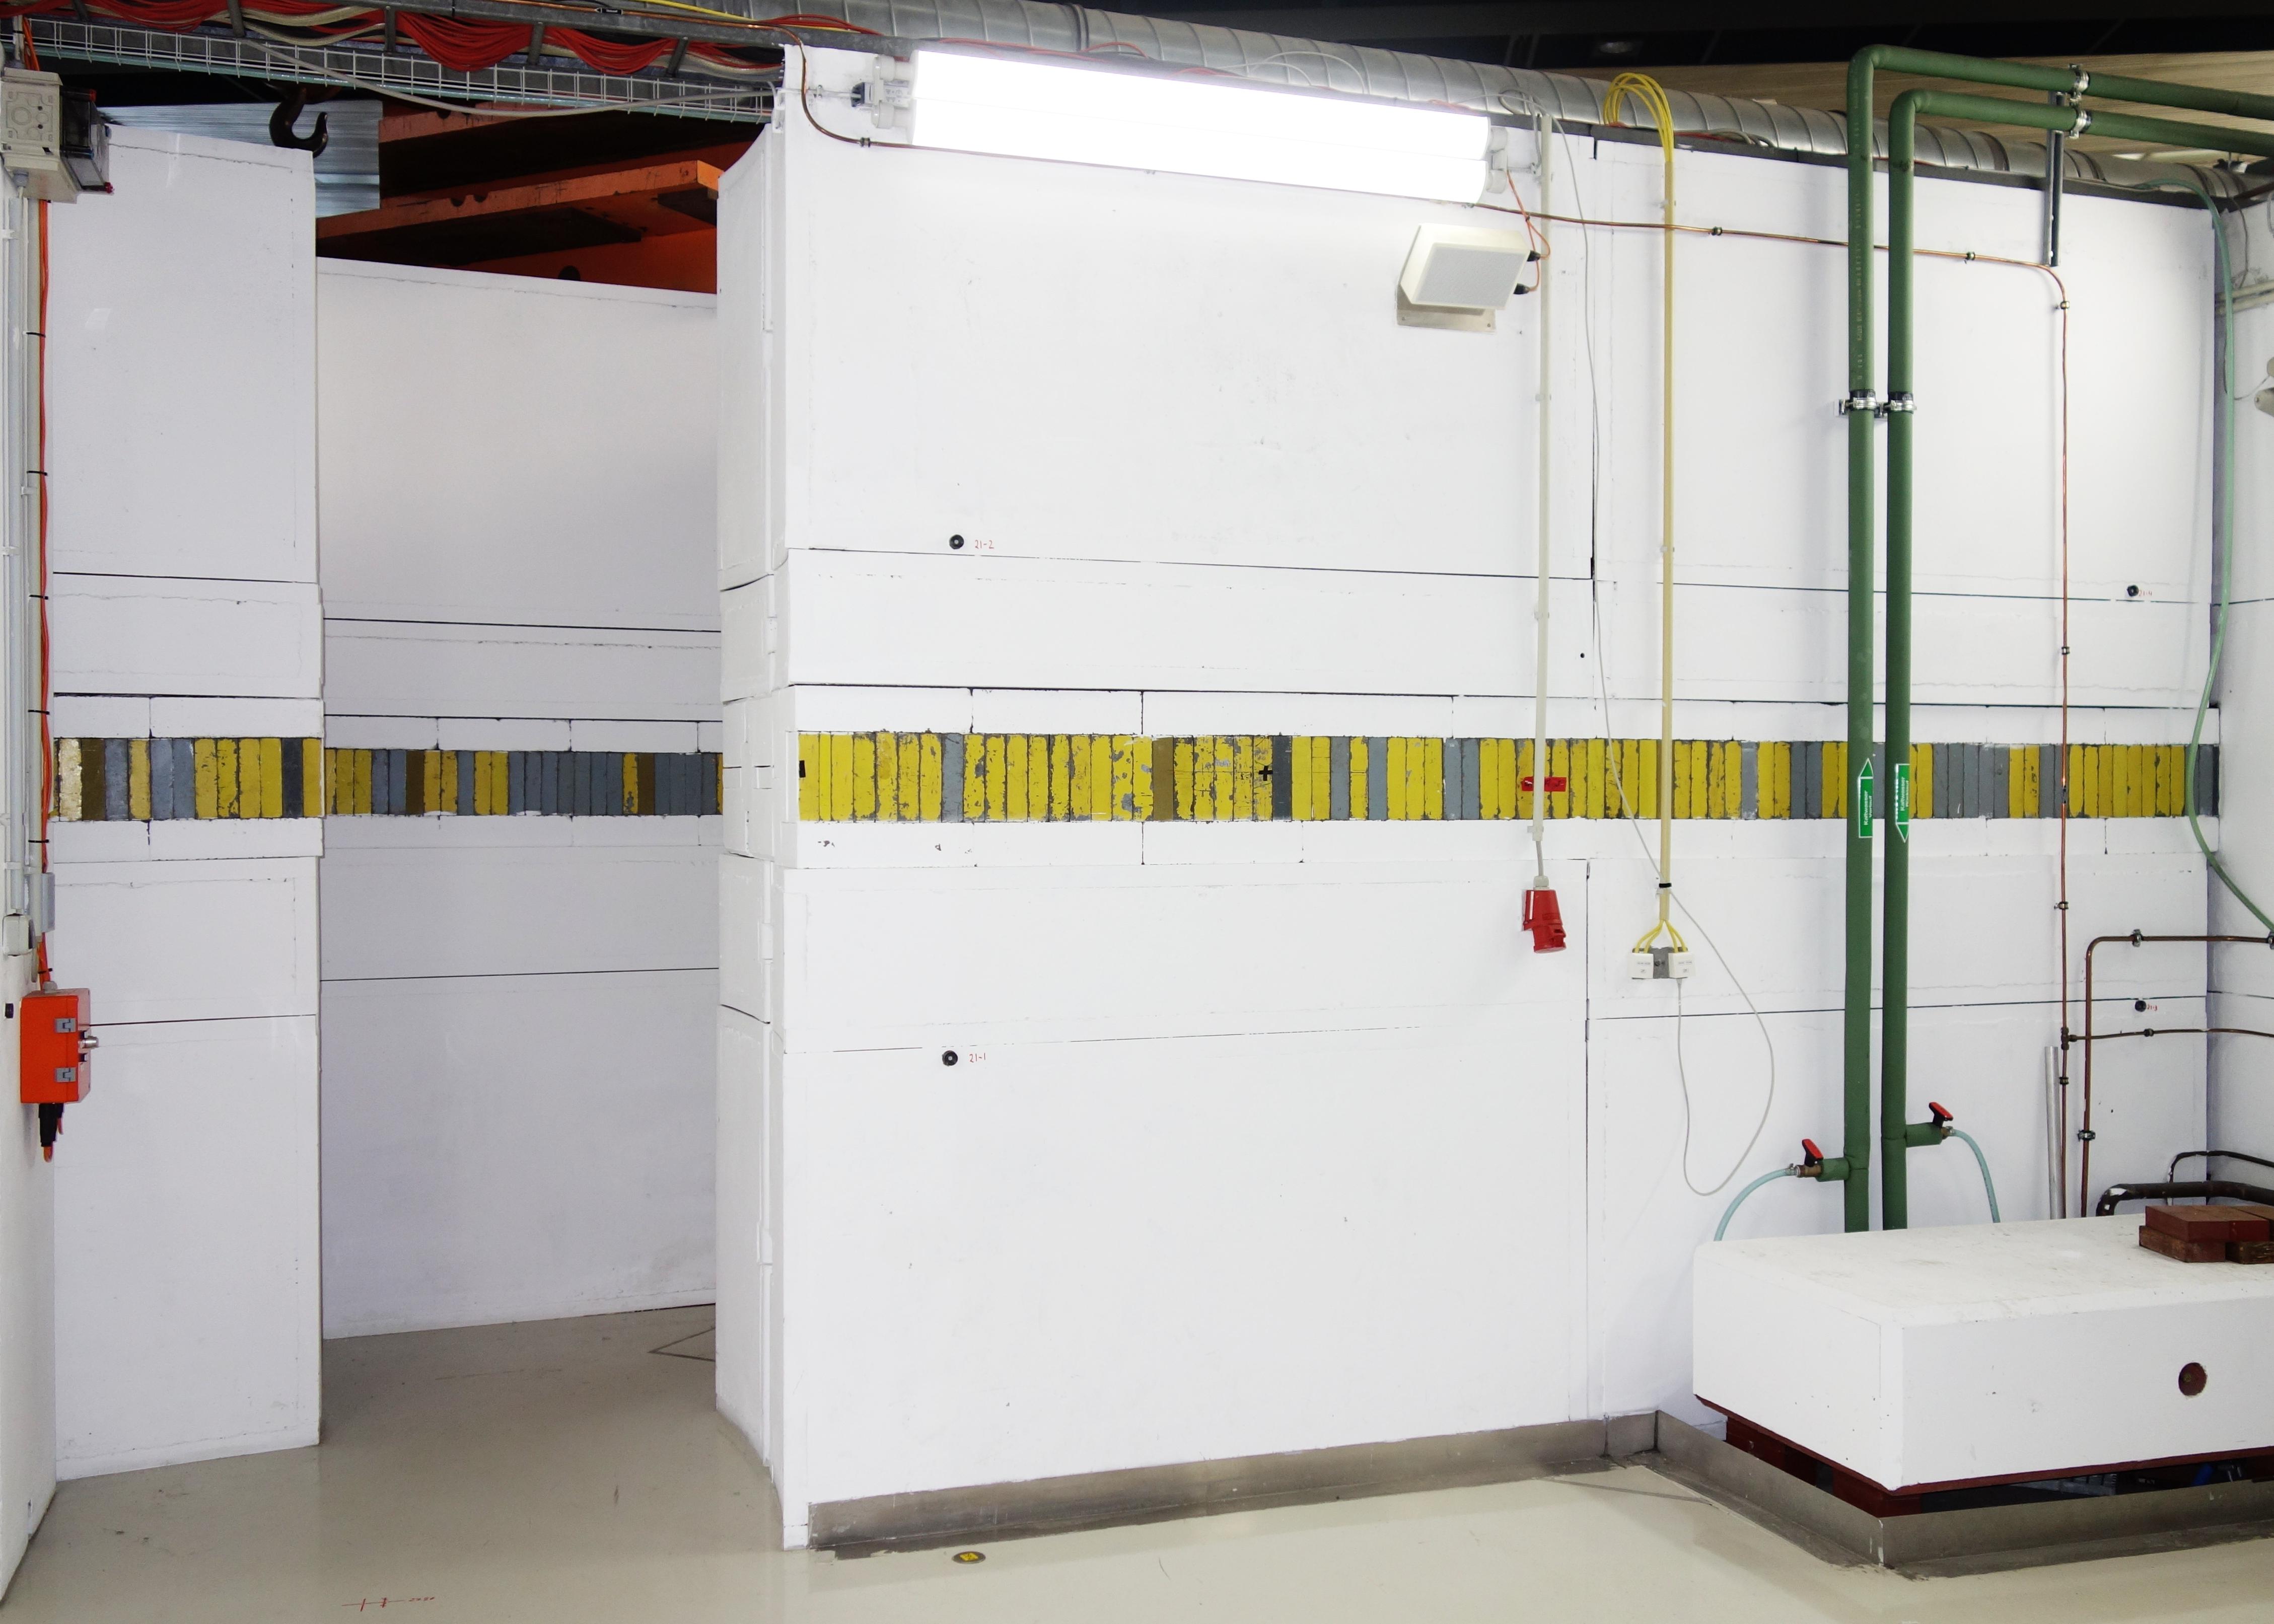
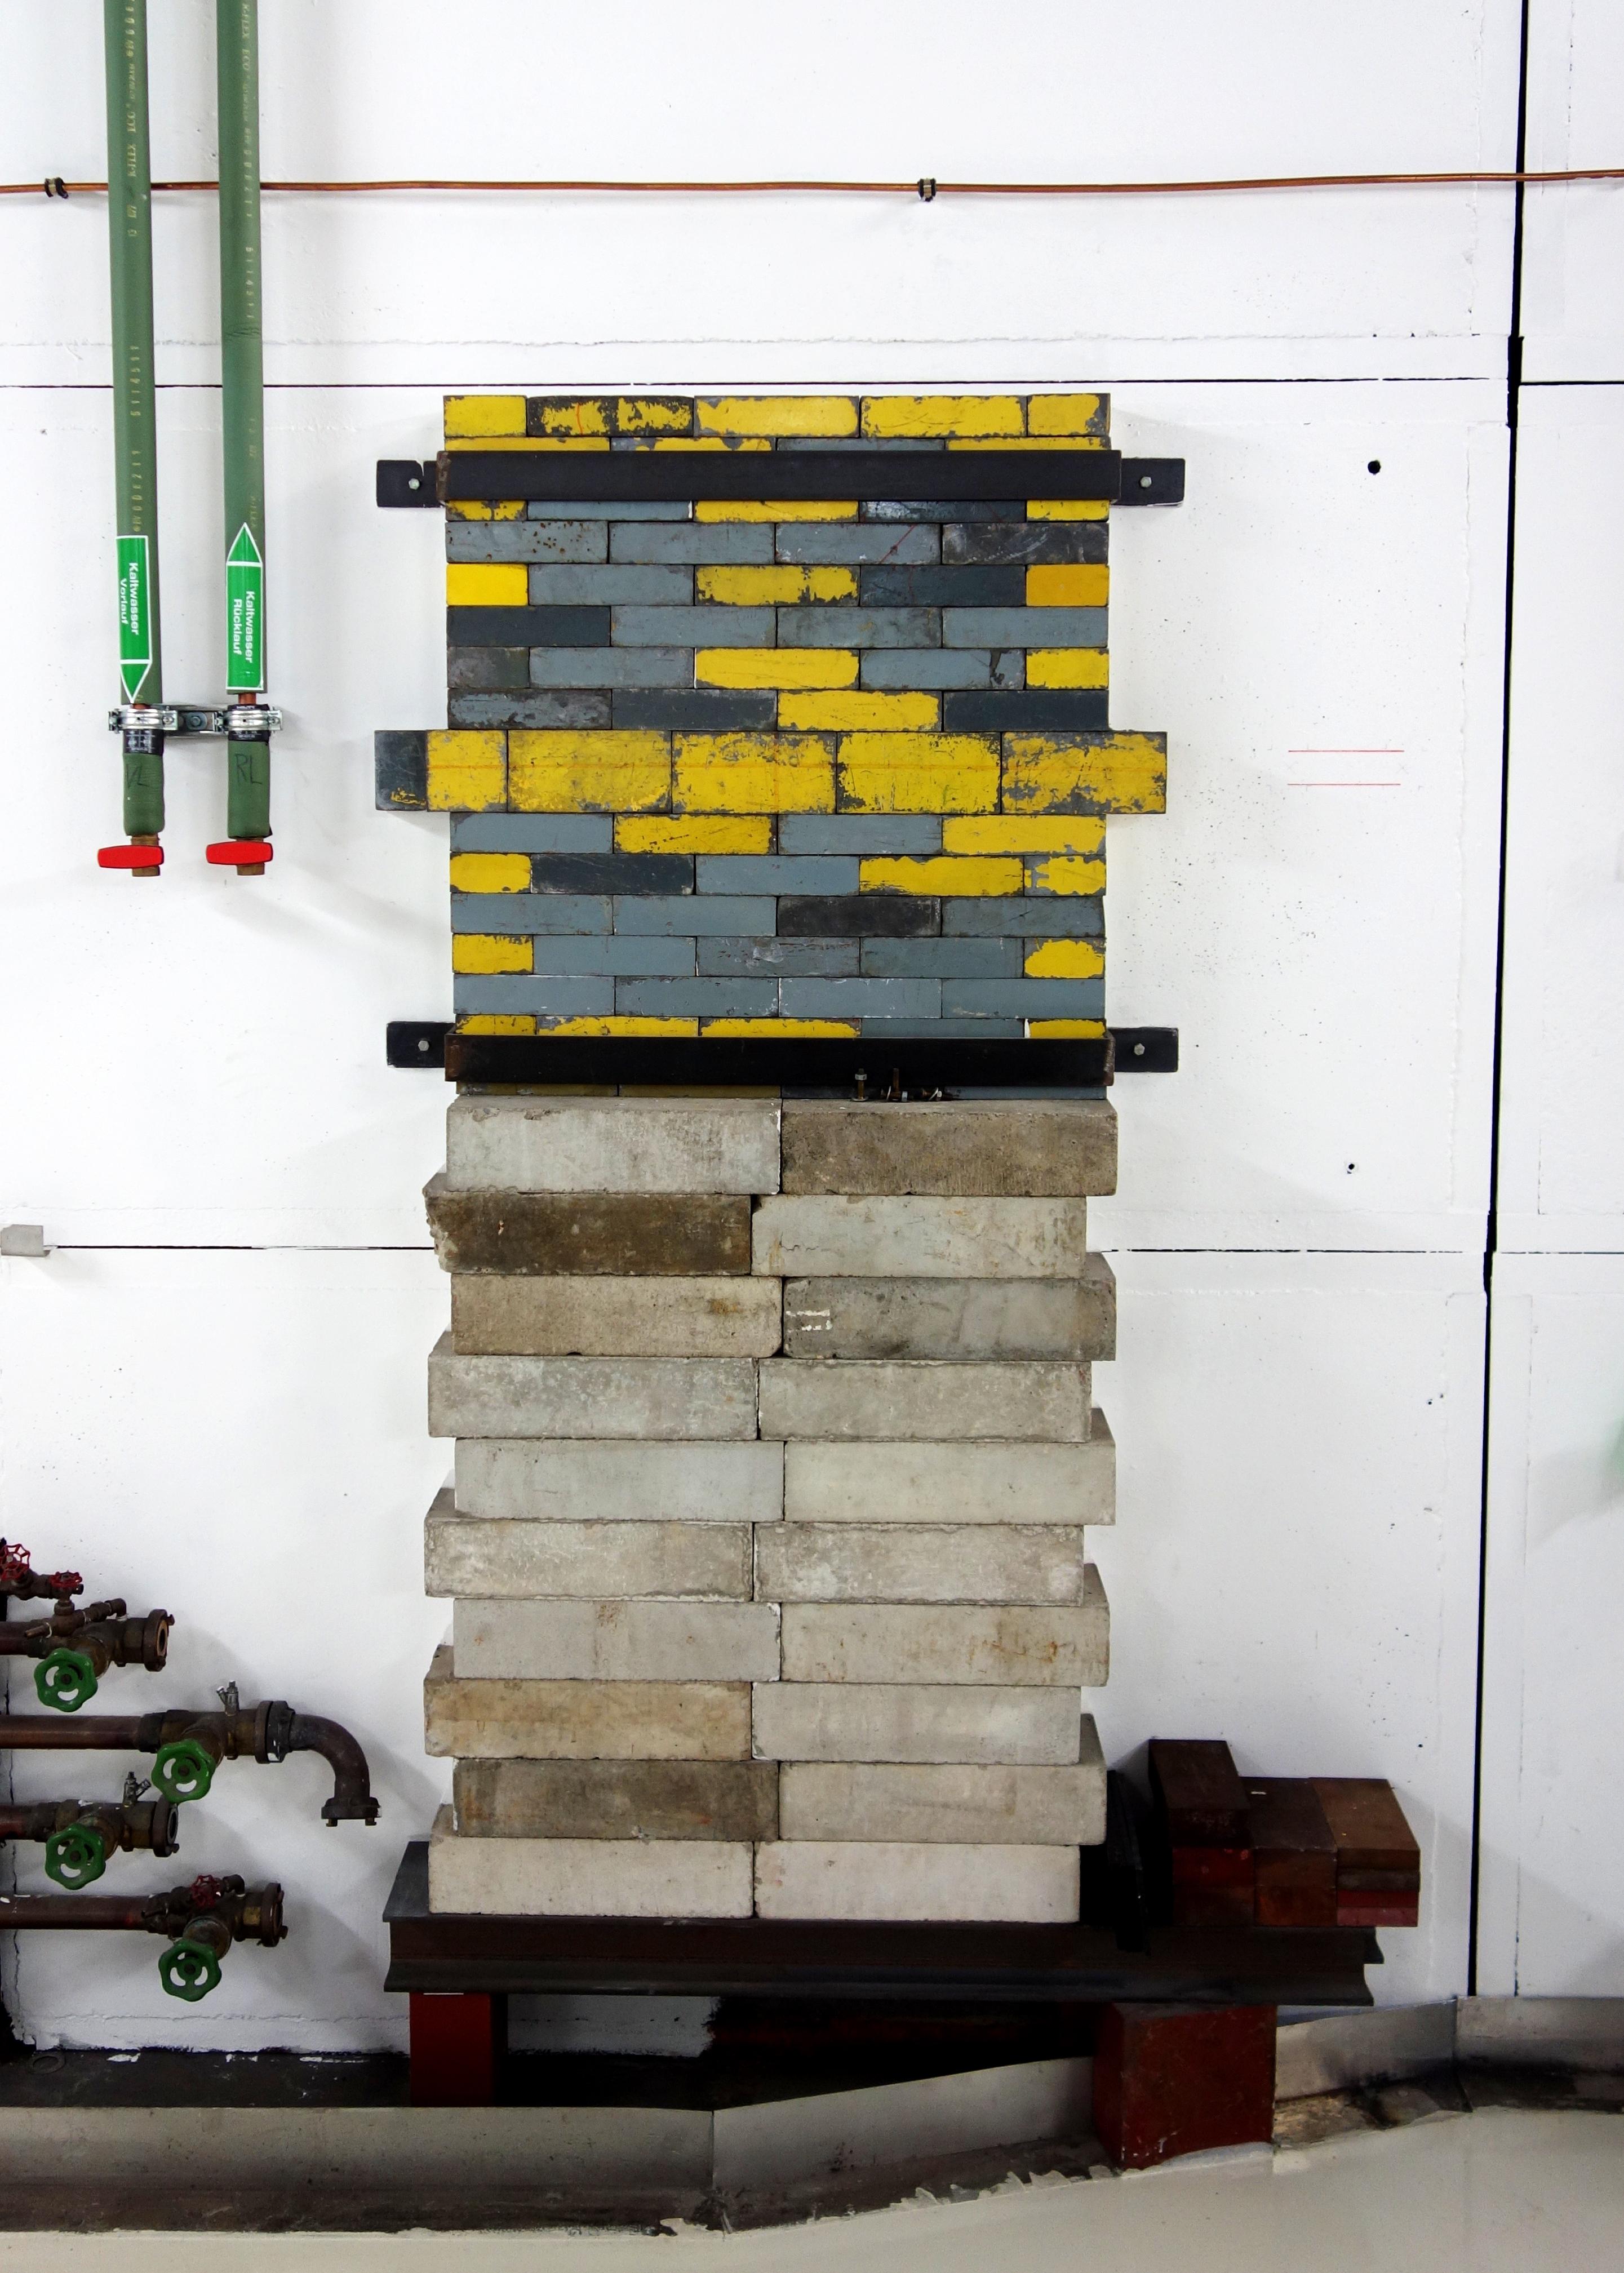
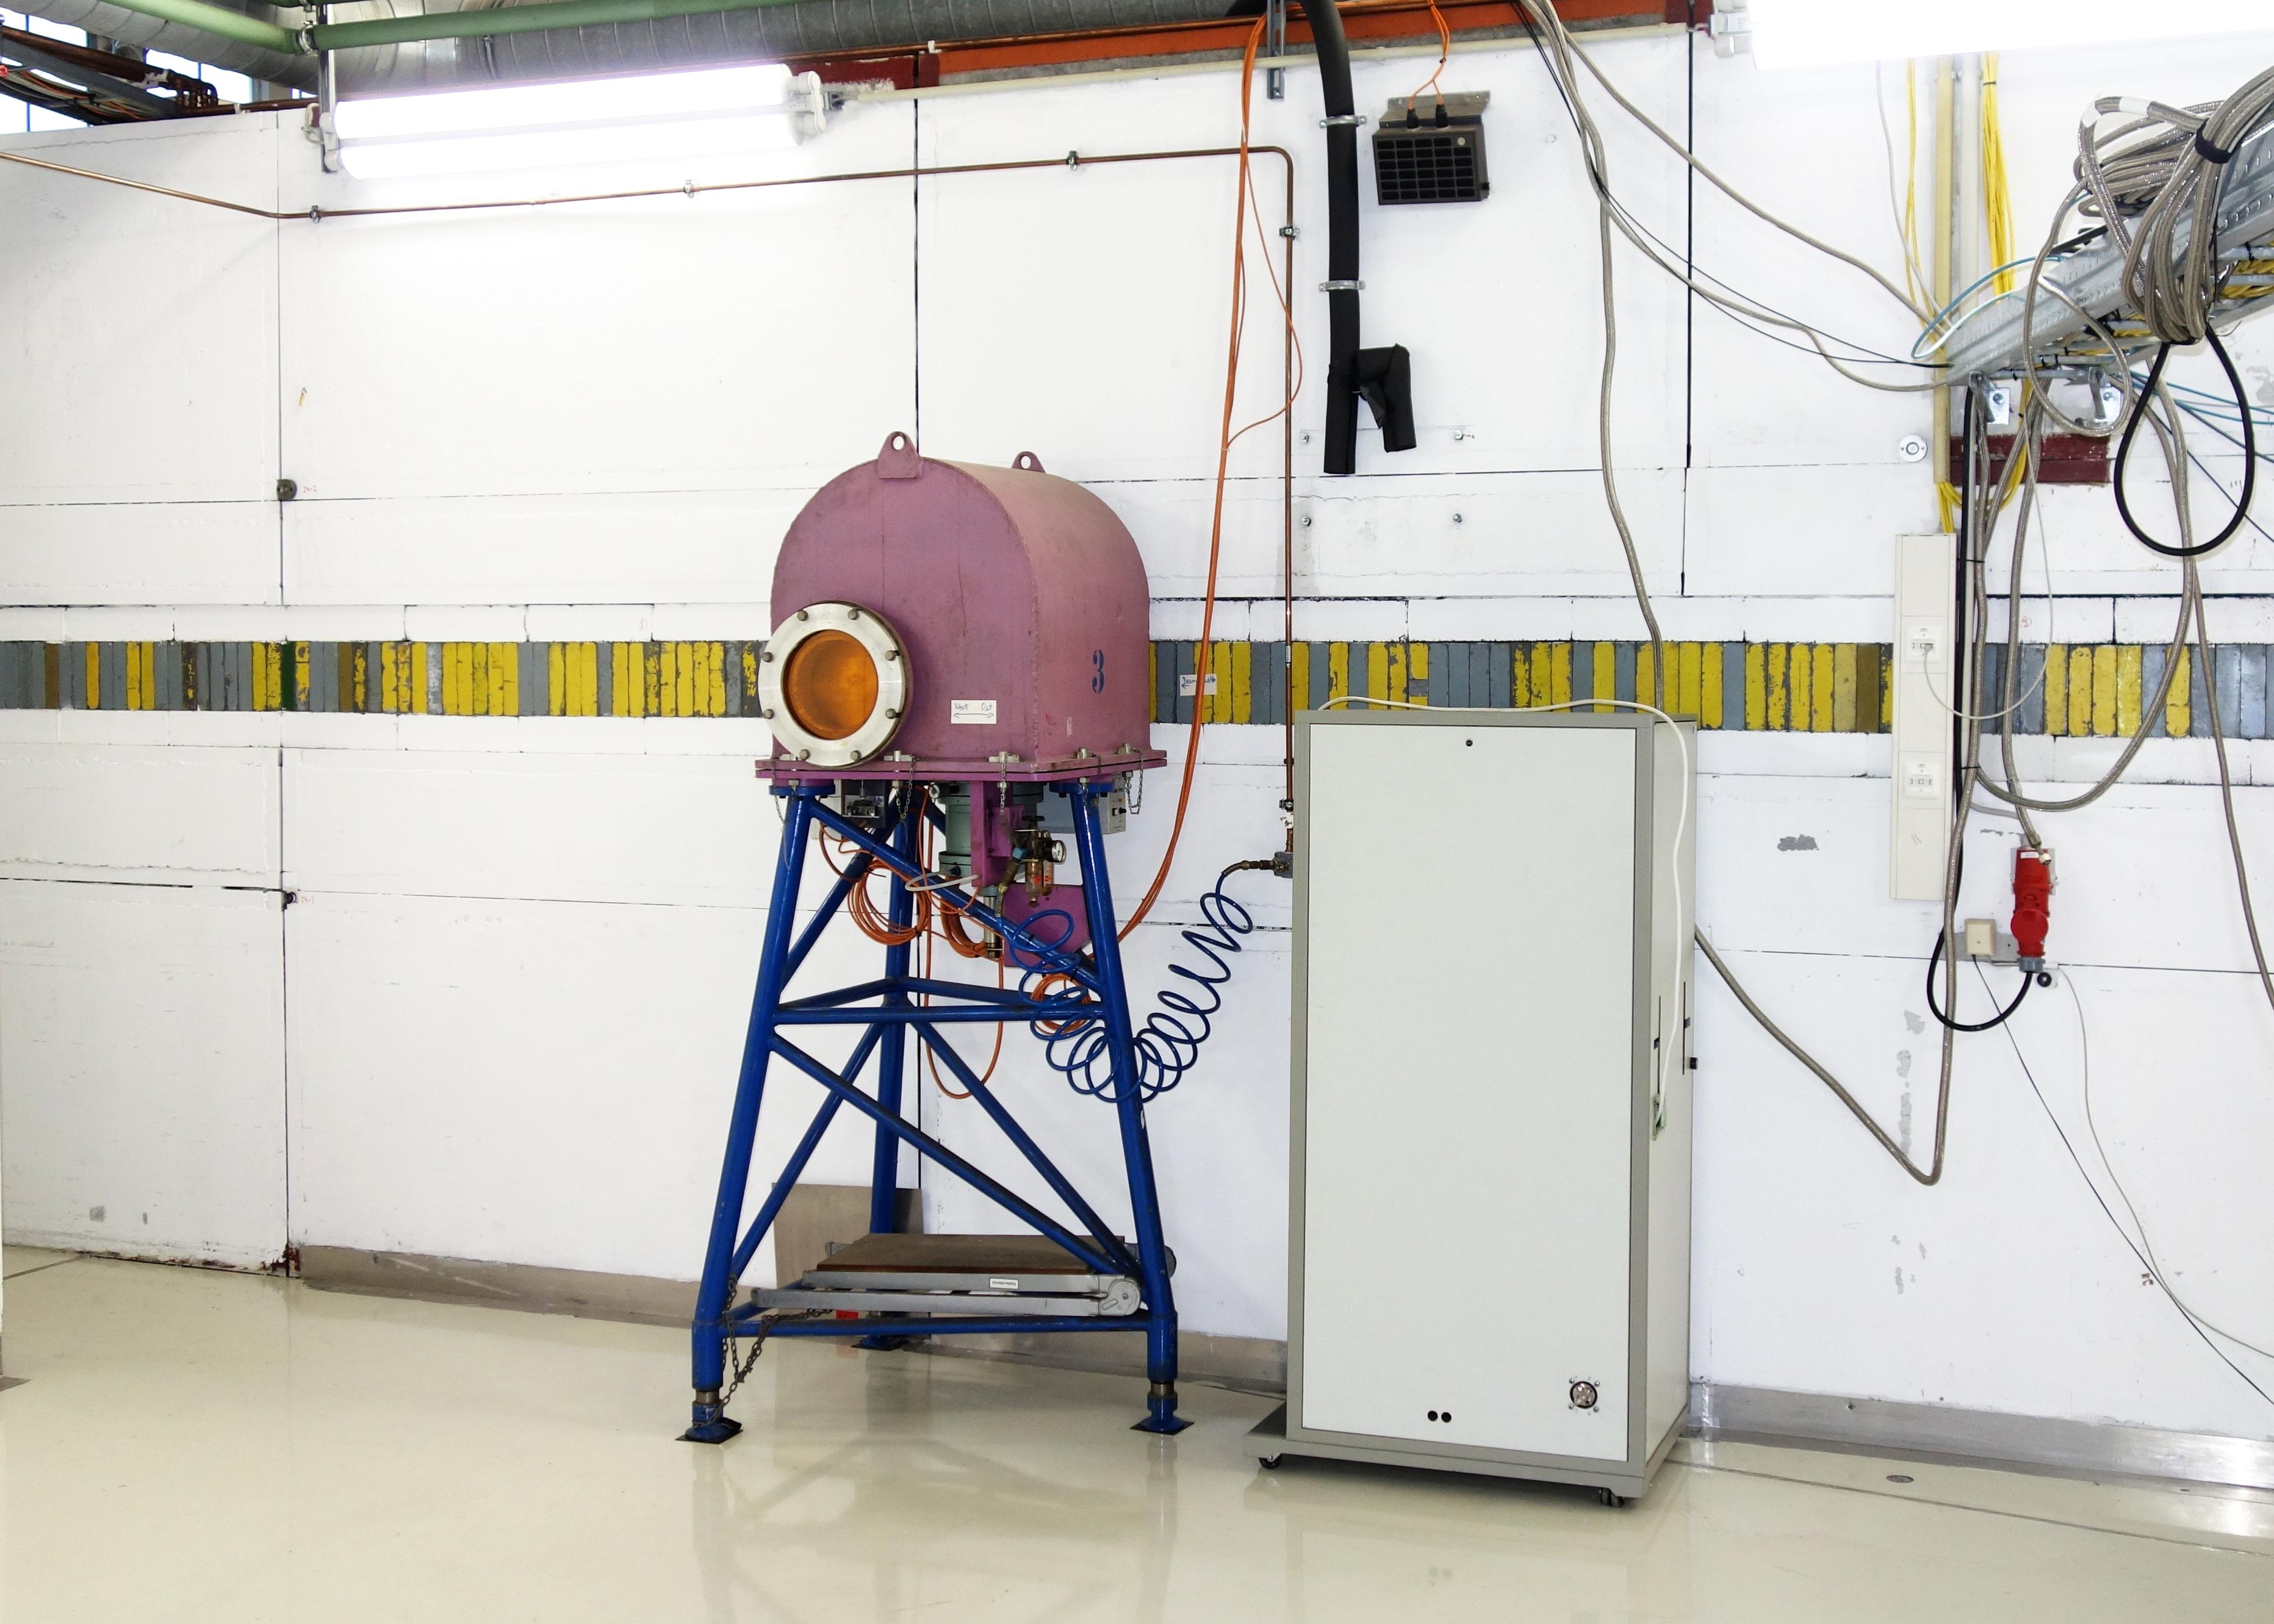
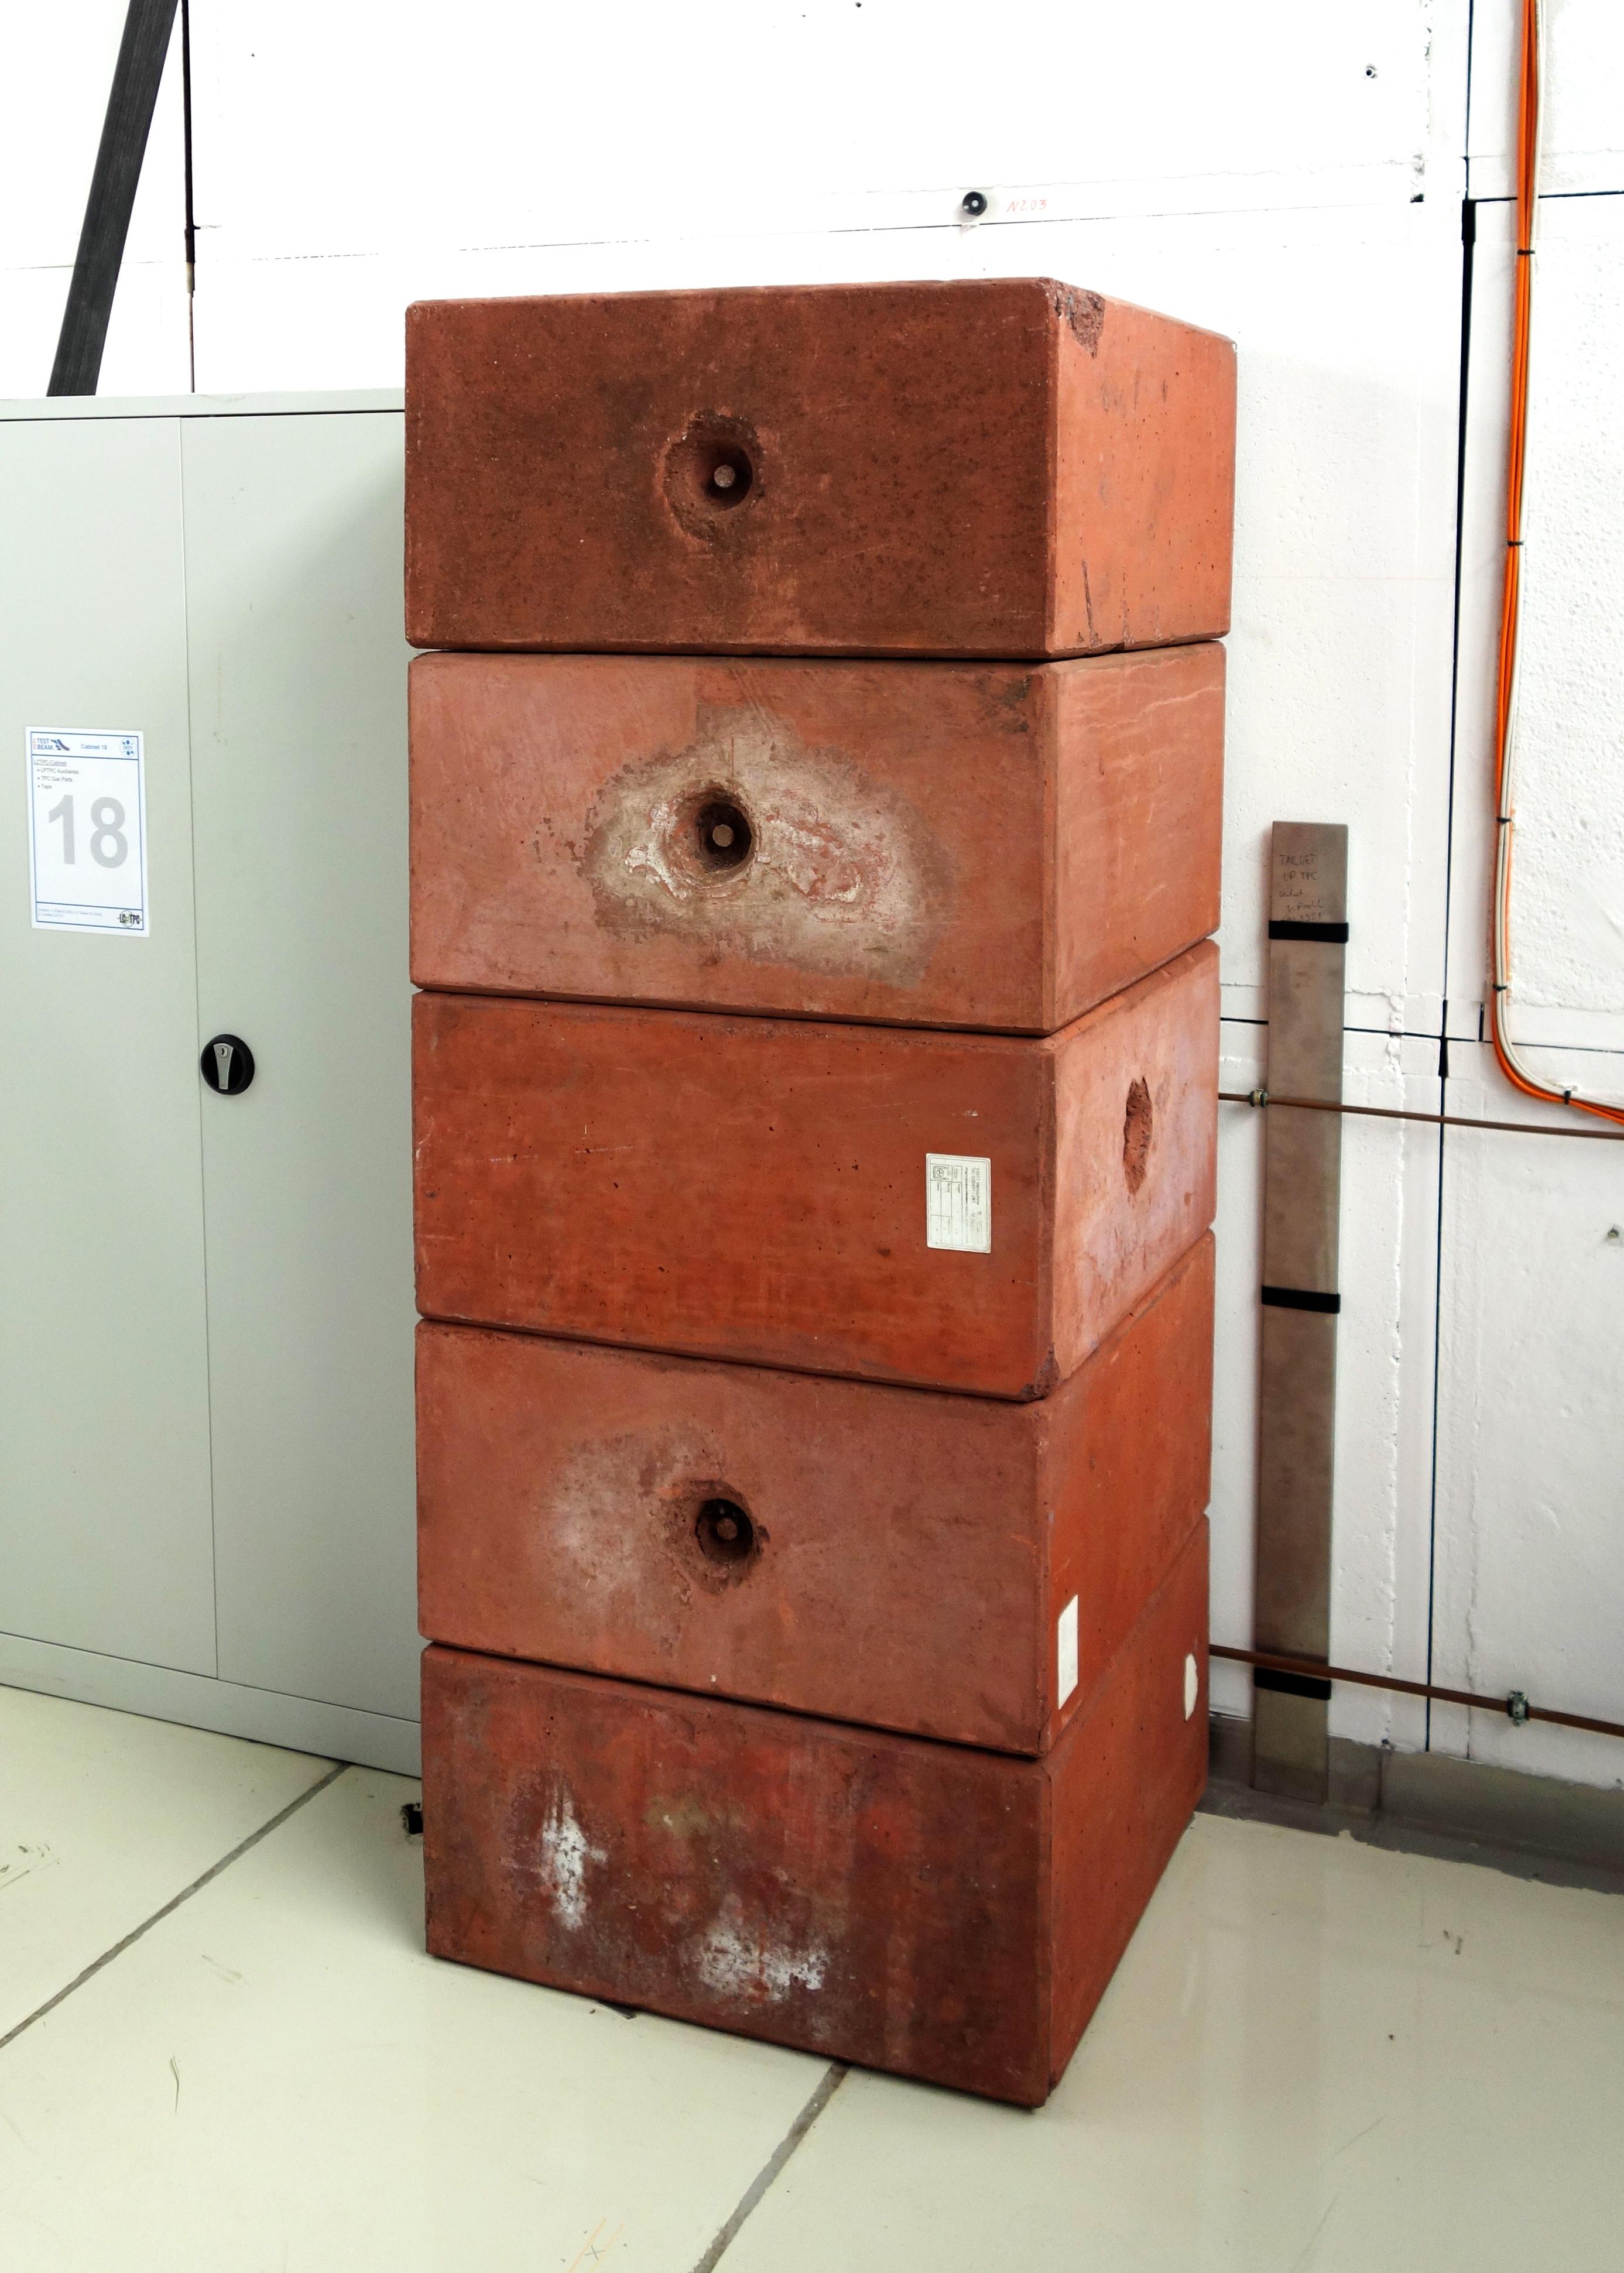
In area TB21, a horizontal line of lead blocks with the same thickness has been installed along the whole wall, since the installed dipole magnet could deflect the beam in this direction (Fig. 15(a)). A similar approach has been used in area TB24. In area TB22, the beam dump consists of an array of lead blocks with a thickness of at the wall (Fig. 15(b)). In area TB24/1, the beam dump has been realized with a set of additional shielding concrete blocks of thickness that cover the entire range to which the beam can be deflected by the PCMAG solenoid (Fig. 15(d)). Since at this beam line only electrons are available and the solenoid polarization is chosen such, that they are deflected downwards, there is no need to extend the shielding significantly above the beam height of about . The results of a Geant4 [9, 10, 11] simulation have been used to determine the heights at which the beam hits the area wall after passing the PCMAG with a field.
The resulting radiation doses of a FLUKA [12, 13] simulation, for the example of a thick lead block array in front of a test beam area wall as in TB22 are presented in the following. Two beam momenta were chosen for the simulation, for the maximum rate —a particle rate of is assumed, according to rate tests with fully open collimators and a high current in DESY II— and for the maximum momentum for which a rate of is assumed. The simulations were performed using FLUKA version Fluka2011.2x simulating 10 runs with 10,000 primary histories, each.
Figure 16 shows the resulting dose rate in . Figure 17 shows the resulting equivalent dose in , assuming 2000 working hours per year which corresponds to 50 working weeks per year with 40 working hours per week. The plots show averaging projections from to of the beam position in the plane looking from the side on the beam. The beam height is at zero on the vertical axis. The simulation includes the thick floor under the beam area to judge the doses in the tunnels below some parts of the test beam areas. At beam height, the wall consists of a thick block made out of shielding concrete with magnetite aggregate [14] (dark gray). The rest of the wall and the floor are made out of normal concrete (light gray).
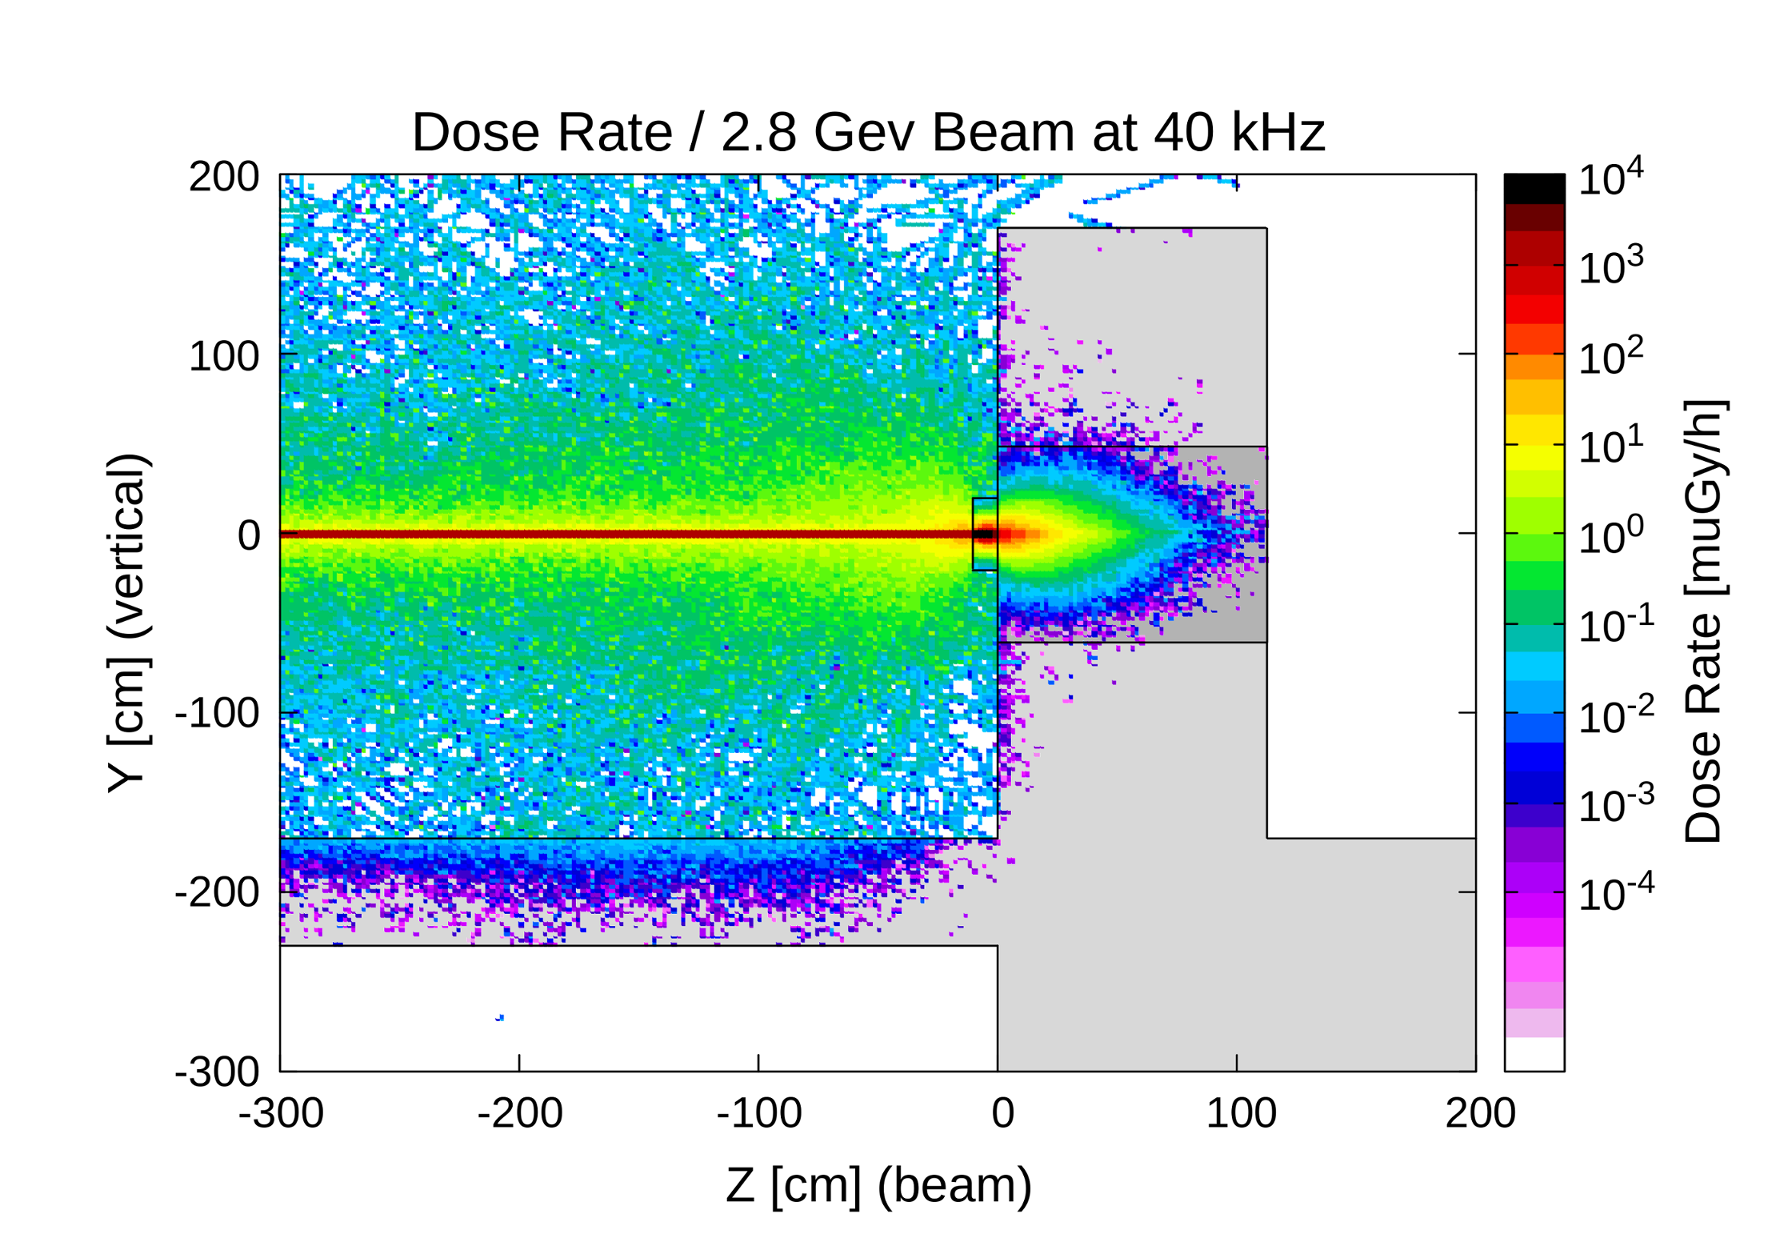
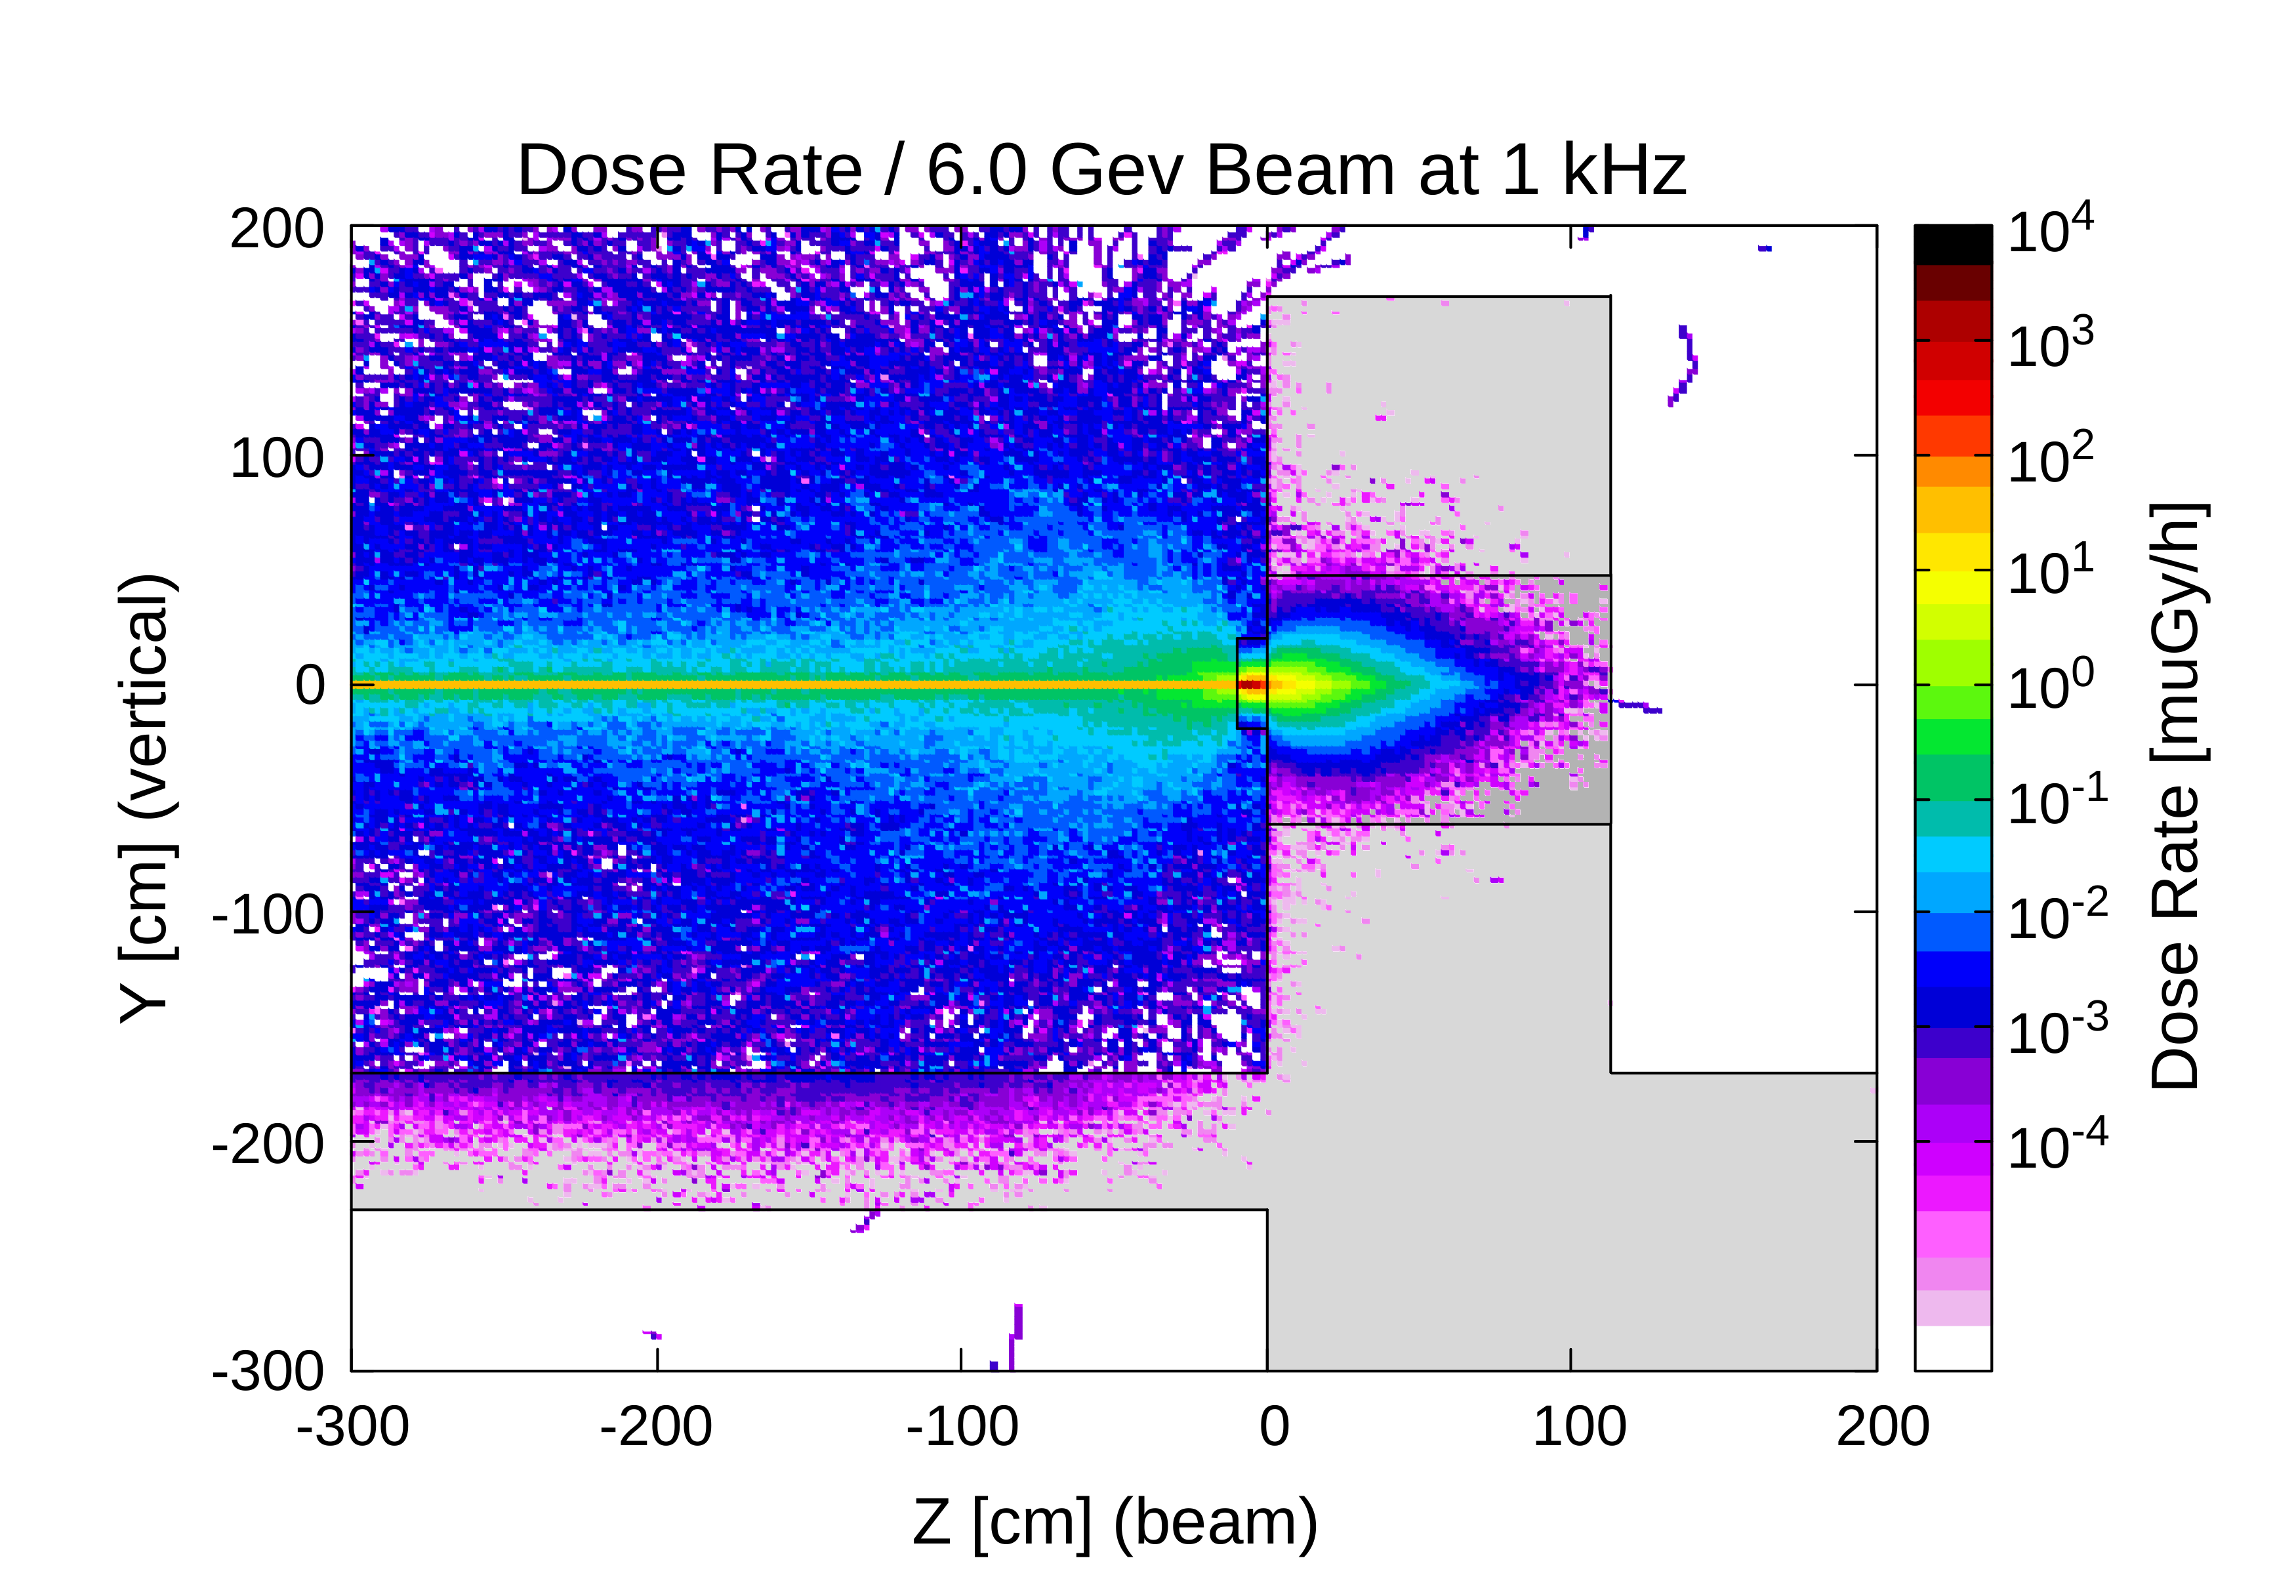
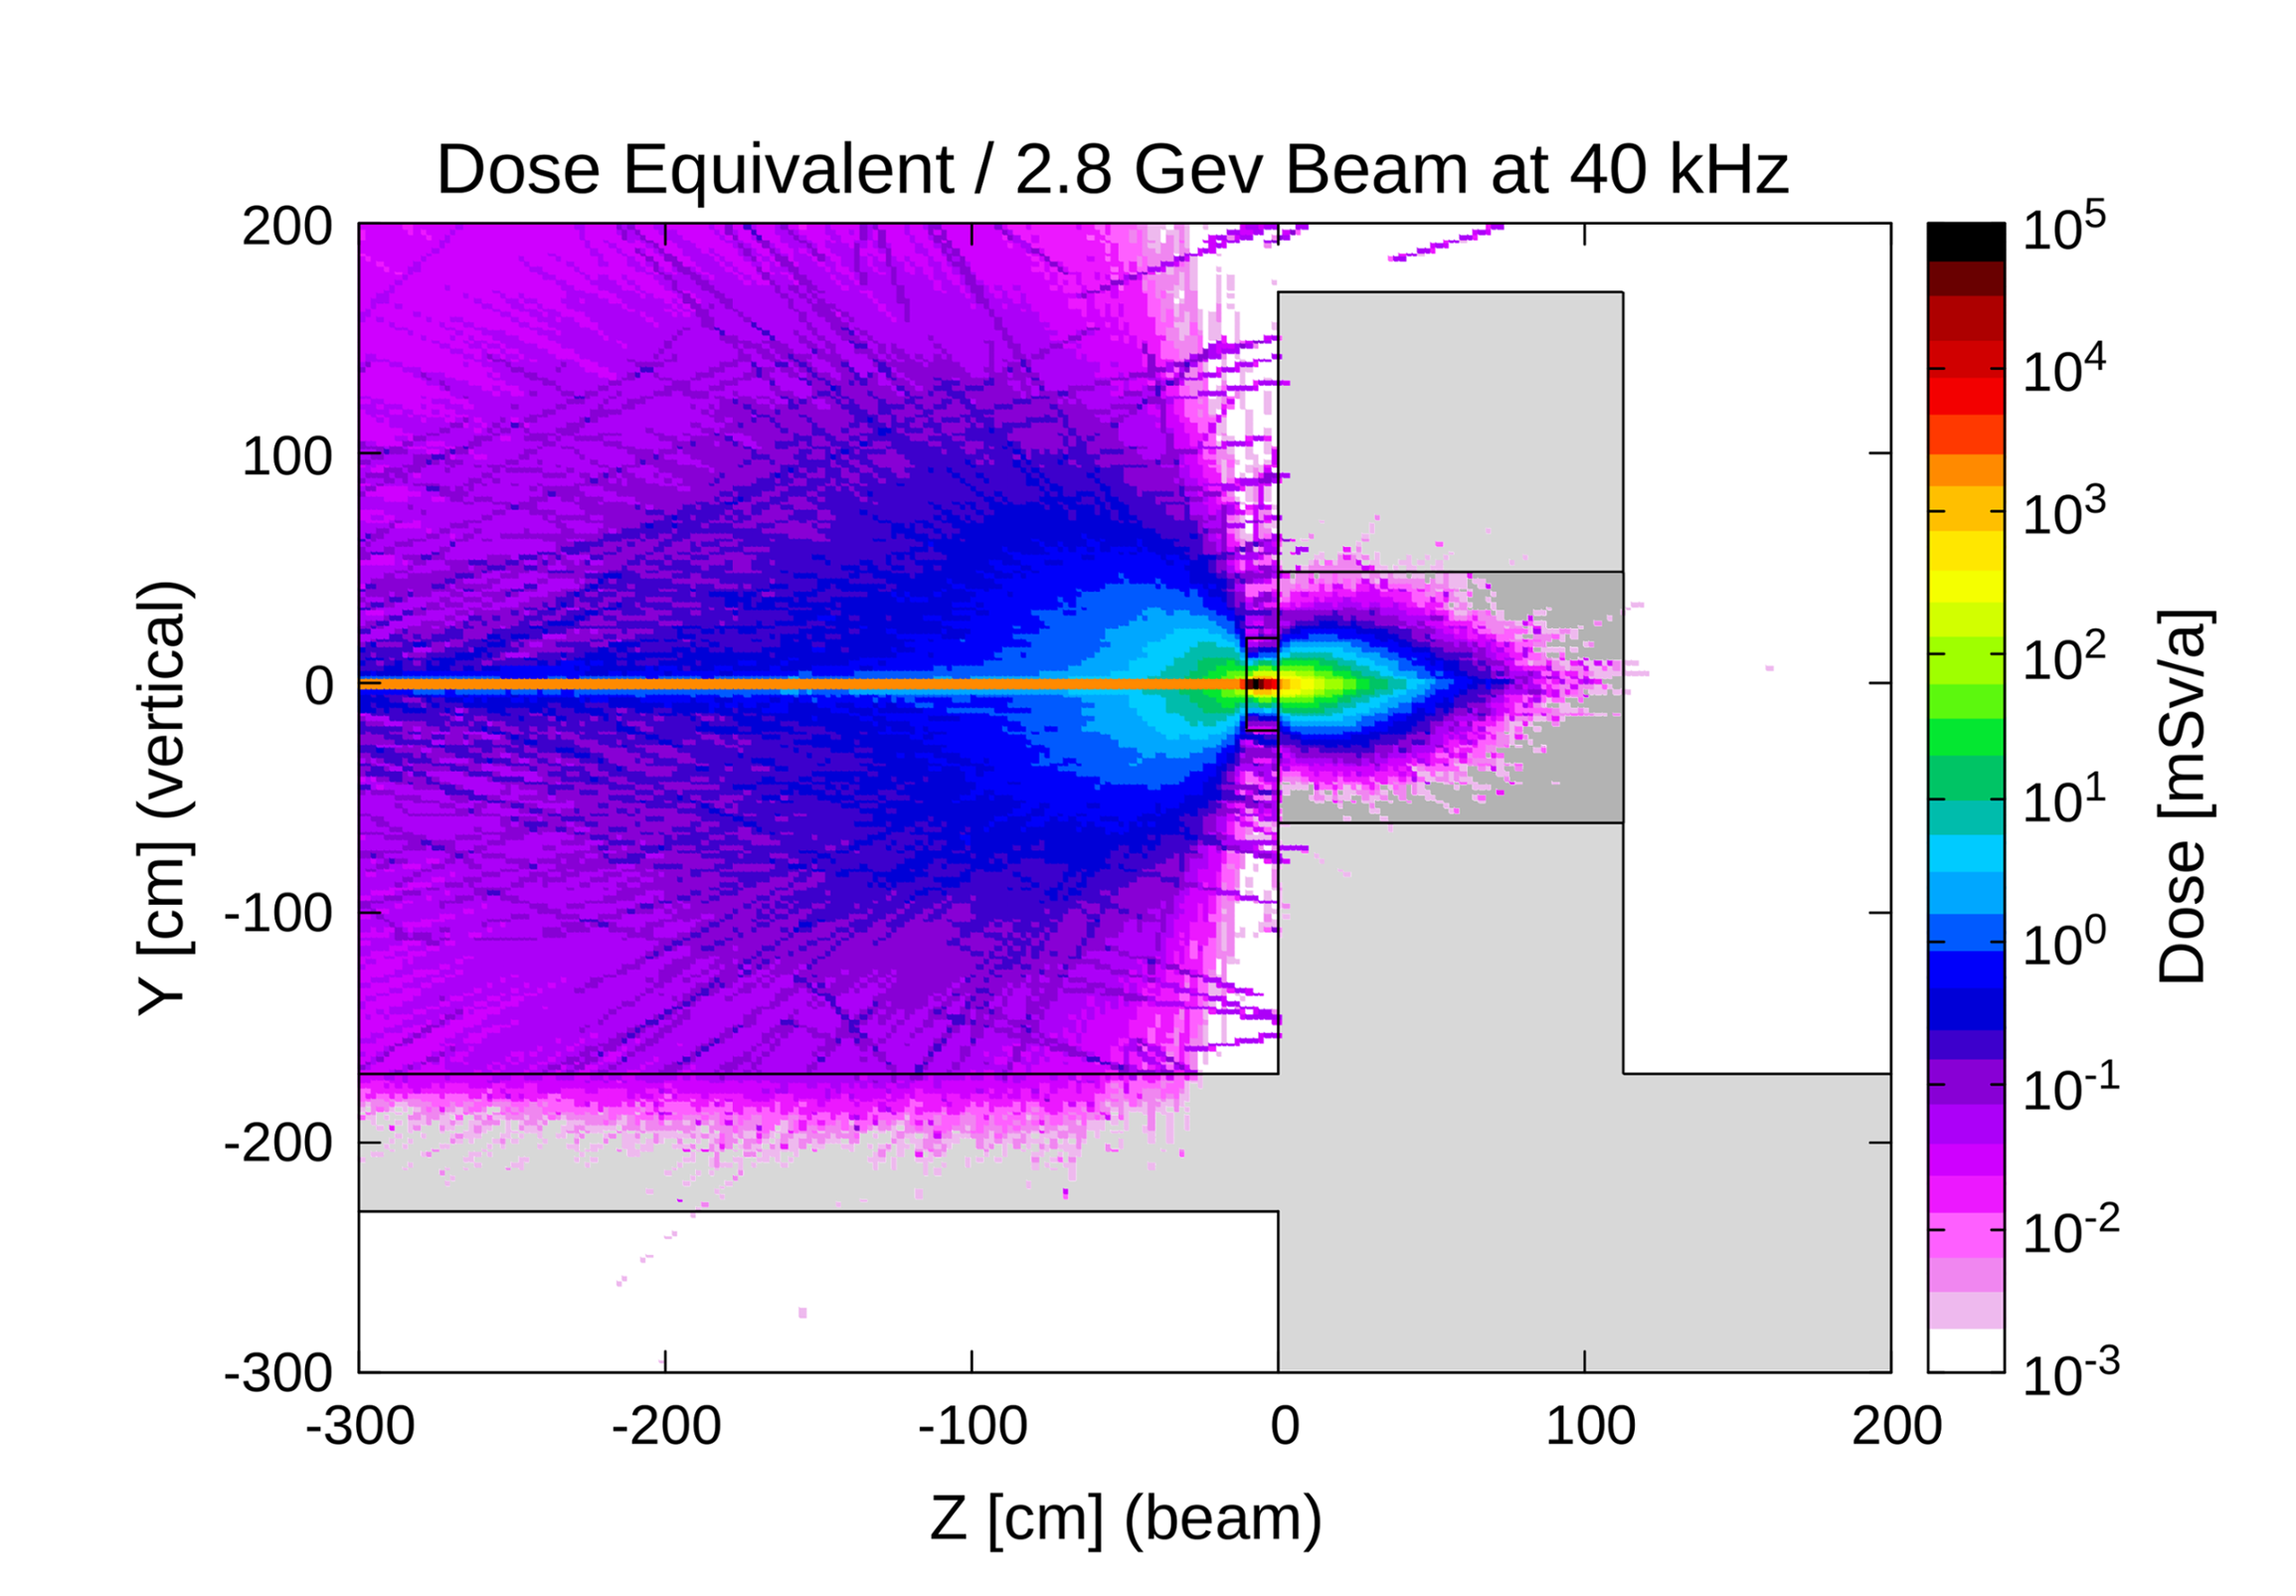
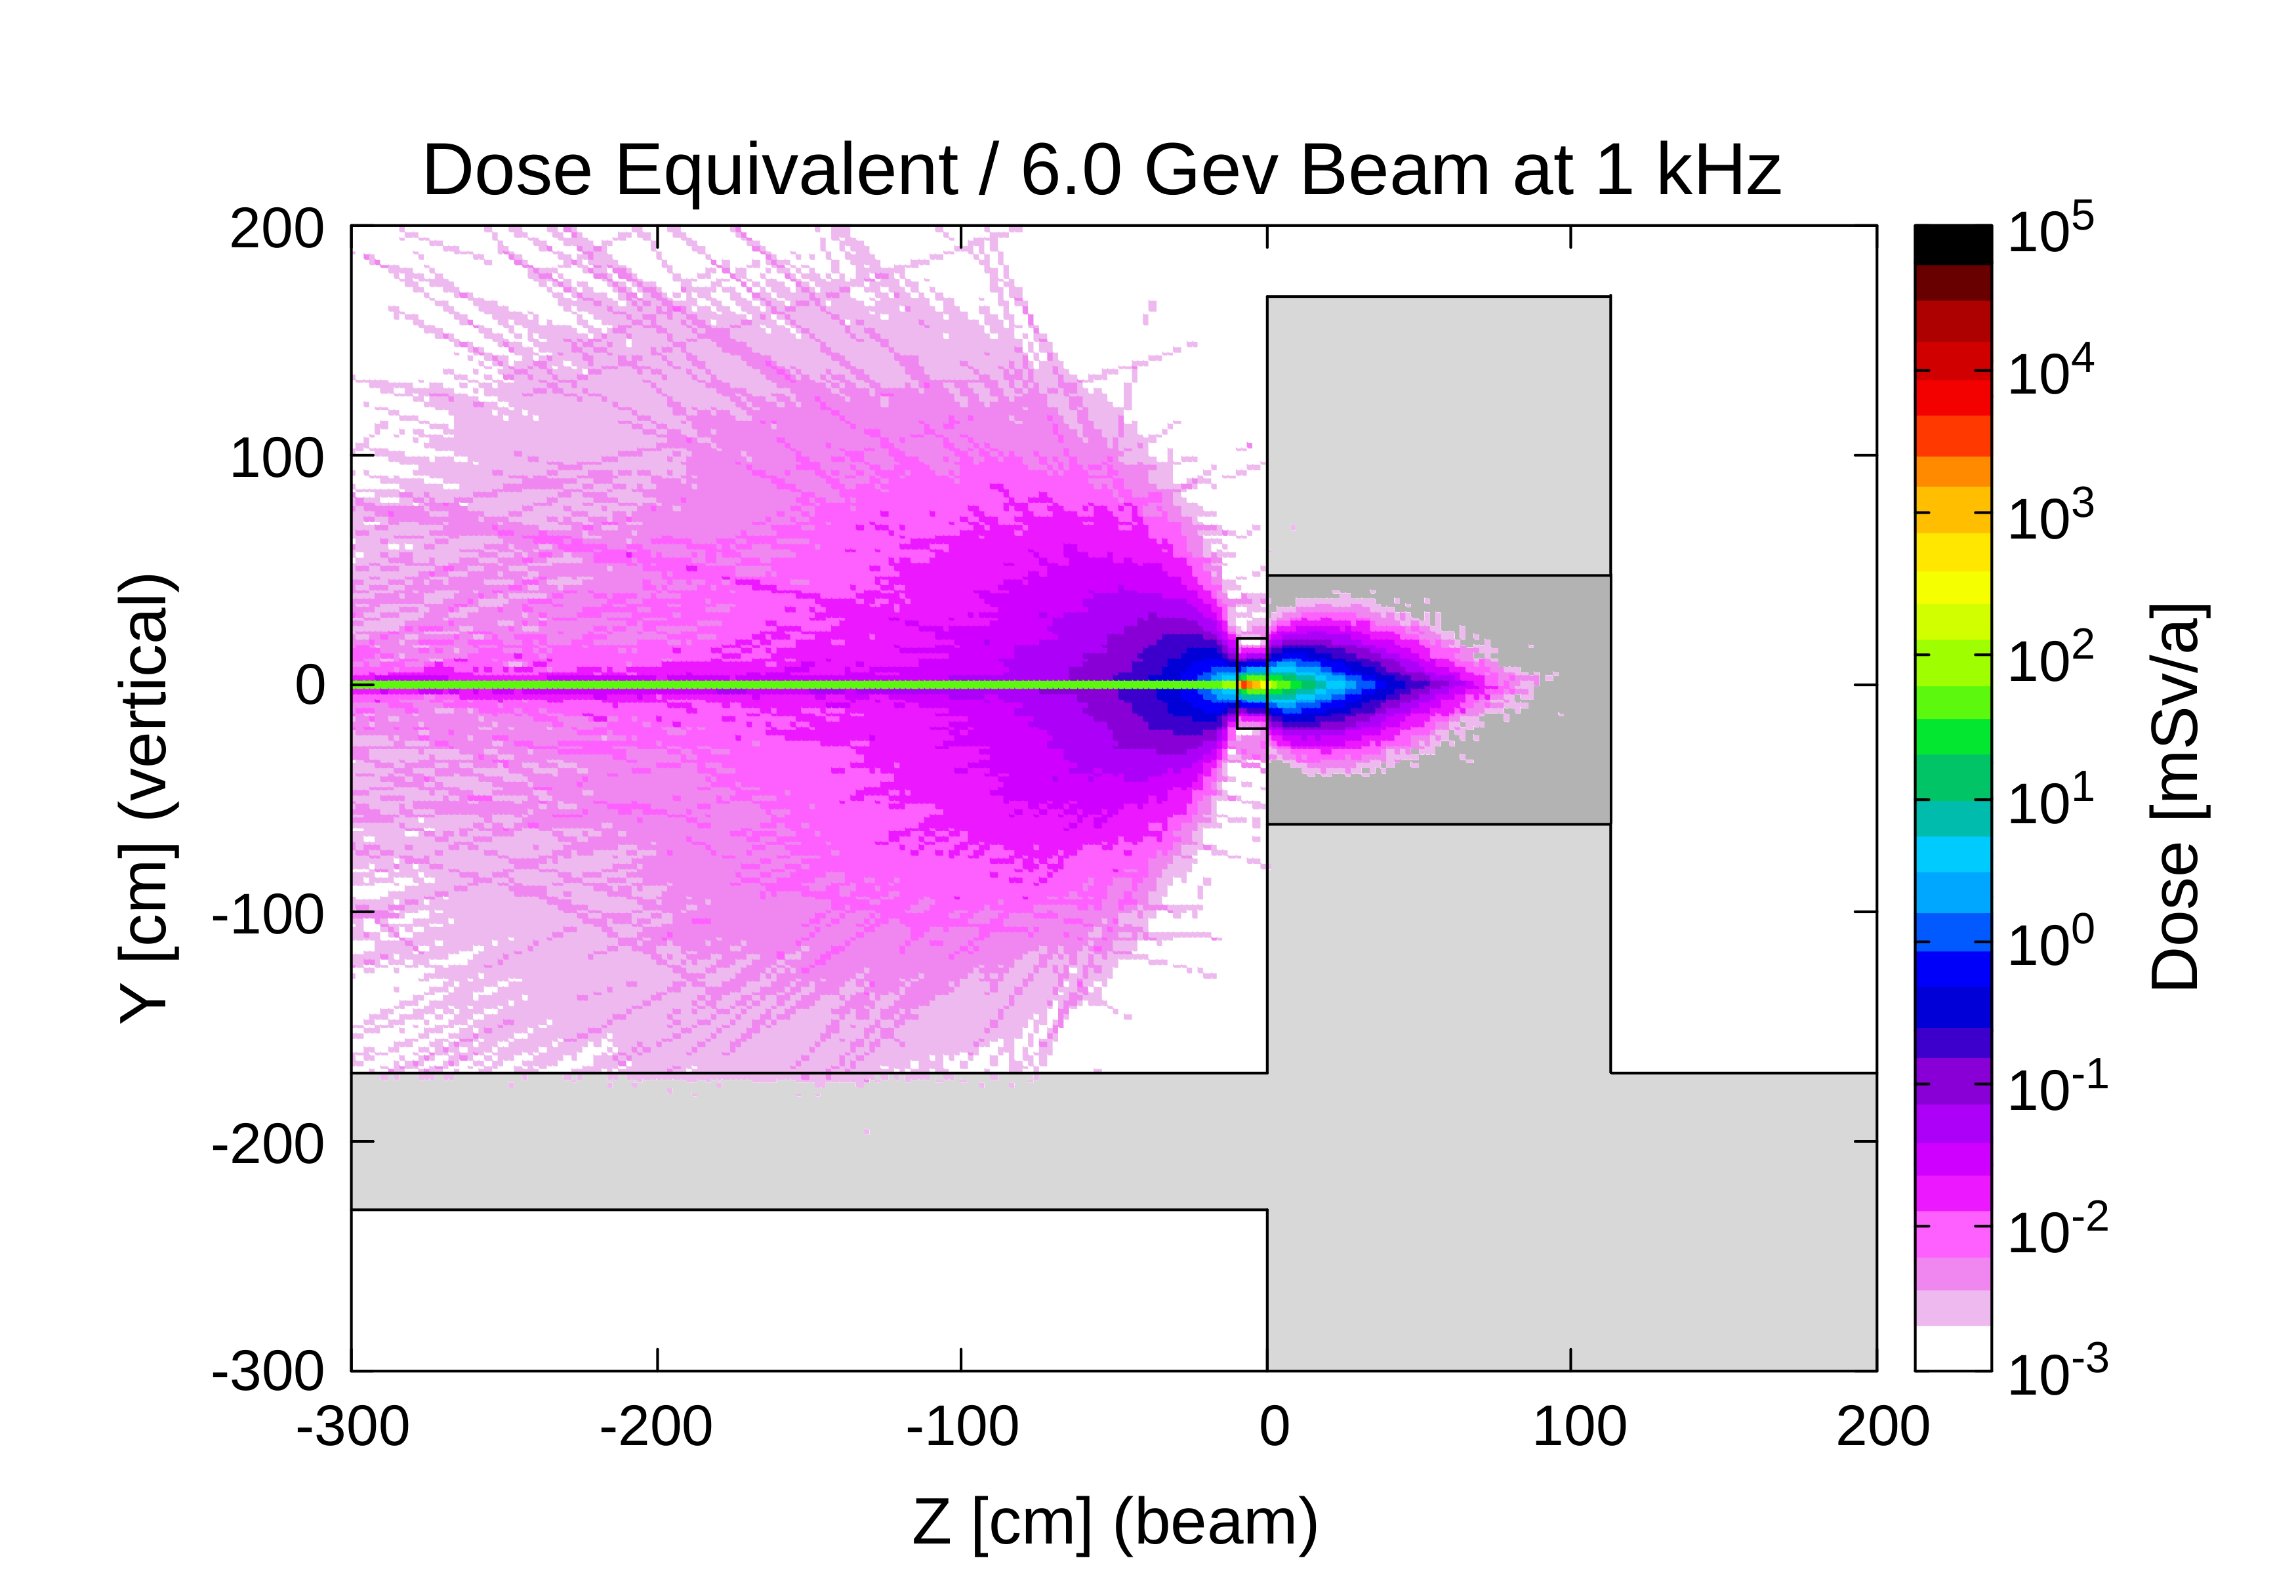
As can be seen, the resulting doses outside the test beam area are very low for both beam momenta and rates. The dose rate stays under , mostly significantly under . The equivalent dose stays in both cases below , which is well below the legal limit.
6 Additional Infrastructures
In addition to the common infrastructure available in all test beam areas at the DESY II Test Beam Facility, certain beam lines offer additional and unique infrastructure like gas systems, slow control units, large bore test magnets and pixel beam telescopes.
Fully-fledged gas systems are available to the users in TB22 and TB24 including a gas warning system suitable for handling flammable gas and gas cabinets for storing gas bottles. Premixed gases can be provided by the central gas group of DESY.
In the framework of the AIDA2020 project [3] a generic slow control system [15] has been installed at the DESY II Test Beam Facility which allows to record the environmental conditions during beam tests. The system provides a standard suite of sensors for measuring temperature, pressure or humidity and can be easily extended with other sensors. As an additional feature, users can record the data and embed it into the data stream of the EUDAQ data acquisition framework described in Section 6.3. Two identical systems have been installed on two movable racks which allow to move them into the test beam area, where they have been required.
In the following sections, unique and important infrastructure is described which is only available for certain beam lines and is located in the corresponding test beam area:
6.1 Big Red Magnet – MD Dipole
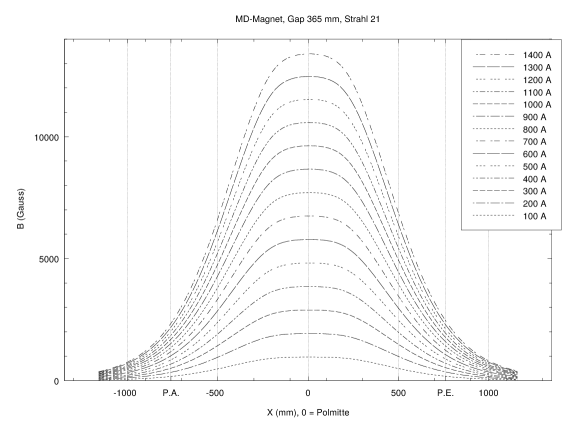
Directly after the secondary collimator in TB21, a large window dipole magnet —DESY type MD, spark chamber magnet— is installed (see in the background of Fig. 22(a)). It has an integrated length of about and an opening, which is about wide and high (Fig. 18). The maximum field is at which has been measured in the middle of the field volume (Fig. 19).
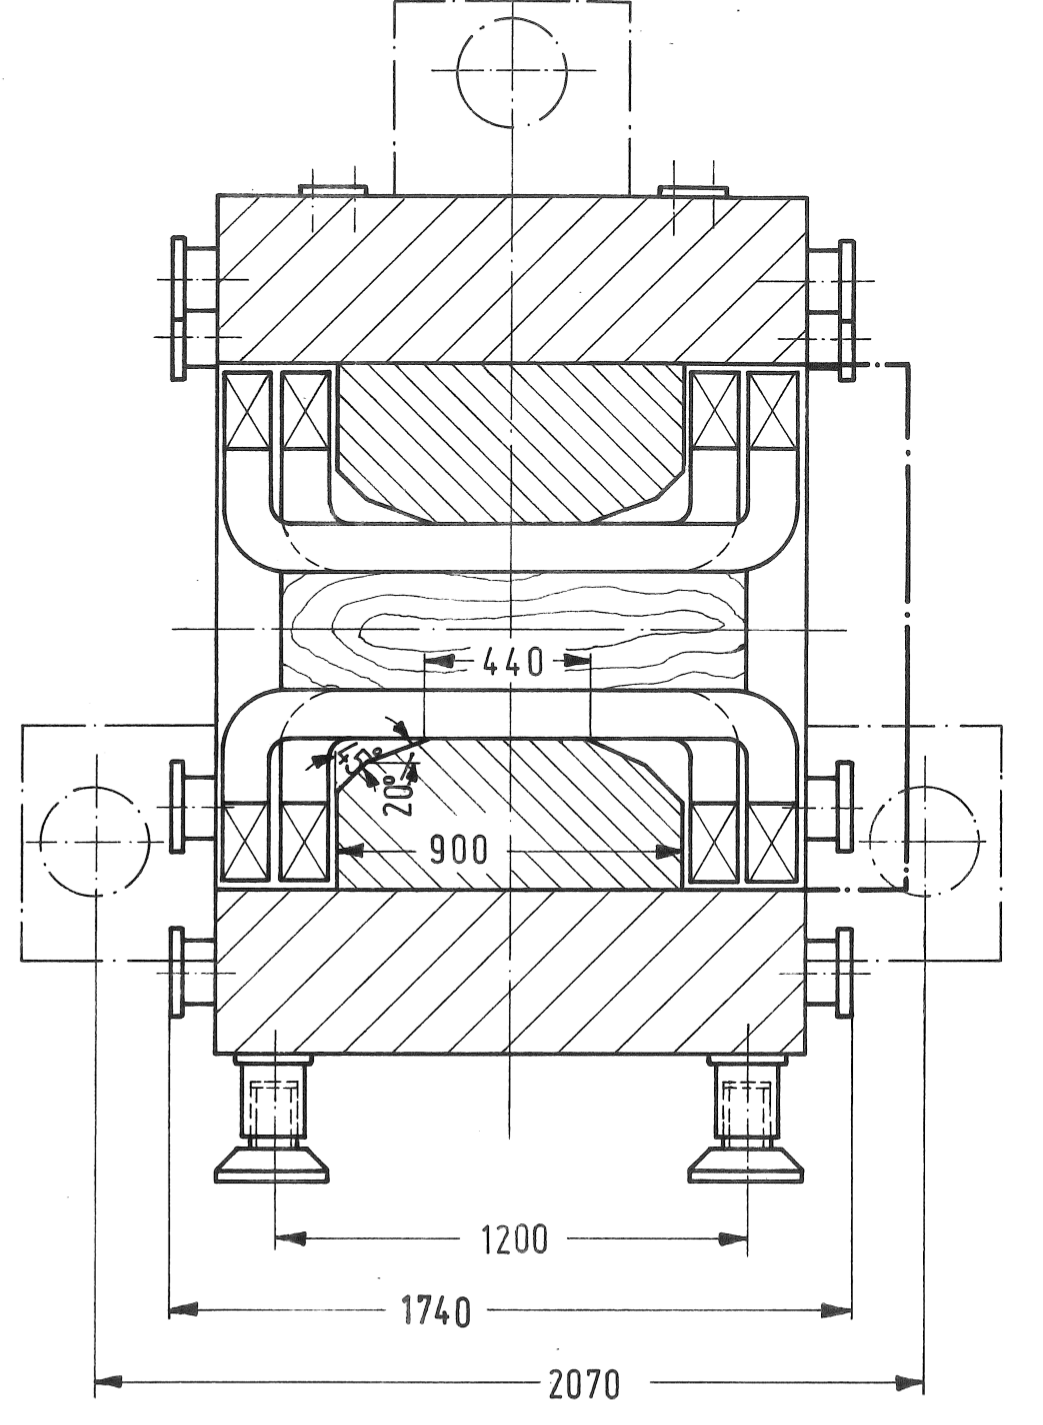
This magnet has been used as a particle spectrometer: By measuring the deflecting angle of the particle track using a pixel telescope the momentum of the incoming beam can be precisely determined (see Sec. 7.2.5). Furthermore it has been a crucial component for user groups performing gamma-electron separation in tests in calorimeters including an additional bremsstrahlung or Lorentz angle measurements in Silicon sensors. Finally, it has also been used to qualify electronics for the usage in high magnetic fields.
6.2 PCMAG
In test beam area TB24/1, a large-bore superconducting solenoid is installed, called PCMAG (Fig. 20). This magnet has been provided by KEK and has been installed in 2006 at DESY, initially funded by the EU-FP6 EUDET project [1]. The PCMAG magnet has a superconducting coil which can produce fields of up to . At its operational current of the field in the center has a strength of . Originally, the PCMAG was designed for airborne experiments [16]. It has therefore been designed to be very lightweight and without a return yoke. This results in quite a large stray field. Table 4 lists the important parameters of the solenoid.
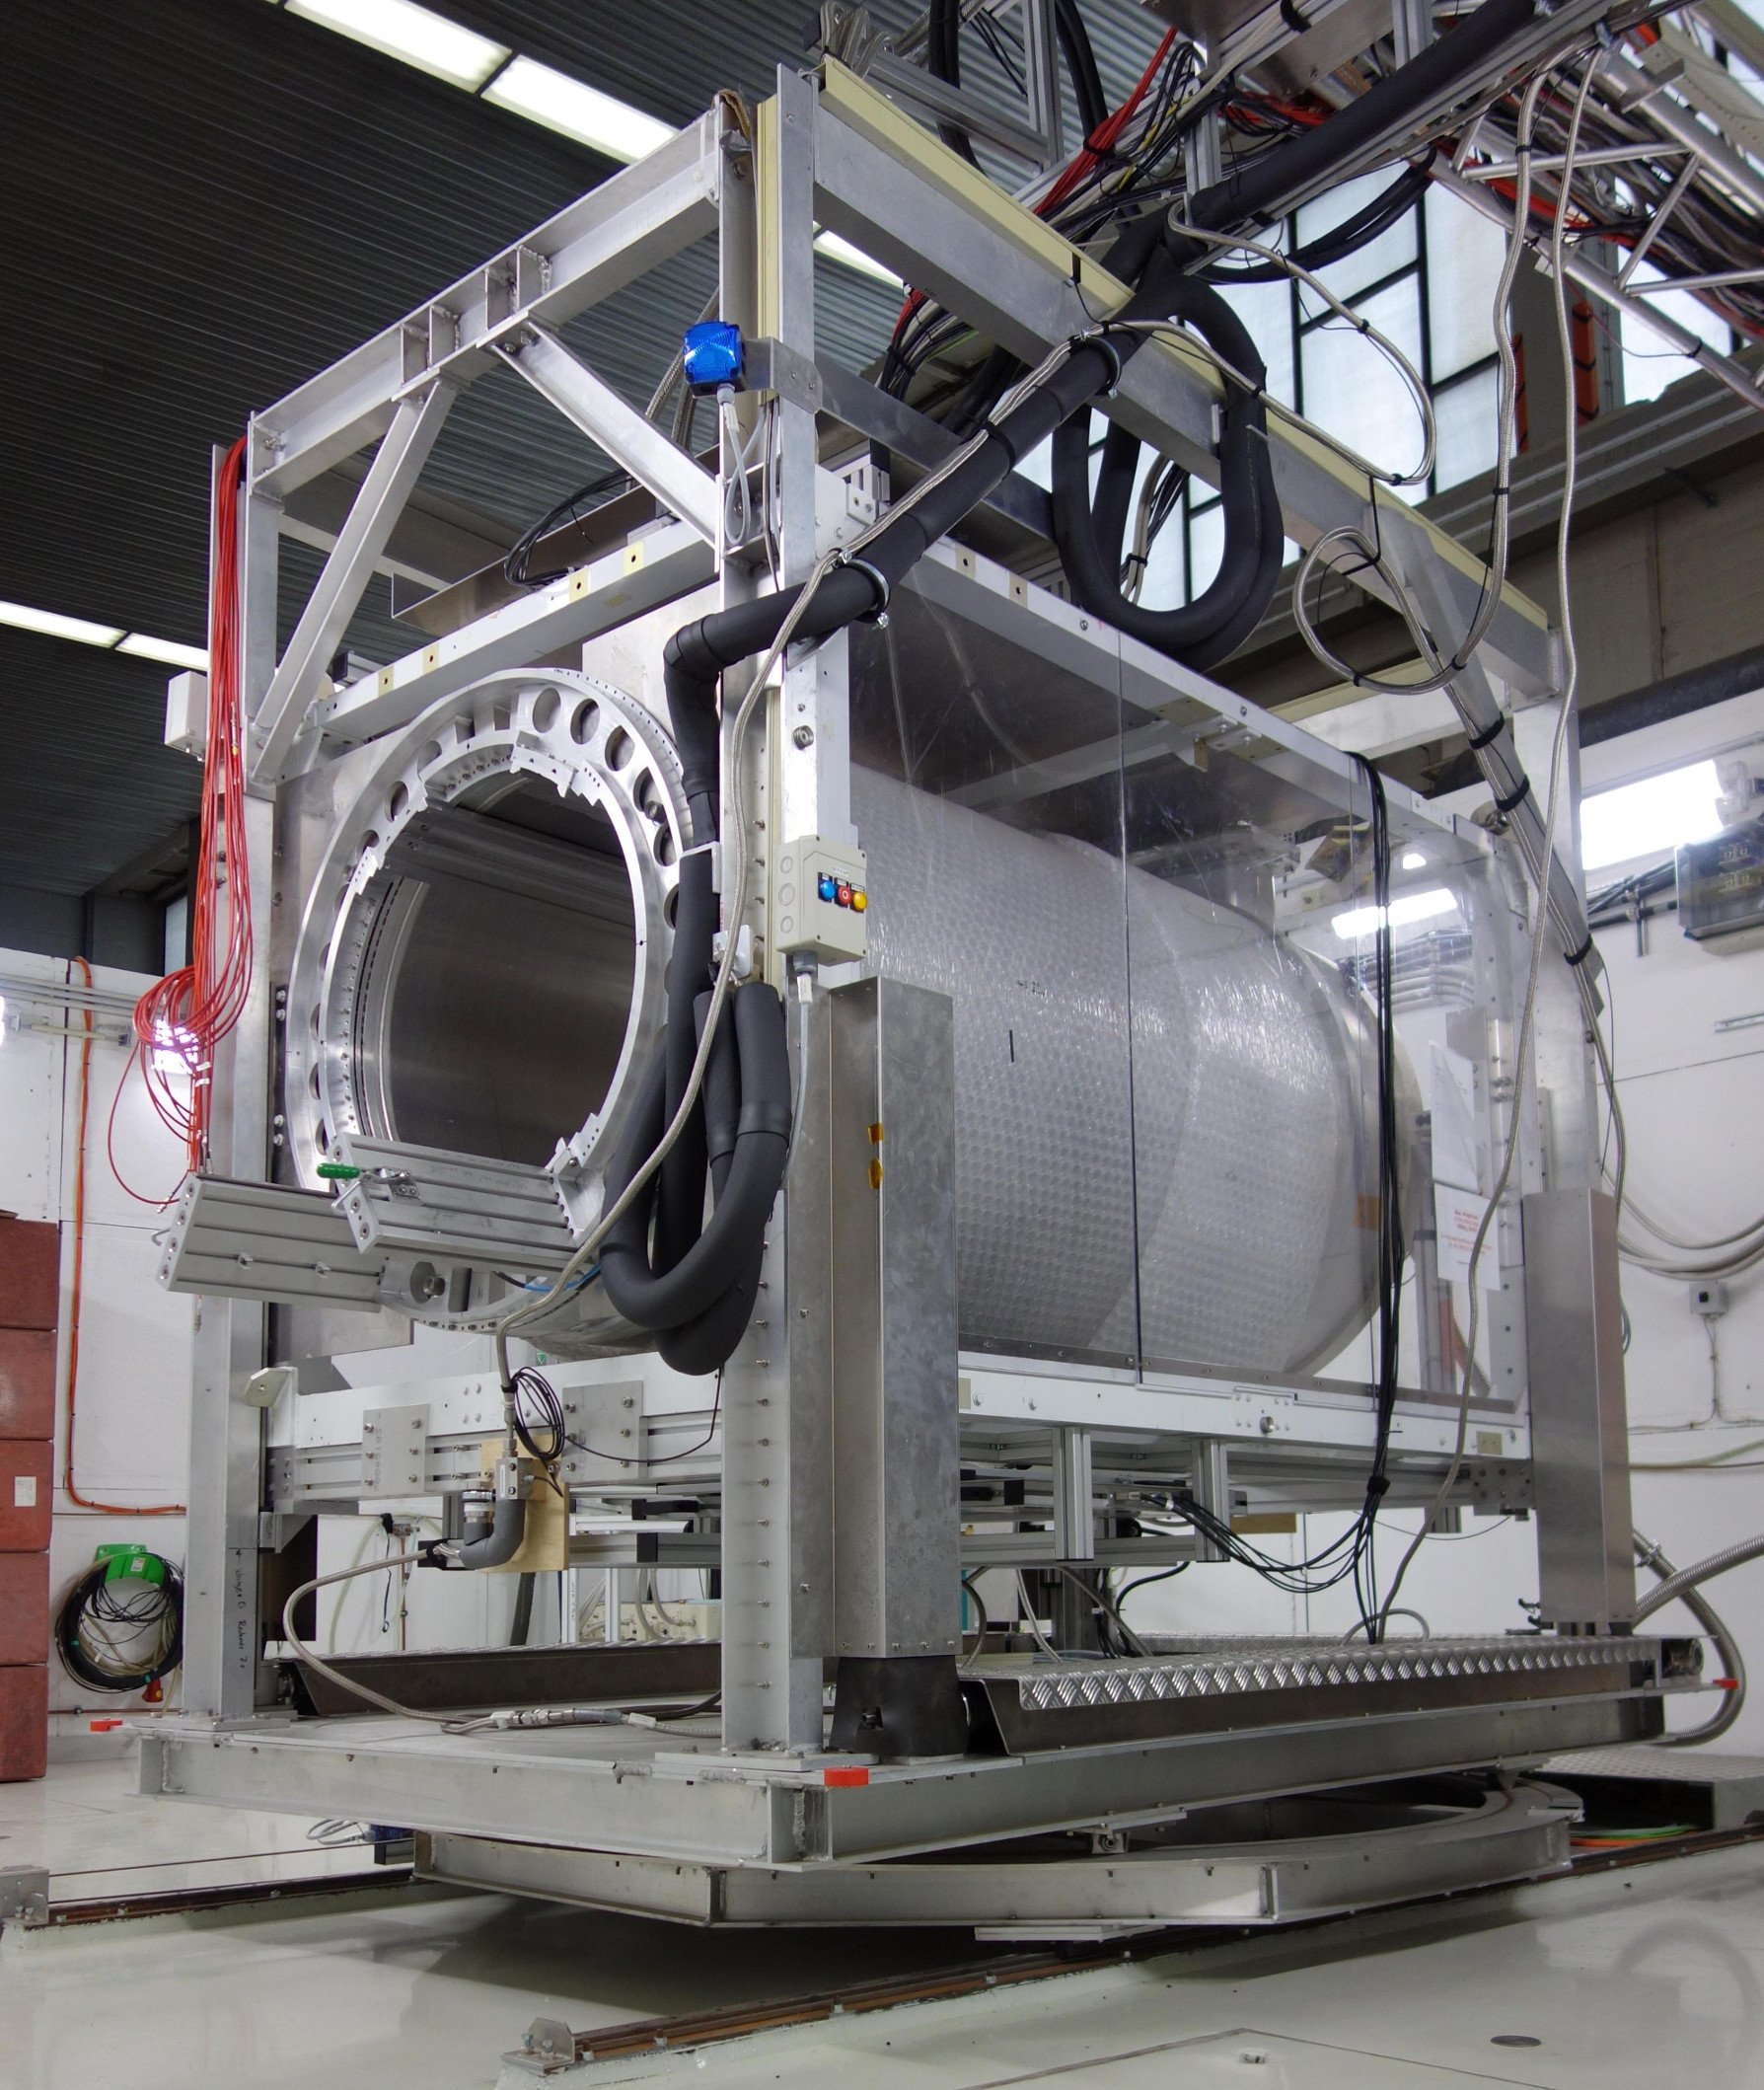
Due to its small radiation length of the coil and the comparably large bore, the PCMAG is well suited to be used in the test beam setup. Inside the PCMAG, a support structure has been installed. On this, detectors can be mounted on two rails and be moved along the direction of the magnet which is perpendicular to the test beam axis. This support structure is also necessary, since the inner wall of the magnet is not very robust and cannot hold heavy weights. The whole magnet is mounted in a remote controlled movable stage which provides horizontal and vertical movement perpendicular to the beam axis as well as rotations up to in the horizontal plane.
| Central Magnetic Field (operational) | |
| Central Magnetic Field (maximum) | |
| Operational Current at Field | |
| Coil Length | |
| Coil Diameter | |
| Radiation Length (wall including coil) | |
| Interaction Length | |
| Warm Bore Aperture | Ø length |
| Weight |
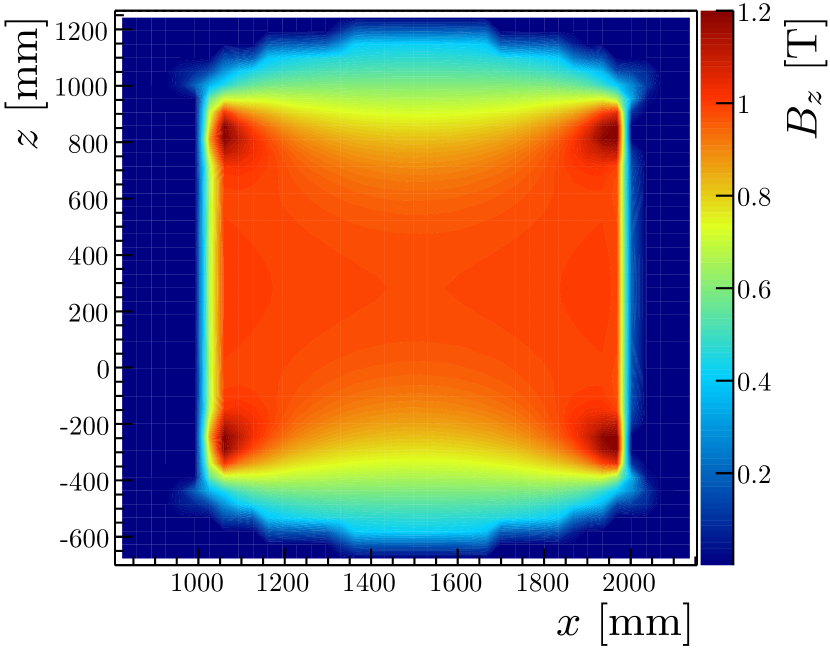
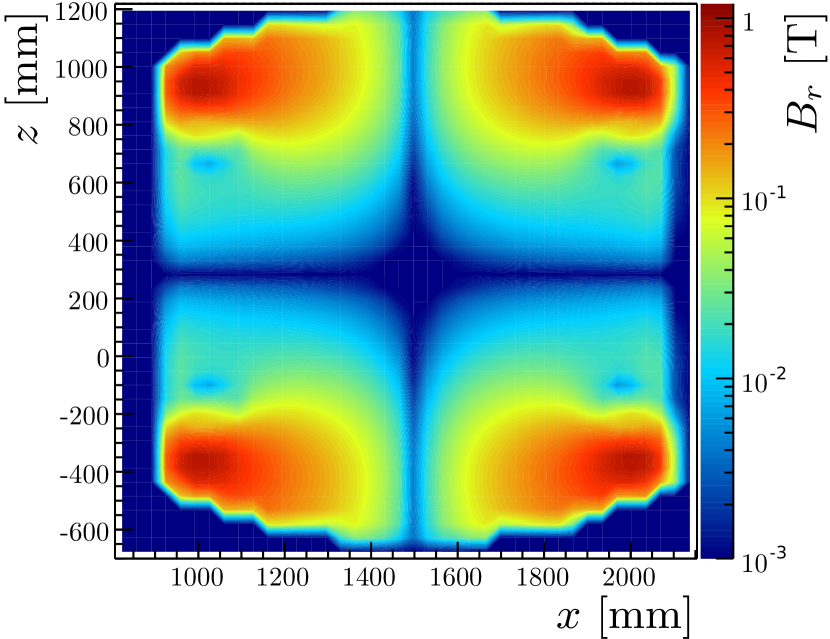
The field of the magnet was measured with support from CERN to a precision of a few [17]. These measurements resulted in a field map that can be used in correction and reconstruction software (Fig. 21 and [18]).
The cooling of PCMAG has been upgraded within the AIDA programme [2] from liquid Helium fillings to a commercial, closed circuit Helium compressor cooling system. This modification makes long, uninterrupted running periods possible, since it avoids internal pipe blocking by air introduced during liquid Helium re-filling. In addition, the PCMAG was modified to work with a continuously connected power supply instead of the previously used persistent current mode. This has increased the safety of the setup. Further, user groups gained more control over the setup, since they steer the magnet current by themselves.
6.3 EUDET-type Pixel Beam Telescopes
The DESY II Test Beam Facility is equipped with EUDET-type pixel beam telescopes which allow to track the test beam particles [20]. These kinds of test beam trackers were originally developed within the EUDET project [1] in order to meet most user requirements in terms of easy integration of the device under test (DUT), precise spatial resolution and suitable event rates.
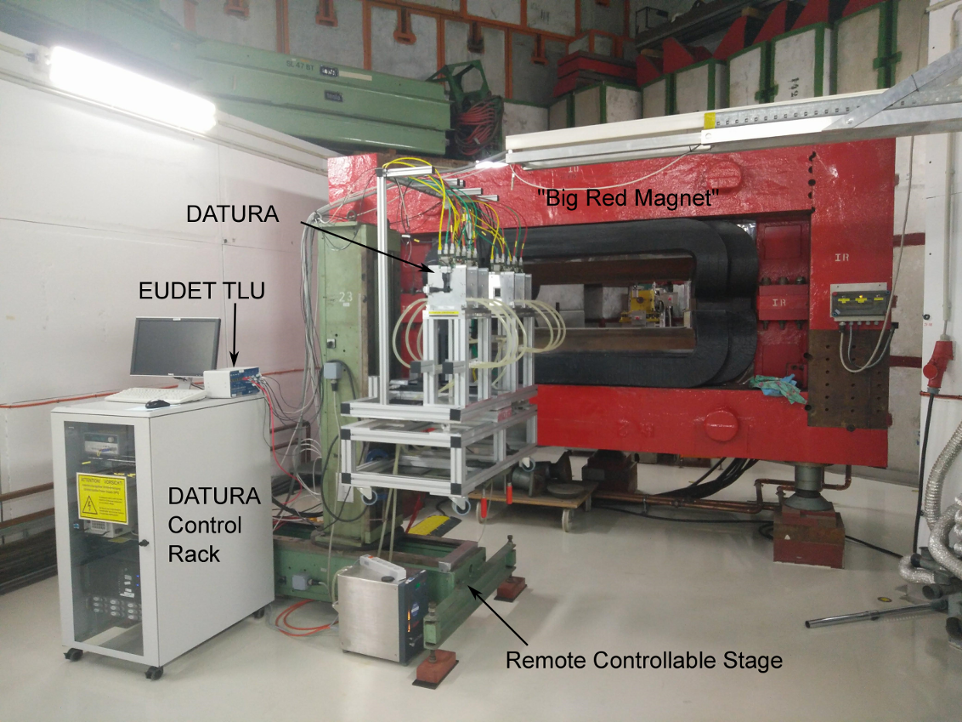
At the moment there are seven replicas worldwide located at CERN, ELSA, SLAC and DESY [21]. At the DESY II Test Beam Facility, the so-called DATURA telescope is installed in TB21 and the DURANTA telescope in TB22 (Fig. 22). In addition, a non-magnetic support frame is available to install one of the telescopes inside the PCMAG in TB24/1 (Sec. 6.2).
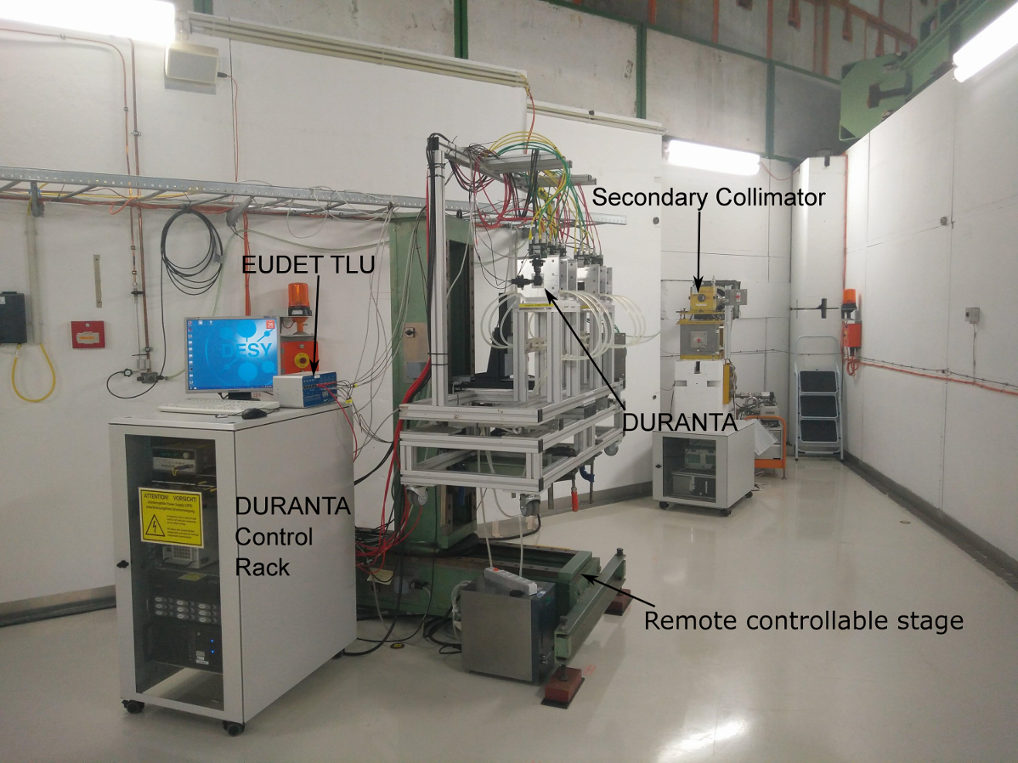
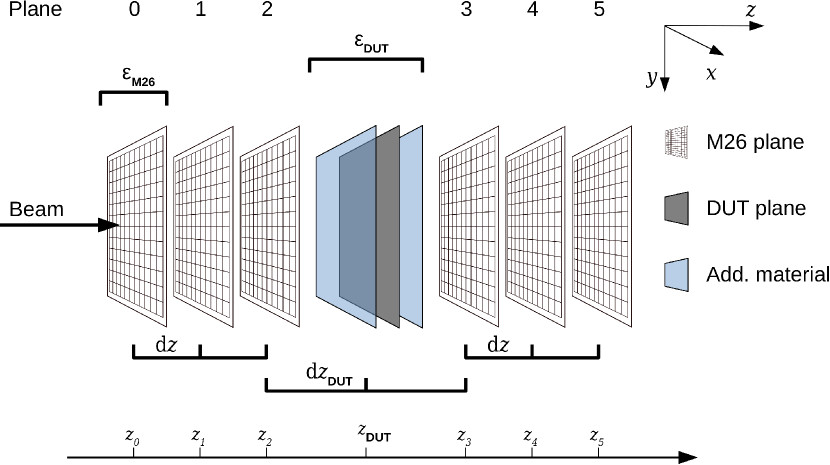
Each beam telescope is composed of two telescope arms incorporating each three planes. The standard telescope configuration is having the DUT incorporated by three telescope planes upstream and three telescope planes downstream. Each plane consists of a MIMOSA26 monolithic active pixel silicon sensor [22]. The pitch size is and pixels are arranged in 1152 columns and 576 rows, which results in an active area of about . Pixel states are continuously read out in a rolling shutter by buffering line by line, the on-chip digitization provides a binary pixel information, and the output data stream is zero-suppressed. Therefore, the integration time is per frame.
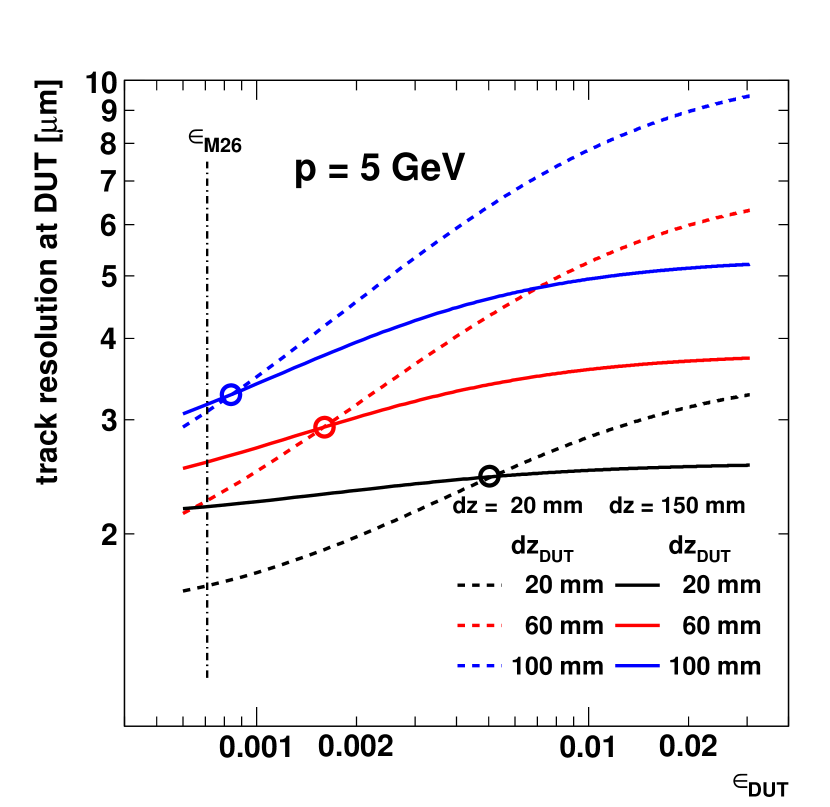
Each MIMOSA26 sensor has a thickness of silicon and is shielded from environmental light using thick Kapton foil on each side. This keeps the material budget as low as possible in order to achieve a high track resolution at 1-6 GeV/c at the DESY II Test Beam Facility. The intrinsic resolution of a sensor was measured to be [20]. The best track resolution is estimated to using an equidistant plane spacing of at a test beam. The realistic track resolution depends on the beam momentum, the plane spacing and the material budget of the DUT (Fig. 23(b)).
A EUDET Trigger Logic Unit (TLU) [7] provides timestamp information on a particle passage through four trigger devices in coincidence. Two trigger devices are located in front of the first telescope plane and two of them behind the last plane. Each trigger device is built up by a thick and scintillator matching the MIMOSA26 sensor area and attached to a photomultiplier tube. The TLU and the DAQ of the MIMOSA26 sensors communicate in a handshake mode, so that if the TLU asserts a trigger, the MIMOSA26 DAQ raises a busy signal during readout of the frame. Additional sensors or DUTs can be integrated in the same way or in a no-handshake mode only accepting triggers.
The entire hardware is integrated in the EUDAQ data acquisition framework which merges data streams of all components as event-based data. EUDAQ version 1 works for synchronous DAQ systems requiring one event per trigger. Thus, the trigger rate is limited by the slowest device. Running only the telescope without any DUT results in an event rate of at a test beam particle rate of about [23]. Users can integrate the DAQ of their DUT by writing a EUDAQ component which matches a defined interface.
DUTs are mechanically integrated between the two telescope arms at a -, -, -stage system providing a \micron-precision. This allows a geometrical scan of the DUT response in respect of the particle tracks, which is larger than the active area of the telescope. The DAQ PCs can be accessed from the huts via a local network connection and the data acquisition can be monitored with the EUDAQ online monitor.
7 Performance Measurements
The performance of the DESY II Test Beam Facility is determined by various measurements considering the time structure of the test beam particles (Sec. 7.1), the various rate dependencies (Sec. 7.2) and the particle momentum calibration and spread (Sec. 7.3). The results are dependent on the operation mode and the performance of the DESY II synchrotron (see Sec. 2) as well as the settings of the beam line components (see Sec. 3). The results are in a good agreement with the results performed by simulations (see Sec. 8.4). All measurements were performed when DESY II was operated at unless indicated otherwise.
7.1 Timing Structure
The timing structure of the test beam depends on the performance and the operation mode of the DESY II synchrotron. Three characteristic cycles have to be considered:
7.1.1 PETRA III Top-up
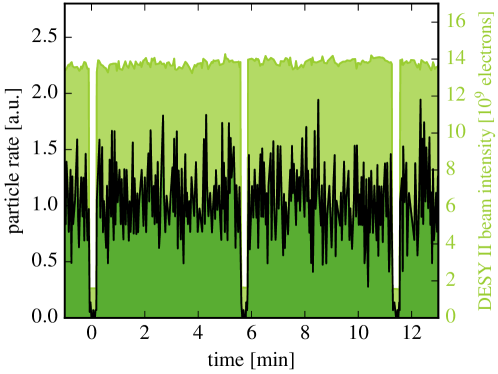
Every few minutes the DESY II synchrotron provides beam to the PETRA III storage ring if the beam lines at PETRA III are operated. During that PETRA III top-up, the beam intensity inside DESY II and therefore the particle rate of the test beam drop significantly for few seconds (Fig. 24). The exact timing of this cycle depends on the running mode of PETRA III.
7.1.2 DESY II Cycle
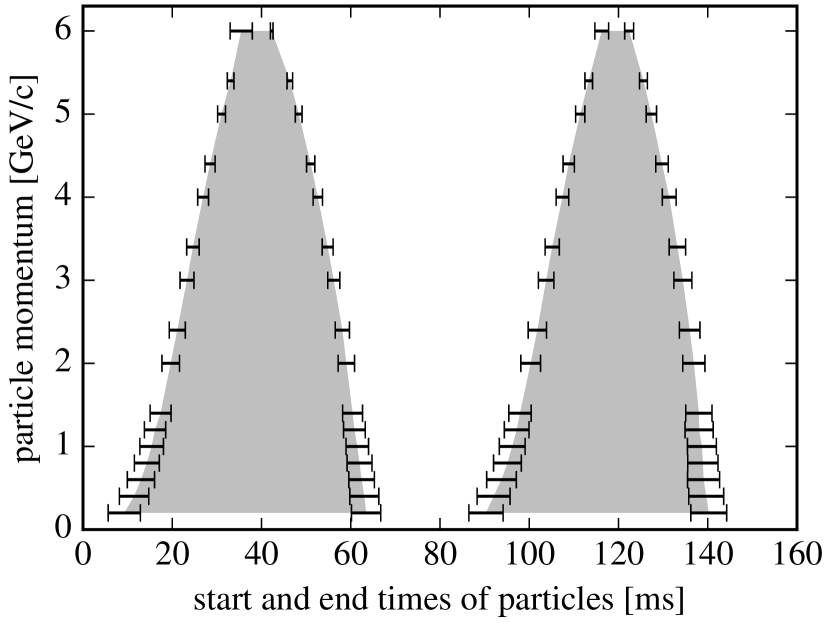
The DESY II synchrotron continuously cycles its magnets using a sinusoidal curve with (see Sec. 2 and Fig. 3), which affects the particle momentum and the timing structure of the test beam. Only for times when the DESY II energy is higher than the selected particle momentum, test beam particles with the momentum selected by the users can reach the area. Hence the actual DESY II energy is the upper cycle-dependent limit for the momentum of the test beam particles available for the users.
Thus, within one DESY II cycle or two magnet cycles (), there are dedicated start and end times: Within these periods test beam particles are available (Fig. 25(a) to 25(c)) and the period is the shorter the higher the selected particle momentum (Fig. 25(d)). In addition, due to beam losses in DESY II during traversing at the particle occurrence is lower within the second magnet cycle than within the first (see Fig. 3).
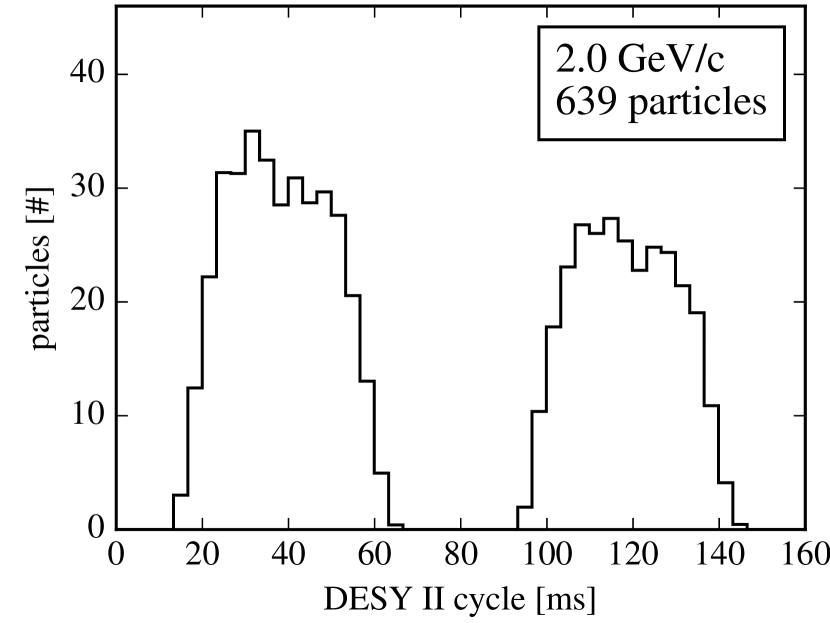
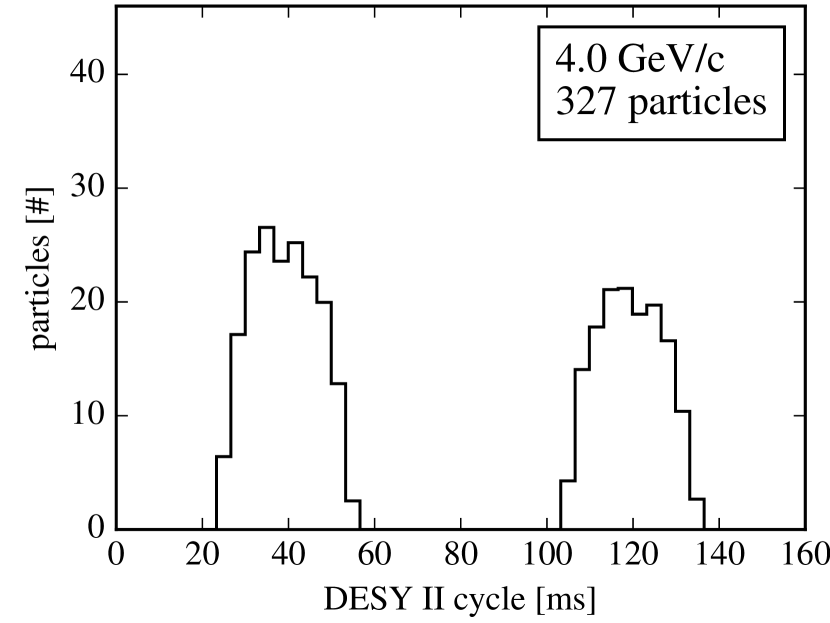
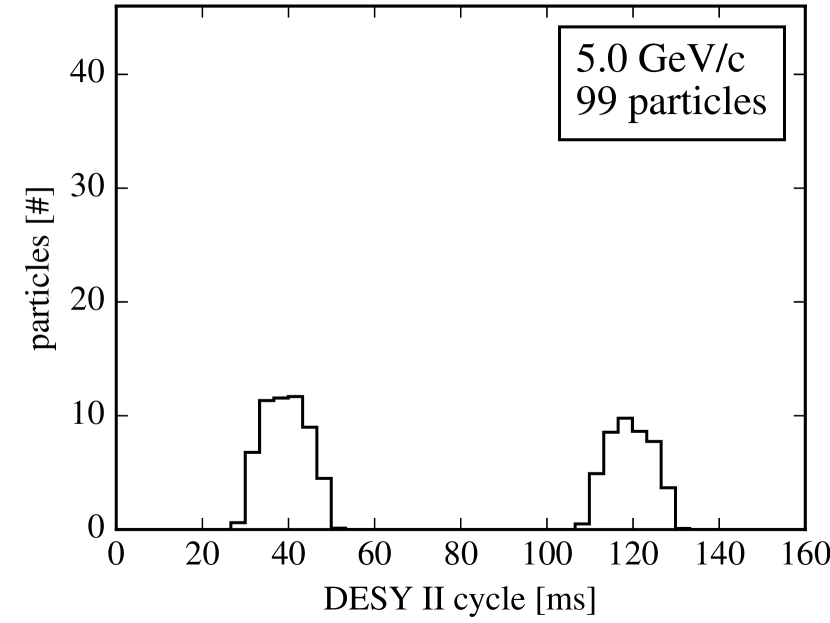
The measurements were performed by using the DESY II injection signal as the trigger input. For each selected momentum, multiple time series were recorded with an oscilloscope and the distributions were extracted by using the internal histogram function. The total particle numbers given in Fig. 25(a) to 25(c) were normalized to the absolute effective rate at which was measured at the same time (see Fig. 28(c)). The start and end times as well as their uncertainty were extracted by calculating the weighted mean and RMS of the first or last of the total events of one single measurement.
7.1.3 DESY II Bunch Cycle
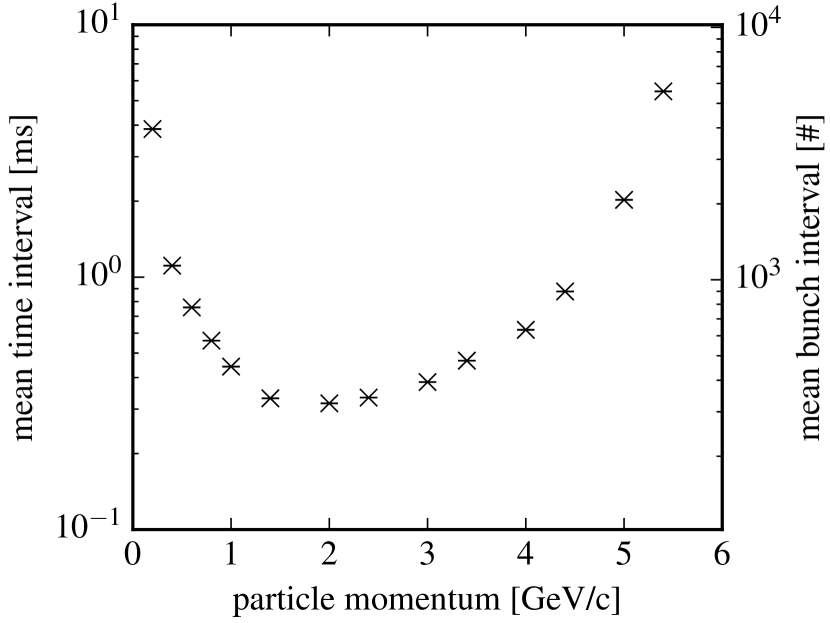
A DESY II bunch hits the primary target every . This time structure can be resolved by measuring the time or bunch intervals between consecutive test beam particles: The distributions (Figs. 26(a) to 26(c)) show that an interval in the order of or is most likely with nearly occurrence, and that the minimum occurs for one DESY II bunch cycle with below occurrence. By calculating the distribution’s mean of the particle interval, the dependence on the particle momentum is in accordance to the effective rate measurements (see Sec. 7.2.2). For example, test beam particles at are measured every or every on average (Fig. 26(d)).
In addition, the distributions in Figures 26(a) to 26(c) resolve the DESY II cycle structure at time intervals between 20- (Sec. 7.1.2), and the PETRA III top-ups below which happened during this measurement (Sec. 7.1.1).
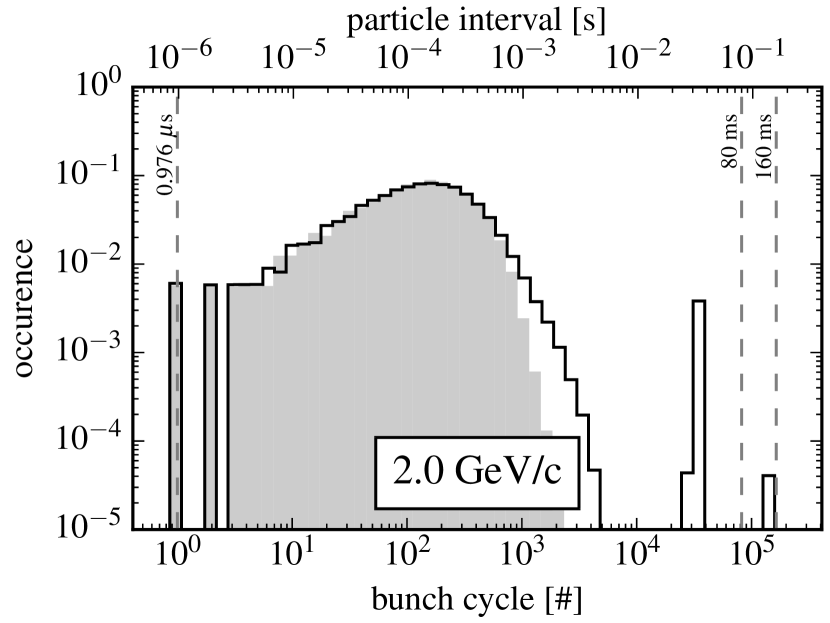
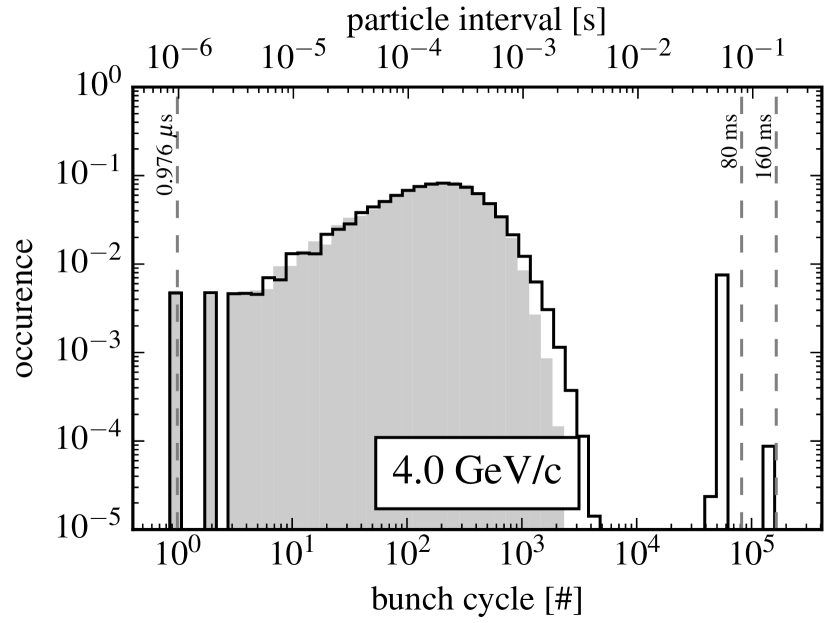
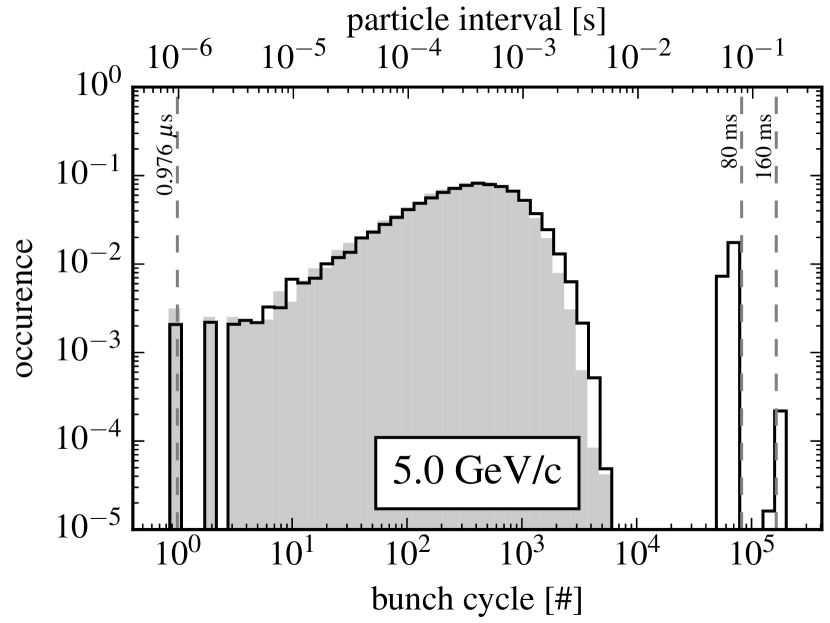
From this distribution, the probability of multiple test beam particles per bunch cycle can be directly estimated. The measured distribution of particle intervals can be well described by assuming that the probability for particles per bunch underlies a Poisson distribution
with and which is the maximum bin content ignoring the DESY II cycle structure and PETRA III top-ups described in the previous sections. For intervals below the maximum the measured distributions are well described by time intervals underlying this model which is depicted by the gray area in Figs. 26(a) to 26(c). As an example the probability for more than one particle per bunch is at applying this estimate.
Measurements were performed by using the beam monitor system as the trigger signal and using this as the trigger input for the AIDA TLU (trigger logic unit). The time resolution of the measurement setup is in the order of the bunch length of . Thus, a bunch structure cannot be resolved by this measurement. Multiple measurements were performed by selecting different particle momenta and each measurement includes approx. . The time differences of consecutive trigger signals representing consecutive particles were determined by the corresponding timestamps of the clock of the TLU, and were used for calculating the distributions. The total counts of each distribution were normalized to one.
7.2 Rate Dependencies
The test beam rates measured in the individual beam areas depend on the DESY II beam intensity (Sec. 7.2.1) and on the setting of each beam line components like
-
1.
the magnet current and therefore the selected momentum (Sec. 7.2.2),
-
2.
the primary target position (Sec. 7.2.3),
-
3.
the material and thickness of the secondary target (Sec. 7.2.4), or
-
4.
the opening of the primary collimator (Sec. 7.2.5).
They are equally dependent on the measurement setup including active areas, thresholds or on the position in the beam area. Thus, relative rates are primarily presented in this section, in order to demonstrate the influence of each component on the particle rate.
Since the rate strongly depends on the DESY II timing structure (Sec. 7.1) and therefore on the time window of the measurement, additionally all of the following results are based on effective rate measurements integrated over excluding periods with PETRA III top-up operations unless indicated otherwise. By counting the coincidence signal of two scintillators the rate is calculated and normalized to the corresponding value of the DESY II beam intensity in order to take into account smaller fluctuations. For each individual setting, the effective rate was measured three times in order to derive the mean and the RMS.
7.2.1 Rate Dependence on the DESY II Beam Intensity
As already indicated in Section 7.1.1, the test beam rate strongly depends on the DESY II beam intensity. Figure 27 shows that the dependence is nearly linear.
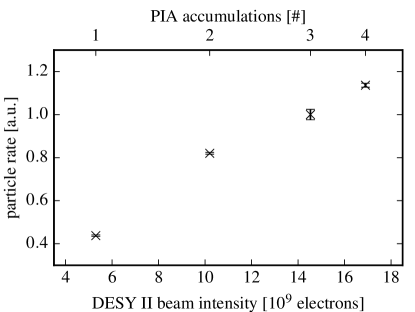
In this measurement, the bunch size, and therefore the DESY II beam intensity, was varied by the different number of bunch accumulations in PIA before the injection to DESY II (see Sec. 2). The test beam rate was measured by using the first two telescope scintillators in coincidence in TB21 and the DESY II beam intensity was measured by the intensity monitors. The rate was normalized to the corresponding DESY II beam intensity value of electrons or three accumulations in PIA for this measurement. Typically, three PIA accumulations are used for routine operation.
7.2.2 Rate Dependence on the Particle Momentum
The most important result for experimental groups using the test beam is the rate dependence on the particle momentum. Thus, for this measurement an absolute particle flux —rate per detection area— is given on the right -axis (Fig. 28). The highest rate is measured for at each beam line. The shape of the curve is mainly caused by the beam line geometry and the bremsstrahlung spectrum after the primary target (see Fig. 32): The rising slope for momenta smaller than can be explained by the fixed geometry of the beam line and increasing scattering for low momenta. The falling slope for momenta larger than is explained by the decreasing bremsstrahlung spectrum for higher momenta with the upper limit of the maximum DESY II energy . As already mentioned above, this measurement is directly correlated to the result shown in Fig. 26(d). The momentum spread of each selected momentum is discussed in Sec. 7.2.5.
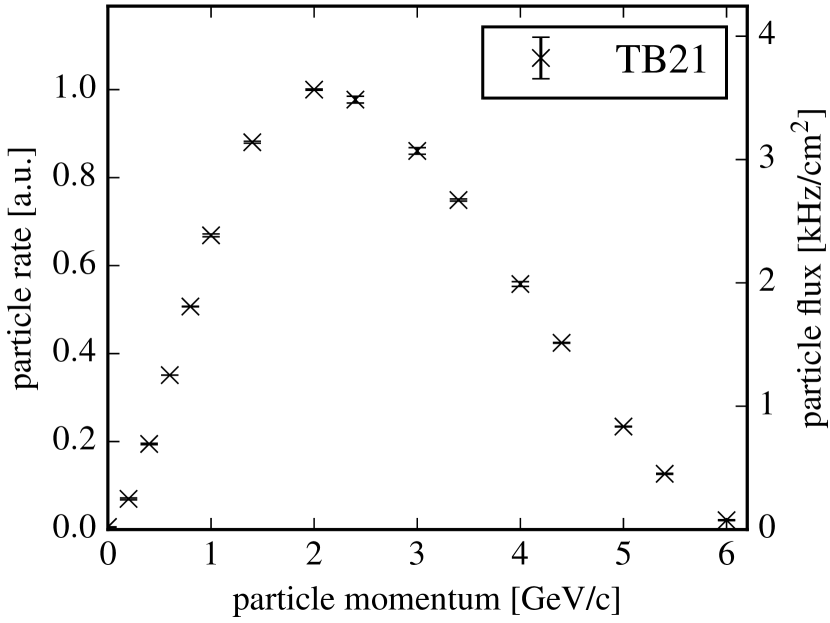
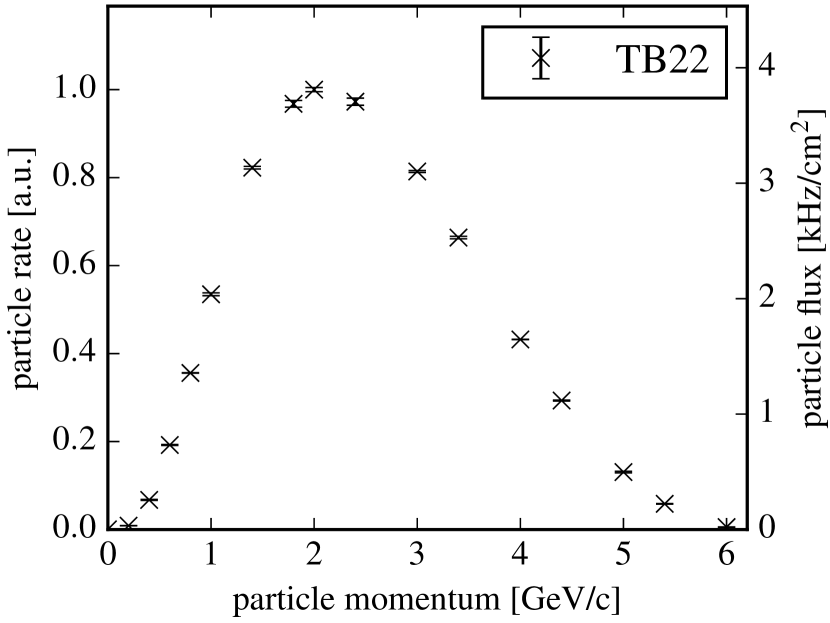
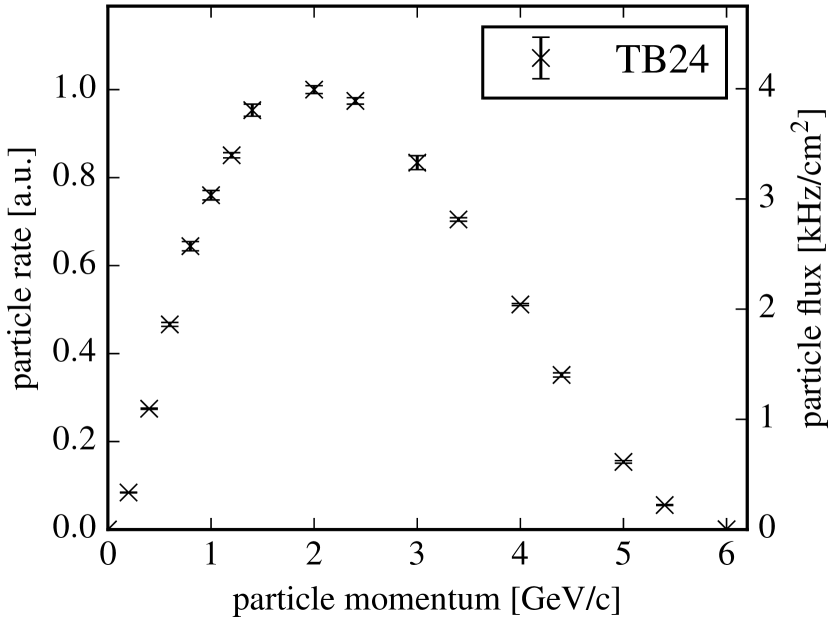
For these measurements, the selected particle momentum was varied by the corresponding magnet currents (see Tab. 3). For each measurement the corresponding primary collimator was symmetrically opened in each direction by . The detailed measurement settings for all three beam lines can be found in Tab. 5 and were chosen as similar as possible.
| Setting | TB21 | TB22 | TB24 |
| Fiber position [mm] | -14.0 / 16.0 | -23.0 / 7.0 | -19.8 / 10.2 |
| Copper target [mm] | 5.0 | 5.0 | 4.0 |
| Lead collimator [mm2] | (not needed) | ||
| Scintillator area [mm2] | |||
| Scintillator position | DATURA | DURANTA | beam monitor |
7.2.3 Rate Dependence on the Primary Target Position
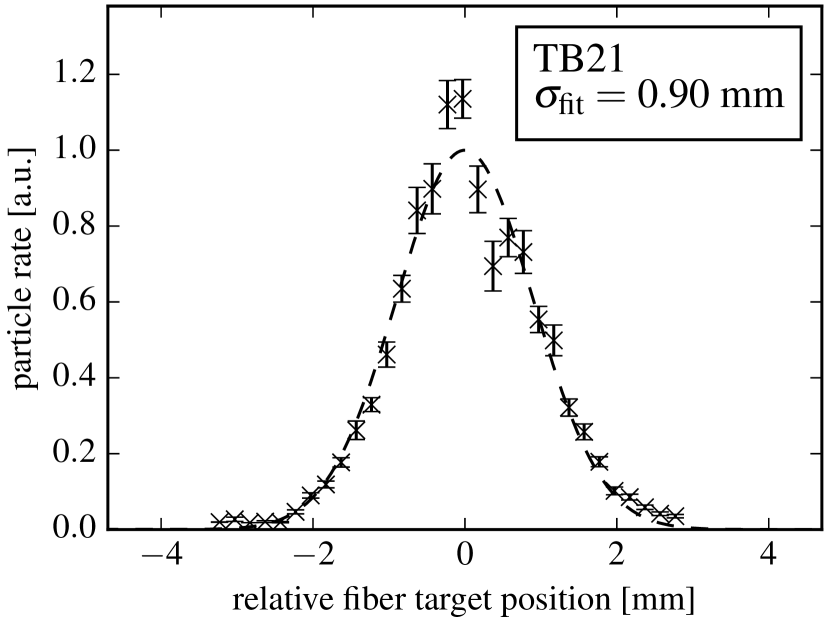
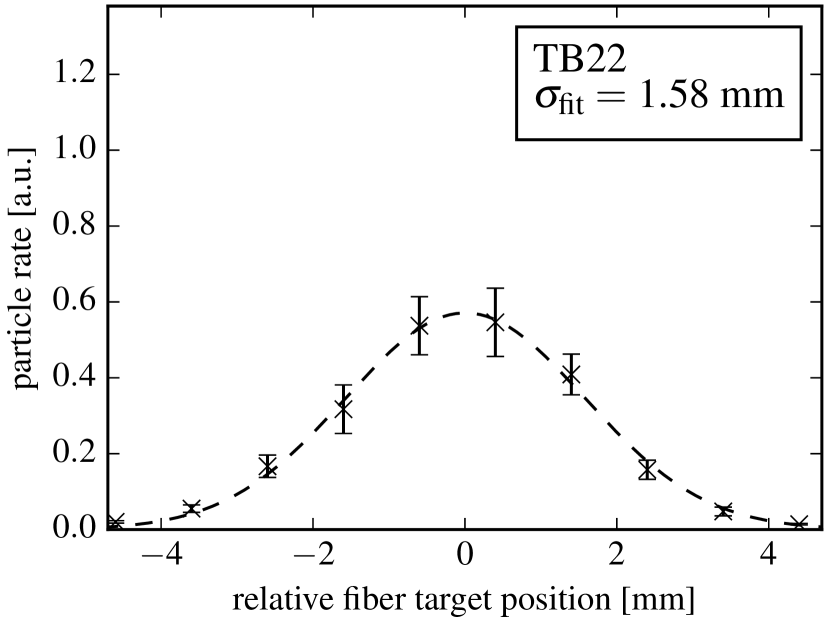
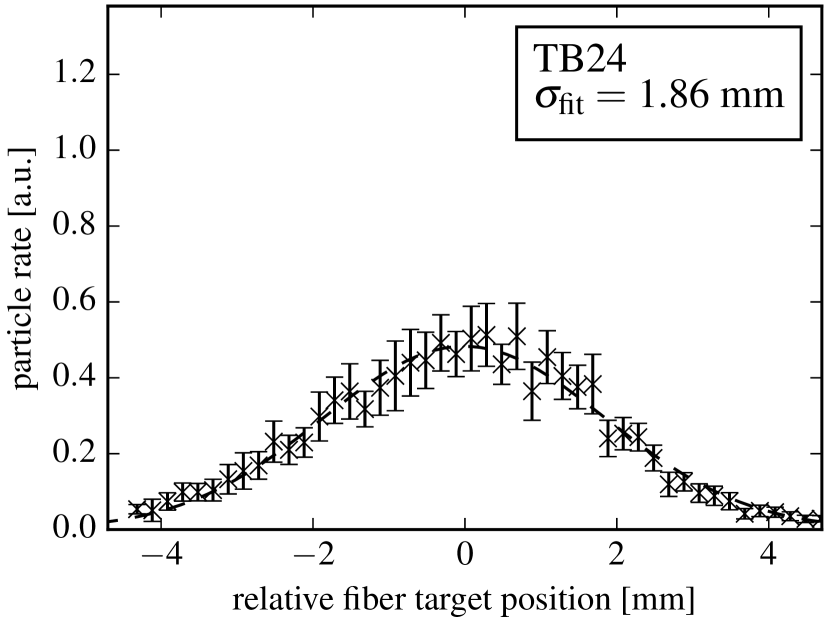
As discussed in Sections 7.1.1 and 7.2.1 the beam rate strongly depends on the DESY II beam intensity or more precisely on the number of DESY II beam particles hitting the thick fiber positioned in the beam orbit (see Sec. 3.1). This is given by the beam profile of each bunch traversing the fiber target. By measuring the rate for various positions on the axis being perpendicular to the DESY II beam axis the beam profile can be determined. By performing such a horizontal position scan the measurement provides a one-dimensional vertically integrated beam profile. Due to expected fluctuations of the absolute bunch position between different cycles the measurement indicates an effective beam profile including all statistical uncertainties for the time of the measurement date.
Figure 29 shows the effective vertically integrated beam profiles at the primary target positions of TB21, TB22 and TB24. The particle rate was measured by using the beam monitor data from the machine control system (Sec. 4.1.2 and 4.3) and a test beam magnet current corresponding .
The effective horizontal beam width at these positions is defined as two times of the Gaussian standard deviation after performing a fit to the data. Statistical uncertainties are conservatively estimated to be since the RMS shows the same value in this interval which indicates a normal distribution. For this measurement, this results in the following effective horizontal beam widths of DESY II at the corresponding primary target positions:
-
1.
for TB21:
-
2.
for TB22:
-
3.
for TB24:
In addition, each profile is normalized by the total integral of the TB21 profile which indicates the relative rate differences by the fiber target position of the individual beam lines. The difference of the profile shape or its Gaussian width is explained by the shape of the DESY II electron bunch at the locations of the fiber targets: The bunch is broadened in the horizontal direction after the fiber position of TB21.
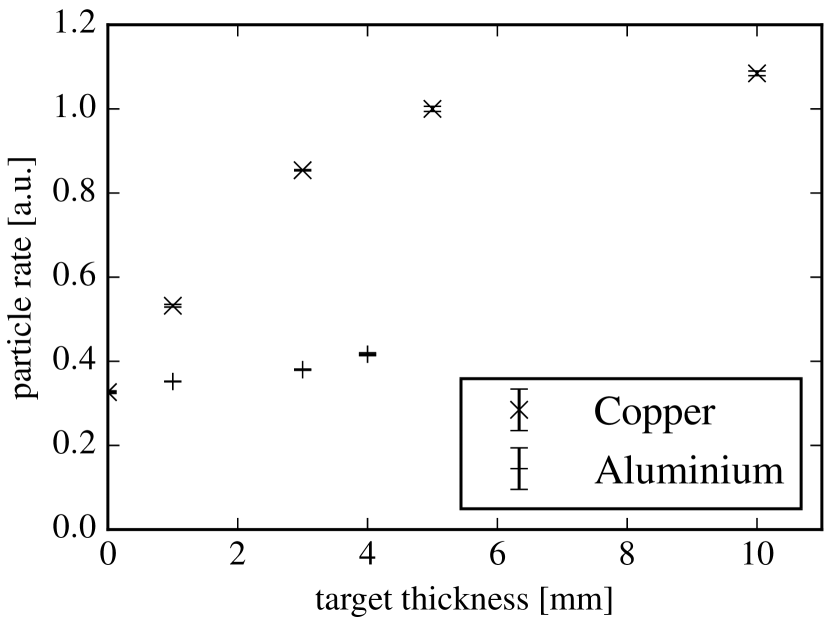
7.2.4 Rate Dependence on the Secondary Target
The conversion from GeV photons to leptons is dominated by the electron-positron pair production in the nuclear field. The conversion probability depends on the material which can be scaled by the radiation length [24, e.g.]. Thus, the beam rate is higher for copper targets than for aluminum ones (Fig. 30(a) and see Sec. 8.2).
Without any target inside the beam line the test beam particle are generated by a thick aluminum window which is installed right behind the primary target at the DESY II beam line. This explains the non-zero rate with no secondary target inside the beam axis (Fig. 30(a)). The saturation is mainly explained by scattering processes which increase the radiation angle with thicker material. For this measurement, the secondary target was varied by the possible selections for TB22 (see Tab. 1).
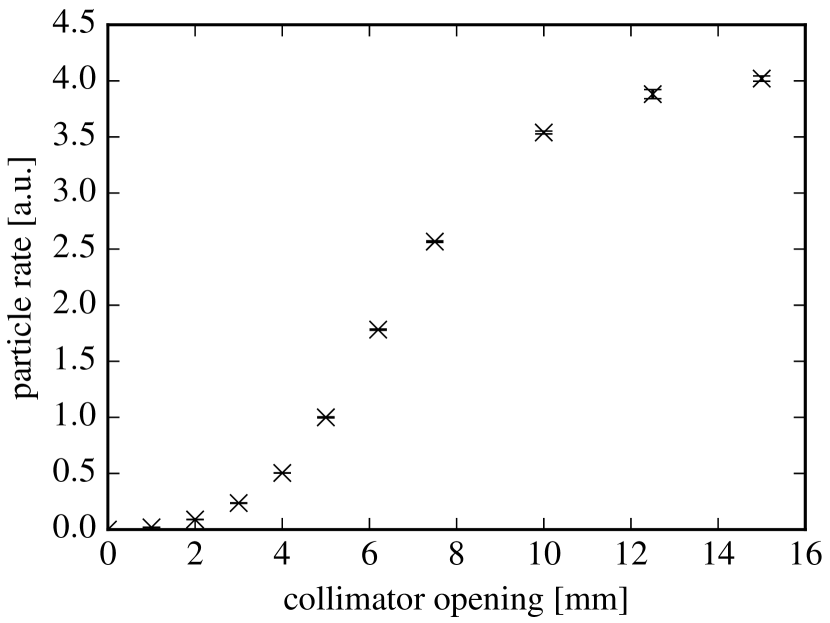
7.2.5 Rate Dependence on the Primary Collimator
The primary collimator (see Sec. 3.4) is the first beam line component shaping the spatial test beam profile behind the magnet for the momentum selection. The wider the opening in one direction is, the higher the rate, and the saturation at a wide opening indicates the shape of the test beam profile (Fig. 30(b)). For this measurement, the opening of the first collimator at TB22 was symmetrically varied in all four directions from 0 to (Sec. 3.4).
7.3 Particle Momentum
The particle momentum is set by the user via the corresponding current in the test beam magnet (Sec. 3.3). Detailed knowledge of the particle momentum and spread is essential for the analysis of the test beam data. In this section measurements of the particle momentum without using the information from the test beam magnet are shown.
7.3.1 Calibration
The verification of the momentum calibration for TB21 was performed both in 2013 and in 2016 [25, 26]. Measurements were performed to investigate the momentum spread and its spatial dependence.
For this measurement, the Big Red Magnet in TB21 (Sec. 6.1) was used as a spectrometer magnet, deflecting the particles dependent on their momentum. The DATURA beam telescope (Sec. 6.3) was split into two sets of three sensor planes each, one measuring the particle angle in front of and one behind the magnet. With this technique, the deflection angle for each particle could be measured. From the measured deflection angles of multiple particles, the mean and the width of the angular distribution is extracted.
To reconstruct the momentum, a simulation of the propagation of the positrons inside the magnet was developed, based on the field map of the Big Red Magnet (Fig. 19). Hence, for any measured angular distribution, the momentum input of the simulation is varied such that the simulated deflection angle matches the mean of the measured distribution. Similarly, the momentum spread is derived from the width of the deflection angle distribution.
Due to the good resolution of the MIMOSA26 sensors (Sec. 6.3), the uncertainty of the angle measurement of about is lower than the nominal angular width induced by multiple Coulomb scattering in air of about for . The width measured for a non-deflected beam, representing the multiple scattering and measurement uncertainties, is quadratically subtracted from the measured widths for deflected beams.
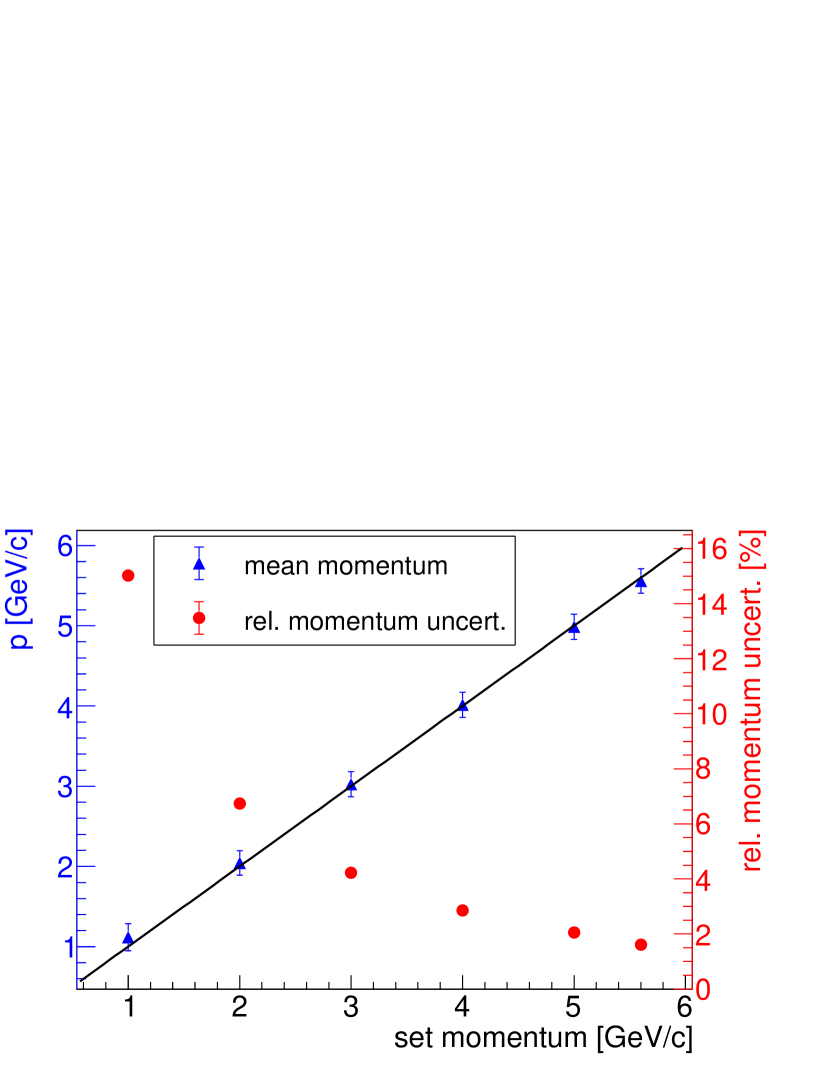
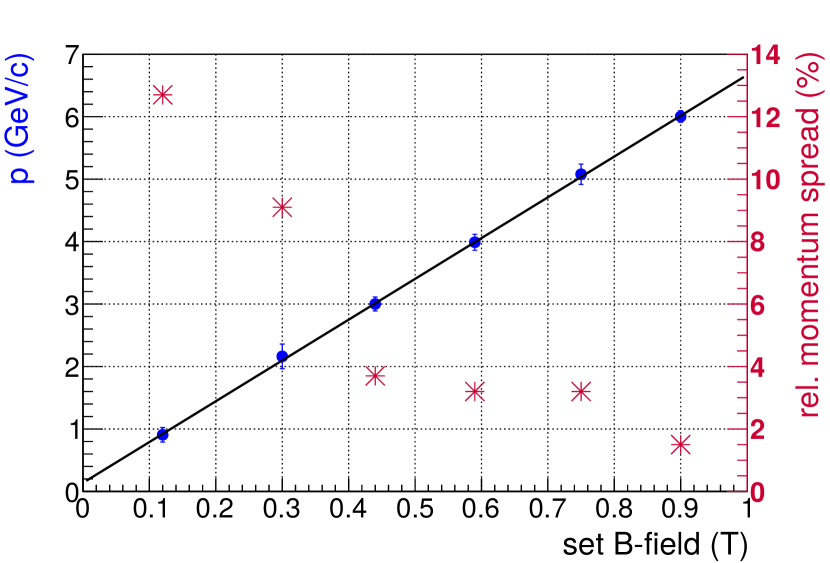
Figure 31(a) shows the results of the momentum calibration, with the blue markers showing the measured momentum of the particle beam and its momentum spread. The black line represents the set values for the momentum according to Table 3. It is clearly visible, that the measured momentum distributions fit well to the nominal values.
7.3.2 Spread
For many measurements a detailed knowledge of the momentum spread is a key ingredient to achieve the best possible track resolution. The absolute momentum spread is found to be constant at over the full momentum range for horizontal collimator openings of (primary) and (secondary). Hence, the relative momentum spread decreases for larger momenta as shown in Figure 31(a).
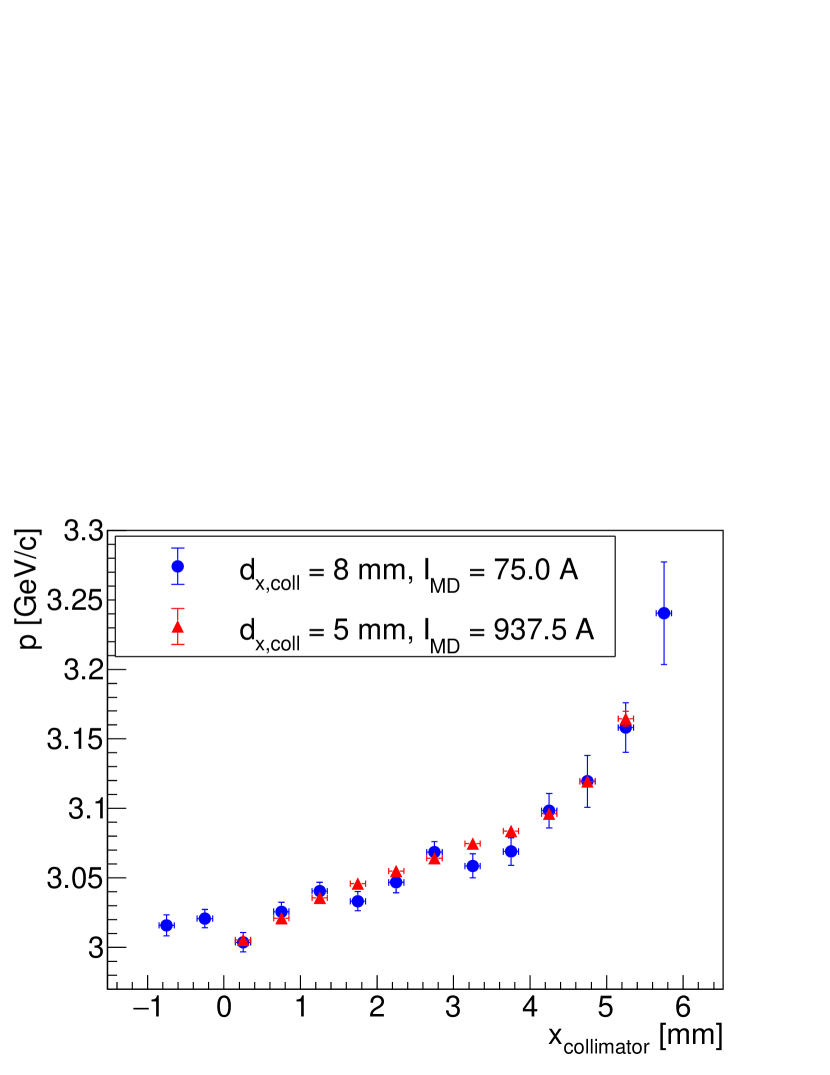
Since the particle momentum is selected by the test beam magnets with a vertical field (Sec. 3.3), a dependence of the particle momentum on the horizontal position inside the beam is also expected. In order to understand the horizontal momentum distribution, the momentum spread can be spatially resolved by including the particle position determined by the beam telescope (Sec. 6.3). Especially for larger devices this can be necessary to apply the appropriate corrections. This measurement is performed by extrapolating the measured track in the upstream telescope arm to the position of the secondary collimator and then combining the deflection angle and the particle position. Evaluating the mean particle momentum as described above, the expected behavior of the momentum as a function of the position can be extracted, as shown in Figure 31(b). The two measurements show the dependency for two different openings of the secondary collimator at different currents of the Big Red Magnet and demonstrate its reproducibility.
8 Simulations
To further understand and optimize the beam lines of the DESY II Test Beam Facility, a simulation package has been developed which simulates the entire test beam line from the beam generation in the DESY II synchrotron to the test beam area. The simulation is based on the SLIC simulation package [27], which is a Geant4 [9, 10, 11] simulation toolkit using the LCIO file format [28]. Although the simulation package can be adapted to simulate all three test beam lines, so far only TB21 has been simulated in detail.
In the following, the simulation results for the bremsstrahlung photon generation in the primary target, the pair production in the secondary target, and the final momentum selection and collimation of the test beam are shown. The details on the simulation tool as well as on the full simulation study of TB21 can be found in [29].
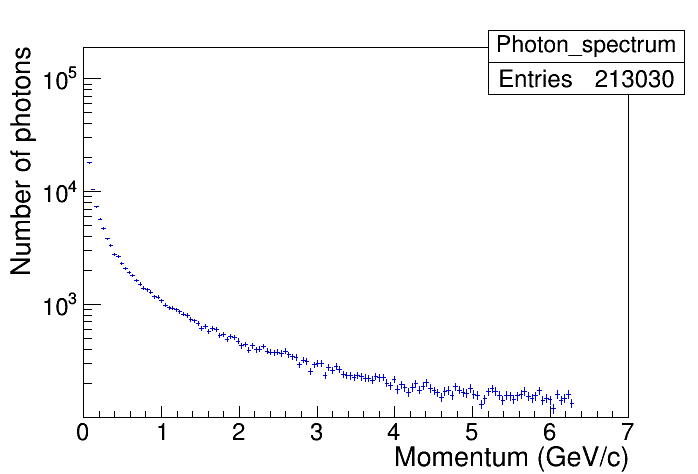
8.1 Test Beam Generation in the Primary Target
The first simulation step is the DESY II beam bunch consisting of 1010 electrons or positrons hitting a primary target placed directly in the DESY II beam pipe. When the simulated DESY II beam bunch hits the carbon fiber target, bremsstrahlung photons are emitted. Their momentum distribution, which follows the characteristic dependency of bremsstrahlung spectra, is shown in Figure 32. The generated photons exit the beam pipe tangentially to DESY II. Further test beam line components are placed alongside the beam path of the bremsstrahlung photons. It is important to note that the DESY II beam energy was fixed to and does not account for the sinusoidal DESY II magnet cycle (see Sec. 3).
8.2 Secondary Target
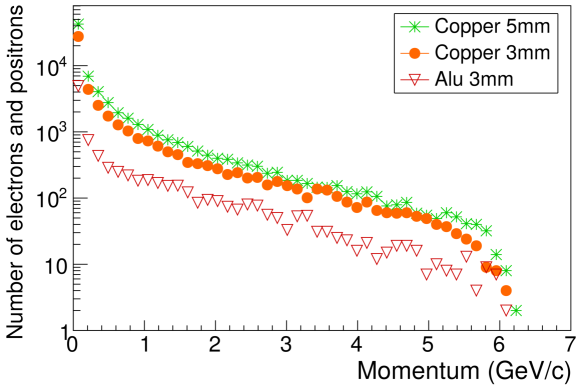
In the secondary target, the bremsstrahlung photons are converted to electron-positron pairs. As the cross section for pair production is dependent on the material and the target thickness [24], the rate of the test beam depends on the choice of the secondary target. The test beam users can choose from a set of different converter plates consisting of aluminum and copper of various thicknesses. The most commonly used converter target is a copper plate with thickness, as it yields the highest particle rate. The test beam simulation presented in the following sections assumes this target choice.
Figure 33 shows the comparison between the numbers of electrons and positrons simulated after the conversion of photons in the different converters. Copper targets yield higher pair production rates than the aluminum targets, and the thicker the material, the more photons are converted into electron-positron pairs (see also Sec. 7.2.4).
8.3 Test Beam Energy Selection and Collimation
The electron-positron pairs (converted from the bremsstrahlung photons in the secondary target) enter the test beam magnet through an evacuated beam pipe, about behind the converter plate. In the magnetic field of the dipole magnet, the electrons and positrons are separated by charge and momentum such that the beam is spread into a particle fan in the -plane. Neutral particles, such as unconverted photons, are not deflected in the magnetic field and stay on their initial path (in the case that they are not scattered or stopped). They leave the test beam magnet centrally through the exit beam pipe.
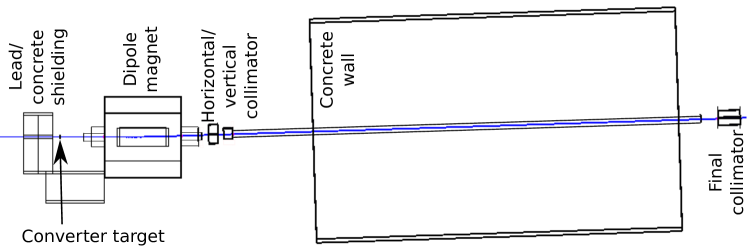
To separate the neutral particles from the desired electrons and positrons of the final test beam, the beam pipe has a small kink shortly after the test beam magnet. All subsequent components of the test beam line are positioned along this new beam path. Only charged particles with the desired momentum enter the subsequent beam line components. The particle momentum is Gaussian distributed, where the mean value belongs to the particles following the ideal beam path through the center of the pipe. Due to the large beam pipe aperture, the width of the momentum distribution of particles continuing on the test beam line is large.
To illustrate the trajectory of a beam particle, the simulation of a geantino trajectory in the test beam line is shown in Figure 34. A geantino is a virtual particle for transportation processes in Geant4 simulations [30].
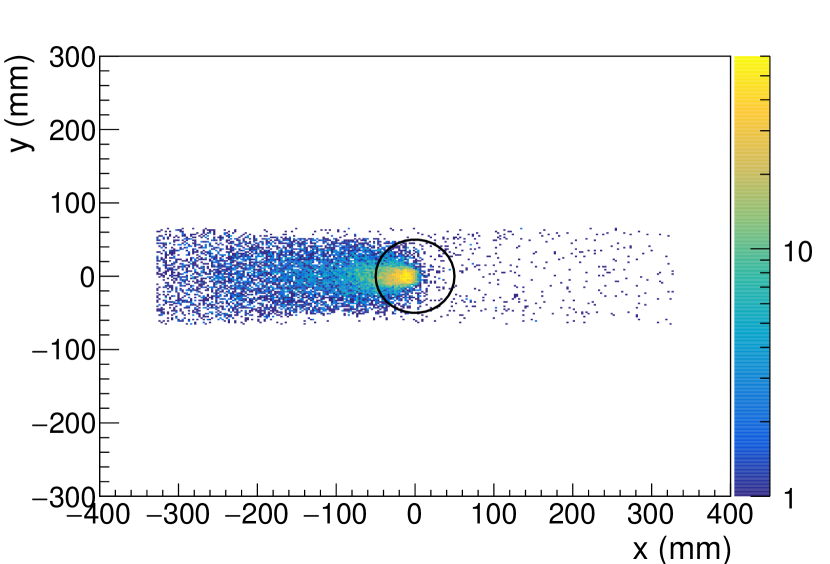
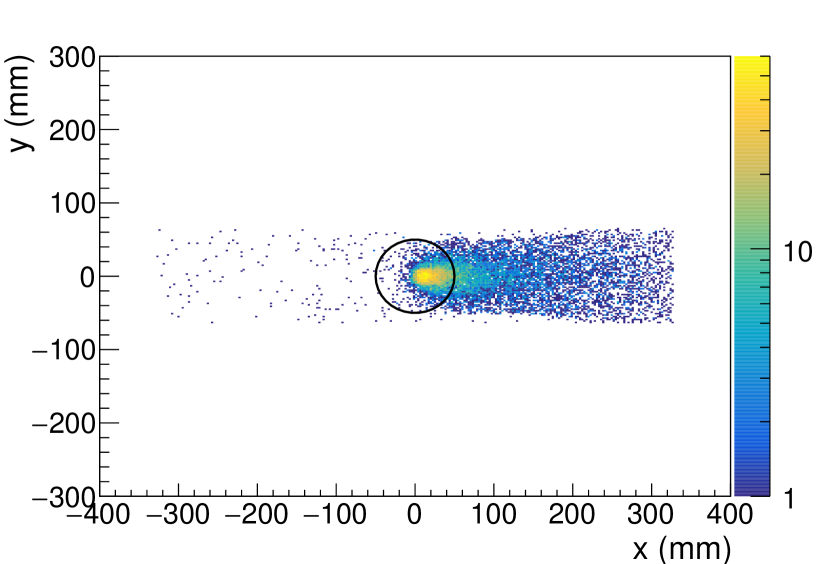
The deflection of charged particles in the -plane behind the dipole magnet is shown in Figure 35. The two separate particle fans for positively and negatively charged particles are clearly visible. The black circle indicates the contour of the beam pipe, and only particles within enter the subsequent beam line components. The other particles hit the iron surrounding of the magnet and do not proceed along the beam path. By changing the field strength of the magnet, the deflection of the particles is changed, and the desired beam momentum can be selected. In the case of reversing the magnet polarization, particles with the opposite charge enter the test beam area. Hence, the final test beam can consist of either electrons or positrons.
By collimating the beam using two separate collimators (for vertical and horizontal collimation), the Gaussian momentum distribution of the final test beam is narrowed. The stronger the collimation is, the smaller the width of the distribution is. After the first collimation, the beam continues along the evacuated beam pipe through the concrete wall into the test beam area. The concrete wall separates the test beam areas from the DESY II synchrotron tunnel.
In the test beam area, the particles are again collimated by a lead collimator with various available diameters. The size of the collimator hole affects the number of particles and the width of the momentum distribution of the final test beam. For presented simulation, a collimator aperture of x was assumed.
8.4 Momentum Distribution and Comparison to Measurements
In order to gain information about the momentum distribution of the final test beam, the simulation was repeated for six different magnetic field strengths between and . The statistics were increased by repeating the full simulation 200 times for each magnetic field strength. For all six magnetic field strengths, the mean and the width of the momentum distributions were determined using a Gaussian fit. The results, listed in Table 6, show a momentum spread of between and .
The calibration and momentum spread measurements performed in Section 7.3 show a linear dependency between the particle momentum and the magnetic field strength. This linear dependency is confirmed in Figure 36(a), in which the particle momentum determined from the simulation is plotted as a function of the selected magnetic field strengths. The simulation results are in good agreement with the measurements shown in Figure 31(a).
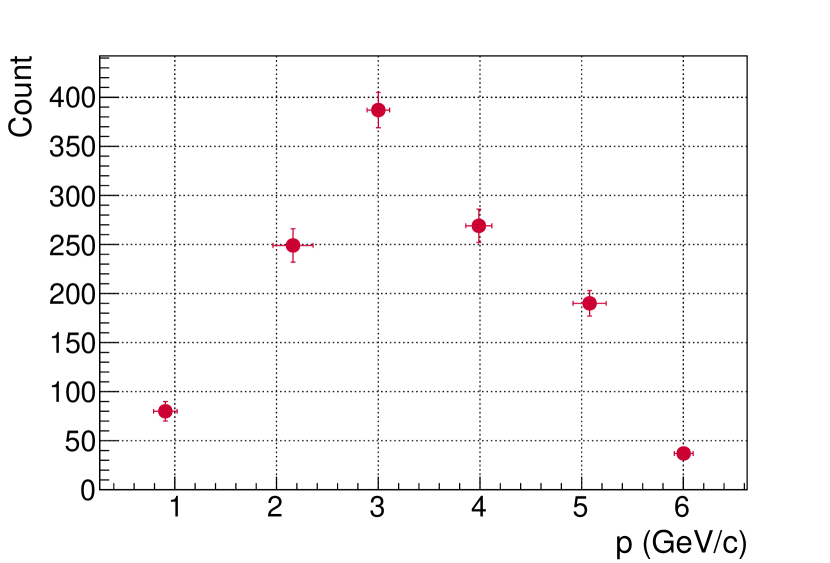
Additionally, the accumulated counts are plotted against the determined particle momentum (Fig. 36(b)). The shape of this distribution including a peak at momenta of 2- is similar to the measured integrated rate (see Sec. 7.2.2). Deviations are expected since the DESY II cycle structure including a non-constant DESY II beam intensity as well as the time structure given by the sinusoidal DESY II magnet cycle (see Sec. 3) is not considered in this simulation, which was using a fixed DESY II beam energy of . Due to this behavior of the DESY II beam intensity, the peak is expected to move to lower particle momenta. These deficiencies present possible future improvements to the simulation setup.
| (T) | (GeV/c) | (GeV/c) | (%) |
| 0.12 | 0.907 | 0.116 | |
| 0.30 | 2.162 | 0.197 | |
| 0.44 | 3.001 | 0.111 | |
| 0.59 | 3.989 | 0.128 | |
| 0.75 | 5.078 | 0.163 | |
| 0.90 | 6.003 | 0.093 |
8.5 Conclusion
For gaining a better understanding of the DESY II test beam generation, a Geant4 Monte Carlo simulation of TB21 was set up. The presented simulation efforts have already provided valuable insights in test beam generation and its dependency on the beam attributes. Improvements on the simulation setup, as well as the implementation of the remaining test beam lines and the DESY II time structure would allow thorough studies which can serve as a key input for future test beam line improvements.
9 Access & User Statistics
In this section a summary of the usage of the DESY II Test Beam Facility is mainly given for the years from 2013 till 2017. First, the beam availability of DESY II Test Beam Facility and the usage are considered (Sec. 9.1). Then details are given on the research fields and projects and the usage of the infrastructure (Sec. 9.2) and on the individual aspects (Sec. 9.3). Finally, the support for European users is explained (Sec. 9.4) and the educational programmes at the DESY II Test Beam Facility (Sec. 9.5).
9.1 Availability and Usage
The DESY II Test Beam Facility usually operates between 35 and 40 weeks a year which corresponds to 120 user slots for the three beam lines. Each slot lasts one week from Monday 8 am to Monday 8 am. Slots are allocated to the users by the test beam coordinators based on the scientific merit of the individual proposals. Each fall, a call is made for beam time requests for the upcoming year. Based on the response, the user schedule is compiled. Over the remainder of the year, still available slots are allocated to requests on a first come first serve basis by the test beam coordinators.
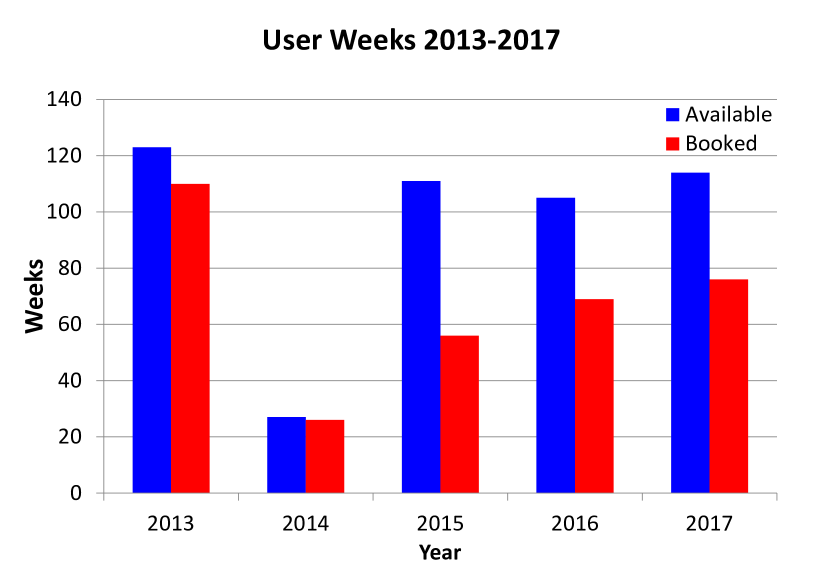
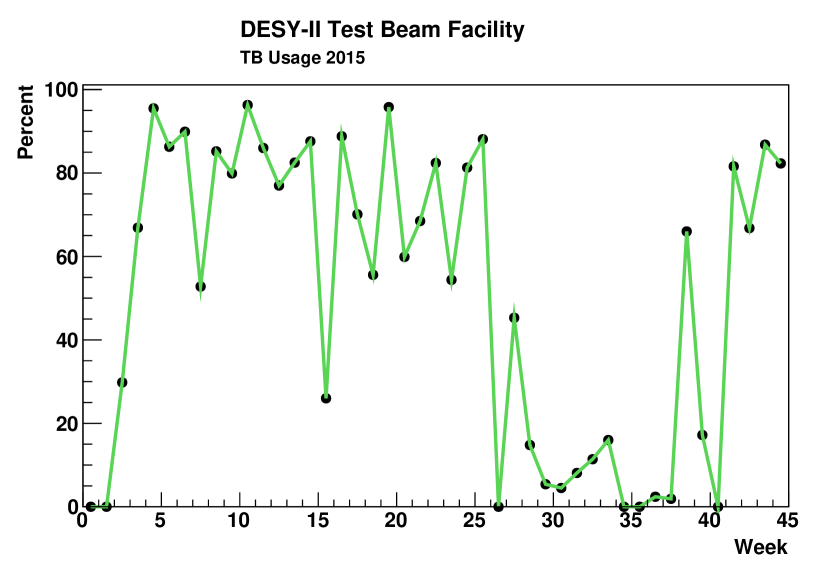
Figure 37(a) shows that the DESY II Test Beam Facility has been well-used. In particular, 2013 was a very busy year due to the shutdown of the CERN test beams. This led to an increased demand, since the DESY II Test Beam Facility was at this time the only facility operating in Europe providing multi-GeV particles. The usage number of 2014 is rather low, as DESY II was only running for nine weeks in 2014 due to a shutdown of the DESY accelerator complex from mid-March to December.
The usage statistics from 2015 to 2017 show a clear trend that the demand is continuously increasing. The average up-time —defined as the time any beam line is taking data divided by total available beam time— is with to rather high, given that this includes also the times for dis-/assembly of the user setups. As an example, the average up-time for 2015 is shown in Figure 37(b). Here, the average up-time was , excluding the weeks where no users where allocated to any of the beam lines.
9.2 Test Beam Projects and Usage of Infrastructures
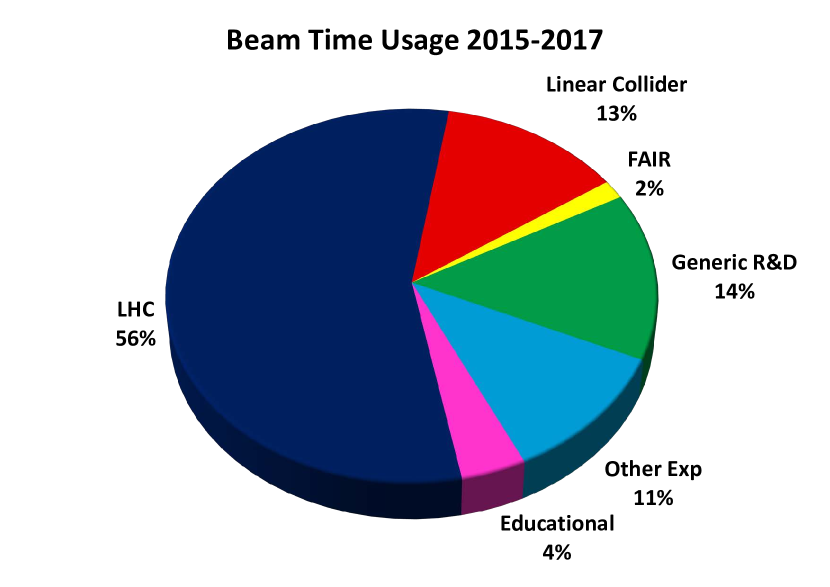
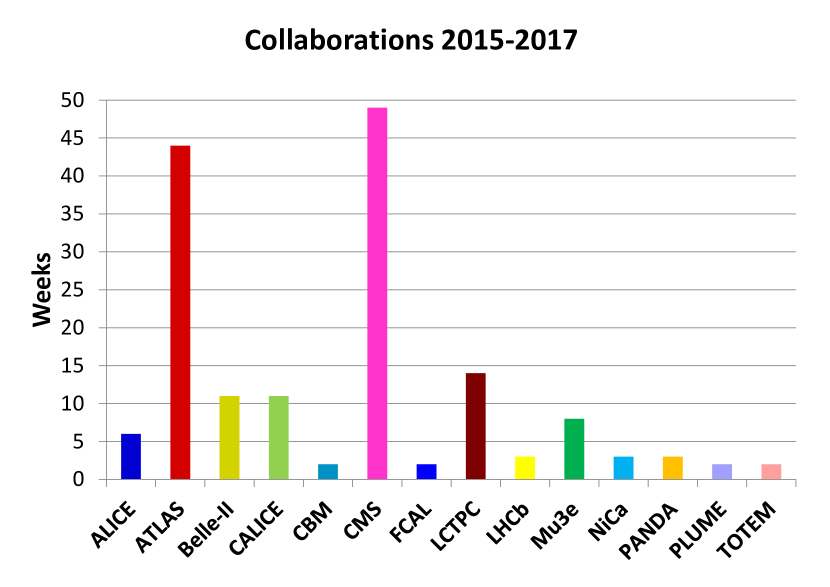
The core of the users at the DESY II Test Beam Facility originates from particle physics, but the facility also has an increased use by adjacent fields like nuclear physics, accelerator physics and beyond. In addition, many generic projects of detector R&D for particle detection make use of the facility. Figure 38(a) shows the different user communities, with LHC groups making up more than half the groups. The category ”Linear Collider” summarizes R&D focused on detectors for ILC and CLIC, ”FAIR” the nuclear physics groups developing detectors for FAIR at Darmstadt. ”Other Experiments” includes all groups from Experiments/Collaborations including e.g. Belle II and Mu3e. Generic R&D is used for all groups, whose developments are not or not yet geared at a specific experiment. The category ”Educational” included all the activities described in more detail in Section 9.5. Figure 38(b) shows the percentage of weeks allocated to individual collaborations, with ATLAS and CMS being the dominant users.
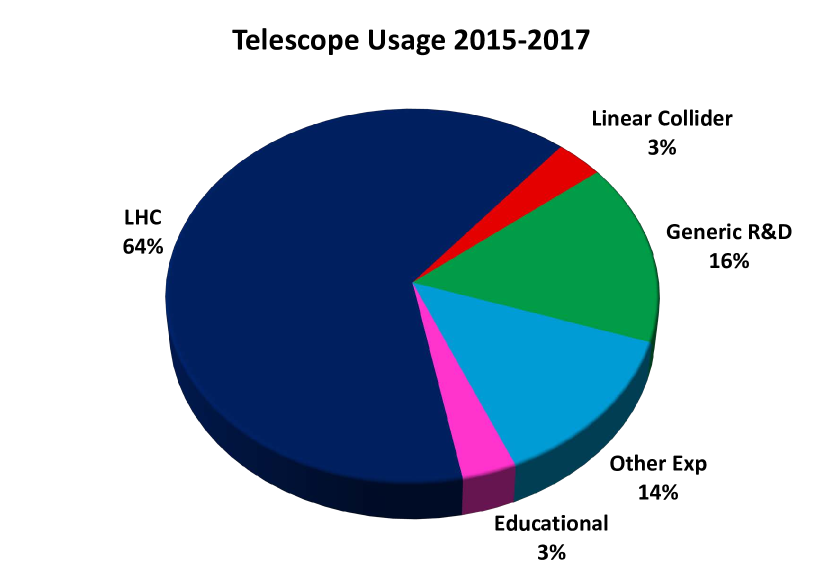
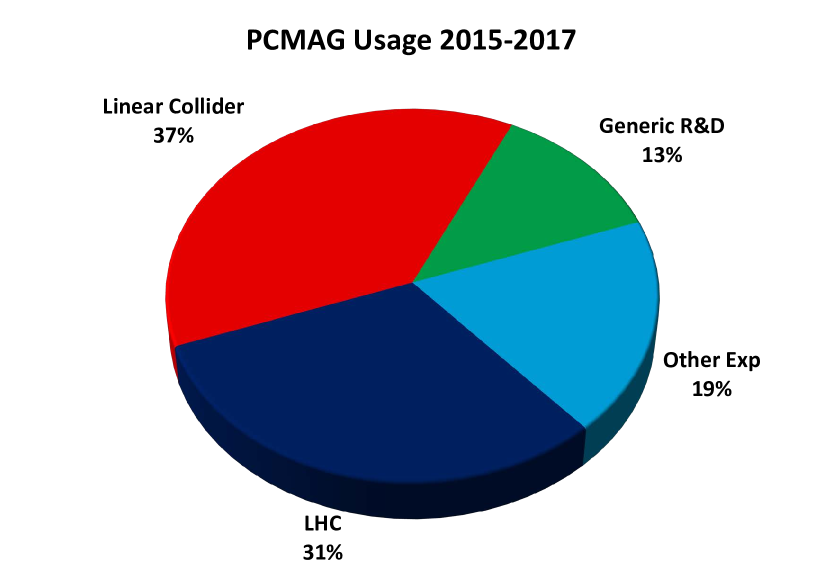
The usage of additional infrastructures provided at DESY like the EUDET-type Pixel Beam Telescopes (see Sec. 6.3) and PCMAG Solenoid (see Sec. 6.2) is shown in Figure 39 with the user group categories described in detail above. For the telescopes, about and for the PCMAG, about of the groups requested their use. Especially for the telescopes, the LHC groups are the predominant user, while the use of the PCMAG is more evenly spread between the different categories. For the telescopes it should be noted that, from 2016 onward, the two beam lines TB21 and TB22 were equipped a telescope, so the usage went up significantly from to almost . The usage of the PCMAG has remained quite constant over this period.
9.3 Individual Users Statistics
In the period 2013-2017, a total of 1266 registered user, originating from 34 different countries (Fig. 40), visited the DESY II Test Beam Facility. Users from Germany contribute , users from the EU to and non-EU users . The users from Germany include local users from DESY, which for many projects act as local liaison. That about half of the users come from outside of Germany illustrates that the test beam at DESY is an international facility even though it is operated at and funded by a national laboratory.
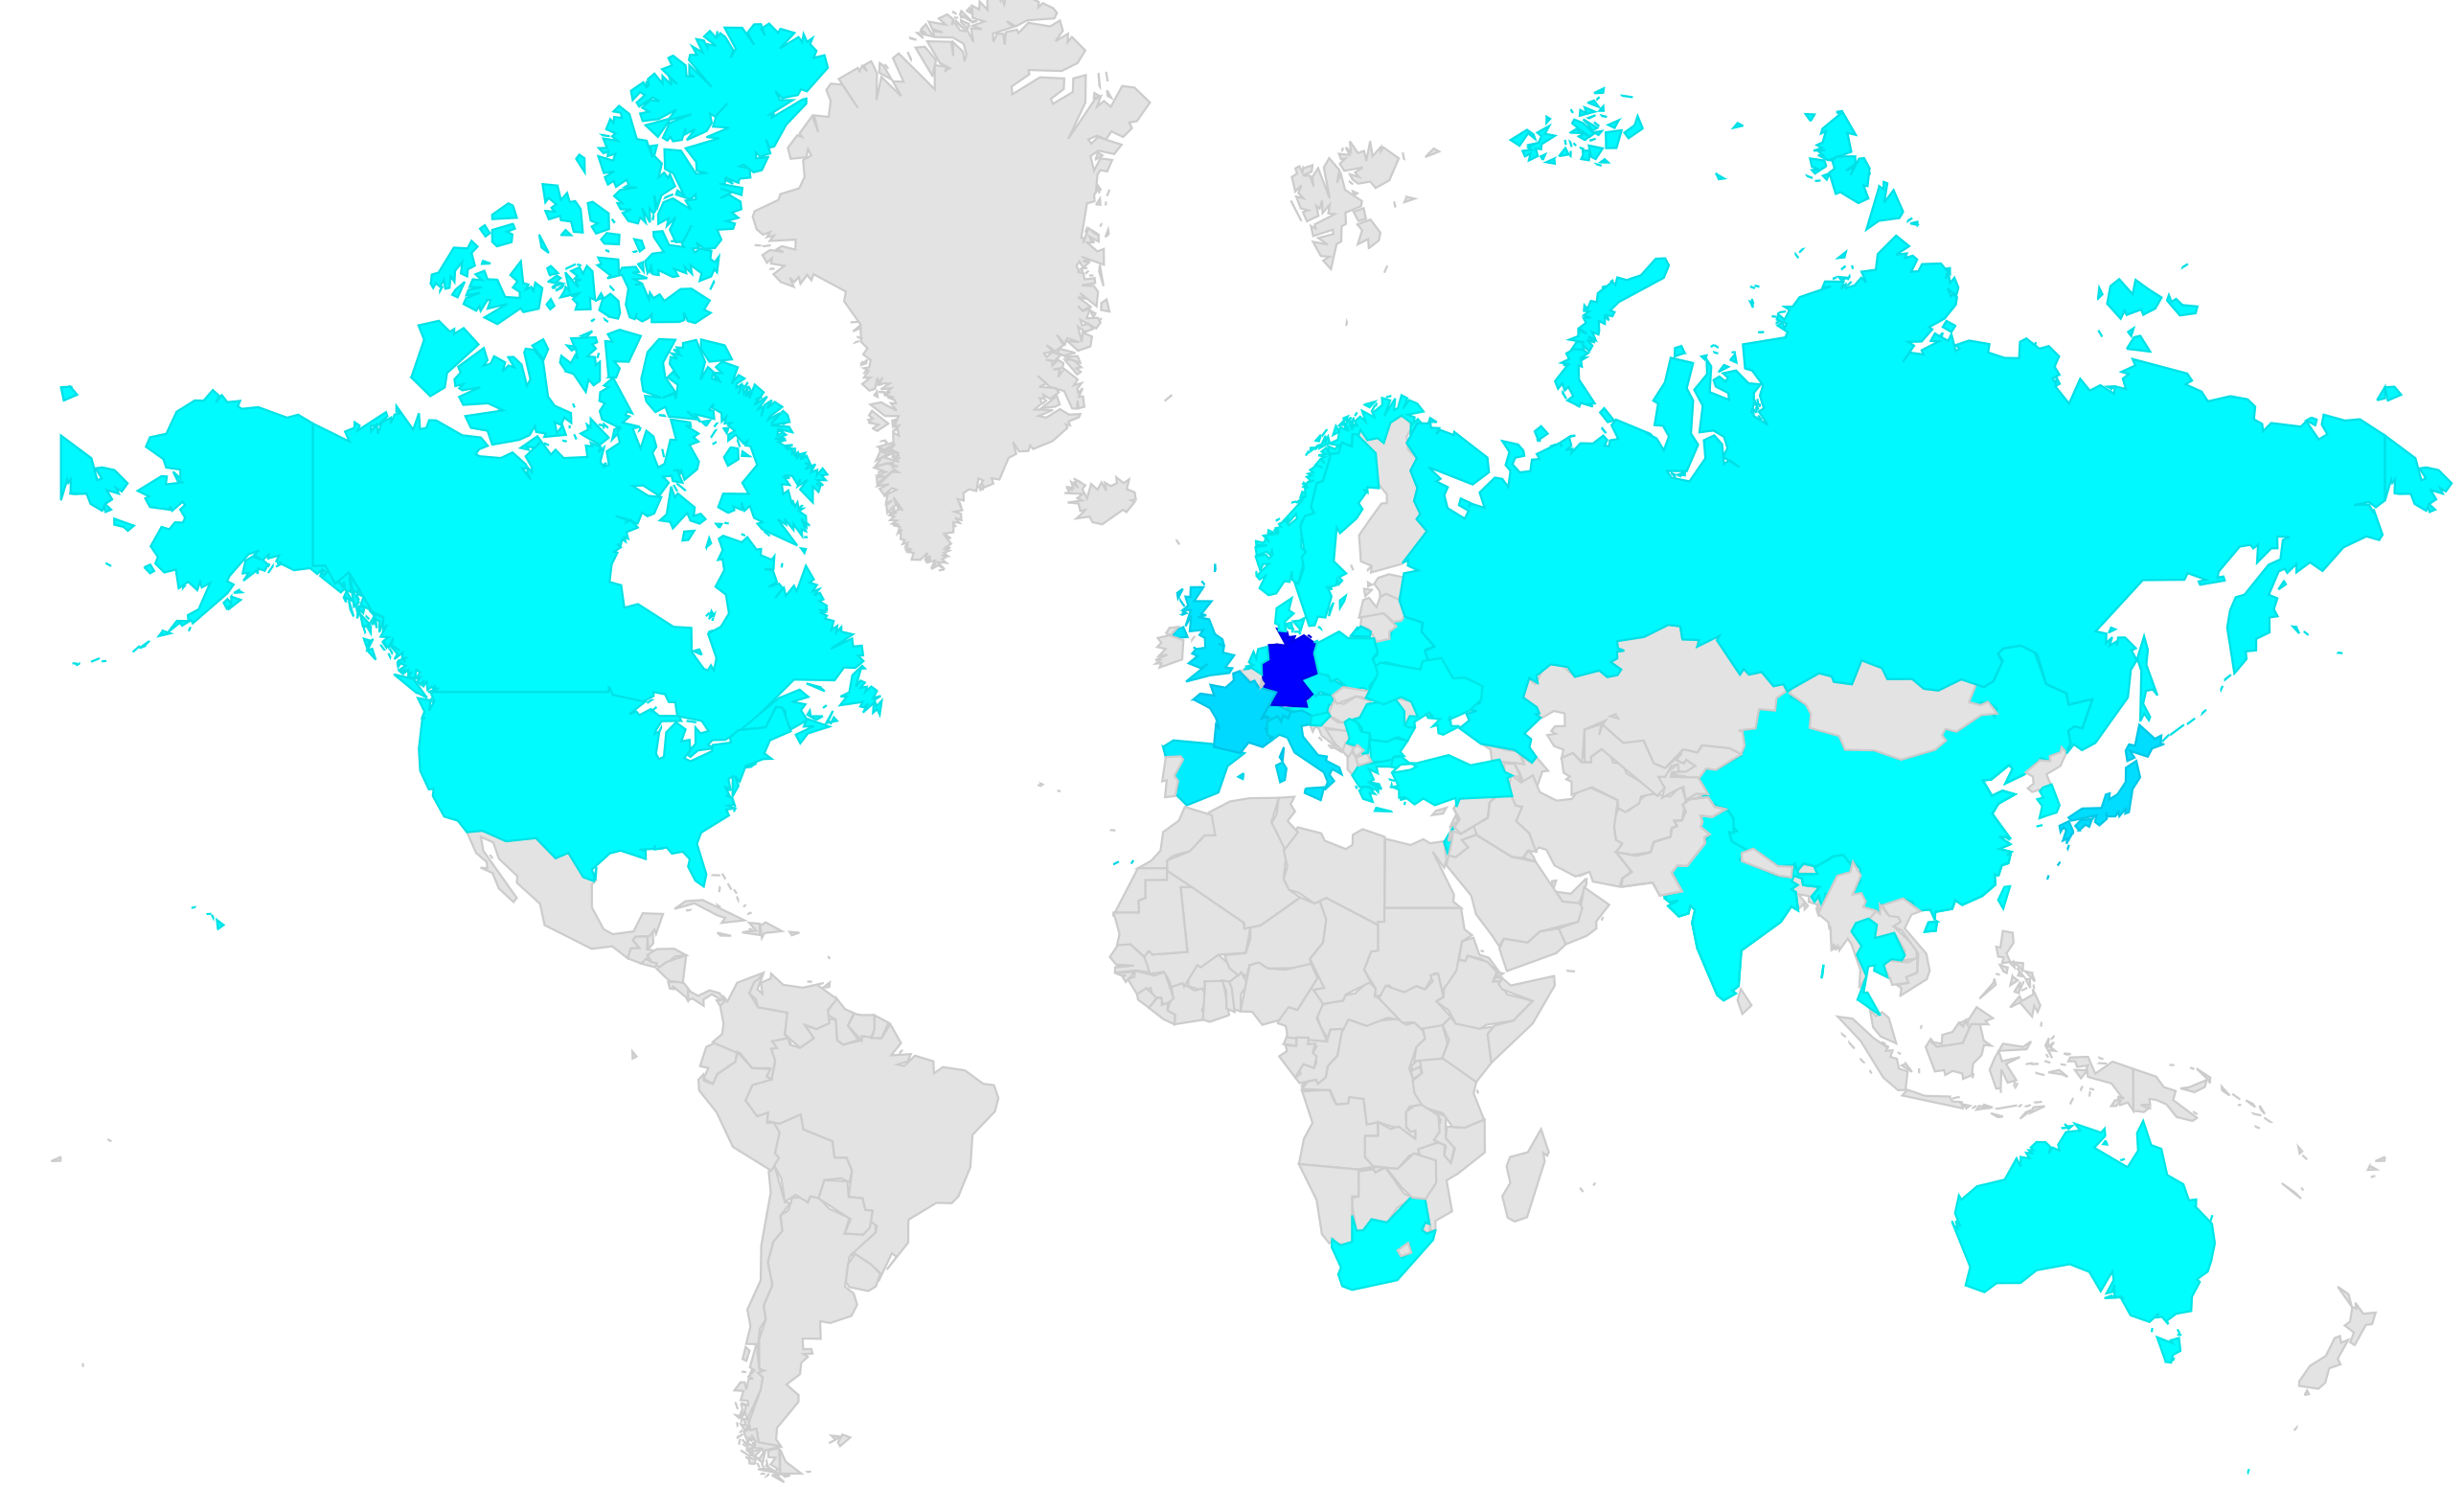
It is important to note, that the facility is a key infrastructure for training the next generation detector experts, as about of the users are students and postdoctoral researchers.
9.4 Transnational Access Support
The EU projects EUDET [1], AIDA [2] and AIDA2020 [3] have been, respectively are, supporting a transnational access scheme to large facilities in Europe for users outside of the host country. This scheme has been extensively used by many groups and enables them to conduct their experiments at the test beam facility. From 2013 to 2017, on average of the users have received support from the Transnational Access scheme.
9.5 Educational Use
DESY has a very successful Summer Student Programme [31] and since a few years, a few of the summer students are given the opportunity to conduct measurements at the DESY II Test Beam Facility. This has been proven to be very popular since students can experience high energy physics from the experimental setup over test beam measurements to analysis and results.
Besides, DESY is offering since 2016 a particle physics training course for high school teachers. This includes a hands-on experiment at the test beam. Further outreach and training activities targeted at high school students are being planned.
10 Summary and Outlook
The DESY II Test Beam Facility has been in operation since the early nineties and has since then continuously been improved. Today it successfully operates as a well-established international facility for detector R&D for particle physics and adjacent fields. The reliable beam and the infrastructures provided ranging from patch panels to telescopes and high-field magnets are a key ingredient to its success.
The facility is nowadays a key infrastructure for detector R&D worldwide and its usage keeps increasing.
A Test Beam User Workshop was held at DESY in October 2017 to get feedback first-hand from the user community and to discuss possible future improvements and extensions to the facility [32]. Key points made were to increase the particle rates in general and to have high rates available at the highest possible energy. Overall however, the user community was pleased with the status of the facility. The current facility will continue to run until at least to 2025, which is the timescale for the start of an upgrade of PETRA III to PETRA IV. This upgrade could imply changes to the injector chain, which then would have an impact on the DESY II Test Beam Facility. However, the intention is to provide test beams at DESY for as long as there is a user need for multi-GeV electron test beams.
Acknowledgments
The authors are greatly indebted to our colleagues from the DESY M and FH divisions, which are essential to successfully operate, maintain and extend this facility.
The described infrastructure has received funding from the European Commission under the 6 Framework Programme “Structuring the European Research Area” under contract RII3-026126 and under the FP7 Research Infrastructures project AIDA, grant agreement no. 262025. This project has received funding from the European Union’s Horizon 2020 Research and Innovation programme under Grant Agreement no. 654168. The PCMAG infrastructure was supported by JSPS KAKENHI Grant No. 23000002. The information herein only reflects the views of its authors and not those of the European Commission and no warranty expressed or implied is made with regard to such information or its use.
References
-
[1]
Homepage of the EUDET project, [Online;
accessed 23-January-2018] (2018).
URL http://www.eudet.org/ -
[2]
Homepage of the AIDA
project, [Online; accessed 23-January-2018] (2018).
URL http://aida-old.web.cern.ch/aida-old/index.html -
[3]
Homepage of the AIDA-2020 project,
[Online; accessed 23-January-2018] (2018).
URL http://aida2020.web.cern.ch/ - [4] G. Hemmie, DESY II, a New Injector for the Desy Storage Rings PETRA and DORIS II, IEEE Transactions on Nuclear Science 30 (4) (1983) 2028–2030. doi:10.1109/TNS.1983.4332706.
- [5] G. Hemmie, U. Berghaus, H. Bottcher, E. Dabkowski, H. R. Heller, G. Meyer, G. Nawrath, F. Schwickert, K. Sinram, G. Wobke, H. Wumpelmann, Design, Construction and Performance of the DESY II Magnets, IEEE Transactions on Nuclear Science 32 (5) (1985) 3625–3627. doi:10.1109/TNS.1985.4334448.
- [6] R. Bielski, DESY Summer Student Project (2012).
-
[7]
D. Cussans,
Description
of the JRA1 Trigger Logic Unit (TLU), v0.2c, EUDET-MEMO 2009-04.
URL http://www.eudet.org/e26/e28/e42441/e57298/EUDET-MEMO-2009-04.pdf - [8] P. Bartkiewicz, P. Duval, TINE as an accelerator control system at DESY, Measurement Science and Technology 18 (8) (2007) 2379. doi:10.1088/0957-0233/18/8/012.
- [9] S. Agostinelli, J. Allison, K. Amako, J. Apostolakis, H. Araujo, P. Arce, M. Asai, D. Axen, S. Banerjee, G. Barrand, F. Behner, L. Bellagamba, J. Boudreau, L. Broglia, A. Brunengo, H. Burkhardt, S. Chauvie, J. Chuma, R. Chytracek, G. Cooperman, G. Cosmo, P. Degtyarenko, A. Dell’Acqua, G. Depaola, D. Dietrich, R. Enami, A. Feliciello, C. Ferguson, H. Fesefeldt, G. Folger, F. Foppiano, A. Forti, S. Garelli, S. Giani, R. Giannitrapani, D. Gibin, J. G. Cadenas, I. González, G. G. Abril, G. Greeniaus, W. Greiner, V. Grichine, A. Grossheim, S. Guatelli, P. Gumplinger, R. Hamatsu, K. Hashimoto, H. Hasui, A. Heikkinen, A. Howard, V. Ivanchenko, A. Johnson, F. Jones, J. Kallenbach, N. Kanaya, M. Kawabata, Y. Kawabata, M. Kawaguti, S. Kelner, P. Kent, A. Kimura, T. Kodama, R. Kokoulin, M. Kossov, H. Kurashige, E. Lamanna, T. Lampén, V. Lara, V. Lefebure, F. Lei, M. Liendl, W. Lockman, F. Longo, S. Magni, M. Maire, E. Medernach, K. Minamimoto, P. M. de Freitas, Y. Morita, K. Murakami, M. Nagamatu, R. Nartallo, P. Nieminen, T. Nishimura, K. Ohtsubo, M. Okamura, S. O’Neale, Y. Oohata, K. Paech, J. Perl, A. Pfeiffer, M. Pia, F. Ranjard, A. Rybin, S. Sadilov, E. D. Salvo, G. Santin, T. Sasaki, N. Savvas, Y. Sawada, S. Scherer, S. Sei, V. Sirotenko, D. Smith, N. Starkov, H. Stoecker, J. Sulkimo, M. Takahata, S. Tanaka, E. Tcherniaev, E. S. Tehrani, M. Tropeano, P. Truscott, H. Uno, L. Urban, P. Urban, M. Verderi, A. Walkden, W. Wander, H. Weber, J. Wellisch, T. Wenaus, D. Williams, D. Wright, T. Yamada, H. Yoshida, D. Zschiesche, Geant4: a simulation toolkit, Nuclear Instruments and Methods in Physics Research Section A: Accelerators, Spectrometers, Detectors and Associated Equipment 506 (3) (2003) 250 – 303. doi:10.1016/S0168-9002(03)01368-8.
- [10] J. Allison, K. Amako, J. Apostolakis, H. Araujo, P. A. Dubois, M. Asai, G. Barrand, R. Capra, S. Chauvie, R. Chytracek, G. A. P. Cirrone, G. Cooperman, G. Cosmo, G. Cuttone, G. G. Daquino, M. Donszelmann, M. Dressel, G. Folger, F. Foppiano, J. Generowicz, V. Grichine, S. Guatelli, P. Gumplinger, A. Heikkinen, I. Hrivnacova, A. Howard, S. Incerti, V. Ivanchenko, T. Johnson, F. Jones, T. Koi, R. Kokoulin, M. Kossov, H. Kurashige, V. Lara, S. Larsson, F. Lei, O. Link, F. Longo, M. Maire, A. Mantero, B. Mascialino, I. McLaren, P. M. Lorenzo, K. Minamimoto, K. Murakami, P. Nieminen, L. Pandola, S. Parlati, L. Peralta, J. Perl, A. Pfeiffer, M. G. Pia, A. Ribon, P. Rodrigues, G. Russo, S. Sadilov, G. Santin, T. Sasaki, D. Smith, N. Starkov, S. Tanaka, E. Tcherniaev, B. Tome, A. Trindade, P. Truscott, L. Urban, M. Verderi, A. Walkden, J. P. Wellisch, D. C. Williams, D. Wright, H. Yoshida, Geant4 developments and applications, IEEE Transactions on Nuclear Science 53 (1) (2006) 270–278. doi:10.1109/TNS.2006.869826.
- [11] J. Allison, K. Amako, J. Apostolakis, P. Arce, M. Asai, T. Aso, E. Bagli, A. Bagulya, S. Banerjee, G. Barrand, B. Beck, A. Bogdanov, D. Brandt, J. Brown, H. Burkhardt, P. Canal, D. Cano-Ott, S. Chauvie, K. Cho, G. Cirrone, G. Cooperman, M. Cortés-Giraldo, G. Cosmo, G. Cuttone, G. Depaola, L. Desorgher, X. Dong, A. Dotti, V. Elvira, G. Folger, Z. Francis, A. Galoyan, L. Garnier, M. Gayer, K. Genser, V. Grichine, S. Guatelli, P. Guèye, P. Gumplinger, A. Howard, I. Hřivnáčová, S. Hwang, S. Incerti, A. Ivanchenko, V. Ivanchenko, F. Jones, S. Jun, P. Kaitaniemi, N. Karakatsanis, M. Karamitros, M. Kelsey, A. Kimura, T. Koi, H. Kurashige, A. Lechner, S. Lee, F. Longo, M. Maire, D. Mancusi, A. Mantero, E. Mendoza, B. Morgan, K. Murakami, T. Nikitina, L. Pandola, P. Paprocki, J. Perl, I. Petrović, M. Pia, W. Pokorski, J. Quesada, M. Raine, M. Reis, A. Ribon, A. R. Fira, F. Romano, G. Russo, G. Santin, T. Sasaki, D. Sawkey, J. Shin, I. Strakovsky, A. Taborda, S. Tanaka, B. Tomé, T. Toshito, H. Tran, P. Truscott, L. Urban, V. Uzhinsky, J. Verbeke, M. Verderi, B. Wendt, H. Wenzel, D. Wright, D. Wright, T. Yamashita, J. Yarba, H. Yoshida, Recent developments in Geant4, Nuclear Instruments and Methods in Physics Research Section A: Accelerators, Spectrometers, Detectors and Associated Equipment 835 (2016) 186 – 225. doi:10.1016/j.nima.2016.06.125.
- [12] T. Böhlen, F. Cerutti, M. Chin, A. Fassò, A. Ferrari, P. Ortega, A. Mairani, P. Sala, G. Smirnov, V. Vlachoudis, The FLUKA Code: Developments and Challenges for High Energy and Medical Applications, Nuclear Data Sheets 120 (2014) 211 – 214. doi:10.1016/j.nds.2014.07.049.
- [13] A. Ferrari, P. R. Sala, A. Fasso, J. Ranft, O. Européenne, P. La, R. Nucléaire, A. Ferrari, P. R. Sala, A. Fassò, J. Ranft, FLUKA: a multi-particle transport code, in: CERN 2005-10 (2005), INFN/TC 05/11, SLAC-R-773, 2005.
- [14] I. Borchert, K. Holm, W. Knaut, A. Ladage, U. Müller, F. Peters, H. Pingel, H. D. Schulz, K. G. Steffen, H. J. Stuckenberg, H. Wümpelmann, DESY-Handbuch, Tech. rep., Deutsches Elektronen Synchrotron (DESY) (1966).
-
[15]
M. Wu, Environmental control system
at DESY (Oct 2017).
URL http://cds.cern.ch/record/2290758 - [16] A. Yamamoto, K. Anraku, R. Golden, T. Haga, Y. Higashi, M. Imori, S. Inaba, B. Kimbell, N. Kimura, Y. Makida, Balloon-borne experiment with a superconducting solenoidal magnet spectrometer, Advances in Space Research 14 (1994) 2. doi:10.1016/0273-1177(94)90071-X.
-
[17]
J. Alozy, F. Bergsma, F. Formenti, et al.,
First
Version of the PCMAG Field Map, EUDET-MEMO 2007-51.
URL http://www.eudet.org/e26/e28/e182/e599/eudet-memo-2007-51.pdf -
[18]
C. Grefe,
Magnetic
Field Map for a Large TPC Prototype, Master’s thesis, Universität
Hamburg, DESY-THESIS-2008-052 (June 2008).
URL http://www-library.desy.de/cgi-bin/showprep.pl?desy-thesis-08-052 -
[19]
K. Zenker,
Studies
of field distortions in a time projection chamber for the international
linear collider, Ph.D. thesis, University of Hamburg, DESY-THESIS-2014-044
(2014).
URL http://www-library.desy.de/cgi-bin/showprep.pl?desy-thesis-14-044 - [20] H. Jansen, S. Spannagel, J. Behr, A. Bulgheroni, G. Claus, E. Corrin, D. Cussans, J. Dreyling-Eschweiler, D. Eckstein, T. Eichhorn, M. Goffe, I. M. Gregor, D. Haas, C. Muhl, H. Perrey, R. Peschke, P. Roloff, I. Rubinskiy, M. Winter, Performance of the EUDET-type beam telescopes, EPJ Techniques and Instrumentation 3 (1) (2016) 7. doi:10.1140/epjti/s40485-016-0033-2.
-
[21]
Homepage of the EUDET-type beam
telescopes, [Online; accessed 24-Januar-2018] (2018).
URL https://telescopes.desy.de - [22] C. Hu-Guo, J. Baudot, G. Bertolone, A. Besson, A. Brogna, C. Colledani, G. Claus, R. D. Masi, Y. Degerli, A. Dorokhov, G. Doziere, W. Dulinski, X. Fang, M. Gelin, M. Goffe, F. Guilloux, A. Himmi, K. Jaaskelainen, M. Koziel, F. Morel, F. Orsini, M. Specht, Q. Sun, O. Torheim, I. Valin, M. Winter, First reticule size MAPS with digital output and integrated zero suppression for the EUDET-JRA1 beam telescope, Nuclear Instruments and Methods in Physics Research Section A: Accelerators, Spectrometers, Detectors and Associated Equipment 623 (1) (2010) 480 – 482, 1st International Conference on Technology and Instrumentation in Particle Physics. doi:10.1016/j.nima.2010.03.043.
- [23] M. A. Izzatullah, DESY Summer Student Project (2015).
- [24] S. Tavernier, Interactions of Particles in Matter, Springer Berlin Heidelberg, Berlin, Heidelberg, 2010, pp. 23–53. doi:10.1007/978-3-642-00829-0_2.
- [25] P. Schütze, DESY Summer Student Project (2013).
- [26] T. Lange, DESY Summer Student Project (2016).
- [27] N. Graf, J. McCormick, Simulator for the linear collider (SLIC): A tool for ILC detector simulations, AIP Conf. Proc. 867 (2006) 503–512. doi:10.1063/1.2396991.
- [28] F. Gaede, T. Behnke, N. Graf, T. Johnson, LCIO: A Persistency framework for linear collider simulation studies, eConf C0303241 (2003) TUKT001, ”SLAC-PUB-9992”, ”CHEP-2003-TUKT001”. arXiv:physics/0306114.
-
[29]
A. Schütz, Simulation of
Particle Fluxes at the DESY-II Test Beam Facility, Master’s thesis,
Karlsruhe Institute of Technology, DESY-THESIS-2015-017 (2015).
URL http://bib-pubdb1.desy.de/record/220092 -
[30]
Geant4 – Users
Documentation, [Online; accessed 20-July-2018].
URL https://geant4.web.cern.ch/support/user_documentation -
[31]
DESY Summer Student Programme,
[Online; accessed 23-February-2018] (2018).
URL https://summerstudents.desy.de/ - [32] J.-H. Arling, M. Sohail Amjad, L. Bandiera, T. Behnke, D. Dannheim, R. Diener, J. Dreyling-Eschweiler, H. Ehrlichmann, A. Gerbershagen, I.-M. Gregor, A. Hayrapetyan, H. Jansen, J. Kaminski, J. Kroll, P. Martinengo, N. Meyners, C. Müntz, L. Poley, B. Schwenker, M. Stanitzki, Summary and Conclusions of the First DESY Test Beam User Workshop (2018). arXiv:1802.00412.