Stellar populations of the central region of M31.††thanks: This paper includes data taken at The McDonald Observatory of The University of Texas at Austin. ††thanks: This research was supported by the DFG cluster of excellence ’Origin and Structure of the Universe’.††thanks: Tables 5, 6 and 7 are only available in electronic form at the CDS via anonymous ftp to cdsarc.u-strasbg.fr (130.79.128.5) or via http://cdsweb.u-strasbg.fr/cgi-bin/qcat?J/A+A/
Aims: We continue the analysis of the data set of
our spectroscopic observation campaign of M31, whose ultimate goal
is to provide an understanding of the three-dimensional structure
of the bulge, its formation history, and composition in terms of
a classical bulge, boxy-peanut bulge, and bar contributions.
Methods: We derive simple stellar population (SSP) properties,
such as age metallicity and element overabundance, from the
measurement of Lick/IDS absorption line indices. We describe their
two-dimensional maps taking into account the dust distribution in M31.
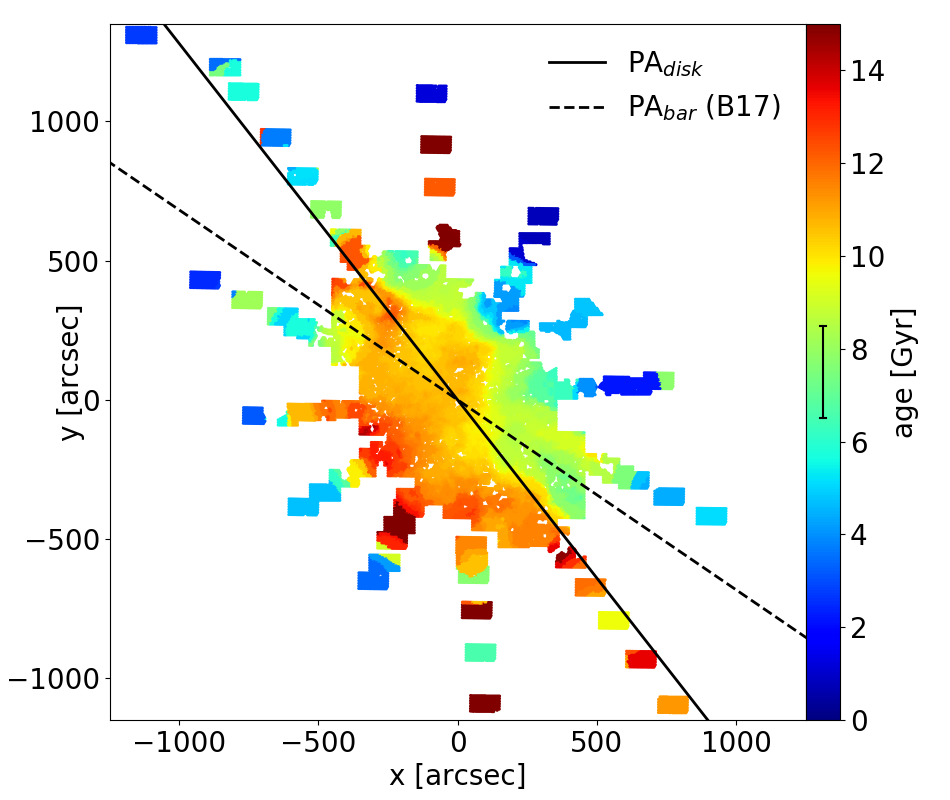
Results: We found 80% of the values of our age measurements are
larger than 10 Gyr. The central 100 arcsec of M31 are dominated
by the stars of the classical bulge of M31. These stars are old (
Gyr), metal-rich (as high as [Z/H] dex) at the
center with a negative gradient outward and enhanced in
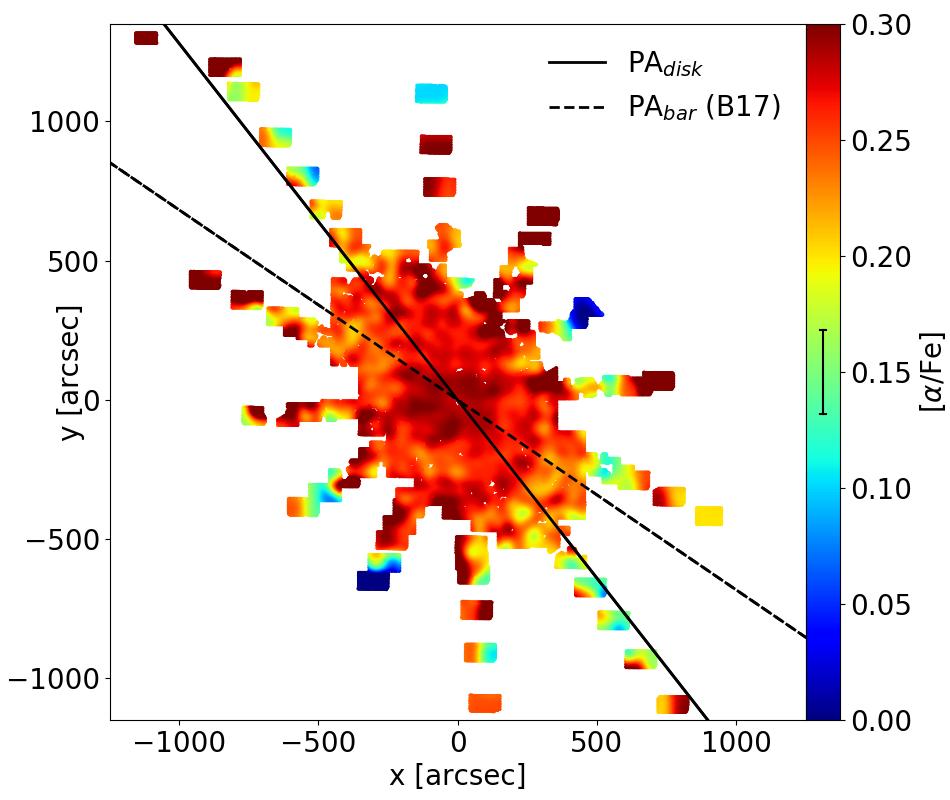
elements ([Fe] dex ). The
bar stands out in the metallicity map, where an almost solar value
of [Z/H] ( dex) with no gradient is observed
along the bar position angle (55.7 deg) out to 600 arcsec from the
center. In contrast, no signature of the bar is seen in the age and
[Fe] maps, which are approximately axisymmetric, delivering
a mean age and overabundance for the bar and boxy-peanut bulge
of 10-13 Gyr and 0.25-0.27 dex, respectively. The boxy-peanut bulge
has almost solar metallicity ( dex). The
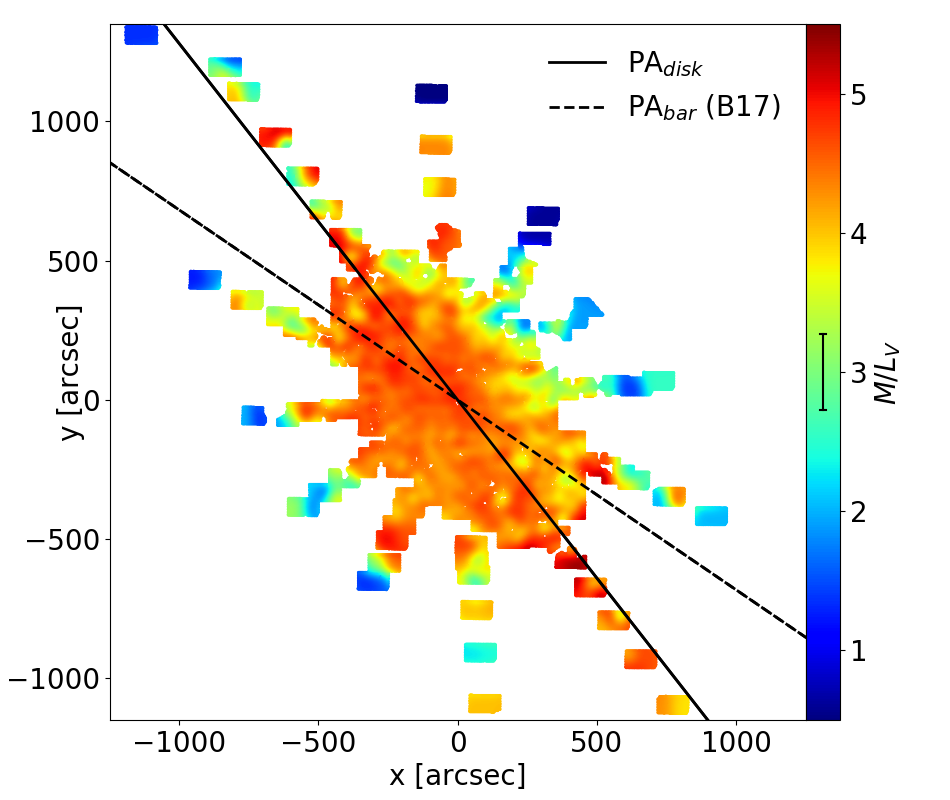
mass-to-light ratio of the three components is approximately
constant at . The disk
component at larger distances is made of a mixture of stars, as
young as 3-4 Gyr, with
solar metallicity and smaller ().
Conclusions: We propose a two-phase formation scenario for the
inner region of M31, where most of the stars of the classical bulge
come into place together with a proto-disk, where a bar develops and
quickly transforms it into a boxy-peanut bulge. Star
formation continues in the bulge region, producing stars younger than
10 Gyr, in particular along the bar, thereby enhancing its metallicity. The
disk component appears to build up on longer timescales.
Key Words.:
galaxies: bulges – galaxies: individual (Andromeda, M31, NGC224) –galaxies: Local Group – galaxies: formation – galaxies: stellar content – galaxies: structure1 Introduction
Because of its proximity, M31 is the best case after the Milky Way (MW) to study the detailed evolutionary history of a large spiral galaxy. There is strong evidence from photometry for the presence of a barred bulge in M31 (Lindblad, 1956; Beaton et al., 2007) and N-body models; see, for example, Athanassoula & Beaton (2006) and Blaña Díaz et al. (2017, hereafter B17). In Opitsch et al. (2018, hereafter Paper I), we present arguments for the presence of a bar based on the kinematics of the stars, ionized gas, and gas fluxes, backing the M31 model of B17. Blaña et al. (2018) have refined this model using the NMAGIC technique of de Lorenzi et al. (2007), adapted to barred disk galaxies as in Portail et al. (2017a), to fit the kinematic maps presented in Paper I. In their scenario, M31 belongs to the category of composite bulges (Erwin et al., 2015), harboring a classical bulge (hereafter CB) component dominating the dynamics inside 100 arcsec from the center and containing one-third of the total bulge mass (B17), and a boxy-peanut (hereafter B/P) generated by the buckling of a bar presently detected at a position angle of °and with a projected length of ″. Outside this region the disk component of M31 starts to dominate. On the other end, the photometric plus exponential decomposition along the major axis of Kormendy & Bender (1999) could suggest that a (possibly young and) rotating disk component is also present inside the 600″region.
Furthermore, only determining the ages and metallicities of the stellar populations of the bar, the classical and B/P bulge can clarify when these different structures formed and constrain their mass-to-light ratios. Presently, the modeling approach of Blaña et al. (2018) assumes that they all have the same uniform value and this assumption needs verification. Finally, a plausible formation scenario should emerge from a joint dynamical and stellar population modeling approach. In the long run, the origin of the microlensing events observed toward the bulge of M31 (Lee et al., 2012) might be understood. Some of these could originate from the dark matter halo of M31, if a fraction of it is made of compact massive objects. To reach this conclusion we need a well constrained three-dimensional model of the stellar populations of the bulge region of M31 that allows us to estimate the number of microlensing events toward M31 due to self-lensing (Riffeser et al., 2008).
Bars are thought to be the major drivers of the so-called secular evolution, which is the slow rearrangement of energy and mass in galaxies, as opposed to the violent and rapid processes of hierarchical clustering and merging (see, e.g., Kormendy & Kennicutt, 2004; Athanassoula, 2013; Kormendy, 2013; Sellwood, 2014). Through their ability to transport angular momentum and gas, bars influence the inner regions of galaxies (Knapen et al., 1995; Bureau & Athanassoula, 1999; Sakamoto et al., 1999; Fathi & Peletier, 2003; Chung & Bureau, 2004; Cheung et al., 2013). They also affect the outer regions by redistributing the stellar component (Gadotti & dos Anjos, 2001; Roškar et al., 2012), by increasing radial motions and reshuffling the stellar content, which leads to flatter radial gradients in the stellar populations (Minchev & Famaey, 2010; Di Matteo et al., 2013; Kubryk et al., 2013).
So far there is no conclusion yet on the impact of the presence of a
bar on metallicity gradients. Several studies have found that the
stellar metallicity seems to remain unchanged in the central parts in
the presence of a bar (Friedli et al., 1994; Coelho & Gadotti, 2011; Williams et al., 2012; Cacho et al., 2014; Cheung et al., 2015), while others found a mild increase
(Moorthy & Holtzman, 2006; Pérez & Sánchez-Blázquez, 2011). Seidel et al. (2016) measured larger gradients
in metallicity for barred galaxies than in unbarred galaxies with a
steeper gradient within 0.06 bar lengths.
Di Matteo et al. (2015),Di Matteo (2016),Athanassoula et al. (2017) and
Fragkoudi et al. (2017)
emphasize the role of the thick disk to explain the metallicity
distribution of the MW. Debattista et al. (2017) and
Gonzalez et al. (2017) argued that the X-shaped structure of
B/P-shaped bulges are preferentially populated by
metal-rich stars because of kinematic fractionation.
Regarding the influence of bars on stellar populations in the outer regions of galaxies, there is also no consensus in the literature. Some studies find no systematic difference between barred and unbarred galaxies (Pérez et al., 2007, 2009), while others find flatter age and metallicity gradients along the bar than compared to those along the disk (Sánchez-Blázquez et al., 2011; Seidel et al., 2016).
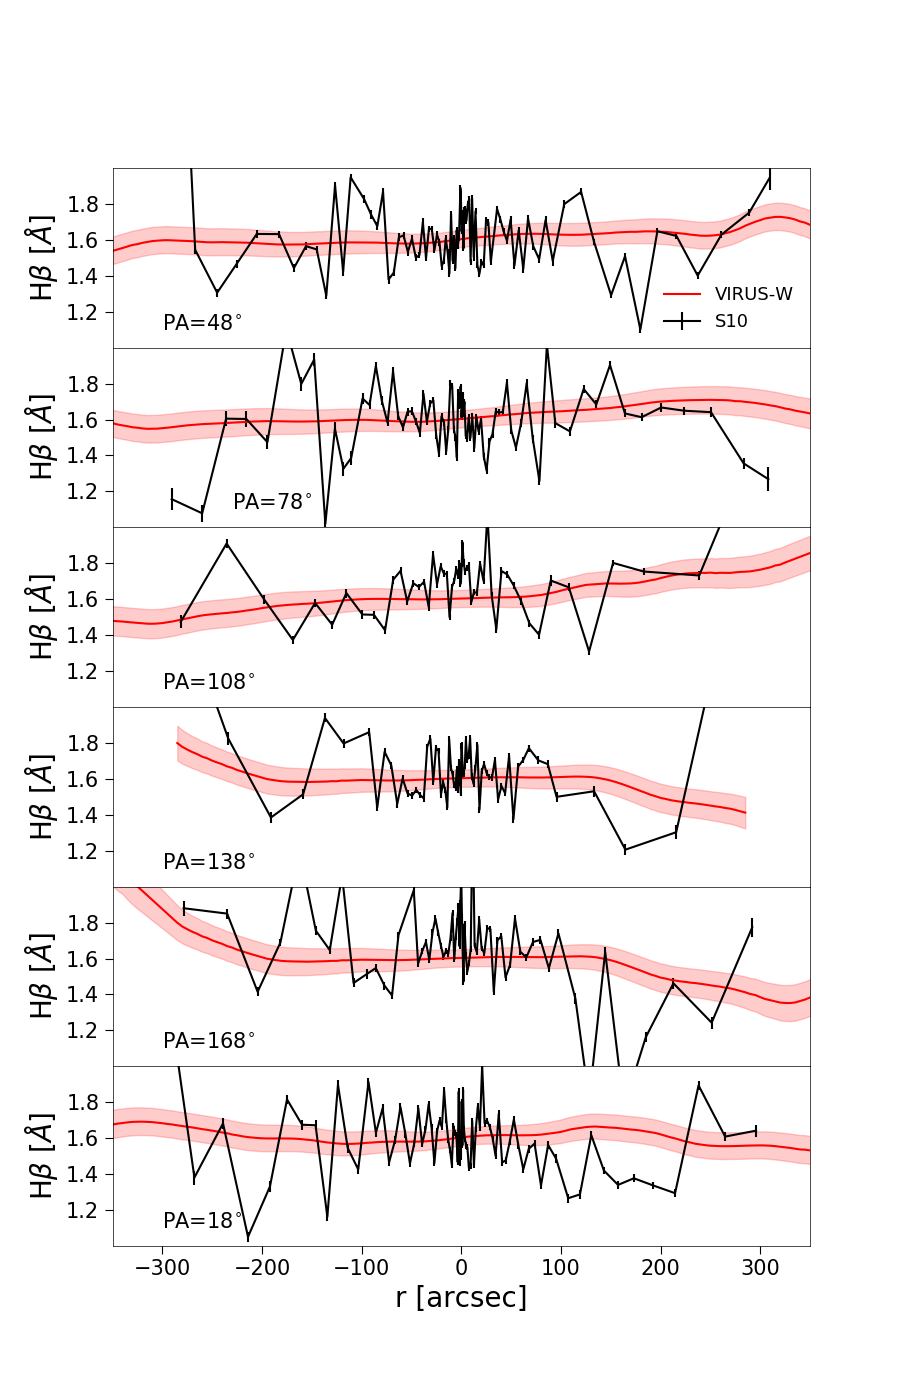
In this paper we exploit our VIRUS-W spectroscopic observations of M31 (see Paper I) to study the stellar populations of the components of its central regions (the bar, classical and B/P bulge, and disk) and address the open questions discussed above. Saglia et al. (2010, hereafter S10) measured the stellar populations of the central region of M31 along six position angles deriving old ages, solar metallicity, and slight elements overabundance. We complete and revise the picture by presenting two-dimensional maps of these quantities.
Our observations are complementary to the study of Dong et al. (2018), who analyzed the color-magnitude diagrams of the inner arcsec bulge region of M31. These authors detected a widespread population of stars younger than 5 Gyr, but 80% of these stars have stellar mass outside 100 arcsec from the center that is older than 8 Gyr and metal rich ([Fe/H]).
We observed M31 for 14 nights with the integral field spectrograph VIRUS-W attached to the 2.7 m telescope at the McDonald Observatory, Texas, covering the bulge area with a filling factor of one-third and sampling the disk along six different directions, reaching approximately one scalelength along the major axis. The integral field unit VIRUS-W of consists of 267 fibers that are arranged in a rectangular pattern. The wavelengths covered range from 4800 Å to 5400 Å, spectral resolution is , which corresponds to =15. A detailed description of the observations can be found in Paper I.
We rebinned the 56.000 spectra to 7562 binned spectra to increase the signal-to-noise ratio in the outer parts and reach the minimum value of 30. These binned spectra were fitted with pPXF (Cappellari & Copin, 2003) and GANDALF (Sarzi et al., 2006) to obtain the kinematics of the stars, ionized gas, gas fluxes, and ionization mechanisms. This is described in detail in Paper I and results in 6473 velocity determinations. We focus on the measurement of the absorption line indices and the stellar populations for these 6473 spectra.
The paper is structured as follows. In Sect. 2, we describe the measurement of the absorption line indices and the derivation of the stellar population properties. Sect. 3 discusses the stellar population properties of the classical and B/P bulge components, bar, and disk, proposing a possible formation scenario. We summarize our findings in Sect. 4. The appendix shows the comparison with our previous measurements of S10 and gives examples of the format of the tables presenting the data and available online. As in Paper I, we adopt a distance to M31 of Mpc. At this distance 1 arcsec corresponds to 3.78 pc.
2 Methods
In this section, we present the measurement of absorption line strengths in the Lick/IDS system (Burstein et al., 1984; Faber et al., 1985; Burstein et al., 1986; Worthey et al., 1994) and the comparison to simple stellar population (SSP) models (Maraston, 1998, 2005; Thomas et al., 2003, 2011) to obtain the age, metallicity and [/Fe] overabundance of the stellar populations. As described in Paper I, we used pPXF (Cappellari & Copin, 2003) to fit the stellar kinematics of the stars and GANDALF (Sarzi et al., 2006) to fit the kinematics and line fluxes of the ionized gas, mainly using the [OIII]5007 line.
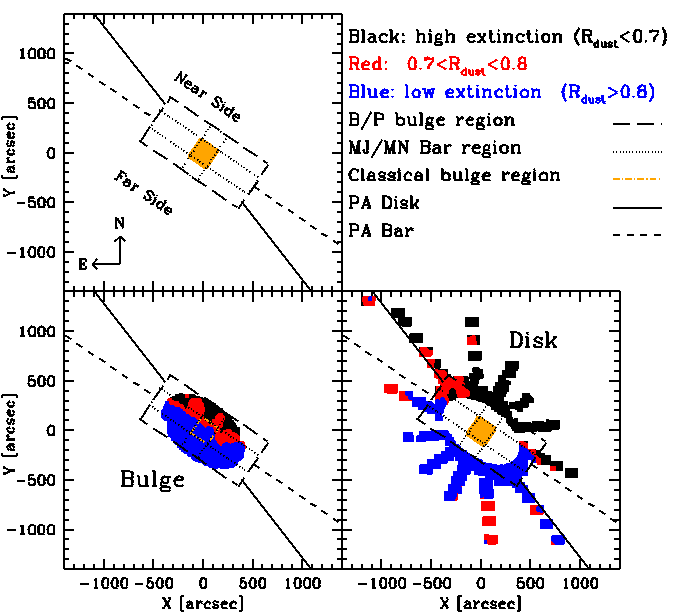
In order to interpret the features visible in the maps of the Lick indices presented below, we took the distribution of the dust in M31 into account. Blaña et al. (2018) have produced a map projected onto the plane of the sky of the ratio of the three-dimensional model luminosities measured with and without dust using the dust maps of Draine et al. (2014), converted to following Draine & Li (2007). According to this map, the light integrated along the near side of M31 is dominated by the outer part of the disk, since the rest is highly absorbed (). In the far side of M31, where the light of the bulge region and the inner part of the disk dominates. Fig. 1 of B17 and Blaña et al. (2018) illustrate these geometric situations; see also Dalcanton et al. (2015).
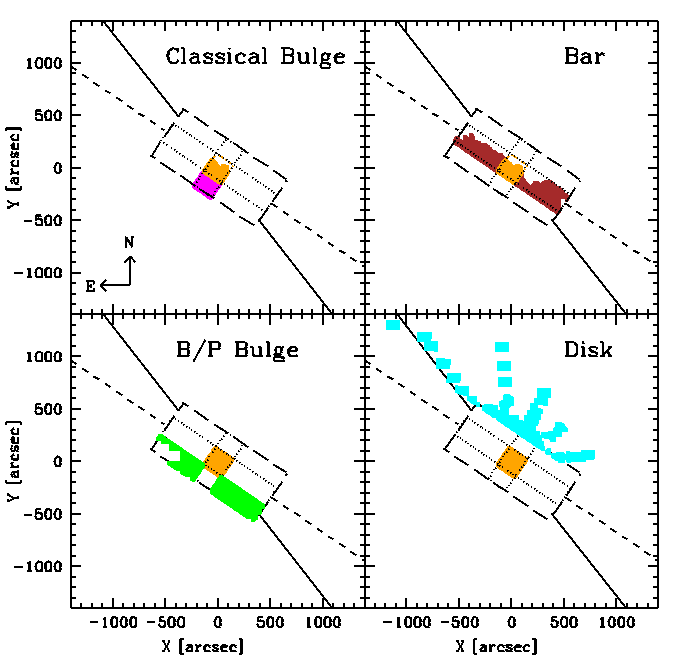
As a second ingredient, we need to define quantitatively the different structures present in M31. We distinguish between a disk and a bulge photometric region using the decomposition of Kormendy & Bender (1999) adopted in Paper I and shown in Fig. 1. Accordingly, the photometric bulge region is the region of M31 where the local bulge-to-total ratio of M31 is higher than 0.5. Following B17 we call B/P bulge the rectangular portion of the sky around the center of M31 with position angle degrees, excluding the central ; this area is dominated by the light of the CB. We call bar major axis the rectangular portion with the same , and bar minor axis the rectangular portion with . Figs. 2 and 3 provide a graphical representation of our definitions.
2.1 Lick indices
In Paper I we describe how we removed the fitted emission lines from the binned spectra before our derivation of line-of-sight velocity distributions. Using these cleaned, flux calibrated spectra we now measure the Lick indices. For the Lick/IDS system we use the band definitions of Trager et al. (1998). The indices that fall into our spectral range are H, Mg b and the iron indices Fe5015, Fe5270, Fe5335 and Fe5406. The indices H, Mg b and Fe5015 are affected by emission; on average, the corrections amount to Å, Å and Å, respectively. These values are very similar to those reported by Saglia et al. (2010). No correlations are seen between the index values and the size of the corrections.
Errors on the index measurements are estimated using a Monte Carlo
approach. For each spectrum, 1000 representations with
added random Gaussian noise are created and the width of the Gaussian is
the noise value of the binned spectra from Paper I.
The typical errors are around 0.1-0.2 Å.
We make sure that we are on the Lick/IDS system by comparing our measured values to those by S10, which have been calibrated to the Lick/IDS system. The comparison plots are shown in Sect. 5.1 in the Appendix and both datasets agree very well. In particular, the agreement at the level of 0.1 Å between the H, Fe5015, and Mgb indices is reassuring of the consistency of the removal of the emission lines (see Fig. 8 of Saglia et al., 2010).
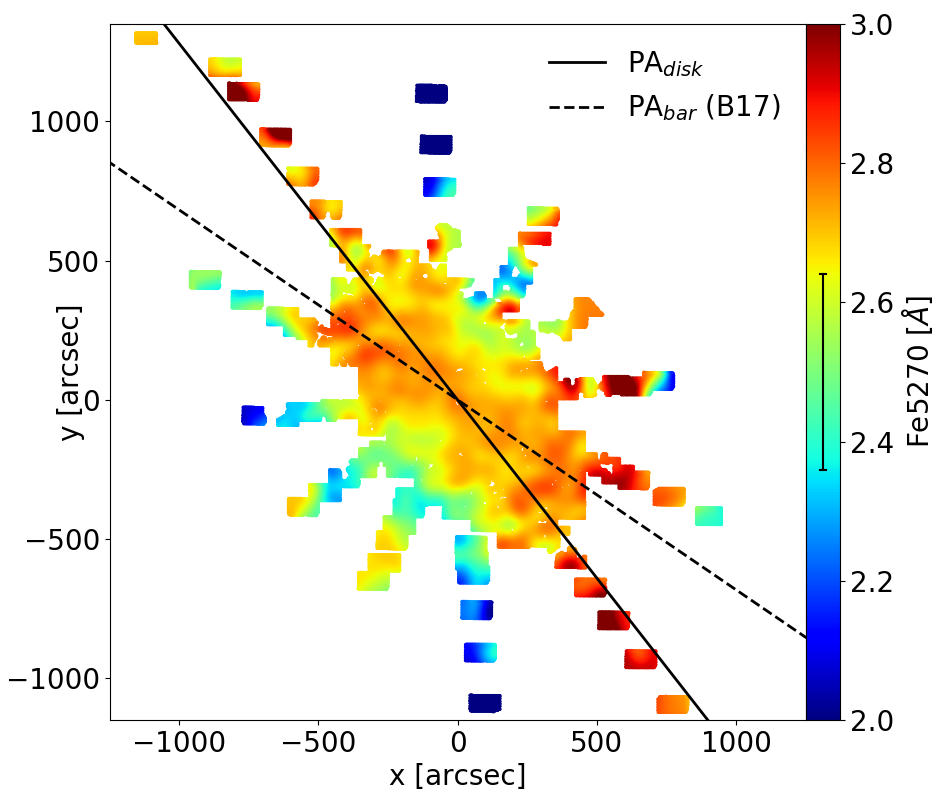
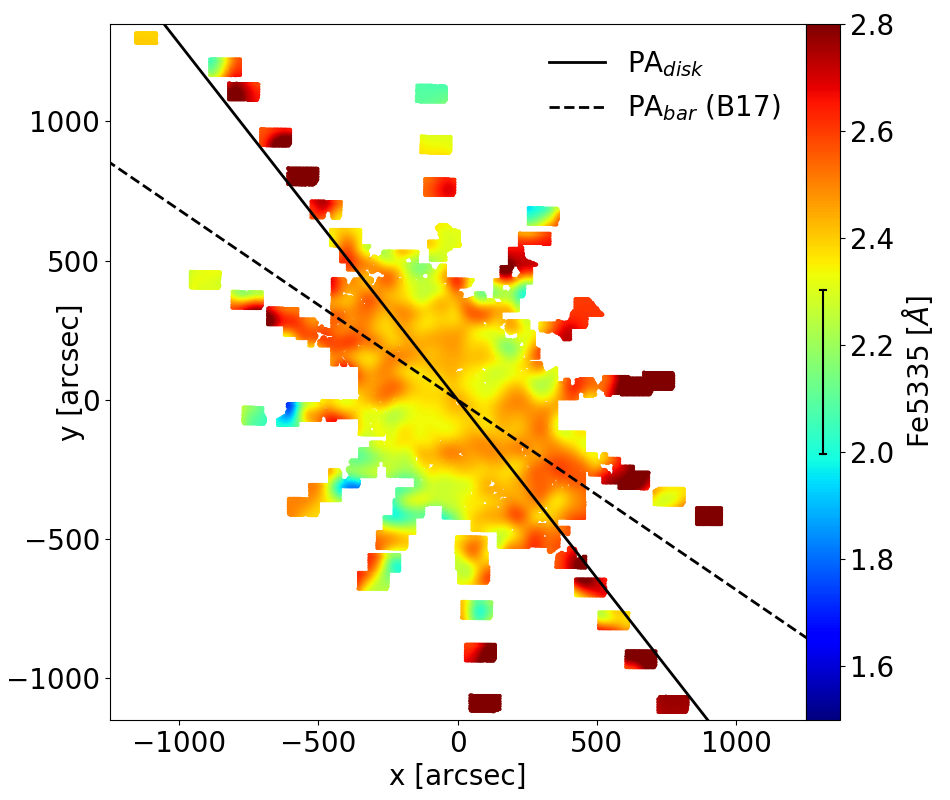
The resulting maps for the Lick indices are plotted in Figs. 4 to 9; they have been smoothed with a two-dimensional Gaussian filter with ″ to reduce the noise in the maps and make the trends clearer. Their tabulated values are available online, a small part of which are presented in Table 6 in the Appendix to clarify the format.


The overall distribution of the H values is asymmetric; see Fig. 4, where higher values are on the northwestern side and lower values on the southeastern side of the galaxy. A comparison with Fig. 2 shows that in the first case we are probing that near side of M31, where the dusty disk largely screens the inner high density regions of the bulge and where we expect to find the younger population of stars of the external regions of the disk, with higher values of H. In the second case we are looking through the relatively unextincted classical, B/P, and bar regions, where an older population of stars with lower values of H could be expected.
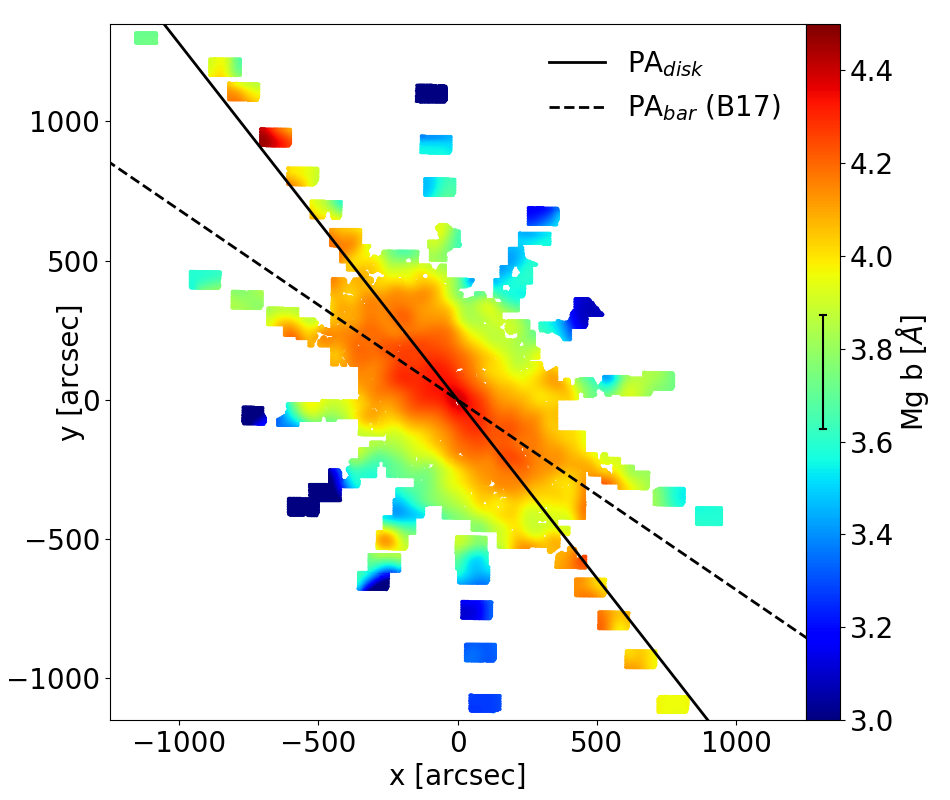
The Mg b index, as an -element important for the measurement of the [Fe] overabundance, is plotted in Fig. 5. The overall appearance of the map shows a clear enhancement in the B/P bulge region, which has particularly high values in the CB region and a strong negative gradient perpendicular to the bar and a milder gradient parallel to the bar (see Fig. 3). In the disk region the Mg b index is smaller.
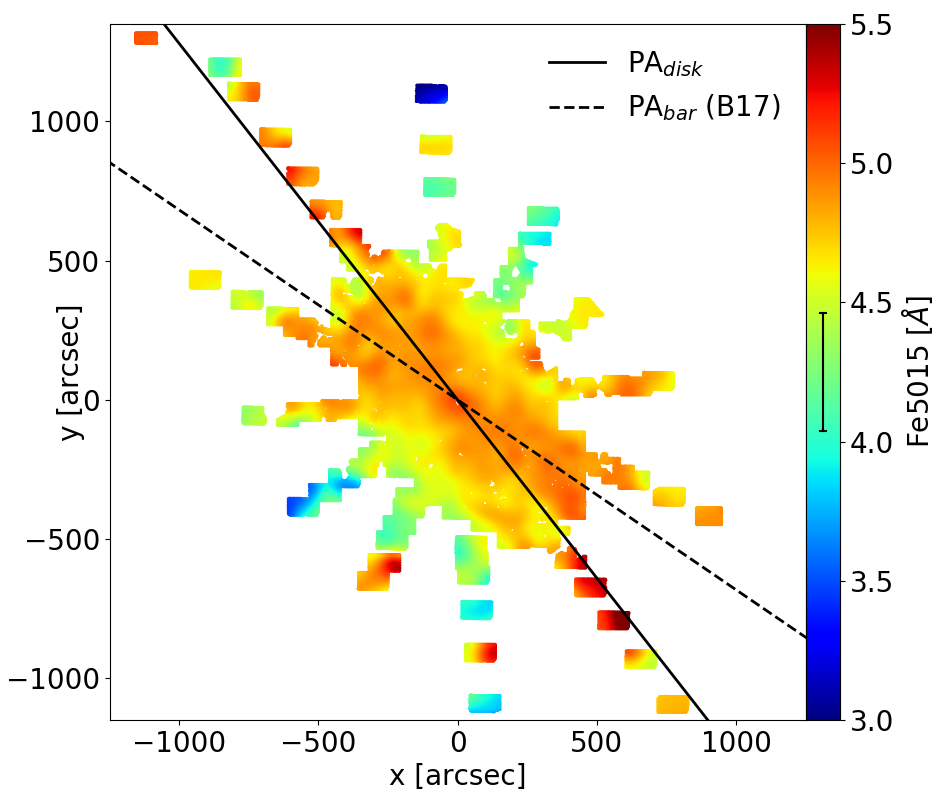
The iron indices show a similar pattern to the Mg b index map, which is also elongated and enhanced along the bar direction. There is a hint of a central pinching orthogonal to the bar, reminiscent of what is discussed in Debattista et al. (2017), Fragkoudi et al. (2017), and Martinez-Valpuesta & Gerhard (2013). A slight pinching is also observed in the MW bulge (Gonzalez et al., 2013).
2.2 Stellar population analysis
We adopted the method by S10 to measure stellar
population properties. We assume that a spectrum of M31 is well
represented by one single stellar population, which is chemically
homogeneous and in which all stars have the same age. As
discussed above, several components are present in the bulge region
of M31. Interpreting mixed stellar populations with SSPs biases the
inferred stellar population properties toward the youngest
component present. In
Sect. 3 we discuss the size of this effect.
For these populations we take SSP models
from Maraston (1998, 2005), which are combined with a
Kroupa (2001) initial mass function (IMF) and Lick indices models that take
into account the [/Fe] overabundance by Thomas et al. (2003, 2011). This is a reasonable assumption, given that
Zieleniewski et al. (2015) found that a Chabrier IMF is appropriate for the
bulge of M31. We note that only the M/L ratios and not the line indices
considered in this work are sensitive to this choice.
Since the original models by Maraston (1998, 2005) and
Thomas et al. (2003, 2011) are computed for a relatively coarse grid of
age, [Z/H] and [Fe], we interpolated these onto a finer grid,
ranging in age from 0.1 to 15.0 Gyr with a step size of 0.1 Gyr, in
metallicity from -2.25 to 0.67 with a step size of 0.02, and in
[/Fe] overabundance from -0.3 to 0.5 with a step size of 0.05.
We also considered the models of Vazdekis et al. (2015), which are provided for two values of the [/Fe] overabundance (0 and 0.4 dex). The resulting stellar population parameters are similar to what is discussed below, in particular the inability of reproducing a large percentage of H values without hitting the maximum allowed age (in this case 14 Gyr). Hereafter we focus on the models of Thomas et al. (2011), given that they cover a larger range of [/Fe] overabundances.
The measured Lick index value for a binned spectrum is compared to those in the model grid. For each gridpoint , is calculated
| (1) | ||||
is
| (2) |
We computed solutions for both the Thomas et al. (2003) and
Thomas et al. (2011) models. We find that our measured values for Fe5015
are reproduced well by the models of Thomas et al. (2011), but not by the
models of Thomas et al. (2003), which on average give Fe5015 values larger by 0.5 Å than the measured data. We therefore adopted the Thomas et al. (2011)
models for the following analysis and derive solutions based on the
Thomas et al. (2003) without considering the Fe5015 index to
compare with the results of S10 presented in the
Appendix. The grid index for which is minimal is
determined and the values for age, metallicity
[Z/H] and overabundance [Fe] are then
taken as the values for the stellar populations. Since we do not
extrapolate the SSP model grids, often (see below) the minimum
value is right at the edge of the grid. Using the age and metallicity
derived above we computed the corresponding ratios by
interpolating the Kroupa IMF table of Maraston (1998, 2005). The values (one per binned spectrum) of the measured
age, [Z/H], [Fe], and are provided in tabular form
online; an example that explains the format is presented in Table
7 in the Appendix.
Fig. 10 shows their histograms and cumulative
distributions. The formal statistical errors are estimated by
quoting the model range of values for which
, with a minimum error on the age of
0.1 Gyr, on [Z/H] and [Fe] of 0.01 dex, and on of
0.1 . The average statistical errors on age, [Z/H],
[Fe], and are 1 Gyr, 0.04 dex, 0.02 dex, and 0.3
, respectively.

The agreement between the measured index values and the model values of Thomas et al. (2011) is good; the median difference Data-Model is 0.11 Å for Fe5335 (worst case), and -0.01 Å for H (best case). However, H model values as low as or lower than 1.6 Å are obtained only for old, metal, and iron-rich SSPs, while our measurements require old, metal-rich, and element overabundant SSPs. Approximately half of our measured values are smaller than 1.6 Å by on average 0.2 Å. As discussed above, it is unlikely that this is because of a systematic oversubtraction of emission components. This means that for almost 40% of the measurements (see Fig. 10) the best-fitting age is the maximum allowed by the grid, i.e., 15 Gyr (larger than the age of the Universe of 13.8 Gyr), where our formal statistical errors are clearly underestimated. The remaining 60% are distributed almost uniformly between 5 and 15 Gyr, of which 2.5% of the measurements give ages smaller than 5 Gyr. As a consequence, we overestimated the true ages of the stellar populations of M31; capping the measured ages to 13.8 Gyr, we reduced the overall average age by 0.6 Gyr from 12.6 to 12 Gyr. If instead we scale down every measured age by 13.8/15, we reduce the overall average age by 0.9 Gyr.
The impact on the derived metallicities and overabundances is however very limited. The distributions of measured metallicities and overabundances (see Fig. 10) are approximately Gaussians. Allowing a maximum age of the models of 13.8 increases the best-fitting metallicities of the affected spectra on average by only 0.026 dex (the overall average increases by 0.01 dex), well within the quoted errors, while the overabundances are essentially unchanged. We conclude that while the metallicites and overabundances are robust, we can trust the age rankings more than their absolute values.
The distributions of the values is more skewed; a low value tail corresponds to the flat age distribution part. Under the effect of the age capping the derived mass-to-light ratios in the V band are reduced on average by , approximately the size of the errors.
When computed with the Thomas et al. (2003) models, ages are 0.7 Gyr smaller, metallicities are 0.04 dex larger, and [Fe] overabundances are 0.05 dex smaller than the median values derived using the Thomas et al. (2011) models. Fig. 11 shows the correlations between age, [Z/H], and [Fe]. Metallicities are broadly anticorrelated with ages and on average solar; elements are almost always overabundant (on average by 0.27 dex) with respect to the solar values.

Using the derived above (see Fig. 10) we can translate the light sampled by each spectrum and estimated from the photometry of Kormendy & Bender (1999) into the corresponding stellar mass. Fig. 12 shows that every spectrum samples at least and that 80% of our spectra sample at least . For the 5% of spectra dated less than 6 Gyr, 78% sample less than . These percentages of spectra sampling less than are probably overestimates, since the presence of young populations (see discussion below) can reduce the measured by up to 70% with respect to the true value. Bruzual et al. (2017) showed that a stellar mass of suffices to average out the noise due to the stocastic sampling of the IMF and that below the noise becomes prohibitively high.

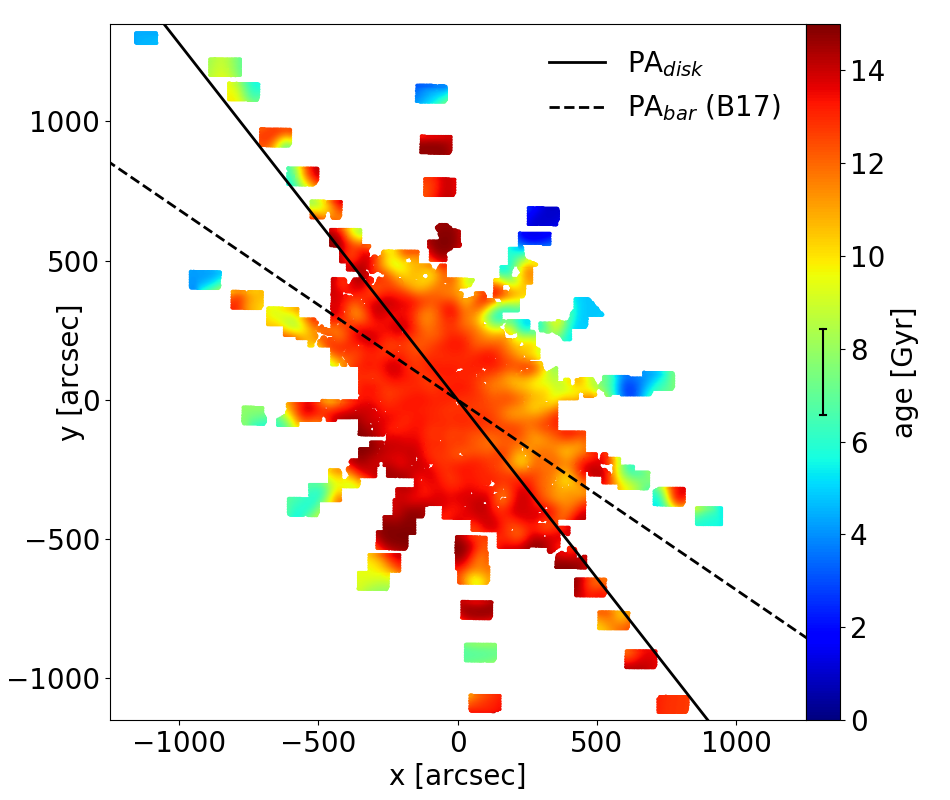
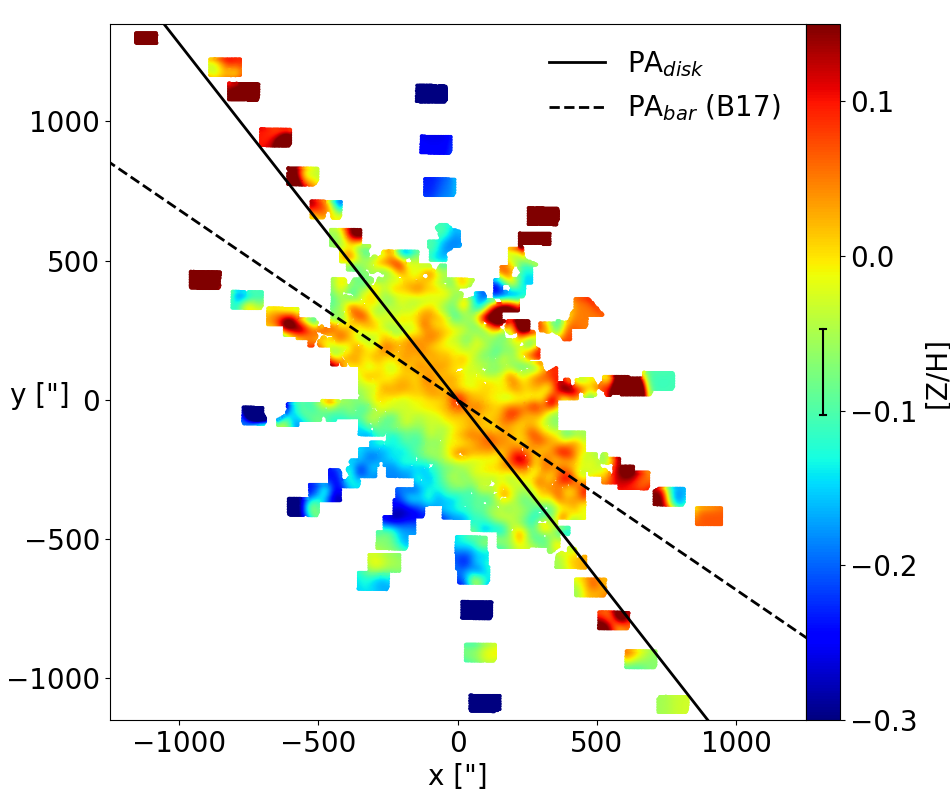
The Figures 13, 14, 15, and 16 show the spatial distributions (smoothed with a two-dimensional Gaussian filter with ″) of the age, metallicity, element overabundance, and ratios. The smooth appearance of Fig. 13 masks the spread of the spatial distribution of measured ages: Fig. 17 shows that at almost every position in the bulge region we observe a mixture of between 40 and 50% of 15 Gyr values and the almost flat distribution of ages between 4 and 15 Gyr already seen in Fig. 10. In contrast, in the disk region 80% of the age values are lower than 15 Gyr.
Dong et al. (2018) analyzed the color-magnitude diagrams of the inner arcsec bulge region of M31, detecting a widespread population of stars younger than 5 Gyr. Some 80% of the stellar mass outside 100 arcsec from the center should be older than 8 Gyr and metal rich ([Fe/H]). We note that for 80% of our spectra we determine a Lick-based age that is larger than 10 Gyr (see Fig. 10). Some 6% of the total mass in this region should be younger than 2 Gyr. Moreover, Dong et al. (2018) reported the existence of bright (100-10000 ) young ( Gyr) stars in the inner 100-200 arcsec of M31. Our single fibers cover 8 arcsec2, sampling of the order of at 100-200 arcsec from the center; in addition, these fibers cover one-third of the available area, every 3 or 1 out of 10 fibers contain one of these stars.
Following the method described in Sect. 3.2 (see Eq. 6), we computed the Lick indices that a mix of SSPs distributed in age and mass as derived by Dong et al. (2018, see their Fig. 19) would have assuming [Z/H]=0.35 and [Fe]=0.3; we note that the oldest population component considered there has an age of 12 Gyr. We compared the derived mean luminosity-weighted age to the true mass-weighted age of the mixture. We find that Lick ages larger than 8 Gyr can be obtained only in the absence of components younger than 3-4 Gyr. In this case Lick ages estimate the mass-weighted age within 0.1 Gyr. Lick ages lower than 5-6 Gyr are measured if the 1-2 Gyr population component is present. In this case Lick ages underestimate the mass-weighted age by 1-2 Gyr and, as a consequence, the derived by up to 70%. It is therefore plausible that the distribution of ages of Fig. 10 originates from a combination of measurement errors and the random sampling of a mixture of a majority of old ( Gyr) stars with a minority of younger ( Gyr) stars.
Finally, it is important to note that there is no difference between the stellar kinematics (velocity and velocity dispersions) of fibers tagged with an old ( Gyr) or young ( Gyr) Lick age. Therefore the fibers tagged with a young age belong to the bulge region and do not sample disk stars seen in projection.
The mean metallicity similar to the solar value quoted by Sarajedini & Jablonka (2005) is compatible with the values we derive for the disk region (see Fig. 24). Gregersen et al. (2015) derived a metallicity using observed individual red giant branch stars outside 720″. They measure an enhancement of metallicity in the bar region, in agreement with our findings, and a decline of the metallicity outside 720″, which is not seen in our data. However, they assume a constant age of 4 Gyr for their data, which might not be appropriate (see Fig. 24).
Figs. 31, 32, and 33 in the Appendix compare our values based on the Thomas et al. (2003) models to those measured by S10 and find an overall good agreement. Their young central population, coupled with a metallicity and an overabundance gradient, is somewhat washed out by the size of our fibers and the Gaussian filtering applied in this work, but can be seen in the Figs. 17, 21, and 22.

We turn now to a discussion of the mean age, metallicity, [/Fe] overabundance, and maps. As discussed above, the overall distributions of the metallicity, [/Fe] overabundance, and values are Gaussian-like and defining a meaningful spatially dependent mean is not a problem. This is not obviously true for the age values, where a large percentage of best-fitting ages hit the maximum allowed by the grid. Therefore, guided by the fact that 80% of our measured ages are older than 10 Gyr (see Fig. 10), we construct a second age map (Fig. 18), where at each point we plot the age corresponding to the 20% percentile of the ages in a radius of 100 arcsec around the point; i.e., 80% of the measured population ages in the 100 arcsec radius are older than this value. We tabulate these values dubbed Age20% in Table 7, where we also report the 20% we derive with these ages at the metallicity [Z/H] of each point.
Both this map and the mean age map of Fig. 13 are reminiscent of the H map of Fig. 4; the overall distribution is asymmetric and lower values in the upper half are relative to the disk major axis and higher values in the lower half. As discussed above, we relate this gradient to the dust present in the disk of M31, that is masking the old stellar population of the bulge in the upper half. On average, the two maps differ by 2.4 Gyr, which can be seen as the systematic uncertainty of our age estimates. The most obvious systematic difference between the two maps, the 6 to 8 Gyr patch visible to the northwest of the center in Fig. 18, is probably due to the 5 kpc star formation ring discussed by Dong et al. (2018, see their Fig. 12).
The mean metallicity in Fig. 14 is enhanced along the bar position angle, such as the Mg b and iron indices. The mean [/Fe]-overabundance map of Fig. 15 shows that [/Fe] is enhanced in the central region, but otherwise relatively constant over the whole area without the bar signature of the metallicity. The mean map of Fig 16 looks similar to the age map and has lower values in the top right and higher values in the bottom left. Fig. 19 shows the map of the 20% values reported in Table 7 (smoothed with a two-dimensional Gaussian filter with ″). They are on average 0.8 smaller than the given there. The map mirrors closely the topology observed in Fig. 18.

3 Discussion
In the following, we concentrate on interpreting the mean trends mentioned above.
3.1 Is there a young disk component in the bulge region?
The B17 model of M31 produces a B/P bulge component through a bar buckling phase that destroys the original old primordial disk. The age maps of Figs. 13 and 18 show that the outer disk regions of M31 can be as young as 4 Gyr. In Paper I we used the major axis photometric decomposition of Kormendy & Bender (1999) shown in Fig. 1 to define the bulge and disk region of the galaxy. In this paper, we want to investigate whether a cold, rotating disk component in the inner 600 arcsec region of M31 is compatible with the observed kinematics and whether it could be as young as the outer disk (4 Gyr). We note, however, that Kormendy & Bender (1999) did not claim that their decomposition implies the presence of such a disk.
First, we assess whether the line-of-sight velocity distributions (LOSVDs) presented in Paper I can be explained by the sum of two Gaussians and , describing the kinematics of a bulge and a disk component with the bulge-to-total fraction and the disk-to-total fraction values taken from the model image of Paper I as follows:
| (3) |
Fitting an (almost) Gaussian LOSVD with two Gaussians is inherently degenerate and at least two almost equivalent solutions can be found. One of these is a hot bulge with little rotation plus a colder, quickly rotating disk. A second solution produces a bulge with cylindrical rotation and a disk with on average zero rotational velocity in the inner 100 arcsec. Performing the decomposition described by Eq. 3 on the models of B17 yields qualitatively the same results with similar solutions.
As a second step, we build a two-component spectral model. We choose one spectrum from the very center of M31 as the bulge spectrum and the outermost bin along direction PA=55∘ on the eastern side as the disk spectrum. We fit both the bulge and disk spectrum with pPXF to obtain the optical linear combinations of the template star spectra that best describe them. For these fits, all the spectra of the 230 giants from the ELODIE catalog (Prugniel et al., 2007) are used and broadened to the VIRUS-W resolution. The fits result in a model bulge and a model disk spectrum. We broaden the bulge and disk model spectra with the LOSVDs and determined above, considering both kinematic solutions, and sum the broadened model spectra. We measure the Lick indices on these combined model spectra with the method described in Sec. 2. We then fit age, metallicity, and [Fe] overabundance in a similar way as in Sect. 2. The resulting age map (see Fig. 6.35 in Opitsch, 2016) shows a strong radial gradient from the center, where the old population of the bulge spectrum dominates, to the outer regions, where the spectrum of the young disk population becomes important. This is not compatible with what we observe in Fig. 13 or 18. The result holds whatever kinematic decomposition we use. We conclude that a young (4 Gyr) disk component distributed as the photometric decomposition of Kormendy & Bender (1999) is not present in the inner 600 arcsec region of M31. This result is not surprising, given that on average 80% of our age measurements are older than 10 Gyr, while the exponential component of Kormendy & Bender (1999) contributes more than 20% of the light at distances larger than 200 arcsec from the center. We could accommodate the mild age gradient along the major axis of M31 (see Fig. 22, top left) if the disk component distributed as the photometric decomposition of Kormendy & Bender (1999) were as old as the bulge at the center and became progressively younger with distance, reaching 6 Gyr at 600 arcsec.
As discussed in the Introduction, Blaña et al. (2018) presented a model of the inner region of M31 as the sum of a bar plus B/P component and a CB. Fig. 1 shows their profiles along the bar region and along the position angle of the major axis of M31, as V-band luminosity densities projected along the line of sight, taking into account dust attenuation. The comparison with the decomposition of Kormendy & Bender (1999) reveals the following. By construction, the B/P component matches the profile of the disk outside the bar region ( arcsec), in agreement with Kormendy & Bender (1999). However, inside this region much of what Kormendy & Bender (1999) referred to as the bulge component is, in reality, the bar plus B/P structure. As a consequence, the CB component of Blaña et al. (2018) model has a much shorter scale length than that of Kormendy & Bender (1999).
Fig. 20 shows the ratios BP/CB between the projected V-band luminosity densities, taking into account dust attenuation, of these two components for the four regions shown in Fig. 3. At distances smaller than 100 arcsec from the center the ratio BP/CB is less than one and CB dominates the V-band light. In contrast, the ratio BP/CB is always larger than 2 in the B/P bulge (denoted in green in Fig. 3) and larger than 4 in the disk (denoted in cyan in Fig. 3) regions. We make use of these BP/CB profiles in the next section.

3.2 Classical and B/P bulge, bar, and disk
In order to characterize the mean stellar populations of the classical and B/P bulge, bar, and disk components, we computed profiles, averaged over radial bins chosen to smooth out the spread of the single measurements, along four directions, plotting these as a function of the distance from the center. As for the age map, we also provide the profiles of the ages corresponding to the 20% percentiles of the age distributions in the bins. Fig. 21 shows the values of the age, metallicity, [/Fe], and obtained by averaging the age, metallicity, [/Fe], and in radial bins (10 arcsec wide in the inner 100 arcsec, 30 arcsec wide at larger distance) over a rectangular region 200 arcsec wide and 450 arcsec long in the CB and minor axis region (perpendicular to the bar) and taking into account only points with low absorption (, see Fig. 3). Fig. 22 shows the same profiles in the bar region, averaged in radial bins (10 arcsec wide in the inner 100 arcsec, 100 arcsec wide at larger distance) over a rectangular region 200 arcsec wide and 1200 arcsec along the bar at deg, again with (see Fig. 3). Fig. 23 presents the profiles obtained in the B/P bulge region with low absorption (see Fig. 3) using radial bins 110 arcsec wide. Finally, Fig. 24 shows the profiles for the disk region, outside the B/P bulge in the northern, dusty part of M31 (see Fig. 3) using radial bins 360 arcsec wide. In Table 3.2 we give the average values and rms of these profiles and in Table 3.2 the linear gradients and zero points measured from the profiles shown in Figs. 21 to 24.
As discussed above, capping the maximum ages to the age of the universe shifts the mean ages and profiles of the bar, CB and B/P regions by approximately 0.6 Gyr and by 0.3 Gyr in the disk. The age gradients quoted in Table 3.2 vary less than the quoted errors.
Table 3 reports the means and rms, gradients, and zero points of the age profiles shown by the black dotted lines (based on the 20% percentile of the distribution of the age values in the bins) in the Figs. 21 to 24. In this case the ages of the bar, CB, and B/P regions are approximately 2 Gyr younger and the disk appears 5 Gyr younger.
In order to partially address the fact that we are using SSPs to interpret the line strengths of a mix of stellar populations, we construct the following simple two-populations model. We assume that the CB (marked orange and magenta in the top left and right plots of Fig. 3) is made of stars of the same age and element overabundance [Fe]CB with a metallicity profile written as
| (4) |
Moreover, the bar (indicated in brown in the top right plot of Fig. 3), the B/P bulge (indicated in green in the bottom left plot of Fig. 3) and the disk (indicated in cyan in the bottom right plot of Fig. 3) are described by stellar populations with constant age , , , metallicity , , , and profile of element overabundance
| (5) |
At each radius and for each region of Fig. 3 we compute the line strength indices and (where indicates , or , according to the region considered) appropriate for the age, metallicity, and overabundance corresponding to the assumptions made above, and we derive the indices of the sum of the components as
| (6) |
Finally, we compute the age, metallicity, and overabundance of the SSP that best reproduce the set of indices at each radius by minimizing Eq. 1. Table 4 reports the values of the parameters chosen to produce the profiles shown by the blue lines in Figs. 21-24. The age profiles shown as blue dotted lines in the same figures are computed using the values denoted as “20%” in the table. The radial variations of these profiles are the result of the combination of the varying radial contributions of the CB, bar, and B/P components captured by the function and the intrinsic gradients modeled by Eqs. 4 and 5. The proposed solution is by no means unique, but its existence makes the following arguments plausible.
We start with a discussion of the CB region, which dominates the inner 78 arcsec (see Fig. 20) and can be characterized best by focusing on the region orthogonal to the bar shown in Fig. 21. The age profile is essentially constant, which we model assuming in Table 4. The central decrease in age is the low-resolution appearance of the central young population detected in the high-resolution data of Saglia et al. (2010, their Fig. 12).
The metallicity of the CB region is high at the center ([Z/H]) and declines outward in broad agreement with Dong et al. (2018) . There is a change in slope of the metallicity gradient at roughly 78 arcsec, or 0.13 , with =600″ taken from B17, from rather steep (-0.5 dex/kpc, entry ‘InBulge’ in Table 3.2, corresponding to the orange region of Fig. 3), to -0.1 dex/kpc (entry ‘OutBulge’ in Table 3.2, corresponding to the magenta region in Fig.3). Similar gradients and changes of slopes at this radius are measured in barless galaxies or along the minor axis of barred galaxies (Seidel et al., 2016). Our simple model captures this trend with Eq. 4.
We modeled the complex behavior of the element profile with a constant [Fe] value of the CB and the mild gradient (Eq. 5 and Table 4) for the bar and B/P components. The hint of a central decrease of [Fe] is also seen in the higher resolution data of Saglia et al. (2010, their Fig. 12) and is related to the recent episode of star formation discussed there. The central values of the age, [Z/H], and [Fe] that we measure for M31 are similar to what Thomas & Davies (2006) compiled for CBs of similar velocity dispersion. The profile increases toward the center ( arcsec) as a result of the metallicity gradient of the CB and flattens out at larger distances.
The cut along the bar of Fig. 22 (top left) shows that the bar (outside 78 arcsec from the center, corresponding to the brown region in Fig. 3) is mainly made of old stars ( Gyr, entry ‘Bar’ in Table 3.2, or Gyr from Table 3) 1-2 Gyr younger than those of the CB (entry ‘InBulge’ in the same tables). The (mild) observed age and gradients come into place through the mixing of the CB and bar populations. There is no metallicity gradient along the bar, but we need to assume the presence of a shallow negative [/Fe] gradient along the bar to explain the observed [/Fe] profile. These considerations are mirrored by the choice of parameters made in Table 4. The absence of a metallicity gradient along the bar is compatible with the small positive gradients measured by Seidel et al. (2016) for a sample of 16 large barred galaxies.
The stellar population in the B/P bulge region (Fig. 23) is old ( Gyr, Table 3.2, entry ‘B/P’, or Gyr from Table 3) and has (sub)solar metallicity ( dex) and overabundant in elements ( dex). This population also has observed mild negative gradients that we explain through the effects of the declining metallicity of the CB (Eq. 4) and the gradient in the element overabundance of the B/P component (Eq. 5). Given the high inclination of M31, a detailed three-dimensional model of the bar and B/P bulge region with metallicity tags (Portail et al., 2017b) are needed to decide whether the kinematic fractionation model of Debattista et al. (2017) has played a role in shaping the metallicity map we observe. Interestingly, the hint of the pinching in the iron maps noted above is also mirrored into the [Fe/H] map. The mild decline of profile is driven by the declining metallicity of the CB component.
Given the old ages and relatively uniform metallicity determined for the three components (bar, classical, and B/P bulge) of the inner 600 arcsec of M31, it is not surprising that all of these have similar ratios. Therefore we conclude that the underlying assumption of a constant M/L ratio of the dynamical model presented in B17 and Blaña et al. (2018) is valid.
The profiles derived in the disk region (Fig. 24) are more irregular, probably because of the presence of patchy dust that also explain the irregular profile of Fig. 20 (bottom right plot). The stars can be as young as 3-4 Gyr, on average Gyr (Table 3.2, entry ‘Disk’, or 3.52.1 Gyr from Table 3), have approximately solar metallicity, are [Fe] overabunant ( dex) and have low (). We need to assume in our two-populations model that in this outer region the age of the B/P in the model of Blaña et al. (2018) is much smaller than previously assumed (7 or 5 Gyr, see Table 4) to reproduce the observed values of the age and .


| Region | Mean age | rms age | Mean [Z/H] | rms [Z/H] | Mean [Fe] | rms [Fe] | mean | rms |
|---|---|---|---|---|---|---|---|---|
| [Gyr] | [Gyr] | [dex] | [dex] | [dex] | [dex] | [] | [] | |
| InBulge | 12.9 | 0.3 | 0.06 | 0.05 | 0.28 | 0.01 | 4.7 | 0.2 |
| OutBulge | 12.8 | 0.3 | -0.02 | 0.03 | 0.28 | 0.02 | 4.4 | 0.1 |
| Bar | 12.4 | 0.4 | 0.02 | 0.01 | 0.27 | 0.02 | 4.4 | 0.1 |
| B/P | 13.1 | 0.2 | -0.04 | 0.01 | 0.25 | 0.02 | 4.4 | 0.1 |
| Disk | 8.5 | 0.9 | 0.03 | 0.08 | 0.24 | 0.05 | 3 | 0.1 |
| Region | Mean age | Age grad. | Age(r=0) |
|---|---|---|---|
| [Gyr] | [Gyr/kpc] | [Gyr] | |
| InBulge | 10.9 0.5 | 0.5 2.0 | 10.9 0.4 |
| OutBulge | 10.7 0.6 | 2.2 0.6 | 9.4 0.4 |
| Bar | 9.7 1.0 | -1.2 0.3 | 10.9 0.4 |
| B/P | 11.1 0.2 | 0.4 0.1 | 10.5 0.2 |
| Disk | 3.5 2.1 | 0.1 0.8 | 3.0 3.2 |
| Parameter | Value |
|---|---|
| 13 Gyr | |
| 20% | 11 Gyr |
| 0.35 dex | |
| -0.11 dex/dex | |
| 0.35 dex | |
| 12.2 Gyr | |
| 20% | 9 Gyr |
| 0.01 dex | |
| 0.35 dex | |
| -0.05 dex/dex | |
| 13 Gyr | |
| 20% | 11 Gyr |
| -0.09 dex | |
| 0.35 dex | |
| -0.05 dex/dex | |
| 7 Gyr | |
| 20% | 5 Gyr |
| 0.01 dex | |
| 0.35 dex | |
| -0.05 dex/dex |
It is worth comparing the properties of the M31 B/P bulge we discussed above with those of the MW bulge. To start, the MW has a strong B/P shape (Wegg & Gerhard, 2013), while this is not the case for M31 (Blaña et al., 2018). The vertical metallicity gradient in the MW is dex/kpc (Gonzalez et al., 2011) and is believed to be due to the fact that stars with higher metallicities are concentrated more to the Galactic plane and contribute less at high latitudes (Zoccali et al., 2008; Ness et al., 2013; Portail et al., 2017b). In M31, we measure a much weaker metallicity gradient (-0.1 dex/kpc) orthogonal to the bar 100 arcsec away from the center. Both the MW and M31 B/P structures have stellar populations that are enhanced (Ness et al., 2013). Finally, we derive mean old ages for the stellar populations of the bulge region of M31 and acknowledge the presence of a % of stars younger than 10 Gyr. For the MW bulge, color-magnitude diagrams suggest that the bulge stars of the MW are mostly very old, Gyr (Clarkson et al., 2011), and spectroscopy of microlensed dwarf stars points to a fraction of at least 18% younger than 5 Gyr (Bensby et al., 2017).
3.3 Possible formation scenario
The stellar population analysis presented in the previous section suggests that the inner 600 arcsec of M31 are made of three components: an old (11-13 Gyr), metal-rich ([Z/H] dex in the center with a negative gradient) and element overabundant CB; an almost coeval B/P bulge and a slightly younger bar. The B/P bulge and the bar have similar element overabundance declining slightly outward and subsolar metallicity, which is enhanced to solar values in the bar region. At larger distances from the center the stars of the disk of M31 become dominant. They are younger, have solar metallicity, and are element overabundant (but see the caveat at the end of this section).
Given the presence of dust and projection effects, firm conclusions can be reached only through the projection and analysis of a three-dimensional model, which we plan for a future paper, following the approach of Blaña et al. (2018). However, assuming that what is presented above holds, a possible formation scenario could be the following. An early, monolithic and quick appearance of the CB, could explain the metallicity gradient and the lack of iron implied by the absence of enrichment from supernovae of type Ia observed in that component. During this phase the formation of a primeval disk is also going on, which is transformed on a dynamical timescale of the order of 1 Gyr by the bar formation and buckling into a B/P bulge (Blaña Díaz et al., 2017). At this stage the gas is funnelled toward the bar region, where star formation continues, reducing the mean age of the stellar population by Gyr. Also, the chemical self-enrichment of the gas is enhanced in the bar region, where the deeper gravitational potential retains the gas more efficiently, causing an increase of the metallicity observed along the bar. Gas must have been available to sustain further star formation and explain the presence of the % of stars younger than 8 Gyr found by Dong et al. (2018). This is particularly true in the disk region probed by our observations, where younger mean ages are observed. There is an inconsistency in this picture, however. The radial gradient in [/Fe] that is required by our model along the bar and in the B/P bulge should imply a more extended period of star formation as the distance from the center increases. This contrasts with our assumption of a constant radial age for both the bar and B/P regions, which we need to follow the observed age profiles with our two-component model. But our age profiles are probably not accurate enough to detect this effect, given the spatial spread of measured ages discussed above. Also, Fig. 11 points to the presence of spectra tagged with ages younger than 6 Gyr and high [/Fe] overabundance. But the stars in the bulge of the MW that are younger than 6 Gyr are less element enhanced (0.126 dex) than those older than 6 Gyr (0.215 dex; Schultheis et al., 2017). However, the procedure described in Sect. 2.2, where we mix SSPs according to the mass distributions of Dong et al. (2018), shows that we are bound to measure [/Fe] overabundances systematically biased high owing to the presence of the old and element overabundant component that dominates in mass the younger, possibly less element overabundant stellar population.
4 Conclusions
We measured the Lick absorption indices (Trager et al., 1998) using the M31 spectra presented in Paper I and fit the stellar populations by applying the method of S10. We distinguished between the inner 600 arcsec, where the photometric bulge dominates, and the outer region of M31, where the disk is prominent. We mapped the regions where the dust absorption is less of a problem and used these to trace the average stellar population properties of the classical and B/P bulge, the bar, and the disk of M31. The main results from this analysis are
-
(i)
H is approximately constant over the whole photometric bulge region, showing gradients due to the dust distribution and increasing in the disk. Mgb and several iron indices are enhanced along the bar. The presence of dust affects the overall topology of the line maps, by masking the light coming from the inner regions of M31, north of the disk major axis.
-
(ii)
The stellar populations are fairly old (10-12 Gyr); 80% of our measurements have ages larger than 10 Gyr. This mirrors the result of Dong et al. (2018), who conclude that 80% of the stars outside 100 arcsec from the center are older than 8 Gyr analyzing the bright end of color-magnitude diagrams. The stars of the disk are younger by 5-6 Gyr.
-
(iii)
Along the bar the metallicity is solar with a peak of 0.35 dex in the very center. A negative metallicity gradient is present, tracing the stellar population of the CB, in broad agreement with Dong et al. (2018). The B/P bulge has subsolar metallicity.
-
(iv)
The overabundance is around 0.25 dex everywhere, peaking to 0.35 dex in the CB region.
-
(v)
The value is for the old populations of the bar and the classical and B/P bulge, and smaller () in the disk. This supports the assumption by Blaña et al. (2018) of a constant mass-to-light ratio for the bar, classical, and B/P bulge components.
We investigated whether the presence of a (young) rotating disk component in the inner 600 arcsec of M31 with a light distribution following the photometric major axis decomposition of Kormendy & Bender (1999) is compatible with the kinematics and stellar populations we measured. While kinematically possible, a disk as young as 4 Gyr is not present in the inner 600 arcsec of M31.
We propose a two-phase formation scenario for the inner region of M31. A classical stellar bulge forms together with a primordial disk from a quasi-monolithic collapse or violent instability of the turbulent inner proto-disk. On larger scales the proto-disk develops a bar. The bar buckles and transforms the proto-disk into the B/P bulge. The stars in this region are mainly old. However, star formation went on further not only in the disk region, but also in the inner 600 arcsec of M31, more intensively in the bar.
In future papers we will explore how a realistic three-dimensional model taking into account the dust distribution of M31 (as in Blaña et al., 2018) can reproduce quantitatively our findings. This might shed further light on the sequence of events that built the central regions of M31. Moreover, we will estimate the rate of microlensing events expected from the self-lensing of the different populations of the central region of M31.
Acknowledgements: We thank the anonymous referee for a constructive critical reading of the manuscript.
References
- Athanassoula (2013) Athanassoula, E. 2013, Bars and secular evolution in disk galaxies: Theoretical input, ed. J. Falcón-Barroso & J. H. Knapen, 305
- Athanassoula & Beaton (2006) Athanassoula, E. & Beaton, R. L. 2006, MNRAS, 370, 1499
- Athanassoula et al. (2017) Athanassoula, E., Rodionov, S. A., & Prantzos, N. 2017, MNRAS, 467, L46
- Beaton et al. (2007) Beaton, R. L., Majewski, S. R., Guhathakurta, P., et al. 2007, ApJ, 658, L91
- Bensby et al. (2017) Bensby, T., Feltzing, S., Gould, A., et al. 2017, A&A, 605, A89
- Blaña et al. (2018) Blaña, M., Gerhard, O., Wegg, C., et al. 2018, submitted to MNRAS
- Blaña Díaz et al. (2017) Blaña Díaz, M., Wegg, C., Gerhard, O., et al. 2017, MNRAS, 466, 4279
- Bruzual et al. (2017) Bruzual, G., Gladis Magris, C., & Hernández-Pérez, F. 2017, in IAU Symposium, Vol. 321, Formation and Evolution of Galaxy Outskirts, ed. A. Gil de Paz, J. H. Knapen, & J. C. Lee, 96–98
- Bureau & Athanassoula (1999) Bureau, M. & Athanassoula, E. 1999, ApJ, 522, 686
- Burstein et al. (1984) Burstein, D., Faber, S. M., Gaskell, C. M., & Krumm, N. 1984, ApJ, 287, 586
- Burstein et al. (1986) Burstein, D., Faber, S. M., & Gonzalez, J. J. 1986, AJ, 91, 1130
- Cacho et al. (2014) Cacho, R., Sánchez-Blázquez, P., Gorgas, J., & Pérez, I. 2014, MNRAS, 442, 2496
- Cappellari & Copin (2003) Cappellari, M. & Copin, Y. 2003, MNRAS, 342, 345
- Cheung et al. (2013) Cheung, E., Athanassoula, E., Masters, K. L., et al. 2013, ApJ, 779, 162
- Cheung et al. (2015) Cheung, E., Trump, J. R., Athanassoula, E., et al. 2015, MNRAS, 447, 506
- Chung & Bureau (2004) Chung, A. & Bureau, M. 2004, AJ, 127, 3192
- Clarkson et al. (2011) Clarkson, W. I., Sahu, K. C., Anderson, J., et al. 2011, ApJ, 735, 37
- Coelho & Gadotti (2011) Coelho, P. & Gadotti, D. A. 2011, ApJ, 743, L13
- Dalcanton et al. (2015) Dalcanton, J. J., Fouesneau, M., Hogg, D. W., et al. 2015, ApJ, 814, 3
- de Lorenzi et al. (2007) de Lorenzi, F., Debattista, V. P., Gerhard, O., & Sambhus, N. 2007, MNRAS, 376, 71
- Debattista et al. (2017) Debattista, V. P., Ness, M., Gonzalez, O. A., et al. 2017, MNRAS, 469, 1587
- Di Matteo (2016) Di Matteo, P. 2016, PASA, 33, e027
- Di Matteo et al. (2015) Di Matteo, P., Gómez, A., Haywood, M., et al. 2015, A&A, 577, A1
- Di Matteo et al. (2013) Di Matteo, P., Haywood, M., Combes, F., Semelin, B., & Snaith, O. N. 2013, A&A, 553, A102
- Dong et al. (2018) Dong, H., Olsen, K., Lauer, T., et al. 2018, MNRAS, 478, 5379
- Draine et al. (2014) Draine, B. T., Aniano, G., Krause, O., et al. 2014, ApJ, 780, 172
- Draine & Li (2007) Draine, B. T. & Li, A. 2007, ApJ, 657, 810
- Erwin et al. (2015) Erwin, P., Saglia, R. P., Fabricius, M., et al. 2015, MNRAS, 446, 4039
- Faber et al. (1985) Faber, S. M., Friel, E. D., Burstein, D., & Gaskell, C. M. 1985, ApJS, 57, 711
- Fathi & Peletier (2003) Fathi, K. & Peletier, R. F. 2003, A&A, 407, 61
- Fragkoudi et al. (2017) Fragkoudi, F., Di Matteo, P., Haywood, M., et al. 2017, A&A, 607, L4
- Friedli et al. (1994) Friedli, D., Benz, W., & Kennicutt, R. 1994, ApJ, 430, L105
- Gadotti & dos Anjos (2001) Gadotti, D. A. & dos Anjos, S. 2001, AJ, 122, 1298
- Gonzalez et al. (2017) Gonzalez, O. A., Debattista, V. P., Ness, M., Erwin, P., & Gadotti, D. A. 2017, MNRAS, 466, L93
- Gonzalez et al. (2013) Gonzalez, O. A., Rejkuba, M., Zoccali, M., et al. 2013, A&A, 552, A110
- Gonzalez et al. (2011) Gonzalez, O. A., Rejkuba, M., Zoccali, M., Valenti, E., & Minniti, D. 2011, A&A, 534, A3
- Gregersen et al. (2015) Gregersen, D., Seth, A. C., Williams, B. F., et al. 2015, AJ, 150, 189
- Knapen et al. (1995) Knapen, J. H., Beckman, J. E., Heller, C. H., Shlosman, I., & de Jong, R. S. 1995, ApJ, 454, 623
- Kormendy (2013) Kormendy, J. 2013, Secular Evolution in Disk Galaxies, ed. J. Falcón-Barroso & J. H. Knapen, 1
- Kormendy & Bender (1999) Kormendy, J. & Bender, R. 1999, ApJ, 522, 772
- Kormendy & Kennicutt (2004) Kormendy, J. & Kennicutt, Jr., R. C. 2004, ARA&A, 42, 603
- Kroupa (2001) Kroupa, P. 2001, MNRAS, 322, 231
- Kubryk et al. (2013) Kubryk, M., Prantzos, N., & Athanassoula, E. 2013, MNRAS, 436, 1479
- Lee et al. (2012) Lee, C.-H., Riffeser, A., Koppenhoefer, J., et al. 2012, AJ, 143, 89
- Lindblad (1956) Lindblad, B. 1956, Stockholms Observatoriums Annaler, 19
- Maraston (1998) Maraston, C. 1998, MNRAS, 300, 872
- Maraston (2005) Maraston, C. 2005, MNRAS, 362, 799
- Martinez-Valpuesta & Gerhard (2013) Martinez-Valpuesta, I. & Gerhard, O. 2013, ApJ, 766, L3
- Minchev & Famaey (2010) Minchev, I. & Famaey, B. 2010, ApJ, 722, 112
- Moorthy & Holtzman (2006) Moorthy, B. K. & Holtzman, J. A. 2006, MNRAS, 371, 583
- Ness et al. (2013) Ness, M., Freeman, K., Athanassoula, E., et al. 2013, MNRAS, 430, 836
- Opitsch (2016) Opitsch, M. 2016, PhD thesis, Ludwig-Maximilians-Universität München, Germany
- Opitsch et al. (2018) Opitsch, M., Fabricius, M. H., Saglia, R. P., et al. 2018, A&A, 611, A38
- Pérez & Sánchez-Blázquez (2011) Pérez, I. & Sánchez-Blázquez, P. 2011, A&A, 529, A64
- Pérez et al. (2007) Pérez, I., Sánchez-Blázquez, P., & Zurita, A. 2007, A&A, 465, L9
- Pérez et al. (2009) Pérez, I., Sánchez-Blázquez, P., & Zurita, A. 2009, A&A, 495, 775
- Portail et al. (2017a) Portail, M., Gerhard, O., Wegg, C., & Ness, M. 2017a, MNRAS, 465, 1621
- Portail et al. (2017b) Portail, M., Wegg, C., Gerhard, O., & Ness, M. 2017b, MNRAS, 470, 1233
- Prugniel et al. (2007) Prugniel, P., Soubiran, C., Koleva, M., & Le Borgne, D. 2007, VizieR Online Data Catalog, 3251, 0
- Riffeser et al. (2008) Riffeser, A., Seitz, S., & Bender, R. 2008, ApJ, 684, 1093
- Roškar et al. (2012) Roškar, R., Debattista, V. P., Quinn, T. R., & Wadsley, J. 2012, MNRAS, 426, 2089
- Saglia et al. (2010) Saglia, R. P., Fabricius, M., Bender, R., et al. 2010, A&A, 509, A61, abbreviated as S10 in the text
- Sakamoto et al. (1999) Sakamoto, K., Okumura, S. K., Ishizuki, S., & Scoville, N. Z. 1999, ApJ, 525, 691
- Sánchez-Blázquez et al. (2011) Sánchez-Blázquez, P., Ocvirk, P., Gibson, B. K., Pérez, I., & Peletier, R. F. 2011, MNRAS, 415, 709
- Sarajedini & Jablonka (2005) Sarajedini, A. & Jablonka, P. 2005, AJ, 130, 1627
- Sarzi et al. (2006) Sarzi, M., Falcón-Barroso, J., Davies, R. L., et al. 2006, MNRAS, 366, 1151
- Schultheis et al. (2017) Schultheis, M., Rojas-Arriagada, A., García Pérez, A. E., et al. 2017, A&A, 600, A14
- Seidel et al. (2016) Seidel, M. K., Falcón-Barroso, J., Martínez-Valpuesta, I., et al. 2016, MNRAS, 460, 3784
- Sellwood (2014) Sellwood, J. A. 2014, Reviews of Modern Physics, 86, 1
- Thomas & Davies (2006) Thomas, D. & Davies, R. L. 2006, MNRAS, 366, 510
- Thomas et al. (2003) Thomas, D., Maraston, C., & Bender, R. 2003, MNRAS, 343, 279
- Thomas et al. (2011) Thomas, D., Maraston, C., & Johansson, J. 2011, MNRAS, 412, 2183
- Trager et al. (1998) Trager, S. C., Worthey, G., Faber, S. M., Burstein, D., & González, J. J. 1998, ApJS, 116, 1
- Vazdekis et al. (2015) Vazdekis, A., Coelho, P., Cassisi, S., et al. 2015, MNRAS, 449, 1177
- Wegg & Gerhard (2013) Wegg, C. & Gerhard, O. 2013, MNRAS, 435, 1874
- Williams et al. (2012) Williams, M. J., Bureau, M., & Kuntschner, H. 2012, MNRAS, 427, L99
- Worthey et al. (1994) Worthey, G., Faber, S. M., Gonzalez, J. J., & Burstein, D. 1994, ApJS, 94, 687
- Zieleniewski et al. (2015) Zieleniewski, S., Houghton, R. C. W., Thatte, N., & Davies, R. L. 2015, MNRAS, 452, 597
- Zoccali et al. (2008) Zoccali, M., Hill, V., Lecureur, A., et al. 2008, A&A, 486, 177
5 Appendix
5.1 Comparison with the Lick index measurements of S10
In Fig. 25 to 30, we compare cuts through our data to the values from S10. While the individual measurements sometimes deviate because the two data sets sample small scale variations of the stellar populations differently, the general trends are similar; the overall agreement is within 10 without systematic shifts. We conclude that our measurements are on the Lick system. We do not reproduce the spike in the very center seen by S10 because the VIRUS-W data have lower spatial resolution than the S10 data.
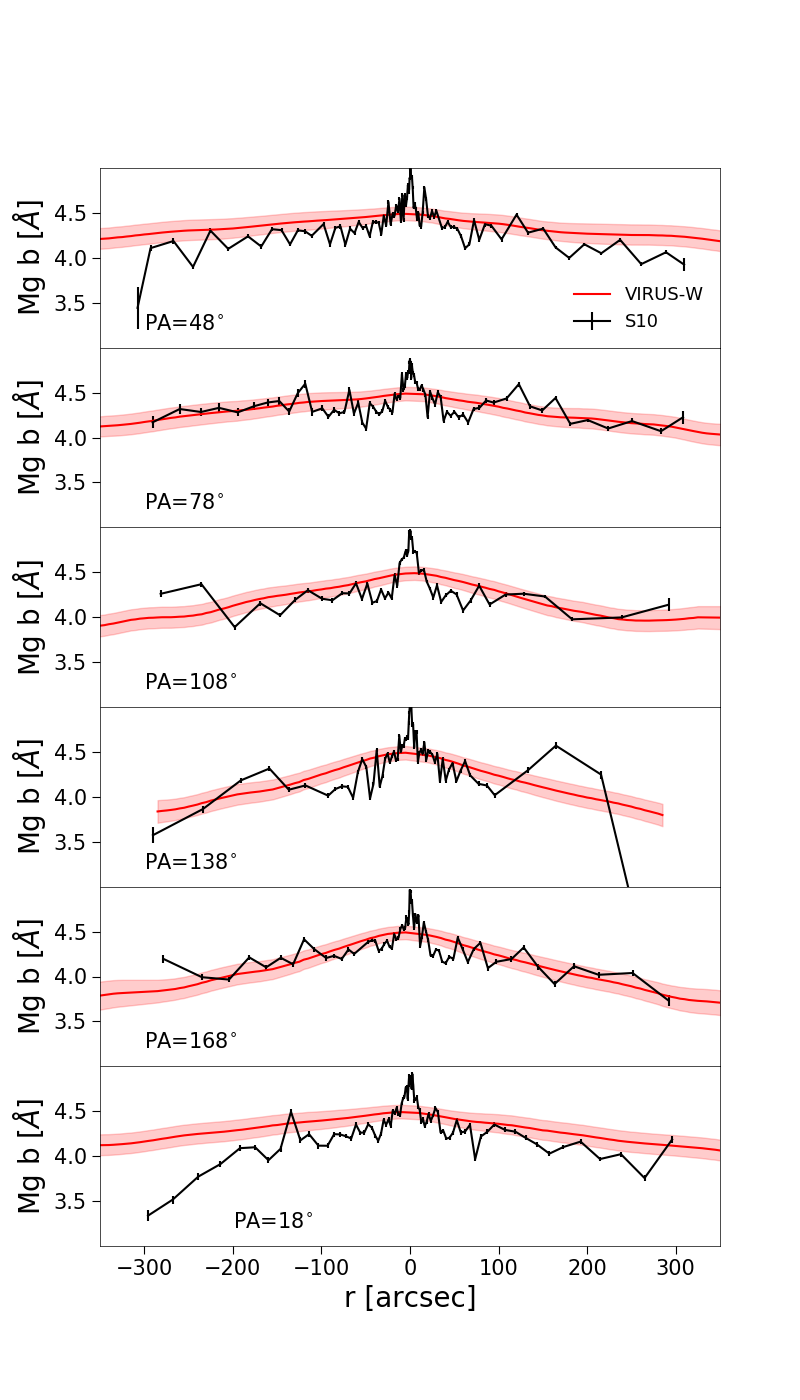


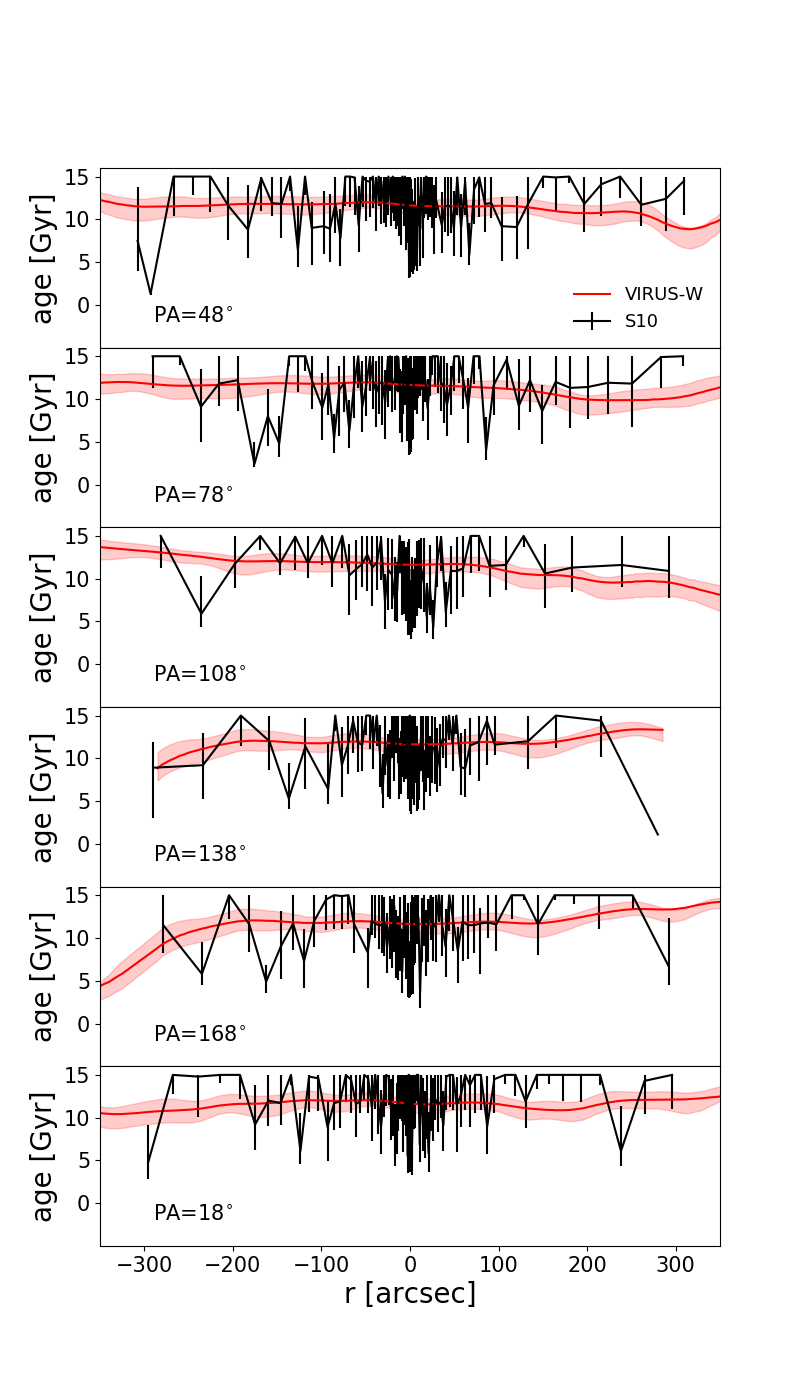
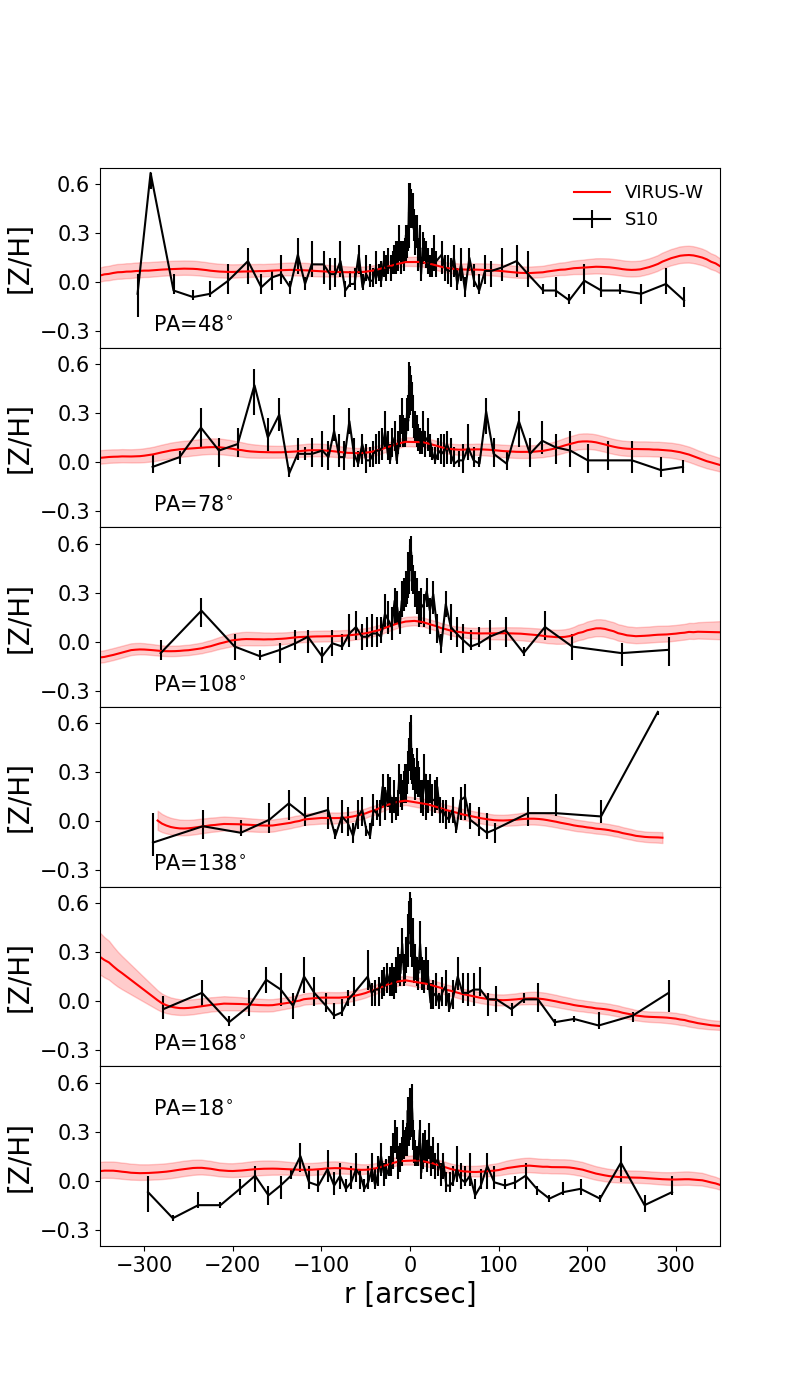
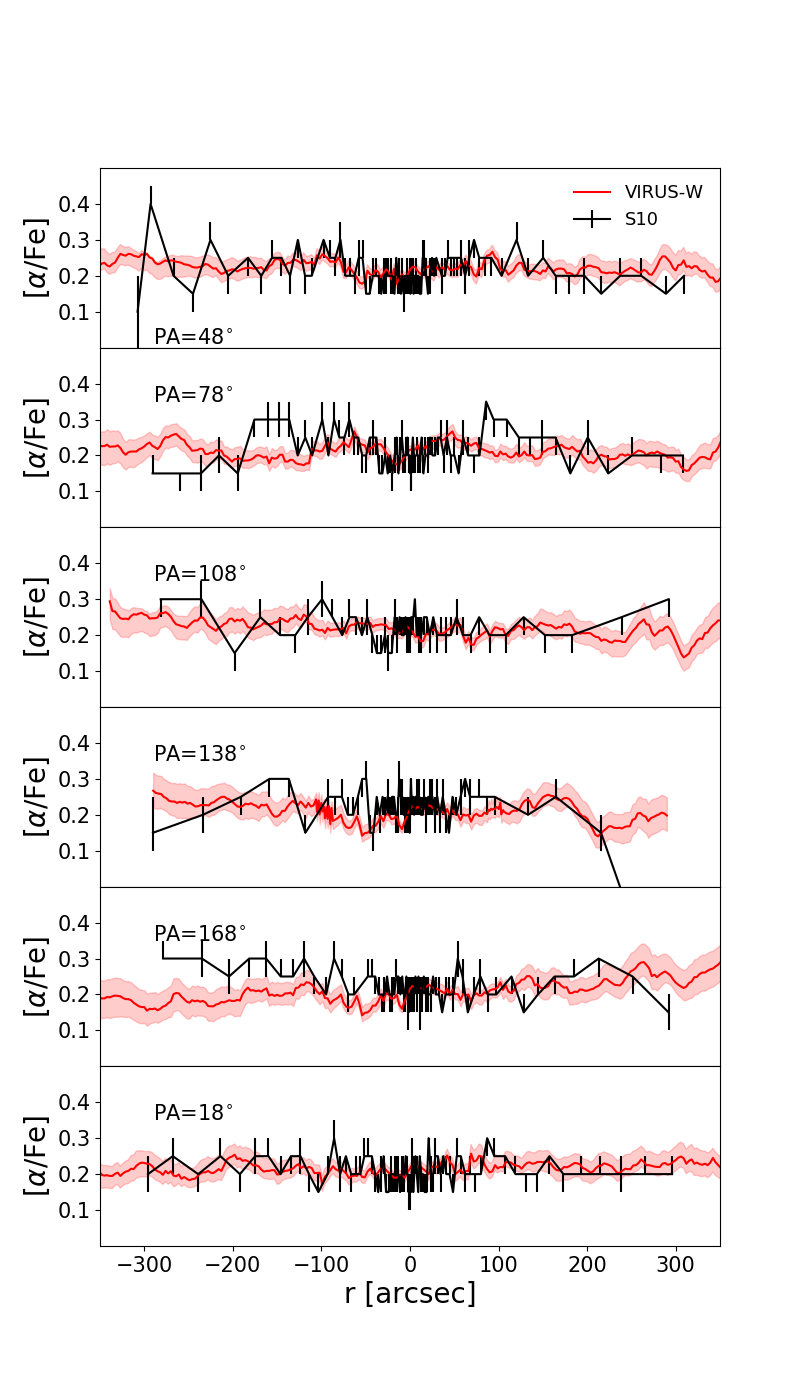
5.2 Comparison with the stellar population measurements of S10
The comparison of our stellar population parameters to those derived by S10 is presented in Figs. 31 to 33. While there is scatter, in general, both datasets agree within the errors. Variations of the stellar populations that are too small scale and different spatial sampling of the present data set and S10 can explain the differences. The younger population that S10 find in the innermost 5 arcseconds is not seen in our data. This is, once again, because the present data set does not have the spatial resolution that far in.
5.3 Measured values
Table 5 gives the coordinates (relative to the center) of the spectra corresponding to the bin identification number. Table 6 presents the format of the tabulated values of the Lick indices used in this paper (H, Mg b, Fe5015, Fe5270, Fe5355, and Fe5406). Table 7 gives the resulting stellar population properties (Age, [Z/H], [Fe], and ). The complete lists are available online.
| Bin number | x[”] | y[”] |
|---|---|---|
| 0 | 2.65 | 4.57 |
| 1 | 0.08 | 9.14 |
| 2 | 2.3 | 11.38 |
| 3 | 5.38 | 9.11 |
| 4 | -2.92 | 11.16 |
| … |
| Bin Number | H [] | Mg b [] | Fe5015 [] | Fe5270 [] | Fe5355 [] | Fe5406 [] |
|---|---|---|---|---|---|---|
| 0 | 1.64 0.03 | 4.55 0.05 | 5.63 0.09 | 2.98 0.06 | 2.79 0.06 | 1.68 0.05 |
| 1 | 1.69 0.04 | 4.45 0.06 | 5.17 0.11 | 2.86 0.07 | 2.67 0.07 | 1.73 0.06 |
| 2 | 1.81 0.04 | 4.53 0.06 | 5.49 0.10 | 2.77 0.06 | 2.50 0.07 | 1.51 0.06 |
| 3 | 1.48 0.04 | 4.58 0.06 | 5.68 0.10 | 3.08 0.07 | 2.63 0.07 | 1.47 0.06 |
| 4 | 2.00 0.03 | 4.52 0.05 | 5.61 0.09 | 2.88 0.06 | 2.55 0.07 | 1.68 0.05 |
| … |
| Bin Number | Age | min Age | max Age | Age20% | [Z/H] | min [Z/H] | max [Z/H] | [Fe] | min [Fe] | max [Fe] | min | max | 20% | |
|---|---|---|---|---|---|---|---|---|---|---|---|---|---|---|
| [Gyr] | [Gyr] | [Gyr] | [Gyr] | [dex] | [dex] | [dex] | [dex] | [dex] | [dex] | [] | [] | [] | [] | |
| 0 | 11.2 | 10.7 | 11.9 | 10.5 | 0.21 | 0.19 | 0.23 | 0.25 | 0.24 | 0.26 | 4.7 | 4.3 | 4.9 | 4.4 |
| 1 | 11.6 | 11.0 | 12.6 | 10.6 | 0.13 | 0.09 | 0.15 | 0.25 | 0.24 | 0.26 | 4.6 | 4.2 | 4.8 | 4.1 |
| 2 | 8.3 | 7.8 | 8.9 | 10.6 | 0.25 | 0.23 | 0.27 | 0.35 | 0.34 | 0.36 | 3.5 | 3.3 | 3.7 | 4.5 |
| 3 | 14.4 | 13.7 | 15.0 | 10.6 | 0.11 | 0.09 | 0.13 | 0.25 | 0.24 | 0.26 | 5.6 | 5.2 | 5.8 | 4.1 |
| 4 | 5.0 | 4.8 | 5.4 | 10.6 | 0.39 | 0.37 | 0.40 | 0.35 | 0.34 | 0.36 | 2.4 | 2.3 | 2.6 | 4.9 |
| … |