2: Dipartimento di Fisica, Università di Genova, Genova, Italy
3: Istituto Nazionale di Fisica Nucleare, Sezione di Genova, Genova, Italy
4: Dipartimento di Fisica, Università di Milano-Bicocca, Milano, Italy
5: Istituto Nazionale di Fisica Nucleare, Sezione di Milano-Bicocca, Milano, Italy
6: Paul Scherrer Institut, Villigen, Switzerland
7: Institut Laue-Langeving, Grenoble, France
8: Istituto Nazionale di Fisica Nucleare, Sezione di Roma 1, Roma, Italy
9: Laboratori Nazionali del Gran Sasso, INFN, Assergi (AQ), Italy
10: Multidisciplinary Centre for Astrophysics (CENTRA-IST), University of Lisbon, Lisbon, Portugal
Status of the HOLMES experiment to directly measure the neutrino mass
Abstract
The assessment of neutrino absolute mass scale is still a crucial challenge in today particle physics and cosmology. Beta or electron capture spectrum end-point study is currently the only experimental method which can provide a model independent measurement of the absolute scale of neutrino mass. HOLMES is an experiment funded by the European Research Council to directly measure the neutrino mass. HOLMES will perform a calorimetric measurement of the energy released in the electron capture decay of the artificial isotope 163Ho. In a calorimetric measurement the energy released in the decay process is entirely contained into the detector, except for the fraction taken away by the neutrino. This approach eliminates both the issues related to the use of an external source and the systematic uncertainties arising from decays on excited final states. The most suitable detectors for this type of measurement are low temperature thermal detectors, where all the energy released into an absorber is converted into a temperature increase that can be measured by a sensitive thermometer directly coupled with the absorber. This measurement was originally proposed in 1982 by A. De Rujula and M. Lusignoli, but only in the last decade the technological progress in detectors development has allowed to design a sensitive experiment. HOLMES plans to deploy a large array of low temperature microcalorimeters with implanted 163Ho nuclei. In this contribution we outline the HOLMES project with its physics reach and technical challenges, along with its status and perspectives.
Keywords:
Neutrino mass measurement, Electron capture, Holmium, Transition Edge Sensors.1 Introduction
The HOLMES experiment aims at directly measuring the electron neutrino mass using the electron capture (EC) decay of 163Ho [1]. HOLMES performs a calorimetric measurement of the energy released in the decay of 163Ho to measure all the atomic de-excitation energy, except the fraction carried away by the neutrino [2]. The direct measurement exploits only energy and momentum conservation and it is therefore completely model-independent. At the same time, the calorimetric measurement eliminates systematic uncertainties arising from the use of external beta sources, as in experiments with beta spectrometers, and minimizes the effect of the atomic de-excitation process uncertainties.

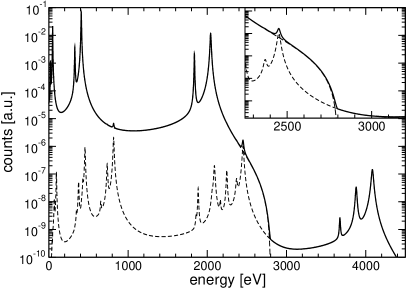
The expected calorimetric spectrum is shown in fig.1 (left): the distribution of the measured de-excitation energy, carried mostly by electrons with energies up to about 2 keV, presents lines at the binding energies of the captured electrons. These lines have a natural width of a few eV, therefore the actual spectrum is a continuum with marked peaks with Breit-Wigner shapes. The spectral end-point is shaped by the same neutrino phase space factor that appears in a beta decay spectrum, where is the EC transition energy. A finite neutrino mass causes a deformation of the energy spectrum which is truncated at -. The sensitivity of this approach depends on the nearness of to the binding energy of one of the captured electrons: 163Ho was proposed in [3] as an ideal isotope with a between 2.5 keV and 3.0 keV – with 2.55 keV as raccomended value [4],– close to the binding energy of about 2.0 keV for the M1 electrons. Recent measurements [5] established that is eV, therefore not as close to the M1 shell binding energy as initially hoped for.
2 The HOLMES experiment design
The sensitivity of calorimetric experiments is affected by a major drawback of this approach. In a calorimeter the whole decay spectrum is acquired and the decaying isotope activity must be restrained to limit the rate of accidental coincidences. Time unresolved coincidences (pile-up) show up in the spectrum as an additional background which worsens the statistical sensitivity. The right side of fig 1 shows the pile-up spectrum whose normalization relative to single events spectrum (fig. 1, left) is , where is the time resolution of the detector. Therefore, when planning a calorimetric experiment, a trade off must be found between the quest for collecting a large statistics in a short time and the need for limiting the pile-up spectrum amplitude. For fixed measuring time and detector performance – and , i.e. energy and time resolution, respectively, – the experimental parameters to tweak are the number of detectors and the isotope activity in each of them. The statistical sensitivity as a function of the above experimental parameters can be investigated exploiting the Monte Carlo methods described in [6]. The left side of fig. 2 shows that the statistical sensitivity improves with the total statistics as and that reaching a sensitivity below 2 eV requires around decays. While matching the current 2 eV sensitivity obtained by spectrometers with 3H [7, 8] is a meaningful first target for current 163Ho experiments, the goal for future experiments must be at least 0.1 eV – i.e. better than the KATRIN experiment goal [9]. From the left side of fig. 2 it is apparent how the 0.1 eV target calls for statistics larger than about events to be collected by arrays of more than pixels.
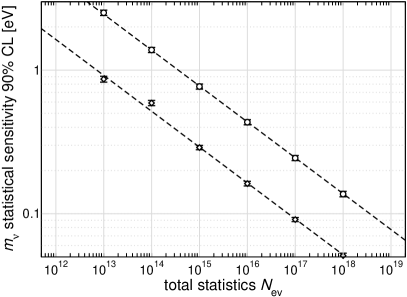
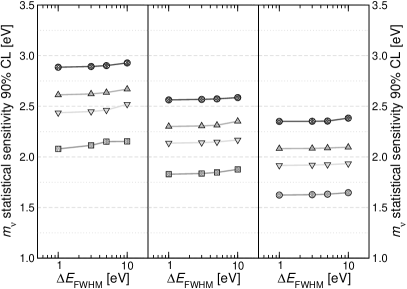
HOLMES optimal configuration is found by means of the simulations plotted in the right side of fig. 2 and by appreciating that, for fixed exposure and time resolution , the statistical sensitivity constantly improves for increasing pixel activities . As a consequence, in spite of the increasing fraction of pile-up events , it is winning to have the largest tolerable pixel activity. With this in mind, HOLMES plans to deploy an array with 1024 pixels, each with an 163Ho activity of about 300 Bq. The right panel of fig. 2 shows that to reach a statistical sensitivity below 2 eV the time resolution plays the main role, while the energy resolution could be anywhere below about 10 eV. In particular must be better than about 3 s, which translates in a fraction of pile-up better than about .
Because of the very low fraction of decays in the region of interest close to , the background is another factor impacting the statistical sensitivity of end-point neutrino mass measurements. A constant background is negligible as long as it is much smaller than the pile-up spectrum, that is when , as it is confirmed also by Monte Carlo simulations [6]. Therefore, a large activity with a correspondingly large pile-up fraction makes experiments relatively insensitive to cosmic rays and to environmental radioactivity. For HOLMES this translates in the requirement that the background level at the end-point must be lower than about 0.1 count/eV/day/det. From Geant4 Monte Carlo simulations and comparison with past experiments, HOLMES’ background due external sources is expected to be of the order of count/eV/day/det at sea-level. Indeed HOLMES’ major source of background is the internally present 166mHo, an isotope which is produced along with 163Ho [10]. This decaying isotope, with a half life of about 1200 years and a -value of about keV, according to Geant4 Monte Carlo simulations causes a background below 5 keV of about 0.5 count/eV/day/det/Bq(166mHo). The 166mHo activity in the pixels must be then kept lower than 0.2 Bq for a 163Ho activity of 300 Bq, or a factor 1500 lower, i.e. the number of contaminating 166mHo nuclei must be about a factor 6000 lower than that of 163Ho.
As discussed in more details in the following, the HOLMES project is divided in tasks which are carried out in parallel and on which the HOLMES groups are making steady progresses [11]. The tasks are 1) the 163Ho isotope production and purification, 2) the isotope embedding, 3) the TES pixel and array design and testing, 4) the microwave multiplexed read-out system, and 5) the Digital Acquisition system (DAQ).
3 163Ho production and embedding
The 163Ho isotope needed to carry out the experiment is produced at the nuclear reactor sited at the Institute Laue-Langevin (ILL, Grenoble, France) by irradiating Er2O3 samples enriched in 162Er in a thermal neutron flux of about 1015 n/s/cm2. The Er2O3 samples are purified before irradiation and the accumulated holmium is radiochemically separated in hot-cells after the neutron irradiation. Both processes have been developed and optimized at the Paul Scherrer Institute (PSI, Zurich, CH). Two samples of enriched Er2O3 have been already irradiated at ILL and processed at PSI. Inductive Coupled Plasma Mass Spectroscopy (ICPMS) analysis performed at LNGS and PSI on the two samples before and after chemical purification at PSI demonstrated a production of a sufficiently radiopure sample of about 43 MBq of 163Ho (along with about 50 kBq of 166mHo, measured by -spectroscopy). The analysis of these samples yielded also a preliminary estimate of the 163Ho production yield including all these steps. We estimate that the whole HOLMES program requires a total amount of about 250 MBq of 163Ho. This estimate is obtained considering all the processing efficiencies involved from isotope production to embedding in the detectors: these include the above mentioned yield, but also the efficiencies related to the ion implantation process. Since not all the efficiencies are known yet, for the above estimate we made conservative guesses to come up with a global efficiency of the order of 0.1%. About 540 mg of Er2O3 enriched in 162Er at 25% were irradiated at ILL for about 50 days until early 2017. Along with this sample we also re-irradiated about 100 mg of Er2O3 at 26.9% which were left after the holmium chemical separation at PSI from last irradiated sample. We estimate a production of about 150 MBq of 163Ho which are expected to be enough both for testing the isotope embedding and for the production of the first 512 detectors.
163Ho is introduced in the absorbers of the HOLMES’ low temperature microcalorimeters by means of custom system which combines a high efficiency Penning sputter ion source, a mass analyzing magnet, an electrostatic triplet focusing stage, and an XY magnetic beam scanner. The system is shown in fig.3 and it is described in more details in [12].

The system is designed to achieve an optimal mass separation for 163Ho, thereby eliminating other trace contaminants not removed by chemical methods at PSI, such as 166mHo. The magnetic selection also minimizes the implantation of other stable isotopes such as 165Ho, which would only increase the detector heat capacity, and prevents the implantation of holmium in chemical forms other than metallic, which would likely cause chemical shifts of the end-point energy. The embedding system includes a focusing stage designed to have a beam cross-section on the detectors of about 4 mm thereby maximizing the geometrical efficiency of the ion implantation (see [13]). During ion implantation, the detectors are hosted in the UHV Target Chamber which is equipped with an ion beam assisted sputtering system to control the 163Ho concentration in the detector absorbers, to compensate the absorber atom sputtering caused by the ion implantation, and to deposit the final absorber layer to complete the 163Ho embedding [13]. The metallic cathode for the ion source is made out of an inter-metallic alloy containing 163Ho in a metallic form. The metallic 163Ho is produced in an evaporation chamber by thermal reduction and distillation of the Ho2O3 separated at PSI after neutron irradiation. The details of the ion source cathode fabrication are described in [12]. The whole embedding system is expected to be ready for detector implantation testing early in 2018.
4 TES microcalorimeters, microwave multiplexed read-out, and DAQ
The detectors used for the HOLMES experiment are Mo/Cu TES on Si2N3 membrane with 2 m thick gold absorbers. The pixel design has been optimized to match the experimental specifications in terms of energy and time resolution, pulse duration, and 163Ho decay radiation full absorption [14, 15]. As explained above the most critical parameter is the time resolution. By means of Monte Carlo simulations we find that with rise and decay time constants of about 10 s and 100 s, respectively, and with signal sampling rate of at least 500 kHz it is possible to obtain a time resolution better than 3 s exploiting discrimination algorithms based on Singular Value Decomposition [16] or Wiener filtering [17].
The HOLMES arrays are read-out with the microwave multiplexing (MUX) developed by NIST, which is based on rf-SQUIDs as input devices [18]. The MUX read-out leverages the Software Defined Radio (SDR) implemented in the firmware of a ROACH-2 board by NIST [19]. The HOLMES DAQ system is presently composed by one ROACH-2 system with ADC (550 MS/s, 12 bit, 2 channels), DAC (for comb generation), and IF circuitry (for signal up- and down-conversion) realized with discrete components (IQ mixers, power dividers, attenuators, and RF amplifiers). We used this set-up to characterize two MUX chips from NIST (MUX16a and MUX17a) [22]. The two MUX chips provide 33 2 MHz wide resonances spaced by 14 MHz in a 500 MHz band. The multiplexing factor achievable with one ROACH-2 board is for a signal sampling frequency of about 0.5 MHz, where is the SDR ADC sampling frequency of 550 MHz. Considering the design of about 10 s, the multiplexing factor for the HOLMES DAQ can be as high as 32 and therefore to read-out the full 1024 pixel array a total of 32 ROACH-2 systems is required.
Two prototype arrays were fabricated at NIST (Boulder, Co, USA) with slight variations in the TES pixel designs and were characterized using both 55Fe and a fluorescence multi-line source. The prototype pixel signals were read-out either with a 2-channel homodyne circuit [20, 21] or with the 16-channel ROACH-2 DAQ. The results of these measurements, which are described in details in [22], confirm that the baseline pixel design, along with a proper tuning of the bias network inductance , while matching the desired time constants, provide an energy resolution well below 10 eV FWHM at . The measurements carried out using the ROACH-2 DAQ also proves that the HOLMES DAQ is ready for the experiment.
According to these results, we have now finalized the design of the sub-arrays which will be deployed for the HOLMES experiment [13]: the design aims to 1) minimize the signal bandwidth limitations due to stray self-inductance of the read-out leads, 2) minimize the signal cross-talk due to mutual inductance between read-out lines, and 3) maximize the geometrical filling for an optimal implantation efficiency. The arrays are fabricated in a two step process [13]. The arrays are provided by NIST with a 1 m gold layer and they are further processed after ion-implantation: first in the Target Chamber the thin (few 100Å) layer of Au:163Ho is covered by a second 1 m gold layer to fully encapsulate the 163Ho source, then the Si2N3 membranes are released by means of a Deep Reactive Ion Etching. Preliminary tests on dummy samples from NIST are in progress to tune the DRIE process and define the details of this two-step fabrication process [13].
5 Future plans
With the embedding system fully operational early in 2018, HOLMES will start soon to optimize the isotope implantation process along with the two-step array fabrication process. As soon as the first implanted arrays will be available, the first high statistics calorimetric measurements of the 163Ho decay will provide relevant information on the spectral shape and new competitive limit on .
Acknowledgements.
The HOLMES experiment is funded by the European Research Council under the European Union Seventh Framework Programme (FP7/2007-2013)/ERC Grant Agreement no. 340321. We also acknowledge support from INFN for the MARE project, from the NIST Innovations in Measurement Science program for the TES detector development, and from Fundação para a Ciência e a Tecnologia (PTDC/FIS/116719/2010) for providing the enriched Er2O3 used in preliminary 163Ho production by means of neutron irradiation.References
- 1 B. Alpert et al., Eur. Phys. J. C 75, 112, (2015), DOI: 10.1140/epjc/s10052-015-3329-5
- 2 A. Nucciotti, Advances in High Energy Physics, 2016, 9153024, (2016), DOI: 10.1155/2016/9153024
- 3 A. de Rújula, M. Lusignoli, Nucl. Phys. B 219, 277, (1983), DOI: 10.1016/0550-3213(83)90642-9
- 4 C.W. Reich and B. Singh, Nuclear Data Sheets, 111, 1211, (2010). DOI: 10.1016/j.nds.2010.04.001
- 5 S. Eliseev et al., Phys. Rev. Lett. 115, 062501, (2015), DOI: http://dx.doi.org/10.1103/PhysRevLett.115.062501
- 6 A. Nucciotti, Eur. Phys. J. C 74, 3161. (2014), DOI: 10.1140/epjc/s10052-014-3161-3
- 7 V.M. Lobashev, V.N. Aseev, A.I. Belesev, A.I. Berlev, E.V. Geraskin et al., Nucl. Phys. Proc. Suppl. 91, 280, (2001), DOI: 10.1016/S0920-5632(00)00952-X
- 8 Ch. Kraus, B. Bornschein, L. Bornschein, J. Bonn, B. Flatt, et al., Eur. Phys. J. C 40, 447, (2005), DOI: 10.1140/epjc/s2005-02139-7
- 9 Ch. Weinheimer, KATRIN collaboration, Prog. Part. Nucl. Phys. 48, 141, (2002), DOI: 10.1016/S0146-6410(02)00120-5
- 10 J. W. Engle et al., Nucl. Instrum. Methods B, 311, 131, (2013), DOI: 10.1016/j.nimb.2013.06.017
- 11 A. Giachero et al., Journal of Instrumentation, 12, C02046, (2017), DOI: 10.1088/1748-0221/12/02/C02046
- 12 G. Gallucci et al., J. Low Temp. Phys., This Special Issue (2017)
- 13 A. Orlando et al., J. Low Temp. Phys., This Special Issue (2017)
- 14 J.P. Hays-Wehle et al., J. Low Temp. Phys., 184, 492, (2016), DOI: 10.1007/s10909-015-1416-5
- 15 M. Faverzani et al., J. Low Temp. Phys., 184, 922, (2016), DOI: 10.1007/s10909-016-1540-x
- 16 B. Alpert et al., J. Low Temp. Phys., 184, 263, (2016), DOI: 10.1007/s10909-015-1402-y
- 17 E. Ferri et al., J. Low Temp. Phys., 184, 405, (2016), DOI: 10.1007/s10909-015-1466-8
- 18 J.A.B. Mates et al., J. Low Temp. Phys., This Special Issue (2017)
- 19 D. Decker et al., J. Low Temp. Phys., This Special Issue (2017)
- 20 E. Ferri et al., Nucl. Instrum. Methods A, 824, 179, (2016), DOI: 10.1016/j.nima.2015.10.019
- 21 A. Puiu et al., J. Low Temp. Phys., 184, 45, (2016), DOI: 10.1007/s10909-015-1432-5
- 22 A. Puiu et al., J. Low Temp. Phys., This Special Issue (2017)