The Impact of Spectroscopic Fibre Collisions on the Observed Angular Correlation Function
1
One of the complications associated with large-scale spectroscopic galaxy surveys is that of fibre collisions (Strauss et al., 2002; Patton & Atfield, 2008). That is to say, the physical size of a spectroscopic fibre plug prevents observations of targets that are too close to each other on the sky. These fibre collisions may thus hinder studies of regions with a high target density, such as interacting galaxy pairs or galaxy clusters (e.g., Robotham et al., 2010; Gordon et al., 2017). Comparisons with mock catalogues can allow for the recovery of clustering lost to fibre collisions by the application of statistical corrections (e.g., Guo et al., 2012 and Hahn et al., 2017). Alternatively, the observing strategy of some surveys is designed to circumvent the negative impact of fibre collisions by re-observing the same field using different fibre configurations (Driver et al., 2011). In order to quantify the effect of this latter technique, we compare the 2-point angular correlation function (2PCF) of a survey that adopts this strategy to one which does not.
The spectroscopic component of the Sloan Digital Sky Survey (SDSS, York et al., 2000) is a single-pass survey with a fibre collision limit, and % completeness down to (Strauss et al., 2002). This completeness level is dependent on the target density however, with some observed clusters in SDSS having just % spectroscopic completeness (Yoon et al., 2008). Conversely, the Galaxy And Mass Assembly survey (GAMA, Driver et al., 2011) uses a multi-pass strategy for its spectroscopic campaign, achieving % completeness at that is broadly independent of the target density (Liske et al., 2015). Our analysis uses galaxies observed up to data release 10 of SDSS (Ahn et al., 2014) and data release 3 of GAMA (Baldry et al., 2018) residing within the GAMA equatorial fields G12 and G15. These fields lie entirely within the GAMA and SDSS survey footprints, allowing for the analysis to be conducted on the same region of sky. To prevent differing survey depths biasing our result, only galaxies with are included.
To determine the angular correlation function we produce mock galaxy populations equal in size to the GAMA and SDSS populations, and distribute the mock galaxies randomly along the same spatial area occupied by the real observations. Each galaxy is then paired with all other galaxies observed by the same survey inside a radius. The Landy-Szalay estimator, , given by
| (1) |
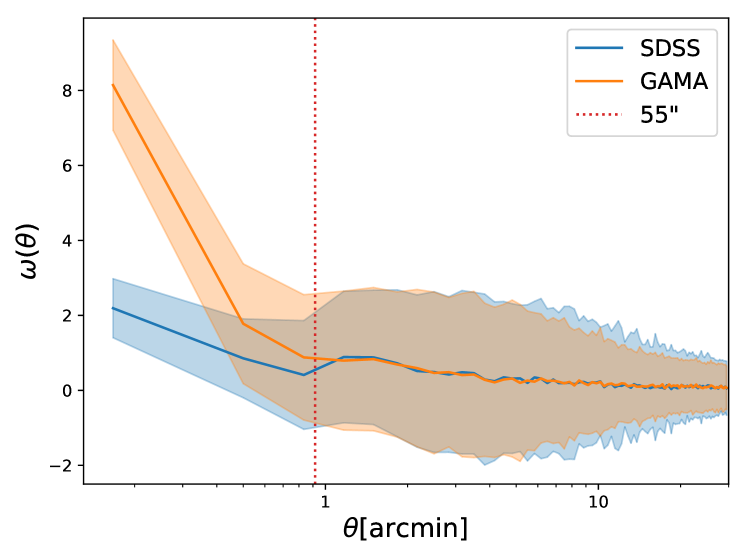
where , , and , are the data-data, data-random, and random-random pairs respectively, is then used to calculate the angular correlation (Landy & Szalay, 1993). In Figure 1, we show the 2PCFs and their uncertainties, estimated by the bootstrap method, for both GAMA and SDSS in pair separation bins of (kpc at the median SDSS redshift of , Abazajian et al., 2009) out to to . The SDSS fibre collision limit is shown for reference. The angular correlation functions are shown to deviate at separations below the SDSS fibre collision limit, reaching a significance at pair separations of . This unambiguously demonstrates the merit of field re-observation in spectroscopic surveys where studying regions of high galaxy density is a priority.
References
- Abazajian et al. (2009) Abazajian, K. N., Adelman-McCarthy, J. K., Agüeros, M. A., et al. 2009, ApJS, 182, 543, doi: 10.1088/0067-0049/182/2/543
- Ahn et al. (2014) Ahn, C. P., Alexandroff, R., Allende Prieto, C., et al. 2014, ApJS, 211, 17, doi: 10.1088/0067-0049/211/2/17
- Baldry et al. (2018) Baldry, I. K., Liske, J., Brown, M. J. I., et al. 2018, MNRAS, 474, 3875, doi: 10.1093/mnras/stx3042
- Driver et al. (2011) Driver, S. P., Hill, D. T., Kelvin, L. S., et al. 2011, MNRAS, 413, 971, doi: 10.1111/j.1365-2966.2010.18188.x
- Gordon et al. (2017) Gordon, Y. A., Owers, M. S., Pimbblet, K. A., et al. 2017, MNRAS, 465, 2671, doi: 10.1093/mnras/stw2925
- Guo et al. (2012) Guo, H., Zehavi, I., & Zheng, Z. 2012, ApJ, 756, 127, doi: 10.1088/0004-637X/756/2/127
- Hahn et al. (2017) Hahn, C., Scoccimarro, R., Blanton, M. R., Tinker, J. L., & Rodríguez-Torres, S. 2017, MNRAS, 467, 1940, doi: 10.1093/mnras/stx185
- Landy & Szalay (1993) Landy, S. D., & Szalay, A. S. 1993, ApJ, 412, 64, doi: 10.1086/172900
- Liske et al. (2015) Liske, J., Baldry, I. K., Driver, S. P., et al. 2015, MNRAS, 452, 2087, doi: 10.1093/mnras/stv1436
- Patton & Atfield (2008) Patton, D. R., & Atfield, J. E. 2008, ApJ, 685, 235, doi: 10.1086/590542
- Robotham et al. (2010) Robotham, A., Driver, S. P., Norberg, P., et al. 2010, PASA, 27, 76, doi: 10.1071/AS09053
- Strauss et al. (2002) Strauss, M. a., Weinberg, D. H., Lupton, R. H., & Narayanan, V. K. 2002, AJ, 124, 1810, doi: 10.1086/342343
- Yoon et al. (2008) Yoon, J. H., Schawinski, K., Sheen, Y.-K., Ree, C. H., & Yi, S. K. 2008, ApJS, 176, 414, doi: 10.1086/528958
- York et al. (2000) York, D. G., Adelman, J., Anderson, J. E., et al. 2000, AJ, 120, 1579, doi: 10.1086/301513