Ring Galaxies in the EAGLE Hydrodynamical Simulations
Abstract
We study the formation and evolution of ring galaxies in the Evolution and Assembly of GaLaxies and their Environments (EAGLE) simulations. We use the largest reference model Ref-L100N1504, a cubic cosmological volume of comoving megaparsecs on a side, to identify and characterise these systems through cosmic time. The number density of ring galaxies in EAGLE is in broad agreement with the observations. The vast majority of ring galaxies identified in EAGLE (per cent) have an interaction origin, i.e., form when one or more companion galaxies drop-through a disk galaxy. The remainder (per cent) have very long-lived ring morphologies (Gyr) and host strong bars. Ring galaxies are HI rich galaxies, yet display inefficient star formation activity and tend to reside in the green valley particularly at . This inefficiency is mainly due to the low pressure and metallicity of their interstellar medium (ISM) compared with the ISM of similar star-forming galaxies. We find that the interaction(s) is responsible for decreasing the ISM pressure by causing the ISM gas to flow from the inner regions to the outer disk, where the ring feature forms. At a fixed radius, the star formation efficiency of ring galaxies is indistinguishable from their star-forming counterparts, and thus the main reason for their integrated lower efficiency is the different gas surface density profiles. Since galaxy morphologies are not used to tune the parameters in hydrodynamical simulations, the experiment performed here demonstrates the success of the current numerical models in EAGLE.
keywords:
cosmology: theory – galaxies: structure – galaxies: statistics – galaxies: formation – galaxies: haloes – methods: numerical – galaxies: starburst.1 Introduction
Galaxy morphology is strongly correlated with the physical properties of galaxies such as their star
formation histories and dynamical structures, and hence provides crucial insights into galaxy formation
and is a key diagnostic of their evolution. In the local Universe, galaxies are categorised into three main morphological types,
i.e., spirals, spheroids, and irregular dwarf systems (Hubble, 1926, the Hubble sequence).
Observations of galaxies reveal that a considerable fraction ( per cent) of galaxies in the local
Universe have irregular morphological structures and do not fit within the conventional Hubble classification (Nair &
Abraham, 2010; Baillard
et al., 2011; Willett
et al., 2013).
These morphologically disturbed systems are usually
undergoing interactions and/or mergers with neighbouring galaxies (Toomre, 1977; White, 1978; Barnes &
Hernquist, 1996; Naab
et al., 2006, 2014; Rodriguez-Gomez
et al., 2017).
One of the most peculiar systems in our local Universe are the so-called ring
galaxies. Ring galaxies are generally divided into two sub-classes, the P and O-types (Few &
Madore, 1986). P-type rings
result from an off-centre passage of a compact companion galaxy, the intruder, through the disk of much
more massive spiral galaxy, the target, see for example Lynds &
Toomre (1976); Theys &
Spiegel (1977); Struck-Marcell
& Lotan (1990).
This type of collision produces a density wave that radially transports the gas and stars into a ring morphology
throughout the disk of the target galaxy (Appleton &
Struck-Marcell, 1996; Mayya et al., 2005; Wong
et al., 2006; Romano
et al., 2008; Fogarty
et al., 2011; Parker et al., 2015; Conn et al., 2016; Elagali et al., 2018).
Depending on the collision’s geometry, the target’s nucleus can be displaced off its dynamical centre,
the whole system (ring and nucleus) can be slightly dislocated from the previous plane of the disk (Mapelli &
Mayer, 2012) and
in some extreme cases the nucleus can completely be disrupted by the collision, producing a centrally smoothed ring with no apparent
nucleus (Madore
et al., 2009). The O-type are the resonance ring galaxies (de
Vaucouleurs, 1959; Herrera-Endoqui
et al., 2015; Buta, 2017).
These rings are preferentially found in barred galaxies, with the ring encircling the bar and forming the familiar -shape.
The O-type rings are not the products of violent galaxy collisions, but rather are formed by gas accumulation at Lindblad resonances
under the continuous influence of gravity torques from the bars.
Collisional ring galaxies (P-type) have been widely studied in idealised (isolated) interaction simulations,
in which a companion galaxy collides with a disk galaxy using certain interaction parameters to produce
the ring morphology (Lynds &
Toomre, 1976; Theys &
Spiegel, 1977; Struck-Marcell
& Lotan, 1990; Hernquist &
Weil, 1993; Gerber
et al., 1996; Athanassoula et al., 1997; Horellou &
Combes, 2001; Mapelli et al., 2008b; Smith et al., 2012; Mapelli &
Mayer, 2012; Renaud
et al., 2018).
These simulations show that certain impact parameters and collision angles can induce warps
in the disk, affect the morphology and the star formation history of the target disk galaxy (Fiacconi et al., 2012).
Mihos &
Hernquist (1994) and Mapelli et al. (2008a) showed in their simulations that it takes around Myr after the collision to develop the ring in the disk of these galaxies
and that the ring morphology remains visible for Gyr, which is very short compared to the Hubble timescale. Since the formation mechanisms of collisional ring galaxies are very well
constrained via simulations, they can be considered as galaxy-scale perturbation experiments
that facilitate the study of extreme modes of interaction-triggered star formation and feedback processes
(Higdon
et al., 2012; Higdon et al., 2015; Wong
et al., 2017; Renaud
et al., 2018).
Even though non-cosmological isolated interaction simulations are cornerstones in understanding the formation mechanisms of collisional
ring galaxies, they lack the statistical basis that would allow for a systematic study of these galaxies in the local Universe.
This is because these simulations consist of only the target and the intruder companion, using arbitrary initial
conditions and collision parameters to induce the ring morphology in the target galaxy. Hence, it is important to expand
the sample of simulated collisional ring galaxies and study larger volumes that cosmologically represent the local Universe.
This will advance our understanding of the collisional ring galaxies’ number density, their evolution and whether the drop-through interaction
proposed in non-cosmological isolated interaction simulations is frequent enough to explain the
observed number density of ring galaxies (Lavery et al., 2004; Elmegreen &
Elmegreen, 2006). Further, observations of collisional ring galaxies suggests that these systems contain on average high amounts of HI gas in comparison
with galaxies that have the same stellar mass (Elagali et al., 2018), yet are H2 deficient (Higdon et al., 2015; Wong
et al., 2017) especially at
the outer rings where the atomic hydrogen surface density is the highest (e.g., in the Cartwheel galaxy =Mpc-2; Higdon et al., 2015).
The reason behind this deficiency is not yet well understood, however Wong
et al. (2017) and Higdon et al. (2015) hypothesise that the ISM in ring galaxies behaves differently
as a result of the extreme conditions in, e.g., pressure, temperature and metallicity, induced by the drop-through collision.
In their N-body cosmological simulation, D’Onghia
et al. (2008) adopted a method to identify progenitor merging haloes that
host collisional ring galaxies based on their halo masses, the mass ratio between the two merging haloes, and the
the impact parameter of the collision (the initial distance vector between the centre of mass of the two merging haloes).
They used the resultant number density of collisional ring galaxies throughout cosmic time to place constraints on the merger rate.
But it is unclear how biased rings are as tracers of interactions and whether that bias is tim1990Strucke invariant or not.
A more recent study of ring galaxies in a cosmological hydrodynamical dynamical simulation was conducted by the Illustris team (Snyder
et al., 2015).
They explored the morphology of galaxies in these simulations and found that at = a considerable fraction
of galaxies within the mass range M⊙ have a distinct ring/C-shape morphology. However, the
abundance of these systems in their simulations is much higher than observational studies suggest.
One possible reason for this over population of ring galaxies in Illustris is the choice of interstellar medium (ISM) and feedback models.
While this is still inconclusive, in the new Illustris project (Illustris-TNG; Pillepich
et al., 2017; Springel
et al., 2017; Naiman
et al., 2017; Marinacci
et al., 2017; Nelson
et al., 2017)
ring-like structures are not as abundant, which suggests that the problem with Illustris is likely a combination of effects from different subgrid physics modules.
This is because in Illustris-TNG the stellar and AGN feedback models are implemented differently in comparison to Illustris,
which possibly affects the way gas piles up in galaxies and consequently their morphology (Weinberger
et al., 2017; Pillepich
et al., 2017).
Here, we intend to study collisional ring galaxies in the EAGLE simulations, trace the abundance of these systems with redshift,
compare it with observations, and study their formation mechanisms. The EAGLE simulations, which stands for Evolution
and Assembly of GaLaxies and their Environments (Schaye
et al., 2015; Crain
et al., 2015), reproduces many key observational results such as the specific star formation
rates (Furlong
et al., 2015), the passive galaxy fraction (Trayford
et al., 2015), the Tully-Fisher relation (Schaye
et al., 2015),
the H2 mass functions at = and several atomic and molecular gas scaling relations (Lagos
et al., 2015; Bahé
et al., 2016; Crain
et al., 2017).
The fact that we can detect ring galaxies in a statistical sample of simulated galaxies implies that
we can use these systems as a higher-order constraint on the models because morphology was not used to tune the parameters in EAGLE
(see Crain
et al. (2015) for more details). Thus, our study represents a true prediction of the simulation and by comparing
these results with the observations we hope to learn whether the numerical treatments of the ISM, star formation, and feedback
are adequate enough to reproduce a realistic ring-morphology population.
We also study the general characteristics of collisional ring galaxies in the EAGLE simulations including their star formation
rates (SFRs), colours, metallicities, atomic (HI) and molecular hydrogen (H2) gas scaling relations.
We aim to provide a thorough description of the ISM properties of collisional ring galaxies in the EAGLE simulations and the possible reasons
leading to their high HI masses or molecular gas deficiencies.
This paper is organised as follows: In Section 2, we briefly describe the key characteristics of the simulation, the
subgrid physics included in EAGLE and the mock optical images generated by the SKIRT code (Trayford
et al., 2017, hereafter T17).
Section 3 describes our selection criteria applied to select ring galaxies in the simulation.
In section 4, we present the characteristics of ring galaxies in EAGLE, including their number density, halo masses and the
concentrations of the haloes containing rings, colour-magnitude diagram, HI-stellar mass relation as well as the SFR-stellar mass
of ring galaxies, at different redshifts. We also present a more detailed study of the ISM properties in ring galaxies. In Section 5 we present
the origin and the formation history of rings in the EAGLE simulation. We present our discussion and conclusion in Section 6.
For all the calculations, we adopt the cosmology used for the EAGLE simulation, a CDM cosmology with =,
=, =, =, and =km s-1 Mpc-1,
consistent with Planck measurements (Planck
Collaboration et al., 2014).
2 SIMULATED GALAXY SAMPLES
2.1 Overview of the EAGLE Simulation
The EAGLE project is a suite of hydrodynamical simulations designed to explore the evolution of the Universe’s
baryonic matter (gas, stars and massive black holes) and dark matter from a redshift of until (Schaye
et al., 2015; Crain
et al., 2015).
The simulations were constructed assuming the standard cosmological paradigm (the so called CDM
cosmological model) and run with an extensively modified version of the N-body TreePM smoothed particle hydrodynamics
(SPH) code GADGET 3 (Springel, 2005; Springel
et al., 2008). The main updates to the standard GADGET 3 code feature modifications
to the hydrodynamics algorithm, and the incorporation of subgrid modules that capture the unresolved physics acting on
scales below the resolution limit of the simulations. The modified SPH algorithm, referred to as ‘Anarchy’,
includes the implementation of the pressure-entropy formulation of SPH (Hopkins, 2013), the artificial viscosity switch
proposed by Cullen &
Dehnen (2010), the artificial conduction switch similar to that proposed by Price (2008), the C2
smoothing kernel of Wendland (1995), and the timestep limiter from Durier &
Dalla Vecchia (2012). The impact of the above modifications to
the standard GADGET 3 code and its effect on the simulated galaxies is described in Schaller
et al. (2015).
The EAGLE simulations incorporate state-of-the-art subgrid physics based on those used for the OWLS (Schaye
et al., 2010) and the
GIMIC (Crain
et al., 2009) projects. These subgrid physics models include element-by-element radiative cooling and photoheating
rates (Wiersma
et al., 2009a), star formation as a pressure law (Schaye &
Dalla Vecchia, 2008) and a metallicity-dependent
density threshold (Schaye, 2004), stellar evolution and element-by-element chemical enrichment (Wiersma et al., 2009b),
stellar feedback as energy injected from core-collapse supernovae (Dalla Vecchia
& Schaye, 2012), as well as accreting black holes (BH)
and AGN feedback (Rosas-Guevara
et al., 2015). The efficiency of the stellar feedback and the BH accretion
were calibrated to match the observations of the galaxy stellar mass function (GSMF) at , while the AGN feedback was
calibrated to match the observed relation between stellar mass and BH mass. The EAGLE simulation has had unprecedented
successes as it reproduces many key observational datasets (that were not considered during the calibration) including
the stellar mass function of galaxies (Furlong
et al., 2015), the stellar mass-size relation (Furlong
et al., 2017), the colour
distribution of galaxies (Trayford
et al., 2015), the cold gas contents of galaxies throughout cosmic time
(Lagos
et al., 2015, 2016; Bahé
et al., 2016; Crain
et al., 2017), and the evolution of the star formation rate with redshift (Katsianis
et al., 2017),
among others.
| Comoving box size | cMpc |
|---|---|
| Number of particles | |
| Gas particle mass | M⊙ |
| Dark matter particle mass | M⊙ |
| Softening length | ckpc |
| Max. gravitational softening length | pkpc |
For this work, we use the largest reference model Ref-L100N1504 (hereafter Ref-100), which is a cubic cosmological volume of comoving
megaparsecs (cMpc) on a side, with dark matter particle mass of M⊙, initial gas particle mass
of M⊙, and equal numbers of baryonic and dark matter particles (). The Plummer equivalent
gravitational softening lengths are set to 1/25 of the initial mean interparticle spacing and are proper kiloparsecs
(pkpc) at redshifts , and comoving kiloparsecs (ckpc) at earlier times, which means that the Jeans scales
in the warm ISM are marginally resolved. The volume of Ref-L100N1504 provides a wide range of galaxy morphologies in a sample of galaxies resolved by
star particles and galaxies resolved by star particles at redshift . Table 1 presents a summary of the key features of the reference model
Ref-L100N1504. The properties of the particles in the simulation were recorded for snapshots between redshifts and ,
which translates to time span range between snapshots of Gyr. However, finer time resolution are also available, referred to as ‘snipshots’ in
Crain
et al. (2017), in which a smaller set of particle properties are saved at redshifts between .
It is important to note that only of the snipshots were used to construct the merger trees;
the merger trees are computationally expensive to construct. Hence, the time resolution of the snipshots span between Gyr. We use the merger trees available in the EAGLE
database (McAlpine
et al., 2016) to trace the evolution of ring galaxies in the snapshots of the simulation, while for snipshots
we use the private merger trees catalogue. All these merger trees were constructed as in Qu et al. (2017).
2.2 Mock observations & Images
Camps et al. (2016, hereafter T17); Trayford
et al. (2017, hereafter T17) present a novel method to generate mock synthetic optical images of galaxies in
the EAGLE simulations that includes the effects of dust using the SKIRT Monte Carlo radiative transfer code
(Baes
et al., 2003, 2011; Camps &
Baes, 2015). T17 compute a full spectral energy distribution (SED) for each star particle
using the the GALAXEV population synthesis models of Bruzual &
Charlot (2003), taking into account the stellar ages, smoothed
metallicities and initial masses of the star particles. They also use the MAPPINGS photoionisation code (Groves
et al., 2008)
to describe the effects of dust associated with star-forming regions, nebular line and continuum spectra throughout
the HII regions. The SKIRT Monte Carlo code then uses these sets of sources and dust distributions to determine
the path of the monochromatic photons (absorption & scattering) until they hit the user specified detector.
T17 construct images in SDSS bands (Doi et al., 2010) of galaxies with MM⊙
in the EAGLE hydrodynamical simulation at redshift . These observations are available in three orientations: edge on, face
on and randomly orientated with respect to the galactic plane. Each image is pixels in size, with field of view (FOV)
of kpc, and with the detector camera placed Mpc away from the galaxy centre. The mock observations are performed
as if each galaxy is in isolation, hence disregard all the contribution from other sources and structures along the line of sight or
closer than kpc in projection.
3 Selection of Ring Galaxies in EAGLE
We develop a Python algorithm specifically designed to identify ring galaxies in the Ref-100 simulation box. The routine makes use of the face-on orientation -images created by T17 and broadly quantifies galaxy morphologies into ellipticals and lenticulars (early-type), spirals (late-type), and morphologically disturbed (interacting) systems. This algorithm relies on the radial flux profiles of these galaxies and works as following:
-
•
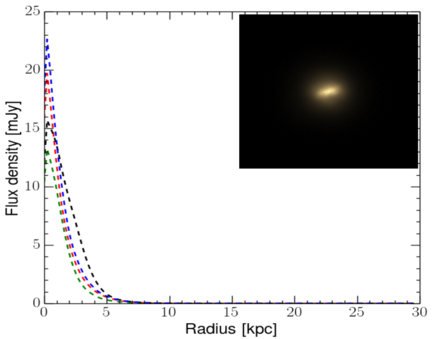
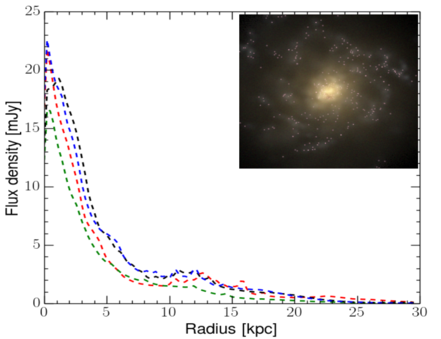
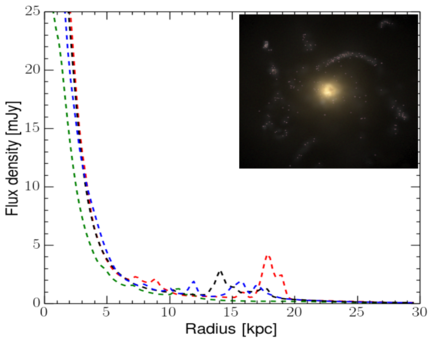
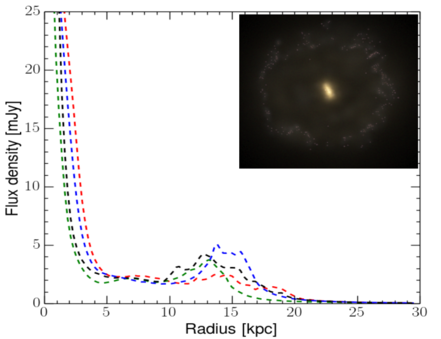
Each galaxy is divided into four strips, each kpc in width, along the major and the minor axis of the galaxy. For each strip, we construct a radial flux profile using the rest-frame face-on -band images, and smooth this profile using a kernel function with a Gaussian scale. By definition each galaxy is placed at the centre of image, hence the radial profile describes the flux distribution of each respective galaxy from its centre to its outer edge. For early-type (elliptical and lenticular) galaxies, the flux distribution varies rapidly with radius with a high peak at the centre of the galaxy that decreases abruptly with radius. The case is slightly different for late-type (spiral) galaxies, where the flux decreases gradually with radius and the spiral arms produce flux increments (bumps) throughout the radial flux profile. The radial profile of interacting (morphologically disturbed) galaxies is similar to that of the late-type galaxies, albeit the bumps are more extended and the flux increments are higher. It is important to note that no changes to the final results will occur if the width of the strip is slightly larger than kpc.

Figure 4: Upper Panel: The formation density rate of ring galaxies in the EAGLE simulations (red dotted line) compared to the number density from observations (black unfilled circles from Elmegreen & Elmegreen 2006, blue triangles from Lavery et al. 2004, and filled square from Yuan et al. 2018 in prep.). The grey shaded region marks the Poisson errors in the EAGLE number density. The blue line shows the number density of all mergers in the simulation with a stellar mass ratio , while the black dotted and magenta dash-dotted lines show the contribution from major (mass ratios ) and minor mergers (mass ratios between ), respectively. EAGLE agrees very well with the ring galaxy observations. Lower Panel: The ratio between the collisional ring galaxies number density to the major (blue line) and minor (red dashed line) merger rates. The black dashed line represents equality. -
•
Next the algorithm searches and quantifies the flux increments (bumps) in the radial profile of each galaxy and uses both the extent (width) and the amount of flux boost in each bump as a broad indicator to quantify the galaxy morphology. Early-type galaxies are the simplest to segregate, in which there are no flux increments with radius in the profiles and the flux decreases smoothly with increasing radius. To distinguish between late-type and morphologically disturbed systems, we use the width of the bump and the flux increment present in the galaxy radial profile. Galaxies with continuous bump(s) that extends for kpc in at least two strips and the flux boost in each bump is are considered as interacting candidates. Figure 1 presents an example of the kernel smoothed radial flux distribution in four strips of the face-on image of an elliptical, spiral, and two morphologically disturbed (interacting) galaxies at redshift , respectively. The inset shows the -band image of the same galaxies. The flux distribution in the elliptical galaxy has no bumps and decreases continuously with increasing radius. On the other hand, the radial flux profile in the spiral and the interacting candidates shows many bumps with increasing radius. However, the difference between the two is that the spiral galaxy shows less boost in the flux at each bump ( ) compared with the two interacting systems in the bottom panel.
-
•
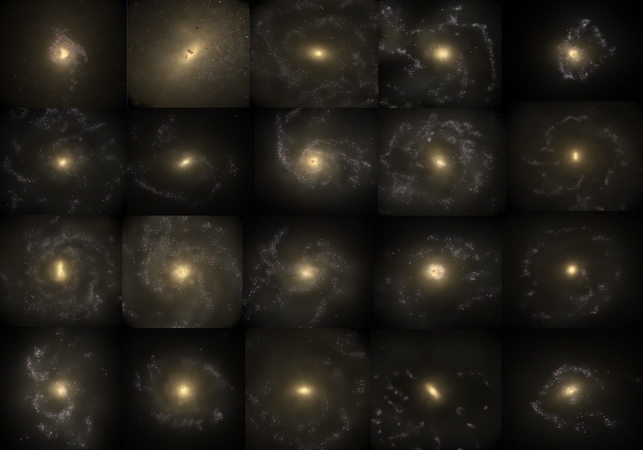
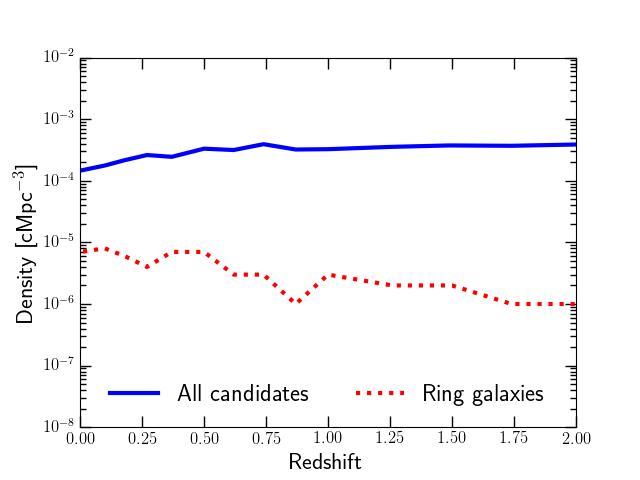
Lastly, the algorithm makes a list of all the interacting candidates and creates plots similar to Figure 1 for those galaxies. The final step is to visually inspect the interacting galaxies subsample and only select galaxies that have a ring or C-shape morphology. Visual inspection is necessary in order to distinguish the P-type (collisional) and resonant O-type ring galaxies and to determine the presence of any weak bar-like or spiral structure. Figure 2 shows a subsample of the mock images of the interacting galaxy candidates selected by the algorithm at =, the majority of these galaxies are morphologically disturbed or interacting systems and a smaller fraction are the real ring galaxies. In this figure the true ring galaxies are located at the far right column. We visually inspect all the interacting galaxy candidates generated by the algorithm between redshift to and select only the candidates with a ring or C-shape morphology. Figure 3 shows the number density of the interacting or disturbed candidates as a function of redshift (blue line) along with the visually selected subsample of ring or C-shape morphology candidates (red dotted line). The number of disturbed or potentially interacting galaxies increases with redshift, which is consistent with other studies (e.g., Abraham et al., 1996; Fakhouri et al., 2010; Bluck et al., 2012; Man et al., 2016). The total number of interacting candidates varies between at redshift up to candidates at .
To investigate the success rate of our algorithm, we search for ring galaxies visually at redshifts and using
the composite images available in the database (McAlpine
et al., 2016). We inspect all the galaxies in these three snapshots that have a stellar mass of
MM(corresponding to the typical masses of observed ring galaxies)
and record all of the ring galaxies in these snapshots. Then, we run this semi-automated algorithm and
compare the visually inspected ring galaxies with the the list of interacting candidates that results at redshifts and .
We find that the list of interacting candidates generated by the semi-automated algorithm recovers all the ring galaxies
that were visually found. Further, to test the reliability of the algorithm, we set the
extent of the bump to kpc and kpc instead of kpc. The number of candidates in the former two cases are similar to the number of candidates that results from
setting the required extent to kpc. However, if the extent of the bump decreases to kpc or less, the number
of candidates increases by up to more at a given redshift. The majority of the new candidates are spiral
galaxies, with no real ring galaxies. Hence, setting the width of the bump to kpc is optimal and reduces the number
of false candidates appearing as a result of the spiral arms in late type galaxies.
Further, we apply our algorithm to the EAGLE higher resolution smaller box Ref-L025N0752 (Schaye
et al., 2015) and search
for ring galaxies between redshifts to ,
with the aim of uncovering any obvious resolution effects on the formation process of ring galaxies.
We find no ring galaxies in this simulation box, which agrees with the expected number density of ring galaxies from the observations. In Ref-L025N0752 box
( cMpc3), the expected number of ring galaxies in each snapshot is , using the number density of Mpc-3 from Lavery et al. (2004).
This result provides no evidence to suggest that the ring galaxies detected in Ref-100 are due to resolution effects.
To distinguish between the P and O-type ring galaxies, we crossmatch our sample with the sample of barred galaxies in EAGLE
reported in Algorry
et al. (2017, hereafter A17). A17 analyse the central galaxies in EAGLE that lie within mass range of
at redshift and classify galaxies via the amplitude of the
normalised Fourier mode of the azimuthal distribution of their disk particles.
Galaxies with a normalised amplitude (A) are unbarred systems, those with an amplitude in the range of
have a weak bar, while strongly barred galaxies have an amplitude A .
At redshift , we identify seven systems as ring galaxies, one of which has a strong bar
(A ) and the remainder are unbarred galaxies. At higher redshift, we explore the formation history of our
ring galaxy sample to distinguish between barred and collisional ring galaxies. This is discussed in Section 5.


4 Characterisation of the Ring Galaxy Population in EAGLE
In this section, we study the number density, environment and properties of ring galaxies. We pay special attention to the relation between the gas abundance and star formation in the ring galaxies to understand the origin of their star formation deficiency.
4.1 Rings as Tracers of Galaxy Mergers
The upper panel of Figure 4 shows the formation density rate of collisional ring galaxies identified in the EAGLE
simulations (red dash-line) and in observations as a function of redshifts. The grey shaded region marks the one-sigma scatter
in the EAGLE number density rate111The number density rate is the number of collisional ring galaxies per comoving volume per time interval.
Here, we adopt the time interval between each snapshot for our calculations., refer to Table 3 for the number of ring galaxies identified in EAGLE at each snapshot. The blue triangles show the number density rate of these galaxies identified (visually)
in deep Hubble Space Telescope (HST) Wide Field Planetary Camera 2 archival images and reported in Lavery et al. (2004).
The black unfilled circles show the number density rate measured in Elmegreen &
Elmegreen (2006) by visually inspecting the deep archival images
of the Galaxy Evolution from Morphology and SEDs survey (GEMS; Rix et al., 2004) and the Great Observatories
Origins Deep Survey (GOODS; Giavalisco
et al., 2004).
The filled square presents a new measurement for the number density of ring galaxies in the redshift range
identified visually in the COSMOS field of the FourStar Galaxy Evolution (ZFOURGE) catalogue field images (Straatman
et al., 2016), which will be reported in Yuan et al 2018 (in prep.).
Galaxy merger rates in the EAGLE simulation, as presented in Lagos
et al. (2018), are also presented in this figure for comparison.
The major merger rates (stellar mass ratios of ) are shown as the black dotted line, minor merger rates (stellar mass ratios of ) as
the magenta dash-dotted line and all merger rates (minor+major) as the blue line.
The lower panel of Figure 4 shows the ratio between the collisional ring galaxies number density and the major
(blue line) and minor (red dashed line) merger rates. The black dashed line represents equality. This figure
shows that collisional ring galaxies are biased tracers of merger rates and that this bias is independent of redshift.
Also, the number density of collisional ring galaxies found in EAGLE simulations broadly agrees with the observed number density within the uncertainties.
This is a success for the EAGLE project especially because the calibration of the subgrid physics in these simulations did not include galaxy morphology (Crain
et al., 2015).
However, it is important to point out the moderate difference in the theoretical prediction of the number density value at and ;
this difference could be due to the various systematic uncertainty sources in the observed number density such as cosmic variance and the uncertainty in the
redshift measurements. For instance, the majority of the observed ring galaxies in Lavery et al. (2004) have indirect redshift measurements using a ‘standard’
absolute -band magnitude for collisional ring galaxies (Appleton &
Marston, 1997) to constrain the redshift interval of their sample.
4.2 The Host Halos of Eagle Ring Galaxies
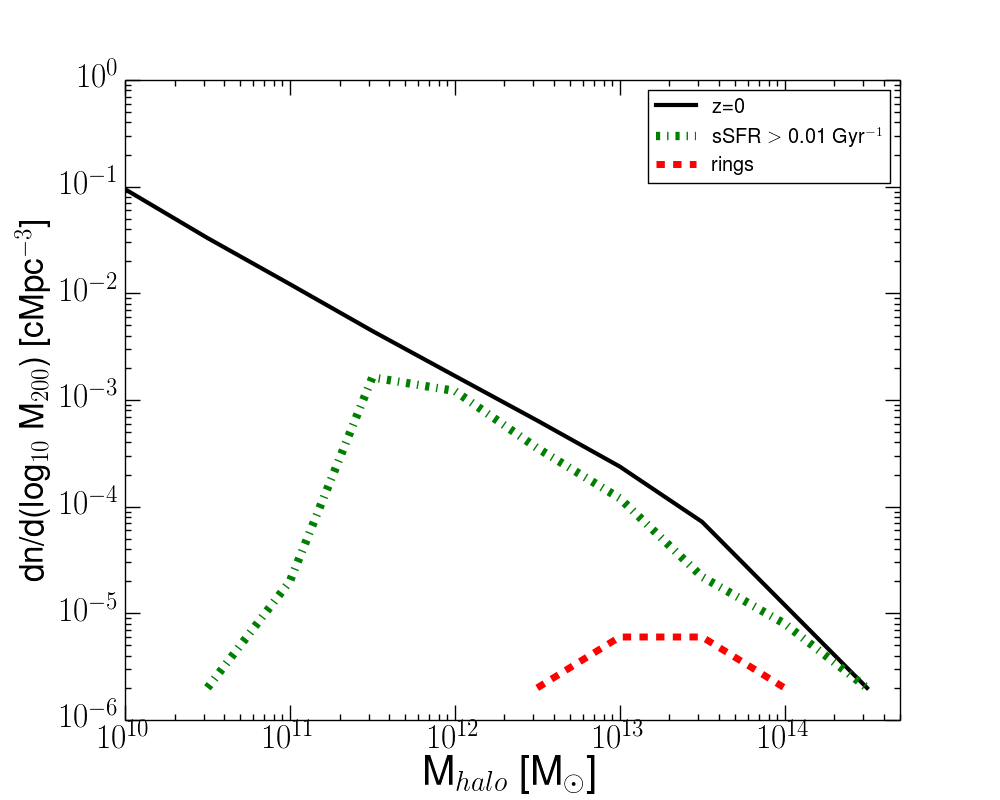
The upper panel of Figure 5 shows the mass function for all the haloes at redshift = (black line),
for haloes hosting a star-forming central galaxy (green dash-dotted line) and for haloes hosting a ring galaxy (red dashed line) at =. Star-forming
central galaxies are those with specific star formation rates (sSFR = SFR/M∗) Gyr-1 (Furlong
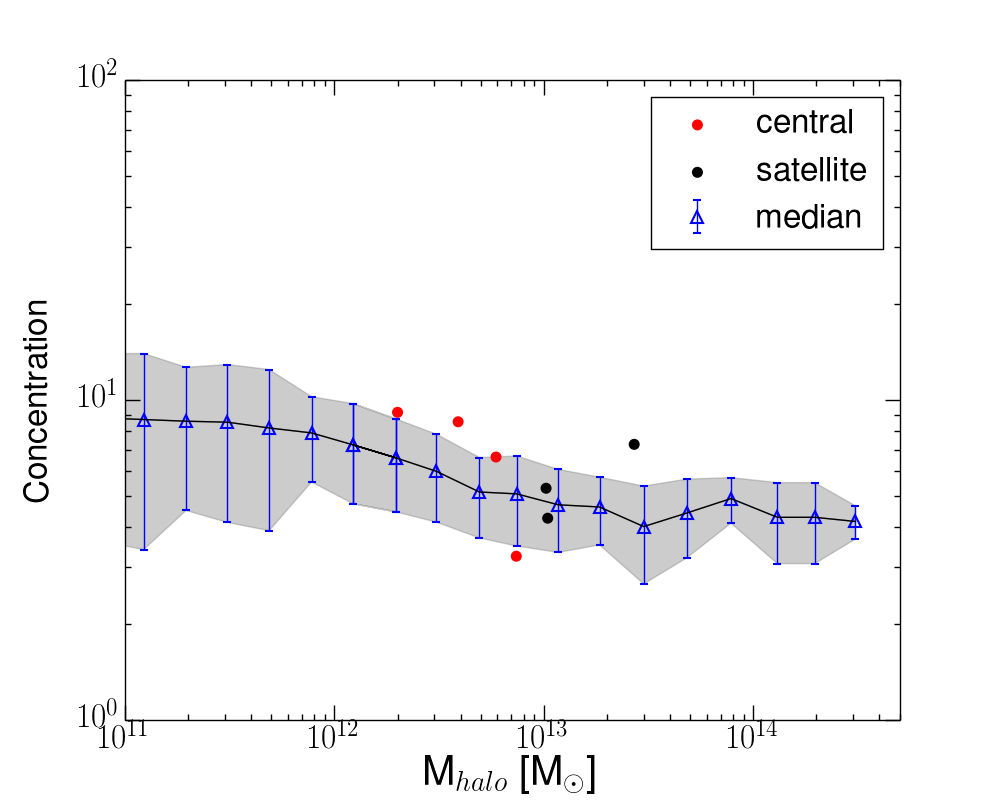
et al., 2015). The lower panel of Figure
5 shows the concentration of haloes (the ratio between the virial radius to the characteristic radius of that halo) as a function of their mass
at =. The grey shaded region is the one sigma deviation from the median value (blue triangles). The red and black symbols show the concentrations of haloes hosting
central and non-central ring galaxies, respectively. This figure shows that ring galaxies found in EAGLE live in
massive groups that are preferentially more concentrated than other groups that host no ring galaxies at
fixed halo mass, in spite of the low number statistics. This is broadly consistent with the observations, which show that ring galaxies are located within galaxy
groups that have at least one companion galaxy (Romano
et al., 2008). It is reasonable to think that ring galaxies form
in dense environments such as compact groups, since a common formation mechanism is based on collisions and drop-through interactions.
However, ring galaxies are not found in galaxy clusters, even though the galaxy population density is higher in the
cluster environment. The main reason for this is that the high velocity dispersions and/or any off centre encounters
between the ring galaxy and other cluster members will disrupt the ring more quickly than in the group environment.
This explains the decline in the halo mass function of ring galaxies (red line) with masses larger than
M⊙.

4.3 The Properties of Eagle Ring Galaxies
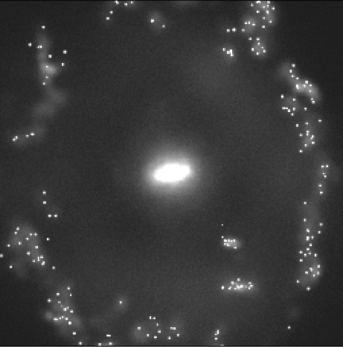
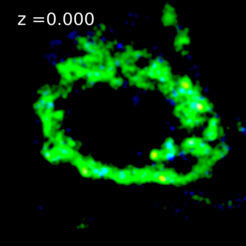
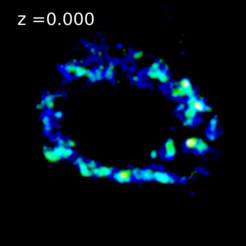
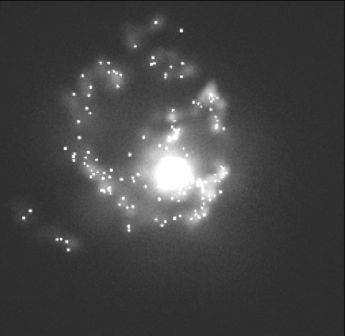
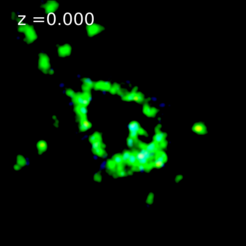
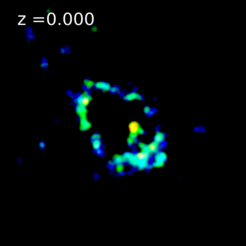
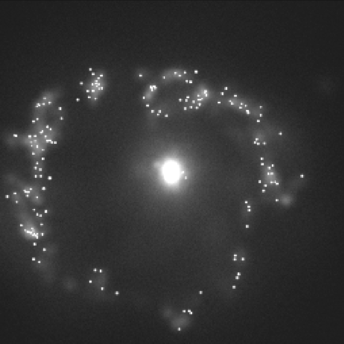
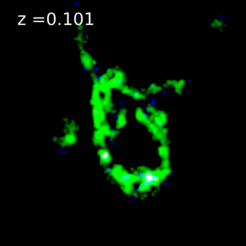
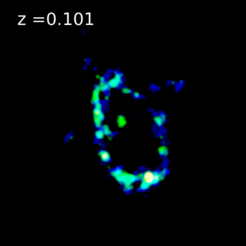
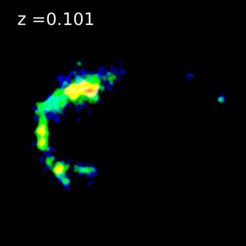
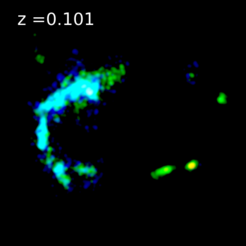
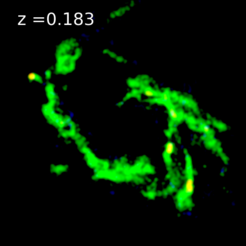
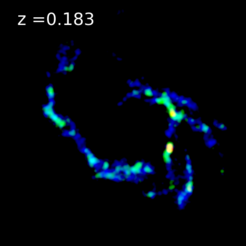
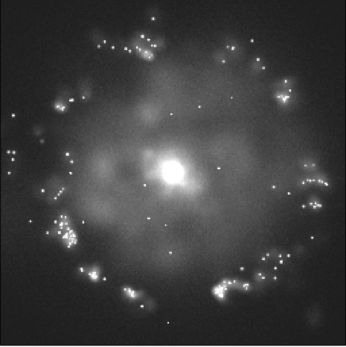
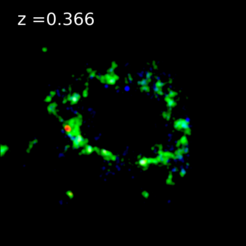
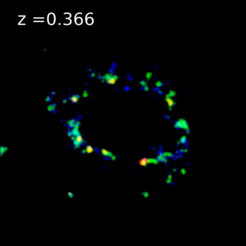
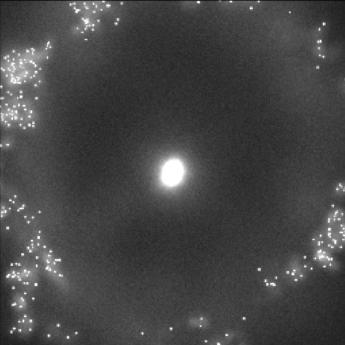
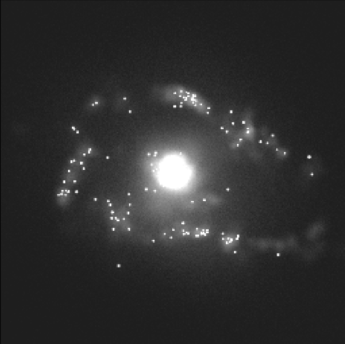
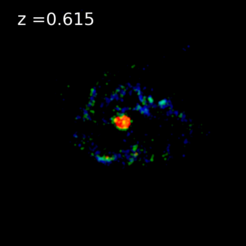
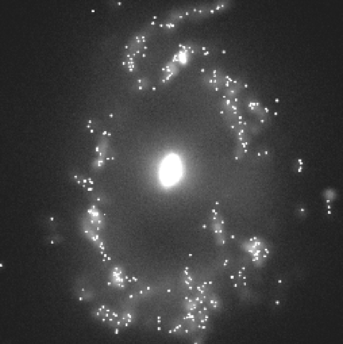
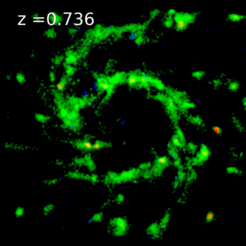
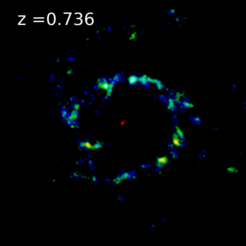
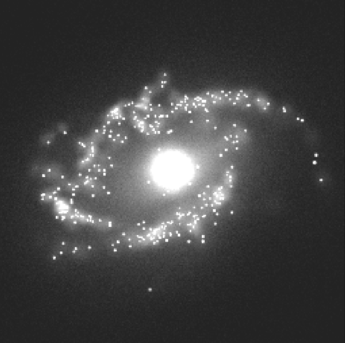
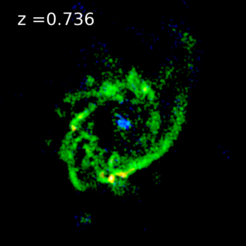
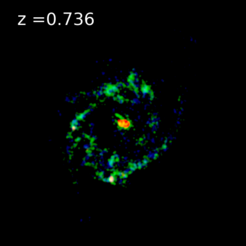
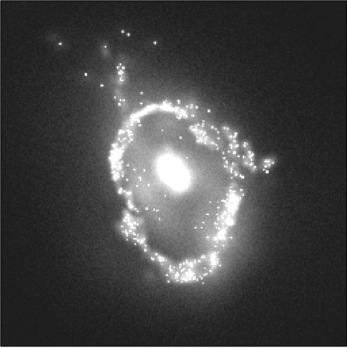
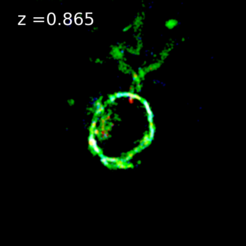
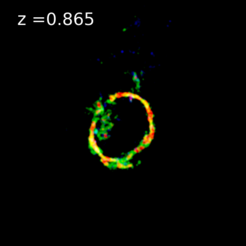
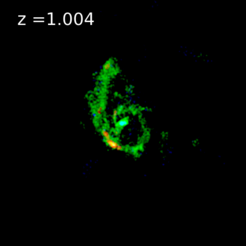
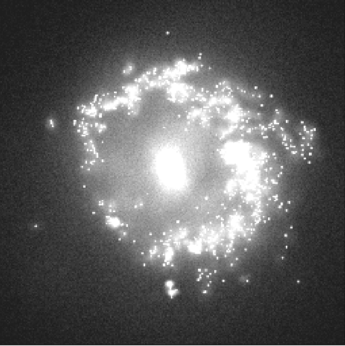
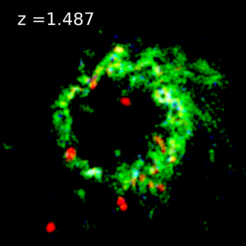
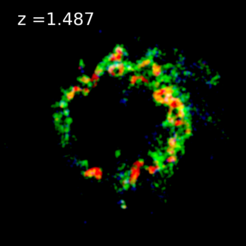
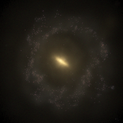
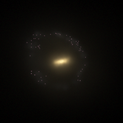
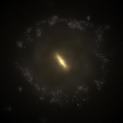
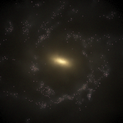
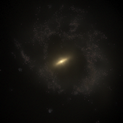
Figure 6 is a visualisation of fourteen randomly selected collisional ring galaxies in EAGLE in the redshift range between = and .
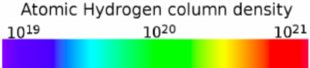
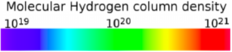
Each row corresponds to the face-on -band mock image (left), the HI (middle) and H2 (left) column density maps of
the same galaxy. The HI and the H column densities were calculated using the prescriptions in Rahmati et al. (2013) for the neutral hydrogen fraction in gas particles and
Gnedin &
Kravtsov (2011) for the HI to H2 transition, as described in detail in Lagos
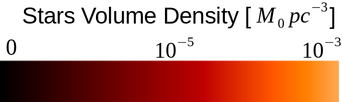
et al. (2015). The colours in the column density images are coded according to the colour bar in the top row and
are in units of atoms per cm2. The -band images are kpc on a side while the HI and H2 column density images
are kpc on a side. The atomic and molecular hydrogen column densities exhibit the same ring morphology seen in the -band images,
and regions with very low column density “holes” are present in the HI and the H2 maps around the nucleus and
the inner low surface brightness regions. This is in agreement with the current theoretical understanding of the formation history of
ring galaxies, in which the collision with a companion galaxy carries the gas of the target galaxy through its disk and forms
the ring morphology. The majority of the observed collisional ring galaxies in the local Universe show similar morphologies, for instance the atomic gas in the Cartwheel and
AM0644-741 (Lindsay–Shapley Ring) is mostly concentrated in a ring morphology and a region of very low column density is clearly
visible in the nucleus; for reference see the HI maps of these two galaxies in Higdon (1996) and Higdon
et al. (2012).
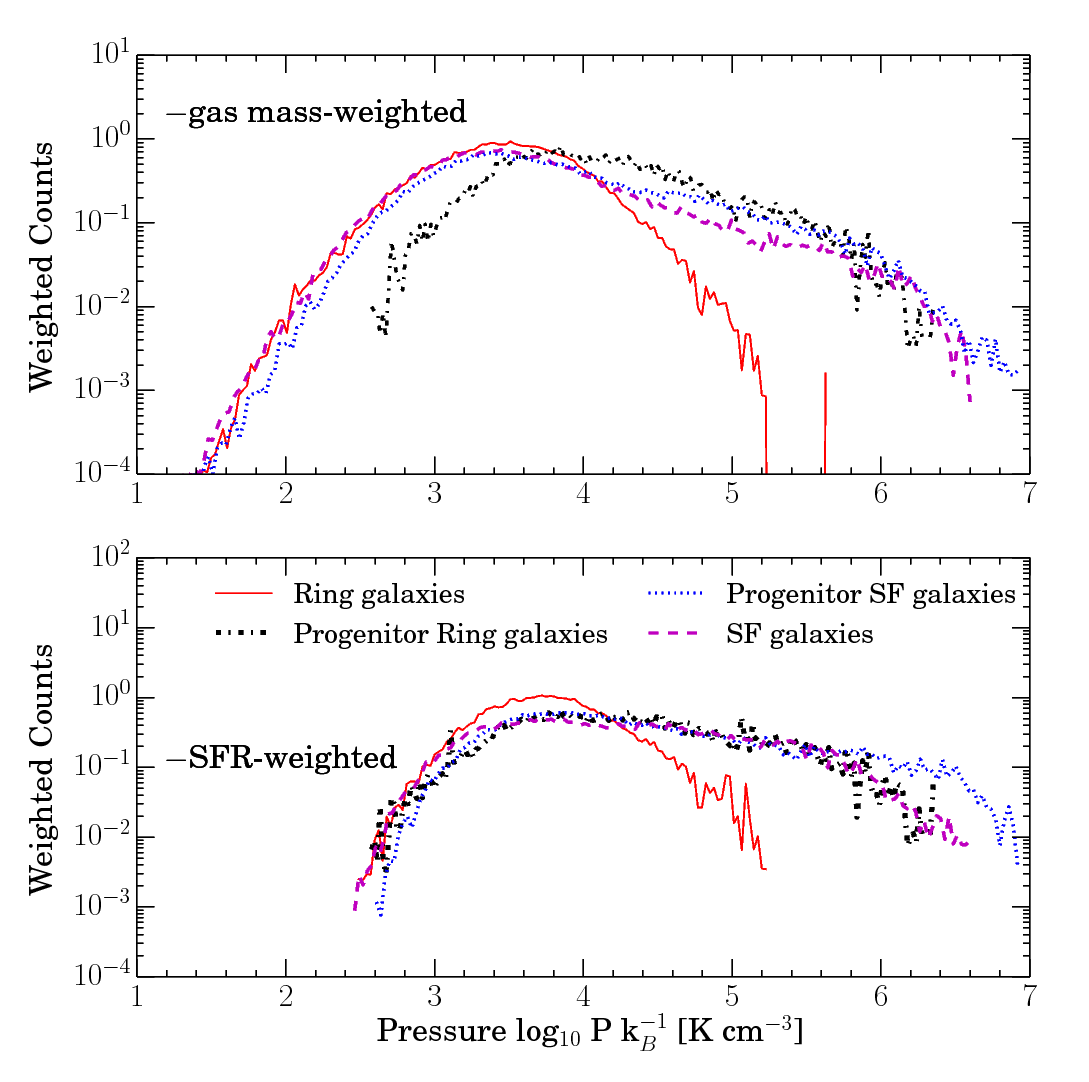
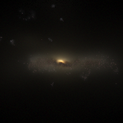
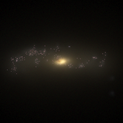
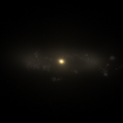
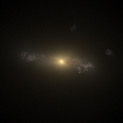
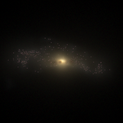
Figure 7 presents the edge-on colour composite images of a subsample of EAGLE ring galaxies identified
between and . The majority of the EAGLE rings have relatively thin stellar disks when viewed edge-on.
This is in agreement with non-cosmological isolated interaction simulations (Gerber
et al., 1996; Mapelli &
Mayer, 2012), in which the rings in systems formed due
to collisions with massive satellites (mass ratio M/M) contain larger fractions of their disk’s material (gas and stars) and are
thicker in comparison with their counterparts which formed with less massive companions. Hence, EAGLE rings are expected to have relatively thin disks as the
vast majority of these systems have less massive companions and stellar mass ratios less than one.
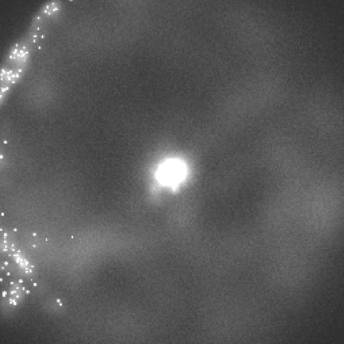
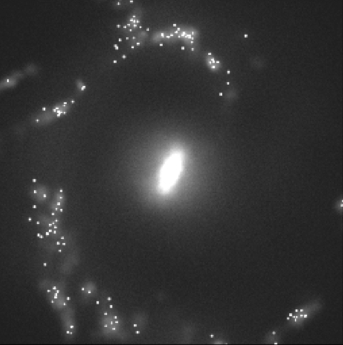
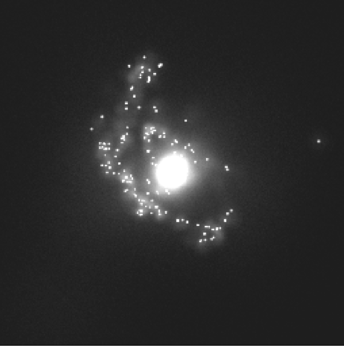
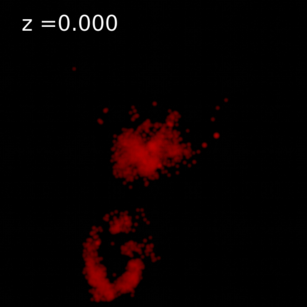
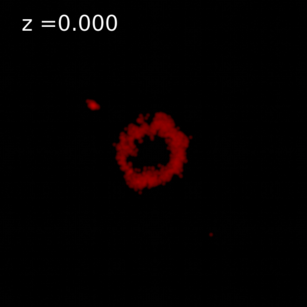
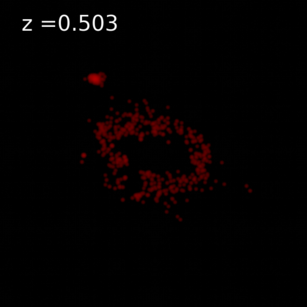
Figure 8 shows the stellar volume density view in six ring galaxies identified in EAGLE between and .
The volume density is calculated as the stellar mass in each cell divided by the cubic smoothing length, ,
with the image pixels smoothed over kpc. In each view, a companion satellite galaxy appears within a close distance (roughly one ring diameter)
from the central ring galaxy. We also note that the vast majority of EAGLE ring galaxies have companion satellite(s) that lie within similar distances to the examples in Figure
8, on average within a distance kpc. This agrees with the current theoretical and observational
understanding of ring galaxies in the local Universe. For instance, in most of the observed ring galaxies the intruder lies within a physical
distance of less than kpc (Elagali et al., 2018; Conn et al., 2016; Fogarty
et al., 2011).
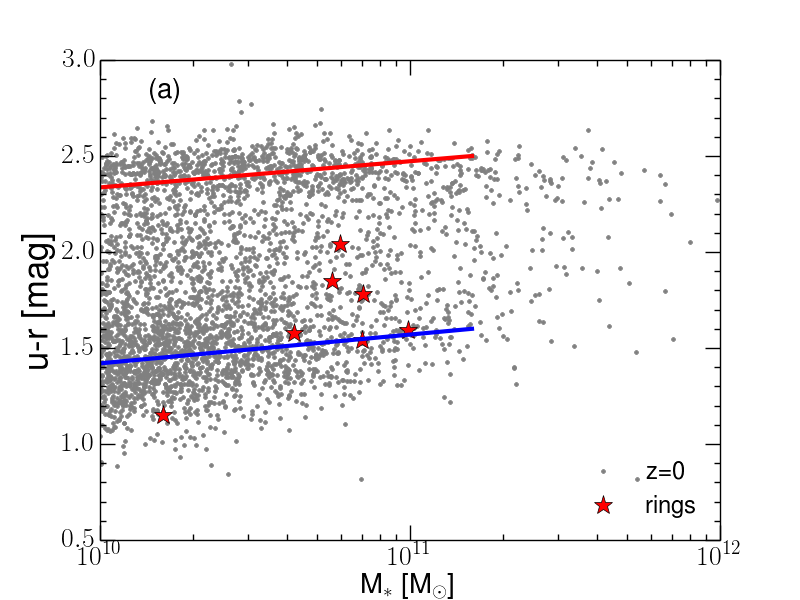
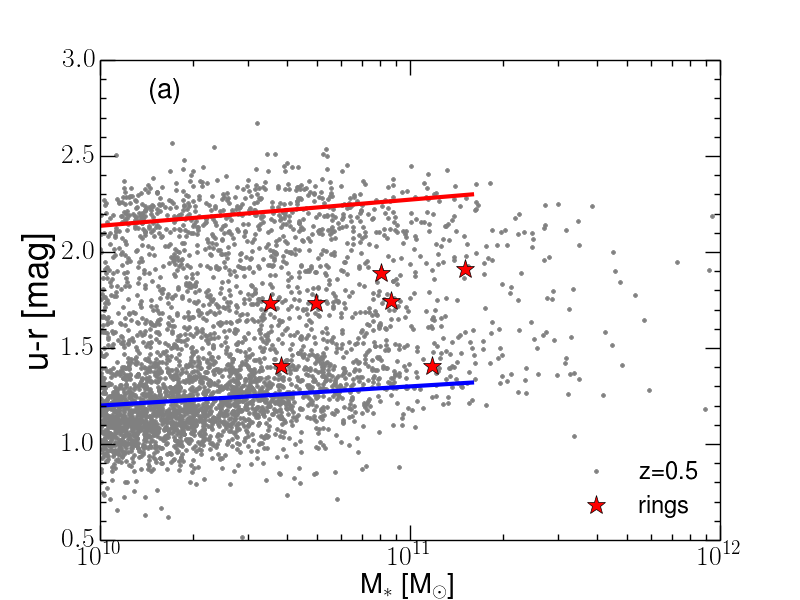
Figure 9(a) shows a scatter plot of EAGLE galaxies in the () colour-stellar mass plane
at (left) and (right). The colours here are intrinsic, i.e., rest-frame and dust-free colours;
refer to Trayford
et al. (2015) for details on the dust modelling and the magnitude measurements.
The red stars in this Figure correspond to ring galaxies in EAGLE at (left) and (right).
The red and blue lines mark the location of the red sequence and blue cloud at each redshift, respectively, and are shown to highlight the colour bimodality of
the galaxies in EAGLE (Trayford et al., 2016). Most of the ring galaxies at are located in the
blue cloud in the colour-stellar mass diagram which indicates that these systems are actively forming stars. This is comparable to the observations of
ring galaxies in which most of the studied collisional ring galaxies (within redshift range ) are star-forming blue
galaxies (Wong
et al., 2006; Romano
et al., 2008; Fogarty
et al., 2011; Parker et al., 2015; Conn et al., 2016; Elagali et al., 2018). However, at ring galaxies are located in the green
valley with fewer candidates in the blue cloud. This suggests that the interactions driving the ring morphology are also driving the colour transformation and gas
exhaustion which may lead to quenching in these galaxies.
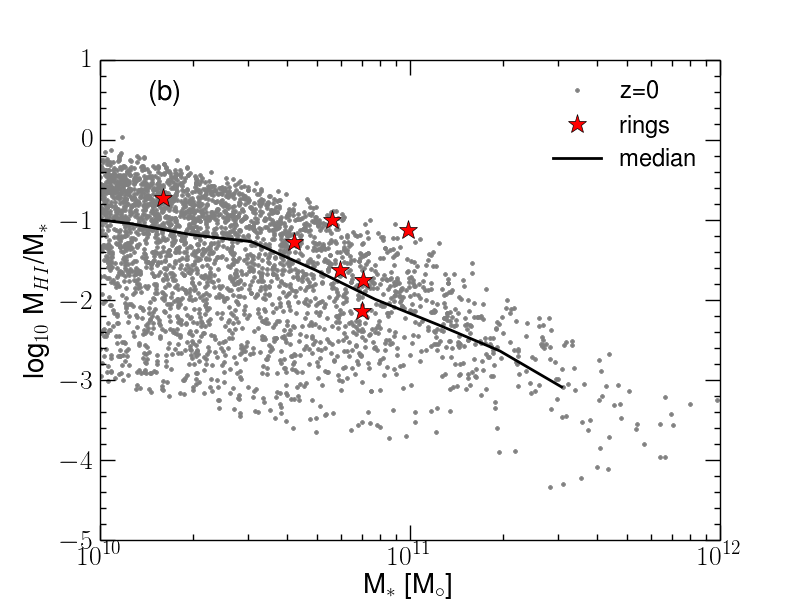
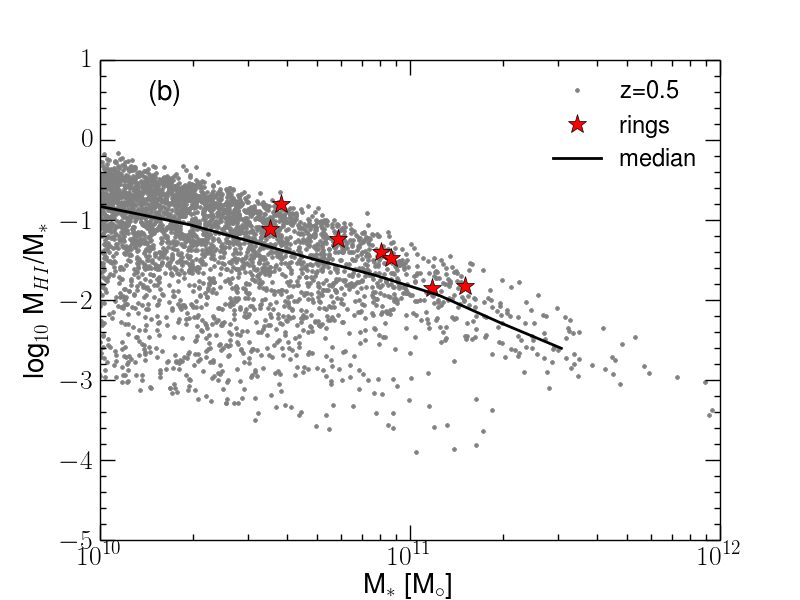
Figure 9(b) presents the standard HI gas fraction scaling relation (M/M∗vs. M∗)
of the EAGLE galaxies at (left) and (right).
At both redshifts, the majority of the ring galaxies have higher gas fraction
in comparison with the median at fixed stellar mass. This highlights the high HI gas fraction in collisional ring galaxies found in the EAGLE simulations,
which agrees well with the observations, in which collisional ring galaxies are known to have high HI gas fractions relative to other galaxies at
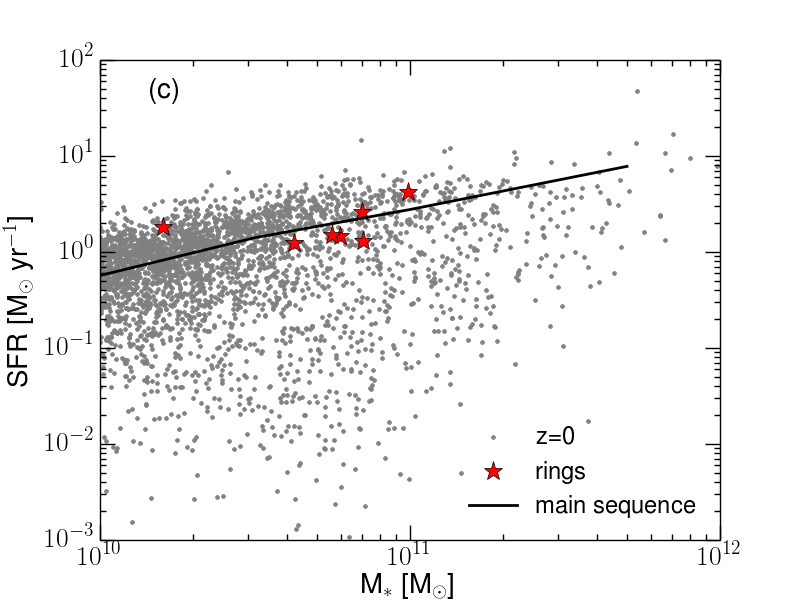
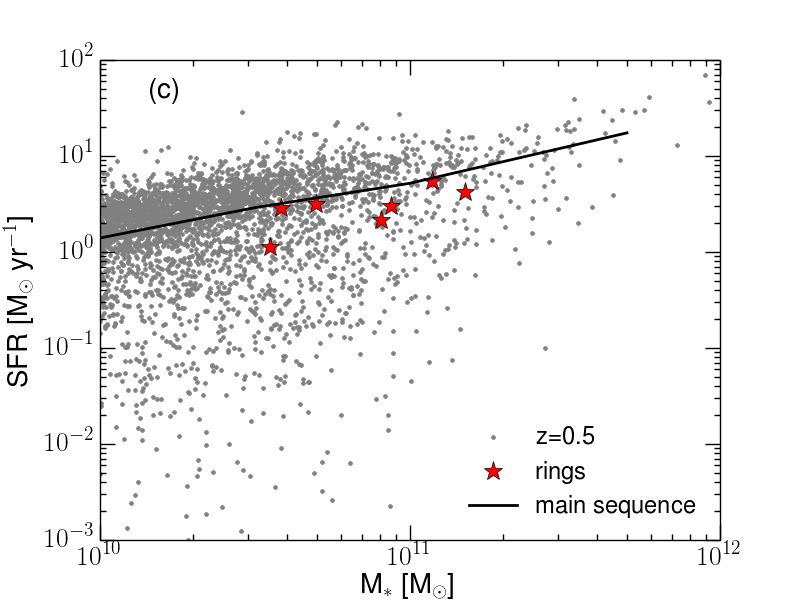
fixed stellar mass (Elagali et al., 2018). Figure 9(c) shows the SFR vs. the stellar mass of EAGLE galaxies at (left) and (right).
The black line shows the star formation main sequence at each redshift (Furlong
et al., 2015). At redshift , the majority of ring galaxies are active
star-forming galaxies and lie on the main sequence with few occupying the green valley.
On the other hand, at redshift ring galaxies have considerably lower star formation rates at fixed stellar mass than the main
sequence. This is consistent with the top right panel of the same Figure, where ring galaxies appear to be in the process of quenching and occupy the green
valley in the colour-stellar mass plane. It is important to note that massive galaxies in EAGLE (MM⊙) are known to have slightly
less HI gas than in observations (Crain
et al., 2017), which is expected to have a direct impact on the star formation rates resulting from the interaction.
This can be part of the reason why ring galaxies in EAGLE have less star formation rate in comparison with the observations, see for example the early IRAS study of ring
galaxies in Appleton &
Struck-Marcell (1987). We study the ISM of ring galaxies in the next subsection to explore any other physical reasons that may lead to the low star
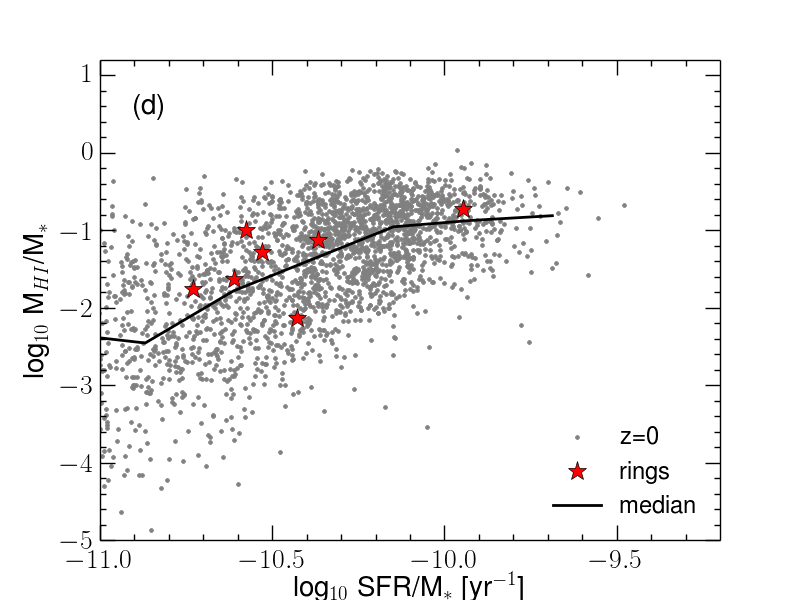
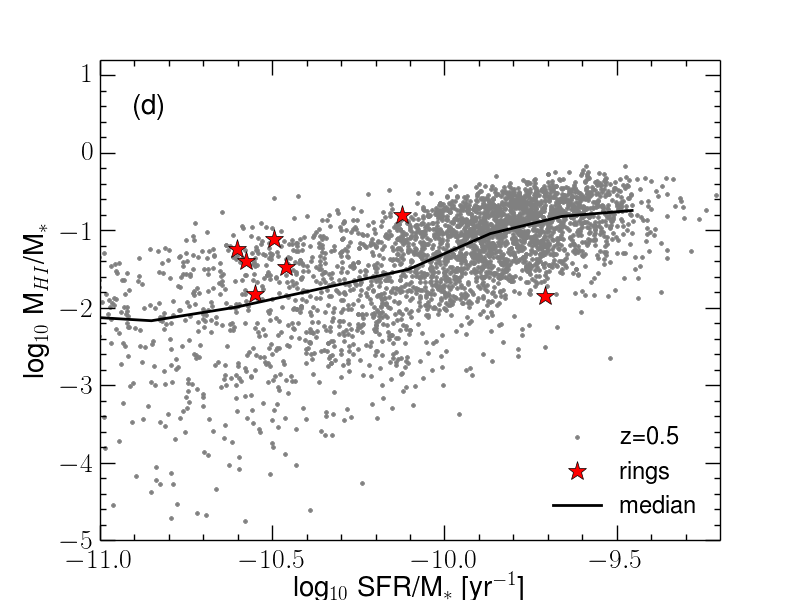
formation in ring galaxies in EAGLE. Figure 9(d) shows the HI gas fraction (M/M∗) versus the specific star formation rate
for galaxies in the EAGLE simulation at (left) and (right). The black
line marks the median values at each sSFR bin. At redshift , the majority of the
ring galaxies have a higher gas fraction than the median value at their sSFR bin. This is different for ring galaxies at redshift
as only two rings have higher gas fraction at fixed sSFR.
It is important to mention that we explored these standard scaling relations up to , however we only show two redshifts for brevity.
Ring galaxies at higher redshifts have the same trend as rings at ; the majority of these systems have high gas fractions yet
lie below the star formation main sequence and occupy the green valley in the colour-stellar mass plane.
Combining the results of the HI and the SFR of ring galaxies versus the general population of galaxies in EAGLE, we see that ring galaxies
are characterised by an inefficient conversion of the HI gas into stars. It is important to caution the readers to the
low number statistics in this analysis; even though it is evident that rings at higher redshifts () exhibit inefficiency
in star formation these systems maybe unrepresentative of the whole population of ring galaxies at higher redshifts.
We discuss the physical drivers behind this inefficiency in Section 4.4.
4.4 The ISM of Eagle Ring Galaxies
EAGLE adopts the star formation law of Schaye &
Dalla Vecchia (2008), which expresses the Kennicutt (1998) observational relation as a pressure law, with the SFR of an
individual gas particle scaling as Pn-1/2, with n=. The gas particles, however, are only assigned a SFR if they reach a
certain density level, which depends on the metallicity of the gas (Schaye, 2004). This means that lower pressure directly translates into a lower SFR.
To better understand the ISM of ring galaxies and the reasons behind the high amount of HI gas and the inefficient star formation in these system,
we explore the properties of the gas particles in seven ring galaxies at redshift = and compare them with seven other EAGLE star-forming galaxies with
similar gas and stellar masses. We refer to the latter as the control galaxy sample. The average difference in the HI gas mass between the ring and control samples
is smaller than dex.

Figure 10 shows the pressure of the gas particles in ring (red line) and control (magenta dashed line) galaxies at the same redshift expressed in
terms of , where k is Boltzmann’s constant. The black dash-dotted and blue dotted lines show the pressure profile of
the ring and control galaxies two snapshots before the ring feature is identified (=), respectively. We refer to those
as the progenitors of ring and control galaxies. Here, we adopt a kpc spherical aperture centred on
the subhalo’s centre of mass and consider all the material within this aperture to belong to the subhalo (the galaxy).
The upper panel of Figure 10 shows the pressure of the gas particles weighted by their neutral gas masses, whereas
the lower panel presents the same property weighted by SFR.
There is a clear difference in the gas pressure between the ring and the control (star-forming) galaxy samples.
The gas in the progenitor of both the ring and control galaxies, as well as and control galaxies at =
have higher pressure regardless of the weighting. This is one reason for the inefficient star formation processes taking place
in ring galaxies and can partly explain the excess amount of HI gas in these system.
This is because the gas-phase pressure affects the rate at which the HI gas is converted to molecular hydrogen, which physically is expected to
regulate the conversion into stars (Elmegreen, 1989; Elmegreen &
Parravano, 1994; Elmegreen, 1993; Blitz &
Rosolowsky, 2006; Leroy et al., 2008), and in some models is the only
parameter controlling whether molecular or atomic gas dominates the ISM in galaxies (Lagos et al., 2011).
This means that high column density, low-pressure HI gas has relatively few H2 molecules and therefore a low SFR in comparison with high column density, high-pressure
HI gas. We note that the gas-phase pressure of the particles evolves with redshift, see Figure 12 in Lagos
et al. (2015), which is the reason for the
shift in the pressure profile of the two progenitor samples at = towards higher values overall compared to
the ring and control galaxy samples at =, especially in the upper panel.
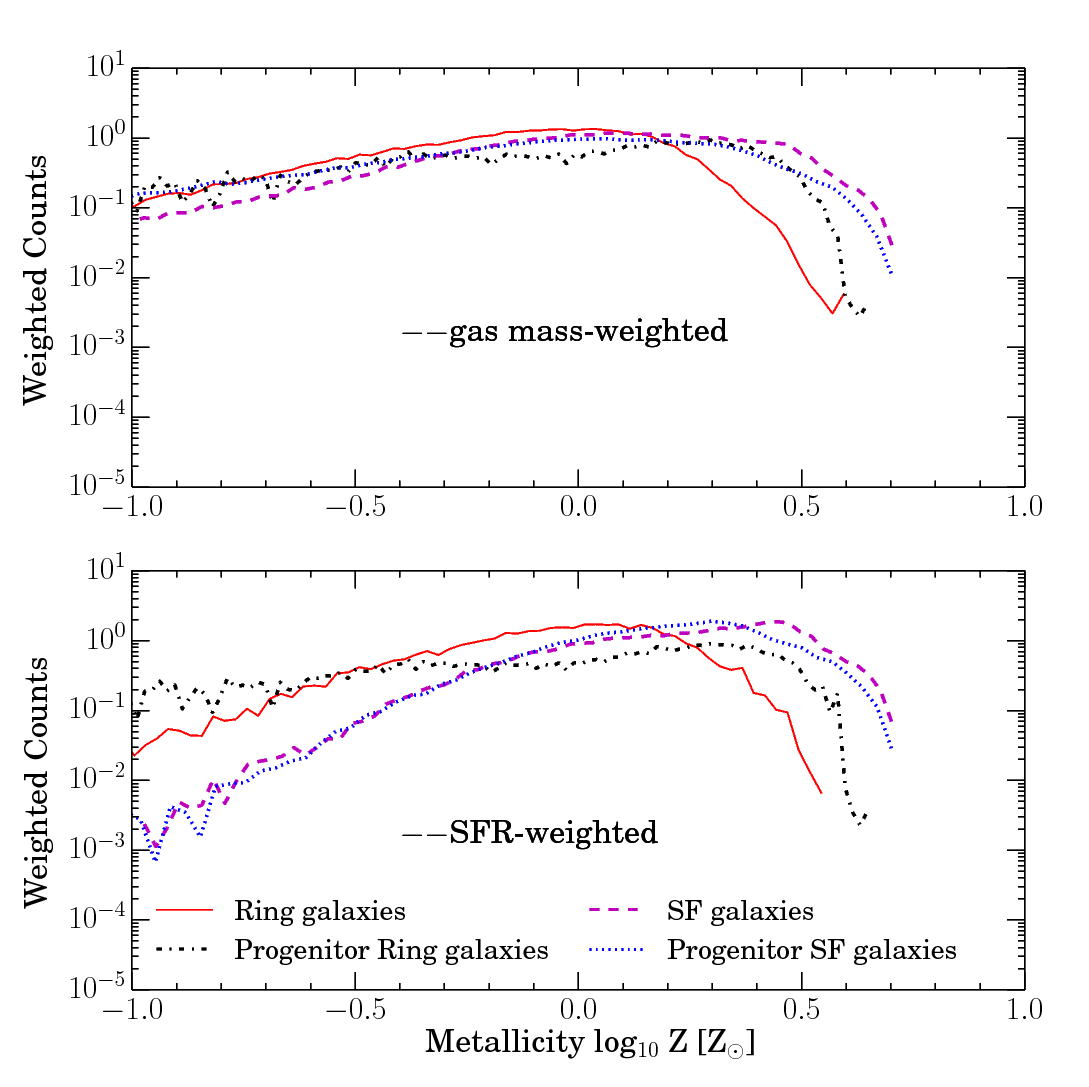
Figure 11 shows the metallicity of the gas particles in the previously discussed seven rings (red line) and control (magenta dashed line) galaxy samples
expressed in units of solar metallicities. The black dash-dotted and blue dotted lines present the metallicity profile of the progenitors of the ring
and control galaxies at =, respectively. The upper panel of Figure 11 shows the metallicity of the gas
particles weighted by their neutral gas masses, whereas the lower panel presents the metallicity weighted by their SFR.
It is evident from Figure 11 that the gas particles in ring galaxies have lower metallicities compared to the
control galaxy sample. It is important to note that the difference in the metallicity profile between the ring galaxies and
their progenitors is likely due to the interaction with the dwarf satellite in which the ring galaxies may gain low metallicity
gas from the dwarf as a result of the interaction.
An intriguing question to address is whether the overall low gas-phase pressure in ring galaxies is due to the different gas distribution in these systems, in which most
of the gas piles up in regions of low pressure, or whether the gas-phase pressure in these galaxies is low irrespective of radii.
In the latter case, the pressure at a given radius would be lower than that of the control sample. We explore these two scenarios
in Figure 12. This figure presents the median radial profile of the HI gas surface density (top panel), the star formation rate
surface density (second panel), the specific star formation rate SFR/M (third panel), and the hydrostatic pressure of the
gas (bottom panel) in the control seven star-forming galaxies (blue) and the ring galaxies (red) at =.
It is important to note that these ring galaxies have different physical disk radii, hence their ring features are not necessarily at the same radius.
The two different samples have similar neutral hydrogen gas surface densities at radii kpc but differ dramatically at radii kpc.
This is connected to the suppression of the star formation and pressure in the inner regions of ring galaxies when compared to the
control sample. However, this suppression takes place out to larger radii than the depression in the HI surface density of ring galaxies.
These trends show that both scenarios described above are taking place in our ring galaxies in EAGLE.
At radii kpc, ring galaxies have higher hydrostatic pressure in comparison with their counterparts. The drop in the gas-phase pressure seen
in the inner regions of ring galaxies is caused by the drop-through collision, which leads to a “dilution” in
the ISM gas surface density and as a consequence the star formation surface density drops significantly in the inner radii of these galaxies.
This is evidenced by the progenitors of ring galaxies having the same pressure distributions as the progenitors of the control sample.
The relatively low pressure and metallicity in ring galaxies offers a physical interpretation for
the inefficient HI to SFR conversion, mostly in the inner regions of these systems, which can lead to the high HI gas fraction
found in observations of ring galaxies (Elagali et al., 2018). Further, this can also explain the low total molecular hydrogen masses
in some of the observed ring galaxies in the local Universe. For instance, the Lindsay-Shapley ring galaxy has as much total H2 mass as a
typical dwarf galaxy (Leroy et al., 2005; Higdon &
Higdon, 2010), which is surprising especially because this galaxy has an atomic gas mass
of M=M⊙ (Higdon
et al., 2012).
Recent observational studies of ring galaxies show that some of these galaxies are H2 deficient even in the outer ring where the atomic
hydrogen surface density is highest. The most plausible scenario offered in these studies is that the molecular hydrogen in the ring is
destroyed by ultraviolet photons from OB stars born in the ring’s confined environment (Higdon et al., 2015; Wong
et al., 2017).
This is different than the result presented in Figure 12, where the star formation rate surface density in ring galaxies is higher in the outer
radii (kpc) in comparison with the star-forming galaxy sample implying that the abundance of cold gas in the ring should be relatively normal.
To examine the photodissociation hypothesis suggested in Higdon et al. (2015); Wong
et al. (2017),
we need to follow the formation and the evolution of the molecular hydrogen. This requires a detailed description of the ISM and the photoionisation effects of local sources
on the H2 gas, which is not currently feasible in simulations with a boxsize as large as EAGLE and only prescribed in zoom-in simulations,
see for example Hopkins
et al. (2014, 2017). However, future developments in large hydrodynamical simulations, such as EAGLE, will explicitly track the formation of the molecular hydrogen at much higher
resolution. Such projects will be ideal to address this issue.
5 Formation Mechanisms of Eagle Ring Galaxies
To understand the formation mechanisms of ring galaxies in EAGLE, we trace the evolution of the haloes hosting
ring galaxies using the finer time resolution snipshots (Schaye
et al., 2015). The time resolution of these snipshots
span between Gyr, which is smaller than the typical merger timescale (Ji
et al., 2014; Jiang et al., 2008), hence
very suitable to track collisions and drop-through interactions. For each ring galaxy, we examine the history of their
host halo by tracing its evolution for one Gigayear before and one Gigayear after the ring morphology is identified.
| Mechanism | Number | Averaged lifespan (Myr) |
|---|---|---|
| One collision encounter | ||
| Multiple collision encounters | ||
| Barred galaxies (P-type) |
We visually inspect the history of the all the ring galaxies identified in EAGLE to determine whether the ring morphology
forms in response to collisions or not. This process is very simple, as in all the cases the effect of the drop-through is evident if present.
An example of this is shown in Figures 13-14 (discussed in detail below).
The majority of ring galaxies identified in EAGLE ( out of galaxies) have an interaction origin, i.e., formed when a companion
galaxy(ies) drop-through a "target" galaxy (sometimes more than one drop-through). The remainder galaxies (per cent)
have very long-lived ring morphologies (Gyr). These long-lived systems are most likely barred galaxies (P-type rings).
For instance, one of these long-lived ring galaxy hosts, identified at , is listed as a strongly barred galaxy in A17.
Table 2 lists the different identified formation mechanisms for ring galaxies in EAGLE and the average lifespan of the ring morphology
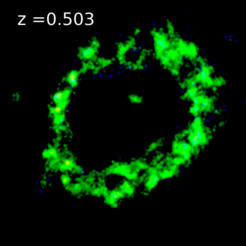
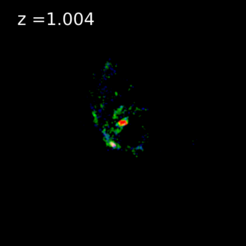
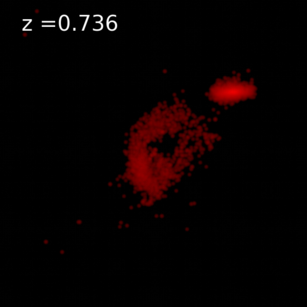
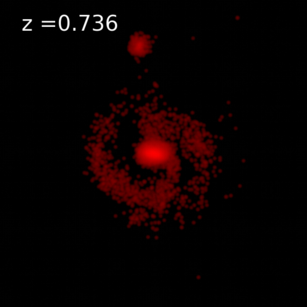
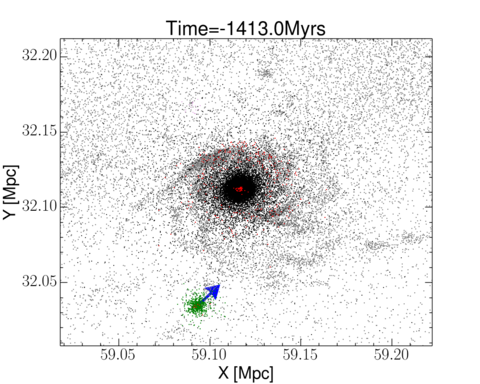
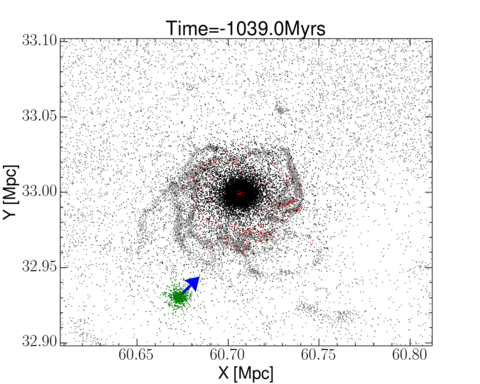
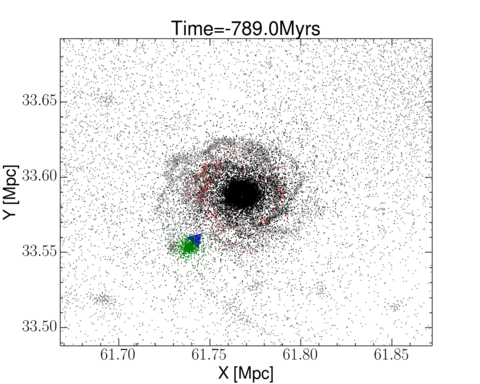
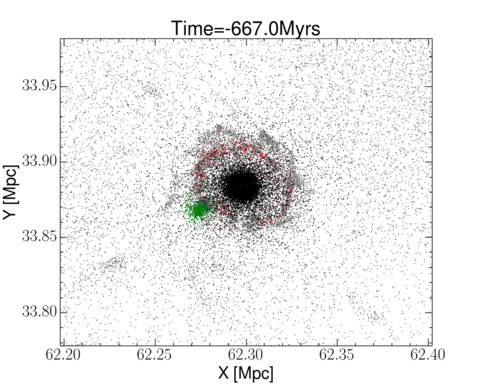
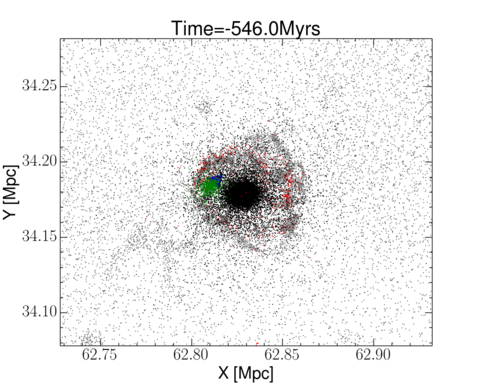
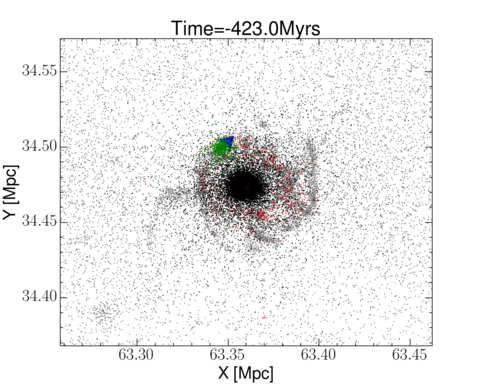
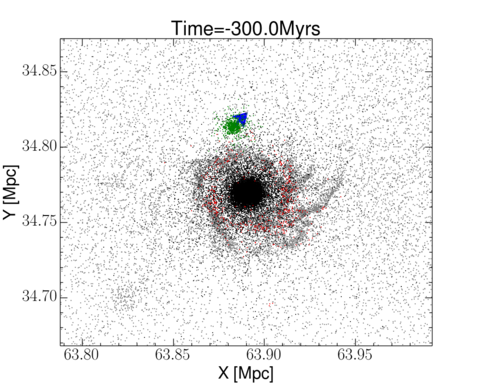
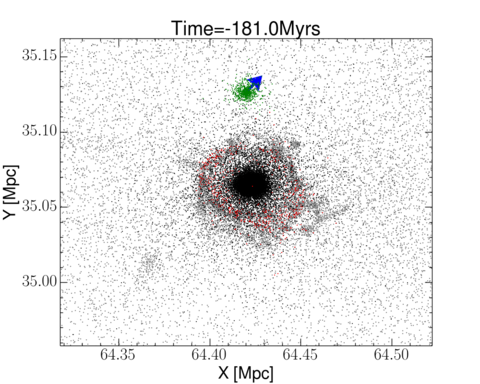
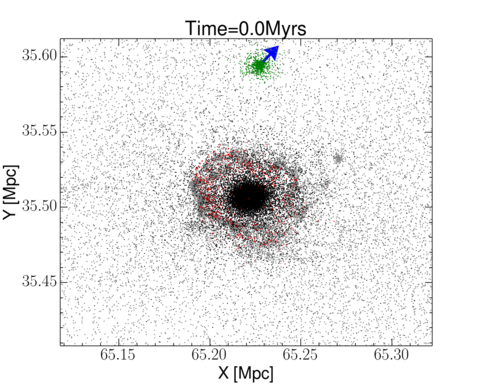
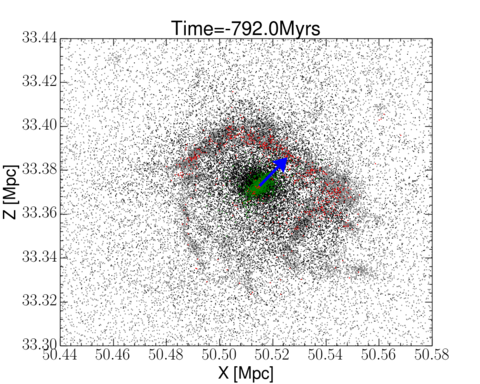
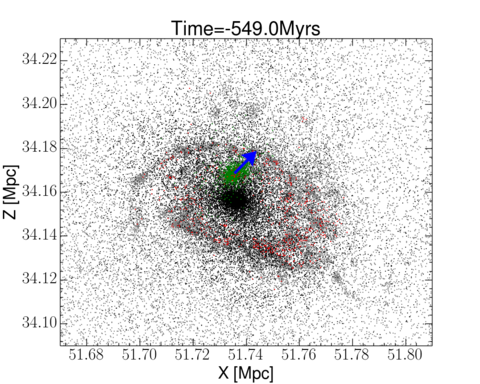
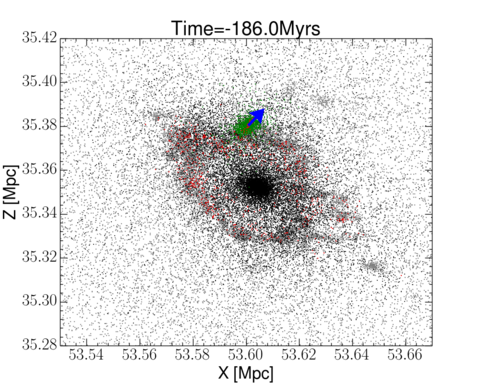
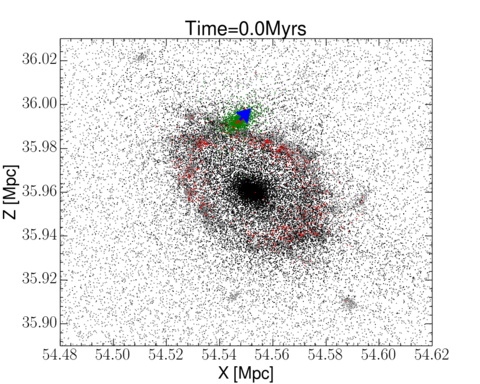
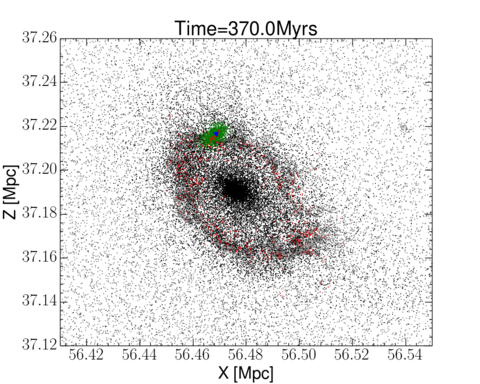
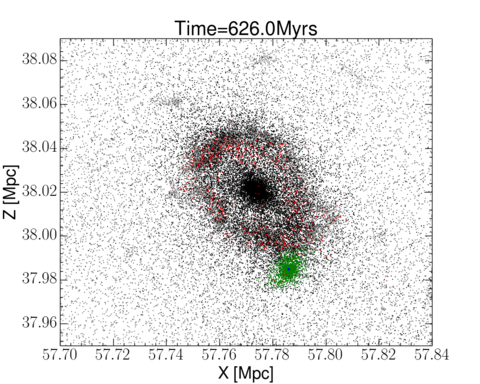
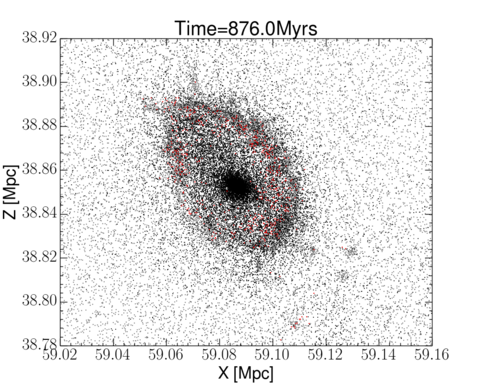
in each scenario. Figure 13 presents the interaction history of a gas-rich, spiral colliding with a dwarf companion galaxy at redshift =.
The ring morphology in this scenario is induced due to a single off-centre collisional encounter with a dwarf companion. As listed in Table 2,
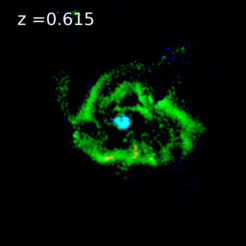
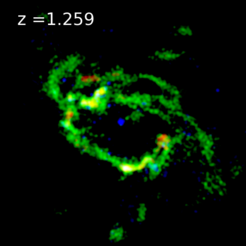
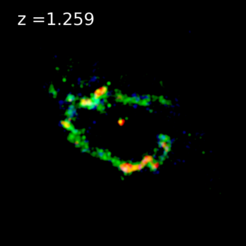
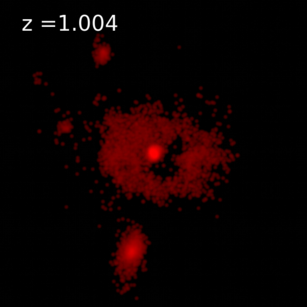
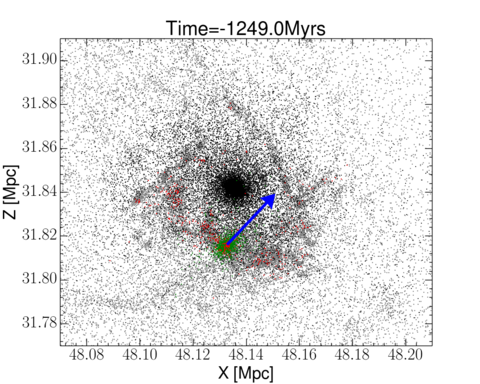
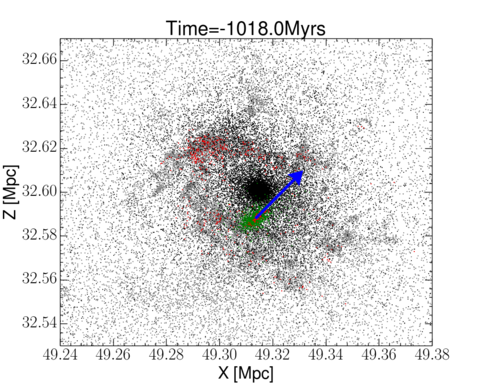
the majority of ring galaxies in EAGLE are formed in this scenario. Figure 14 presents the second formation scenario for
ring galaxies in EAGLE at redshift =. In this case, a gas-rich, bulgeless spiral galaxy collides with a dwarf galaxy multiple
times, i.e., more than one drop through collision. This second scenario is expected since the intruder and the target galaxy are more bound after the first encounter as a result of the dynamical
friction. In EAGLE, this scenario often prompt a full merger after a few hundred megayears from the second encounter.
Multiple encounters can prolong the lifespan of the ring and results in different kinematics for the gas and stars of target galaxy (see Figure 19),
the lifespan of the ring morphology for these scenarios is shown in Figure 17
(discussed in detail below). Figure 15 shows a subsample of the P-type (long-lived) ring galaxies identified in EAGLE at .
The ring morphology in this class is mainly due to the strong bars present in these galaxies.
These systems have ring features that last for Gyr and host strong bars that are evident in the mock images of this figure.
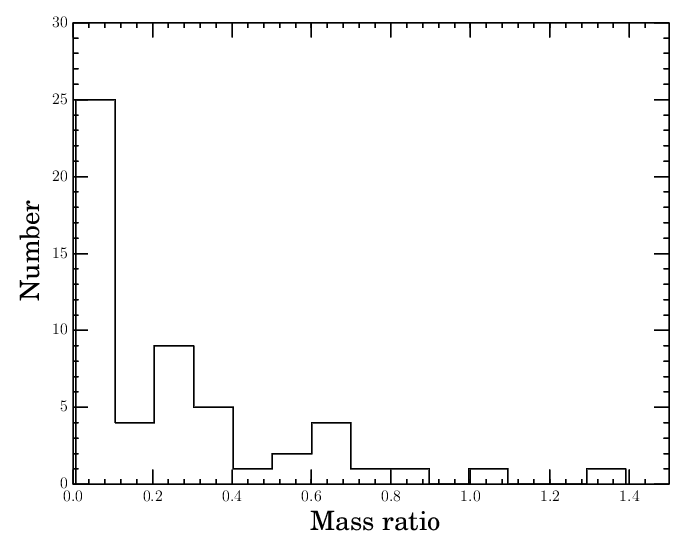
Figure 16 shows the stellar mass ratio between the companion and the ring galaxy (M/M) in the
per cent of our sample of ring galaxies, in which we find a clear connection between the ring morphology and galaxy interactions.
The median stellar mass ratio in this sample equals , which is in agreement with the observational and theoretical studies of these systems.
The stellar mass ratios in most of the observationally studied ring galaxy pairs lie between to
(see for example Higdon &
Wallin, 1997; Higdon, 1995; Wong
et al., 2006; Romano
et al., 2008; Parker et al., 2015; Wong
et al., 2017). Only a handful of ring galaxy pairs
have ratios outside this range. For instance, three known ring galaxies have mass ratios smaller than , namely
IZw45 (ratio), NGC 2793 (ratio) and NGC 922 (ratio), while three others have mass ratios larger
than one in which the companion is twice the size of the ring galaxy, namely, the Arp 141, Arp 147 and Arp 148 (Romano
et al., 2008).
In EAGLE, we identify two ring galaxies that have more massive companions. The interaction in these two cases is not a “bullseye” collision but rather
a collision with large impact parameter, i.e. similar to a flyby interaction.
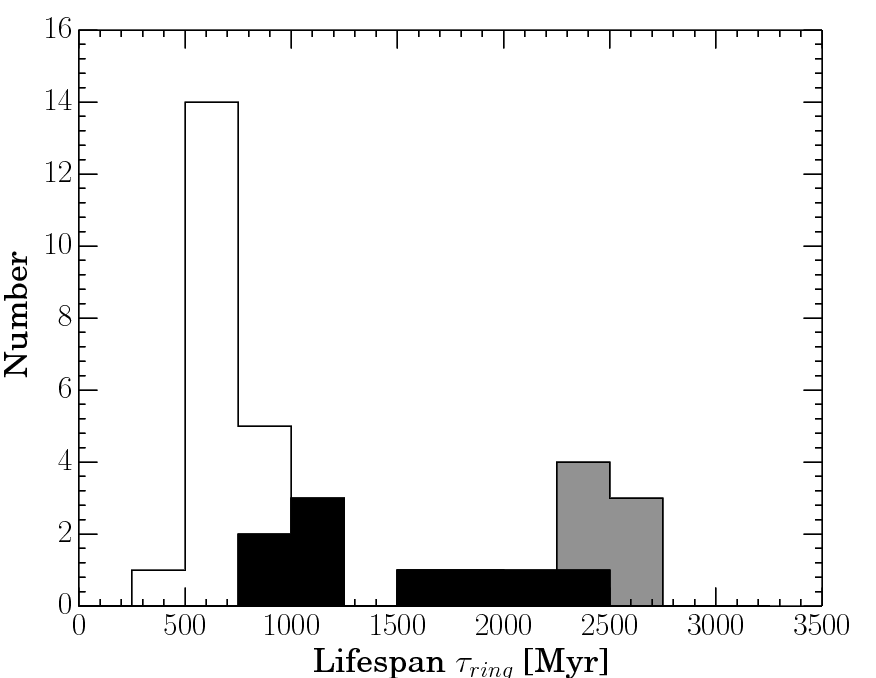
Figure 17 also shows the lifetime of the star-forming ring morphology found in our ring galaxy sample.
The lifetime of the ring is determined from when the collision occurs between the target and companion galaxies in the case of collision induced rings,
i.e., from the time when the companion is closest to the target until the time when the ring structure starts to collapse and hosts less than per
cent of the new stars (Myr) formed in the whole galaxy. The unfilled histogram shows the ring structure lifespan of the ring galaxies
formed with one companion dropping once through its gas disk, while the black filled is for those which have multiple companions () plunging
through more than once (predominantly identified at higher redshifts). For the latter, the lifetime is measured from the first collision.
The grey histogram presents the long-lived ring galaxies found in EAGLE. The median lifespan of the ring morphology in systems formed with one companion dropping once through its disk is
Myr. Multiple interactions, i.e. more than one companion passing through the disk of the main galaxy or the same companion plunging more than once,
significantly prolong the lifespan of the ring feature in the main galaxy.
This value is in broad agreement with the ages of the ring morphology in non-cosmological isolated interaction simulations, which in most
cases range between Myr and Myr (Hernquist &
Weil, 1993; Mihos &
Hernquist, 1994; Horellou &
Combes, 2001; Mapelli et al., 2008b). Figure 18 shows the evolution of the median stellar
mass ratio of the interacting galaxy pairs (blue) and the median lifetime of the ring morphology (red) with redshift.
Here, we only show rings that have an interaction origin and exclude the long-lived barred ring systems.
The numbers in this Figure represent the total number of ring galaxies within each bin. The stellar mass ratio of the interacting pairs are the highest at , and decrease rapidly with
redshift. On the other hand, the lifetime of the ring morphology increases monotonically with redshift until it reaches the maximum at =,
with a median age of Myr, and then decreases at higher redshifts.
The evolution of the mass ratio is expected as galaxies tend to be more gas rich and smaller at higher redshifts, and consequently the life time of the
ring morphology will also evolve. However, the steep drop in the mass ratio can also result from small number statistics.
The next generation of hydrodynamical simulations will offer a chance to revisit this with better statistics, as it will simulate galaxies
in larger volumes, allowing the exploration of redshift trends more robustly.
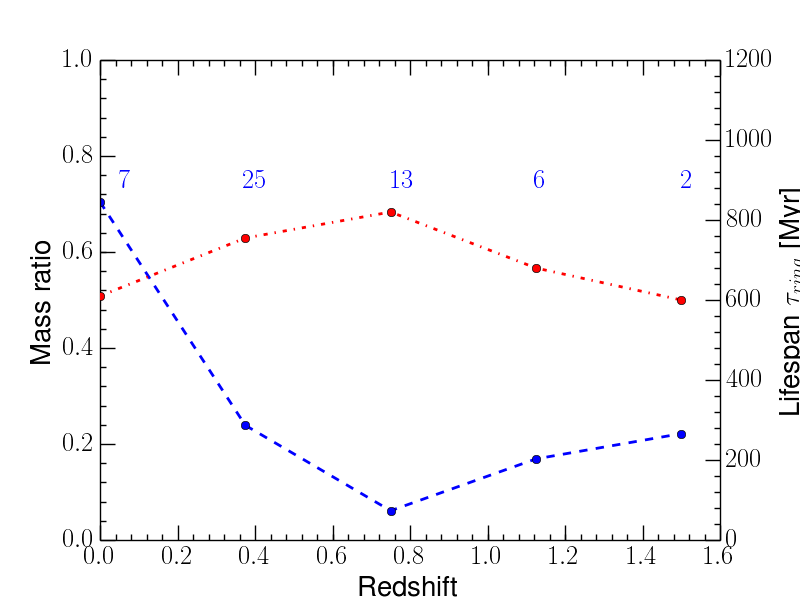
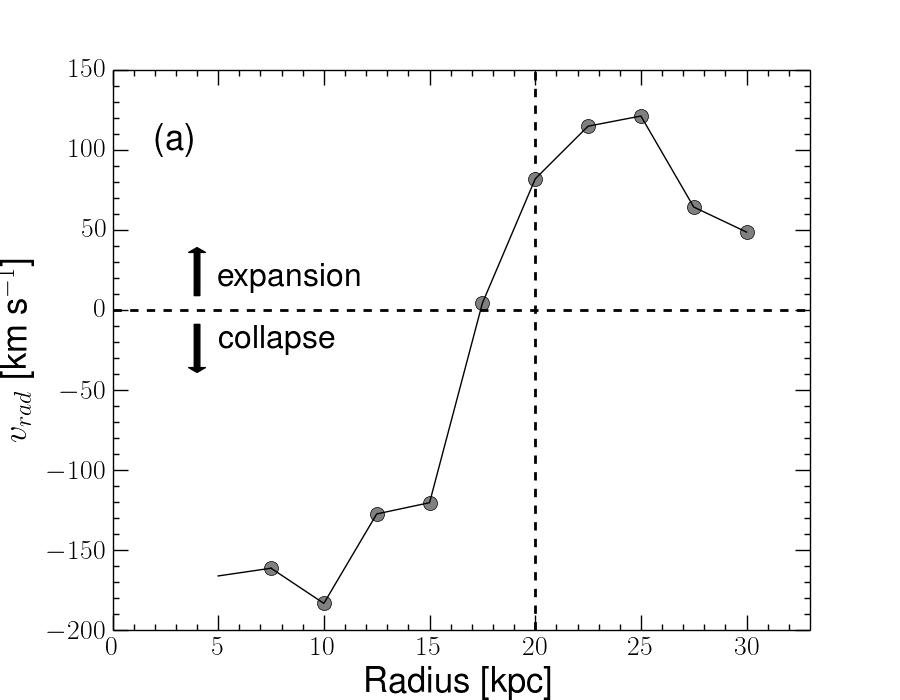
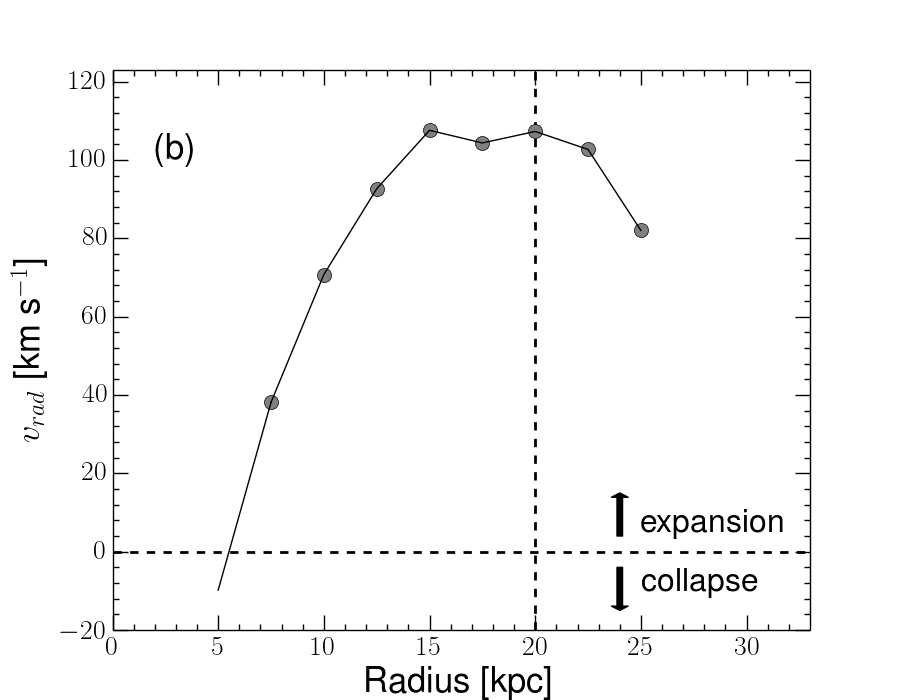
Figure 19 presents the radial velocity of the gas particles with respect to the plane of the disk for two ring galaxies in EAGLE at redshift =. The plane of the disk is determined as that perpendicular to the total stellar spin vector of the galaxy. We only consider the component of the gas particles in the radial direction of the plane of the disk. Thus, the radial velocity is a measure of the expansion velocity of the ring. Figure 19a shows the radial velocity of a ring that formed due to one drop-through interaction with a dwarf satellite and is measured at time Myr after the encounter. The radial velocity of the ring at kpc is positive and indicates expansion, while in the inner regions the velocity is negative which means that the gas is falling back to the centre. For instance, the outer rings have a maximum radial velocity of =km s-1 at a radius of =kpc, whereas at a radius of =kpc the radial velocity equals km s-1. This result is in agreement with the predictions of the analytic caustic theory (Appleton & Struck-Marcell, 1996; Struck-Marcell & Lotan, 1990; Struck, 2010; Mapelli & Mayer, 2012) and the observations of ring galaxies in the local Universe (Conn et al., 2016; Fogarty et al., 2011; Higdon, 1996). Figure 19b shows the radial velocity profile of a long lived ring galaxy formed due to two encounters with a dwarf companion and is measured at time Myr after the second encounter. The radial velocity profile in this case is different than in Figure 19a in that the inward radial velocity (infall) in the inner regions of the ring are much smaller in this case and only particles at radii kpc have negative velocities. Assuming that the second collision is also impulsive, we expect the velocity of the gas particles to undergo a dramatic change, in which the velocity of the second impulse will be added to the gas particles’ current velocity. This means that the particles moving inward (negative infall velocity) will gain momentum which will reduce the net inward negative velocity or even cancel it, while the gas particles moving outward (expanding) will gain more speed and will increase their expansion velocity (refer to Appleton & Struck-Marcell (1996); Struck-Marcell & Lotan (1990) for more detailed analysis on multiple encounters).
6 Discussion and Conclusions
In this paper, we use the EAGLE hydrodynamical simulations to study the formation and characteristics of ring galaxies. EAGLE’s volume, ()3 cMpc3, allows us to identify a relatively large sample of ring galaxies and quantify their formation mechanisms and evolution with redshift. We characterise our ring galaxy sample, putting special emphasis on their star formation rates (SFRs), colours, metallicities, and atomic (HI) hydrogen gas and how these properties scale with each other. We also characterise their environments. Our main findings are summarised as follows:
-
•
The number density evolution of ring galaxies in the EAGLE simulation is in broad agreement with the observations of Lavery et al. (2004); Elmegreen & Elmegreen (2006). This means that the numerical treatment of the ISM, star formation, and feedback model in the EAGLE simulation are adequate enough to reproduce a realistic ring-morphology population. This is an unprecedented success for hydrodynamical simulations especially because the calibration of the subgrid physics in EAGLE does not include galaxy morphology (Crain et al., 2015). This is particularly important as other simulations produce an overabundance of ring galaxies (e.g., the Illustris simulations Snyder et al., 2015).
-
•
Ring galaxies live in massive groups (MM⊙) that are preferentially more concentrated than groups without ring galaxies at fixed halo mass. This is in agreement with the observations, in which ring galaxies are located within galaxy groups and have at least one companion galaxy (Higdon & Wallin, 1997; Higdon, 1995; Romano et al., 2008; Conn et al., 2016; Wong et al., 2017; Elagali et al., 2018).
-
•
In EAGLE, ring galaxies are moderately star-forming galaxies that typically reside in the green valley, but have high HI gas fractions. We find that this is due to ring galaxies having an ISM with much lower gas phase-pressure and metallicity than star-forming galaxies with the same stellar and gas masses. By studying the progenitors of ring galaxies, we find that the drop-through collision with the companion(s) is responsible for diluting the gas metallicity and pressure. The latter happens as the gas flows efficiently towards the outskirts of galaxies to form the ring structure, where the pressure is lower.
-
•
The vast majority of ring galaxies identified in EAGLE (per cent) have an interaction origin, i.e., are formed when a companion galaxy(ies) drop-through a "target" galaxy (sometimes more than one drop-through). The lifespan of the ring morphology in systems formed with one companion dropping once through its disk is Myr, which is is in broad agreement with the ages of the ring morphology in non-cosmological isolated interaction simulations (Hernquist & Weil, 1993; Mihos & Hernquist, 1994; Horellou & Combes, 2001; Mapelli et al., 2008b). Some ring galaxies form through the effect of more than one companion passing through its disk or the same companion passing more than once . In these cases, we find that the lifespan of the ring feature increases significantly, by a factor of . We also study the kinematics of EAGLE collisional ring galaxies and find similar results to those predicted by the analytic caustic theory (see e.g., Appleton & Struck-Marcell, 1996; Struck-Marcell & Lotan, 1990). The remainder galaxies (per cent) have very long-lived ring morphology (Gyr), and correspond to barred galaxies (P-type rings).
One aspect of these systems remains unclear mainly due to the limitation of the current hydrodynamical simulations.
Some recent observations suggest that ring galaxies are H2 deficient even in the ring, where the HI gas surface density is highest, and hypothesise
that in the ring’s confined high density ISM, molecular hydrogen is formed due to the high HI surface density but equally destroyed by the
continuous UV-field from supernovae and OB stars (Higdon et al., 2015; Wong
et al., 2017). To explore the photodissociation effect in the ring’s molecular hydrogen, we need
to consistently follow the formation and destruction of the molecular hydrogen, which requires a detailed description of the cold phase of the ISM.
This is currently not available for large hydrodynamical simulations such as EAGLE, but in smaller box zoom-in simulations is possible
and has been implemented to some extent (Hopkins
et al., 2014, 2017).
Another limitation of our current analysis is the small number statistics. Ring galaxies are rare systems, as a result we typically find less than ten rings in the
entire simulated volume at a given redshift. Thus, any redshift evolution found here is tentative and requires larger volumes, simulated at the same resolution to EAGLE,
to confirm them. Using the next generation of hydrodynamical simulations, we will be able to probe larger volumes
at the same resolution as the current EAGLE simulations, which will improve our statistics and allow us to explore redshift trends more accurately.
With the upcoming large sky surveys and telescope missions, such as the James Webb Space Telescope (JWST; Gardner
et al., 2006; Kalirai, 2018),
the MeerKAT Karoo Array Telescope HI Surveys (Holwerda
et al., 2012), the Australian Square Kilometre Array Pathfinder HI surveys
(Johnston
et al., 2007, 2008), the Multi-Unit Spectroscopic Explorer (MUSE; Bacon
et al., 2010), the K-band Multi-Object Spectrograph
(KMOS; Wisnioski
et al., 2015) surveys, and Atacama Large Millimeter/submillimeter Array (ALMA) future surveys,
we expect to be able to study ring galaxies at higher redshifts and larger volumes due to their deep and large sky coverage. Through these surveys, we will also be able to test
the simulation predictions and probe both the gas-phase pressure and the metallicity in these galaxies. This will further advance our understanding of the ISM as
well as the star formation law in extreme collision cases.
Acknowledgements
We thank the referee, Curt Struck, for his comments which significantly improved the presentation of this manuscript. We also thank Joop Schaye for useful comments on the manuscript, and David Algorry for providing the list of barred galaxies identified in EAGLE and published in Algorry et al. (2017). AE wishes to Acknowledge the funds he received from the International Centre of Radio Astronomy (ICRAR). CL is funded by an Australian Research Council Discovery Early Career Researcher Award (DE150100618) and by the Australian Research Council Centre of Excellence for All Sky Astrophysics in 3 Dimensions (ASTRO 3D), through project number CE170100013. MS is supported by VENI grant 639.041.749. We acknowledge the Virgo Consortium for making their simulation data available. The EAGLE simulations were performed using the DiRAC-2 facility at Durham, managed by the ICC, and the PRACE facility Curie based in France at TGCC, CEA, Bruyeresle-Chatel. This work used the DiRAC Data Centric system at Durham University, operated by the Institute for Computational Cosmology on behalf of the STFC DiRAC HPC Facility (www.dirac.ac.uk). This equipment was funded by BIS National E-infrastructure capital grant ST/K00042X/1, STFC capital grant ST/H008519/1, and STFC DiRAC Operations grant ST/K003267/1 and Durham University. DiRAC is part of the National E-Infrastructure.
References
- Abraham et al. (1996) Abraham R. G., van den Bergh S., Glazebrook K., Ellis R. S., Santiago B. X., Surma P., Griffiths R. E., 1996, ApJS, 107, 1
- Algorry et al. (2017) Algorry D. G., et al., 2017, MNRAS, 469, 1054
- Appleton & Marston (1997) Appleton P. N., Marston A. P., 1997, AJ, 113, 201
- Appleton & Struck-Marcell (1987) Appleton P. N., Struck-Marcell C., 1987, ApJ, 312, 566
- Appleton & Struck-Marcell (1996) Appleton P. N., Struck-Marcell C., 1996, Fundamentals Cosmic Phys., 16, 111
- Athanassoula et al. (1997) Athanassoula E., Puerari I., Bosma A., 1997, MNRAS, 286, 284
- Bacon et al. (2010) Bacon R., et al., 2010, in Ground-based and Airborne Instrumentation for Astronomy III. p. 773508, doi:10.1117/12.856027
- Baes et al. (2003) Baes M., et al., 2003, MNRAS, 343, 1081
- Baes et al. (2011) Baes M., Verstappen J., De Looze I., Fritz J., Saftly W., Vidal Pérez E., Stalevski M., Valcke S., 2011, ApJS, 196, 22
- Bahé et al. (2016) Bahé Y. M., et al., 2016, MNRAS, 456, 1115
- Baillard et al. (2011) Baillard A., et al., 2011, A&A, 532, A74
- Barnes & Hernquist (1996) Barnes J. E., Hernquist L., 1996, ApJ, 471, 115
- Blitz & Rosolowsky (2006) Blitz L., Rosolowsky E., 2006, ApJ, 650, 933
- Bluck et al. (2012) Bluck A. F. L., Conselice C. J., Buitrago F., Grützbauch R., Hoyos C., Mortlock A., Bauer A. E., 2012, ApJ, 747, 34
- Bruzual & Charlot (2003) Bruzual G., Charlot S., 2003, MNRAS, 344, 1000
- Buta (2017) Buta R. J., 2017, MNRAS, 471, 4027
- Camps & Baes (2015) Camps P., Baes M., 2015, Astronomy and Computing, 9, 20
- Camps et al. (2016) Camps P., Trayford J. W., Baes M., Theuns T., Schaller M., Schaye J., 2016, MNRAS, 462, 1057
- Conn et al. (2016) Conn B. C., Fogarty L. M. R., Smith R., Candlish G. N., 2016, ApJ, 819, 165
- Crain et al. (2009) Crain R. A., et al., 2009, MNRAS, 399, 1773
- Crain et al. (2015) Crain R. A., et al., 2015, MNRAS, 450, 1937
- Crain et al. (2017) Crain R. A., et al., 2017, MNRAS, 464, 4204
- Cullen & Dehnen (2010) Cullen L., Dehnen W., 2010, MNRAS, 408, 669
- D’Onghia et al. (2008) D’Onghia E., Mapelli M., Moore B., 2008, MNRAS, 389, 1275
- Dalla Vecchia & Schaye (2012) Dalla Vecchia C., Schaye J., 2012, MNRAS, 426, 140
- Doi et al. (2010) Doi M., et al., 2010, AJ, 139, 1628
- Durier & Dalla Vecchia (2012) Durier F., Dalla Vecchia C., 2012, MNRAS, 419, 465
- Elagali et al. (2018) Elagali A., Wong O. I., Oh S.-H., Staveley-Smith L., Koribalski B. S., Bekki K., Zwaan M., 2018, MNRAS, 476, 5681
- Elmegreen (1989) Elmegreen B. G., 1989, ApJ, 338, 178
- Elmegreen (1993) Elmegreen B. G., 1993, ApJ, 411, 170
- Elmegreen & Elmegreen (2006) Elmegreen D. M., Elmegreen B. G., 2006, ApJ, 651, 676
- Elmegreen & Parravano (1994) Elmegreen B. G., Parravano A., 1994, ApJ, 435, L121
- Fakhouri et al. (2010) Fakhouri O., Ma C.-P., Boylan-Kolchin M., 2010, MNRAS, 406, 2267
- Few & Madore (1986) Few J. M. A., Madore B. F., 1986, MNRAS, 222, 673
- Fiacconi et al. (2012) Fiacconi D., Mapelli M., Ripamonti E., Colpi M., 2012, MNRAS, 425, 2255
- Fogarty et al. (2011) Fogarty L., et al., 2011, MNRAS, 417, 835
- Furlong et al. (2015) Furlong M., et al., 2015, MNRAS, 450, 4486
- Furlong et al. (2017) Furlong M., et al., 2017, MNRAS, 465, 722
- Gardner et al. (2006) Gardner J. P., et al., 2006, Space Sci. Rev., 123, 485
- Gerber et al. (1996) Gerber R. A., Lamb S. A., Balsara D. S., 1996, MNRAS, 278, 345
- Giavalisco et al. (2004) Giavalisco M., et al., 2004, ApJ, 600, L103
- Gnedin & Kravtsov (2011) Gnedin N. Y., Kravtsov A. V., 2011, ApJ, 728, 88
- Groves et al. (2008) Groves B., Dopita M. A., Sutherland R. S., Kewley L. J., Fischera J., Leitherer C., Brandl B., van Breugel W., 2008, ApJS, 176, 438
- Hernquist & Weil (1993) Hernquist L., Weil M. L., 1993, MNRAS, 261, 804
- Herrera-Endoqui et al. (2015) Herrera-Endoqui M., Díaz-García S., Laurikainen E., Salo H., 2015, A&A, 582, A86
- Higdon (1995) Higdon J. L., 1995, ApJ, 455, 524
- Higdon (1996) Higdon J. L., 1996, ApJ, 467, 241
- Higdon & Higdon (2010) Higdon J. L., Higdon S. J. U., 2010, in Smith B., Higdon J., Higdon S., Bastian N., eds, Astronomical Society of the Pacific Conference Series Vol. 423, Galaxy Wars: Stellar Populations and Star Formation in Interacting Galaxies. p. 12 (arXiv:1003.4691)
- Higdon & Wallin (1997) Higdon J. L., Wallin J. F., 1997, ApJ, 474, 686
- Higdon et al. (2012) Higdon J. L., Higdon S. J. U., Rand R. J., 2012, ApJ, 756, 196
- Higdon et al. (2015) Higdon J. L., Higdon S. J. U., Martín Ruiz S., Rand R. J., 2015, ApJ, 814, L1
- Holwerda et al. (2012) Holwerda B. W., Blyth S.-L., Baker A. J., 2012, in Tuffs R. J., Popescu C. C., eds, IAU Symposium Vol. 284, The Spectral Energy Distribution of Galaxies - SED 2011. pp 496–499 (arXiv:1109.5605), doi:10.1017/S1743921312009702
- Hopkins (2013) Hopkins P. F., 2013, MNRAS, 428, 2840
- Hopkins et al. (2014) Hopkins P. F., Kereš D., Oñorbe J., Faucher-Giguère C.-A., Quataert E., Murray N., Bullock J. S., 2014, MNRAS, 445, 581
- Hopkins et al. (2017) Hopkins P. F., et al., 2017, preprint, (arXiv:1702.06148)
- Horellou & Combes (2001) Horellou C., Combes F., 2001, Ap&SS, 276, 1141
- Hubble (1926) Hubble E. P., 1926, ApJ, 64
- Ji et al. (2014) Ji I., Peirani S., Yi S. K., 2014, A&A, 566, A97
- Jiang et al. (2008) Jiang C. Y., Jing Y. P., Faltenbacher A., Lin W. P., Li C., 2008, ApJ, 675, 1095
- Johnston et al. (2007) Johnston S., et al., 2007, Publ. Astron. Soc. Australia, 24, 174
- Johnston et al. (2008) Johnston S., et al., 2008, Experimental Astronomy, 22, 151
- Kalirai (2018) Kalirai J., 2018, Contemporary Physics, 59, 251
- Katsianis et al. (2017) Katsianis A., et al., 2017, MNRAS, 472, 919
- Kennicutt (1998) Kennicutt Jr. R. C., 1998, ApJ, 498, 541
- Lagos et al. (2011) Lagos C. D. P., Baugh C. M., Lacey C. G., Benson A. J., Kim H.-S., Power C., 2011, MNRAS, 418, 1649
- Lagos et al. (2015) Lagos C. d. P., et al., 2015, MNRAS, 452, 3815
- Lagos et al. (2016) Lagos C. d. P., et al., 2016, MNRAS, 459, 2632
- Lagos et al. (2018) Lagos C. d. P., et al., 2018, MNRAS, 473, 4956
- Lavery et al. (2004) Lavery R. J., Remijan A., Charmandaris V., Hayes R. D., Ring A. A., 2004, ApJ, 612, 679
- Leroy et al. (2005) Leroy A., Bolatto A. D., Simon J. D., Blitz L., 2005, ApJ, 625, 763
- Leroy et al. (2008) Leroy A. K., Walter F., Brinks E., Bigiel F., de Blok W. J. G., Madore B., Thornley M. D., 2008, AJ, 136, 2782
- Lynds & Toomre (1976) Lynds R., Toomre A., 1976, ApJ, 209, 382
- Madore et al. (2009) Madore B. F., Nelson E., Petrillo K., 2009, ApJS, 181, 572
- Man et al. (2016) Man A. W. S., Zirm A. W., Toft S., 2016, ApJ, 830, 89
- Mapelli & Mayer (2012) Mapelli M., Mayer L., 2012, MNRAS, 420, 1158
- Mapelli et al. (2008a) Mapelli M., Moore B., Giordano L., Mayer L., Colpi M., Ripamonti E., Callegari S., 2008a, MNRAS, 383, 230
- Mapelli et al. (2008b) Mapelli M., Moore B., Ripamonti E., Mayer L., Colpi M., Giordano L., 2008b, MNRAS, 383, 1223
- Marinacci et al. (2017) Marinacci F., et al., 2017, preprint, (arXiv:1707.03396)
- Mayya et al. (2005) Mayya Y. D., Bizyaev D., Romano R., Garcia-Barreto J. A., Vorobyov E. I., 2005, ApJ, 620, L35
- McAlpine et al. (2016) McAlpine S., et al., 2016, Astronomy and Computing, 15, 72
- Mihos & Hernquist (1994) Mihos J. C., Hernquist L., 1994, ApJ, 437, 611
- Naab et al. (2006) Naab T., Khochfar S., Burkert A., 2006, ApJ, 636, L81
- Naab et al. (2014) Naab T., et al., 2014, MNRAS, 444, 3357
- Naiman et al. (2017) Naiman J. P., et al., 2017, preprint, (arXiv:1707.03401)
- Nair & Abraham (2010) Nair P. B., Abraham R. G., 2010, ApJS, 186, 427
- Nelson et al. (2017) Nelson D., et al., 2017, preprint, (arXiv:1707.03395)
- Parker et al. (2015) Parker Q. A., Zijlstra A. A., Stupar M., Cluver M., Frew D. J., Bendo G., Bojičić I., 2015, MNRAS, 452, 3759
- Pillepich et al. (2017) Pillepich A., et al., 2017, preprint, (arXiv:1707.03406)
- Planck Collaboration et al. (2014) Planck Collaboration et al., 2014, A&A, 571, A16
- Price (2008) Price D. J., 2008, Journal of Computational Physics, 227, 10040
- Qu et al. (2017) Qu Y., et al., 2017, MNRAS, 464, 1659
- Rahmati et al. (2013) Rahmati A., Pawlik A. H., Raičević M., Schaye J., 2013, MNRAS, 430, 2427
- Renaud et al. (2018) Renaud F., et al., 2018, MNRAS, 473, 585
- Rix et al. (2004) Rix H.-W., et al., 2004, ApJS, 152, 163
- Rodriguez-Gomez et al. (2017) Rodriguez-Gomez V., et al., 2017, MNRAS, 467, 3083
- Romano et al. (2008) Romano R., Mayya Y. D., Vorobyov E. I., 2008, AJ, 136, 1259
- Rosas-Guevara et al. (2015) Rosas-Guevara Y. M., et al., 2015, MNRAS, 454, 1038
- Schaller et al. (2015) Schaller M., Dalla Vecchia C., Schaye J., Bower R. G., Theuns T., Crain R. A., Furlong M., McCarthy I. G., 2015, MNRAS, 454, 2277
- Schaye (2004) Schaye J., 2004, ApJ, 609, 667
- Schaye & Dalla Vecchia (2008) Schaye J., Dalla Vecchia C., 2008, MNRAS, 383, 1210
- Schaye et al. (2010) Schaye J., et al., 2010, MNRAS, 402, 1536
- Schaye et al. (2015) Schaye J., et al., 2015, MNRAS, 446, 521
- Smith et al. (2012) Smith R., Lane R. R., Conn B. C., Fellhauer M., 2012, MNRAS, 423, 543
- Snyder et al. (2015) Snyder G. F., et al., 2015, MNRAS, 454, 1886
- Springel (2005) Springel V., 2005, MNRAS, 364, 1105
- Springel et al. (2008) Springel V., et al., 2008, MNRAS, 391, 1685
- Springel et al. (2017) Springel V., et al., 2017, preprint, (arXiv:1707.03397)
- Straatman et al. (2016) Straatman C. M. S., et al., 2016, ApJ, 830, 51
- Struck (2010) Struck C., 2010, MNRAS, 403, 1516
- Struck-Marcell & Lotan (1990) Struck-Marcell C., Lotan P., 1990, ApJ, 358, 99
- Theys & Spiegel (1977) Theys J. C., Spiegel E. A., 1977, ApJ, 212, 616
- Toomre (1977) Toomre A., 1977, in Tinsley B. M., Larson D. Campbell R. B. G., eds, Evolution of Galaxies and Stellar Populations. p. 401
- Trayford et al. (2015) Trayford J. W., et al., 2015, MNRAS, 452, 2879
- Trayford et al. (2016) Trayford J. W., Theuns T., Bower R. G., Crain R. A., Lagos C. d. P., Schaller M., Schaye J., 2016, MNRAS, 460, 3925
- Trayford et al. (2017) Trayford J. W., et al., 2017, MNRAS, 470, 771
- Weinberger et al. (2017) Weinberger R., et al., 2017, MNRAS, 465, 3291
- Wendland (1995) Wendland H., 1995, Advances in Computational Mathematics, 4, 389
- White (1978) White S. D. M., 1978, MNRAS, 184, 185
- Wiersma et al. (2009a) Wiersma R. P. C., Schaye J., Smith B. D., 2009a, MNRAS, 393, 99
- Wiersma et al. (2009b) Wiersma R. P. C., Schaye J., Theuns T., Dalla Vecchia C., Tornatore L., 2009b, MNRAS, 399, 574
- Willett et al. (2013) Willett K. W., et al., 2013, MNRAS, 435, 2835
- Wisnioski et al. (2015) Wisnioski E., et al., 2015, ApJ, 799, 209
- Wong et al. (2006) Wong O. I., et al., 2006, MNRAS, 370, 1607
- Wong et al. (2017) Wong O. I., et al., 2017, MNRAS, 466, 574
- de Vaucouleurs (1959) de Vaucouleurs G., 1959, Handbuch der Physik, 53, 275
Appendix A List of EAGLE ring galaxies
Table 3 lists all the ring galaxies identified in the EAGLE simulations up until redshift =.
| GalaxyID | Snapshot | z | Group N. | Subgroup N. |
| 1419938 | 164 | 1 | ||
| 13176886 | 63 | 2 | ||
| 14042156 | 130 | 1 | ||
| 15358400 | 28 | 0 | 258 | 0 |
| 15511663 | 281 | 0 | ||
| 15978820 | 342 | 0 | ||
| 18010353 | 841 | 0 | ||
| 16736005 | 501 | 0 | ||
| 16750450 | 467 | 0 | ||
| 14042157 | 465 | 0 | ||
| 11525816 | 27 | 0.10 | 15 | 5 |
| 13839082 | 181 | 2 | ||
| 8903544 | 1174 | 0 | ||
| 15476546 | 281 | 0 | ||
| 20755891 | 120 | 0 | ||
| 8930054 | 1232 | 0 | ||
| 9078223 | 994 | 0 | ||
| 13176888 | 26 | 0.18 | 62 | 1 |
| 14681036 | 206 | 0 | ||
| 16832146 | 32 | 1 | ||
| 18010355 | 841 | 0 | ||
| 18010356 | 842 | 0 | ||
| 16347102 | 532 | 0 | ||
| 13825639 | 25 | 0.27 | 164 | 2 |
| 20629170 | 128 | 0 | ||
| 13660663 | 76 | 2 | ||
| 15978824 | 540 | 0 | ||
| 16229689 | 668 | 0 | ||
| 16482632 | 24 | 0.36 | 432 | 0 |
| 16921472 | 630 | 0 | ||
| 17451600 | 519 | 0 | ||
| 17961354 | 557 | 0 | ||
| 14418325 | 473 | 0 | ||
| 15187269 | 845 | 0 | ||
| 16482633 | 23 | 0.50 | 478 | 0 |
| 15511668 | 342 | 0 | ||
| 18026177 | 888 | 0 | ||
| 15978825 | 569 | 0 | ||
| 20259289 | 107 | 0 | ||
| 18078238 | 1133 | 0 | ||
| 15528603 | 22 | 0.61 | 477 | 0 |
| 16521451 | 500 | 0 | ||
| 15528604 | 476 | 0 | ||
| 15289527 | 21 | 0.73 | 403 | 0 |
| 8931586 | 1333 | 0 | ||
| 15528605 | 20 | 0.86 | 531 | 0 |
| 16701972 | 19 | 1.0 | 913 | 0 |
| 14371833 | 19 | 1.0 | 130 | 0 |
| 9135999 | 19 | 1.0 | 1805 | 0 |
| 16701973 | 18 | 1.26 | 965 | 0 |
| 17643587 | 18 | 1.26 | 905 | 0 |
| 17643588 | 17 | 1.48 | 828 | 0 |
| 19899640 | 17 | 1.48 | 352 | 0 |
| 20640573 | 16 | 1.73 | 233 | 0 |
| 20727481 | 14 | 2.23 | 780 | 0 |