A Preliminary Study On the Sustainability of Android Malware Detection
Abstract.
Machine learning-based malware detection dominates current security defense approaches for Android apps. However, due to the evolution of Android platforms and malware, existing such techniques are widely limited by their need for constant retraining that are costly, and reliance on new malware samples that may not be timely available. As a result, new and emerging malware slips through, as seen from the continued surging of malware in the wild. Thus, a more practical detector needs not only to be accurate but, more critically, to be able to sustain its capabilities over time without frequent retraining.
In this paper, we study how Android apps evolve as a population over time, in terms of their behaviors related to accesses to sensitive information and operations. We first perform a longitudinal characterization of 6K benign and malicious apps developed across seven years, with focus on these sensitive accesses in app executions. Our study reveals, during the long evolution, a consistent, clear differentiation between malware and benign apps regarding such accesses, measured by relative statistics of relevant method calls. Following these findings, we developed DroidSpan, a novel classification system based on a new behavioral profile for Android apps. Through an extensive evaluation, we showed that DroidSpan can not only effectively detect malware but sustain high detection accuracy (93% F1 measure) for four years (with 81% F1 for five years). Through a dedicated study, we also showed its resiliency to sophisticated evasion schemes. By comparing to a state-of-the-art malware detector, we demonstrated the largely superior sustainability of our approach at reasonable costs.
1. Introduction
The increasing dominance of Android among mobile computing platforms (Research, 2016) is accompanied by its share of the vast majority (over 90%) of all mobile malware (Mal, 2015). In response to the continued surge of malware in different markets of Android applications (known as apps), there has been a growing body of defense solutions against malware (Tan et al., 2015; Faruki et al., 2015) being proposed. A major defense technique has been app classification based on machine learning (ML), which identifies malware by predicting a given app as benign or malicious (Grace et al., 2012; Burguera et al., 2011; Kolbitsch et al., 2009; Shabtai et al., 2012; Galal et al., 2015).
Typically a ML-based classification approach works by first training a classifier based on a set of features extracted from labeled sample apps, and then applying the trained classifier to unlabeled apps using the same feature set. Thus, the key step of such approaches is the extraction of app features that constitute a behavior profile for apps. Existing approaches have explored various kinds of features, computed through static (Yang et al., 2014; Zhang et al., 2014; Arp et al., 2014; Avdiienko et al., 2015; Suarez-Tangil et al., 2017), dynamic (Afonso et al., 2015; Dash et al., 2016), or hybrid (Saracino et al., 2016; Chen et al., 2016) app analysis. Mostly, the features are based on apps usage of permissions (Saracino et al., 2016; Suarez-Tangil et al., 2017; Chen et al., 2016) and/or APIs (Wu et al., 2012; Yang et al., 2014; Aafer et al., 2013; Arp et al., 2014; Zhang et al., 2014; Avdiienko et al., 2015). However, due to the evolution of attack strategies of Android malware (Tam et al., 2017) classifiers built on these features may not be sustainable—they would need to be retrained constantly for later use, or their performance would downgrade immensely. Retraining a learning model often implies feature computation on new samples, which dominates the total cost of classification. More critically, new samples (malicious ones in particular) may not be always available for retraining the classifier to detect emerging malware.
A most recent technique, MamaDroid (Mariconti et al., 2017) detects malware based on abstracted API calls. It achieved high accuracy (up to 99%) when the training and testing apps were developed in the same period of time, as many previous approaches did. The main advantage of MamaDroid lies in its avoidance of continuous retraining: it can detect malware appeared ( years) after training, and thus attained the state-of-the-art sustainability. Yet, MamaDroid kept reasonably good performance for only one year. Its detection accuracy dropped noticeably over time, to 75% for and below 50% for .
In this paper, we propose a new behavioral profile for Android apps, called sensitive access distribution (SAD), that models their run-time behaviors by capturing quickly-exposed patterns of accesses to sensitive data and operations through short tracing. Given an app, the SAD profile characterizes its execution in terms of the extent and distribution of invocations of sources and sinks, and those of sensitive control flows at method level. Each SAD profile is described by 52 dynamic features, computed only from the trace of all method calls in the app that are exercised during the tracing. Thus, the profile construction does not need static analysis but only straightforward, lightweight bytecode instrumentation. With respect to this dynamic profile, we have performed a longitudinal characterization of 6K benign and malicious apps collected across the past seven years, in order to understand their behavioral evolution. Based on the SAD profile, we also have developed DroidSpan, a novel system for malware detection aiming at superior sustainability over existing approaches.
Our characterization reveals that sensitive accesses are prevalently executed in all apps over all the examined years, with expected lower extent and frequency of use in benign apps than in malware. Also, in terms of the functionalities of these accesses, network information and account settings are the top dominating data and operations accessed, respectively, in both benign and malicious apps (but again with less extent of use in benign apps). From an evolution perspective, benign apps tend to be much more stable than malware in terms of the whole SAD profile. Most notably, despite the fluctuation in both malware and benign and evolution of the Android system itself, there was a clear and consistent separation in this profile between the these two groups over the years.
We have extensively evaluated the performance of DroidSpan against 5K real-world apps, with both cross validation and independent testing (for new/unseen samples). Our evaluation shows that DroidSpan achieves the level of classification accuracy comparable or superior to in contrast to existing systems such as MamaDroid, when testing apps developed in the same time period as the training data. Notably, DroidSpan maintained high accuracy (F-measure of over 93%) after as long as four years, and still kept a reasonable performance (F-measure of 82%) even five years after training. We further demonstrated the resilience of DroidSpan to malware evasion schemes by evaluating it on a benchmark suite of obfuscated apps, on which DroidSpan sustained the same level of classification capabilities. With the same dataset and evaluation settings, MamaDroid sustained over 90% accuracy for one year only while not able to work on any of the obfuscated benchmarks. Notably, our characterization findings essentially explained the sustaining capabilities of our technique.
The main contributions of this work include:
-
•
A longitudinal characterization of run-time sensitive accesses by Android apps spanning seven years, which sheds new light on the evolutionary patterns of application security behaviors in Android.
-
•
A novel malware detection approach DroidSpan based on a new behavioral profile, sensitive access distribution, for Android apps defined by a small feature set, which captures quickly-exposed sensitive access patterns in shortly traced app executions.
-
•
An extensive evaluation of DroidSpan, which shows its comparable classification performance for same-period detection, but greatly superior sustainability and resiliency in contrast to the state-of-the-art malware detection system, at reasonable costs.
-
•
An open-source implementation of DroidSpan and shared experimental datasets (link withheld), which facilitate replication of this work and development of future works on app security.
2. Problem and Motivation
ML-based classification has been a major approach to Android malware detection. This approach also has been successful with high accuracy, yet mostly only for classifying apps developed in the same time period as the training data. The reason is that both the attack strategies of malware and the platforms of Android itself evolve rapidly. As a result, the classifier needs to be constantly retrained with new malware samples (i.e., they are not sustainable). Developing a sustainable malware detector is crucial for Android because otherwise the detector, without retraining, would not be able to identify new malware, which presently continues to emerge and surge. Even if retraining is an option, it is not always practical because getting training samples for emerging malware may not be possible. Meanwhile, the cost of computing features and training typically dominates the total detection cost. Systems like MudFlow (Avdiienko et al., 2015) did not rely on malware samples but suffered from relatively low detection accuracy (86%) and high overheads while their sustainability was not clear. The state-of-the-art malware detector with demonstrated sustainability, MamaDroid (Mariconti et al., 2017), made important advance in this regard, yet it only sustained high accuracy for one year. Our experience showed that retraining MamaDroid is highly expensive in both time and storage.
We thus set out to first understand how Android apps evolve over a long period of time in a longitudinal characterization study. We then leverage the findings from the study to develop a sustainable malware detector. We show how and why our approach works, both technically and empirically.
3. Dynamic SAD Profile
Underlying both our characterization study and DroidSpan is the dynamic SAD profile, a new behavioral model of Android apps that characterizes the run-time accesses to sensitive data (by invoking sources) and operations (by invoking sinks). Next, we describe the defining metrics (i.e., features) of a SAD profile and how the profile is constructed for an app.
3.1. SAD Profile Definition
The SAD profile of an app is defined by 52 features, much simpler than the app profiles used by most existing ML-based app classifiers (which often use tens of thousands of features, e.g., 150K in the best-performing mode of MamaDroid). The central focus of all these features is on the distribution of source/sink invocations, albeit they fall in three classes each addressing a different perspective: (1) the overall extent of sensitive access in terms of total source/sink invocations, (2) the categorization of invoked sensitive accesses in terms of the categories of data retrieved by the calls to sources, and the categories of operations performed by the calls to sinks, and (3) the method-level control flows that potentially carry out execution paths reaching to sink calls from source calls.
| Features | Description (percentage of) |
|---|---|
| Extent of sensitive accesses | |
| Total source/sink callsites (2) | callsites targeting sources (resp. sinks) over all callsites. |
| Total source/sink call instances (2) | instances of calls to sources (resp. sinks) over all call instances. |
| Categorization of sensitive data and operations accessed | |
| Sensitive callsite distribution (11) | callsites targeting sources (resp. sinks) that are in each category (out of 5, resp. 6) over all source (resp. sink) callsites. |
| Distribution of sensitive call instances (11) | instances of calls to sources (resp. sinks) that are in each category (out of 5, resp. 6) over all source (resp. sink) call instances. |
| Sensitive (potentially vulnerable) method-level control flows | |
| Vulnerable source/sink callsites (2) | callsites targeting vulnerable sources (resp. vulnerable sinks) over source (resp. sink) callsites. |
| Vulnerable source/sink call instances (2) | instances of calls to vulnerable sources (resp. vulnerable sinks) over all source (resp. sink) call instances. |
| Vulnerable callsite distribution (11) | callsites targeting vulnerable sources (resp. vulnerable sinks) that are in each category (out of 5, resp. 6) over all vulnerable source (resp. sink) callsites. |
| Distribution of vulnerable call instances (11) | instances of calls to vulnerable sources (resp. vulnerable sinks) that are in each category (out of 5, resp. 6) over all source (resp. sink) call instances. |
Table 1 gives a summary definition of the features that constitute a SAD profile, with the sizes (in parentheses) of each feature subset. All features are consistently percentages of calls in one group over those in total. We use these relative statistics instead of sheer numbers in order to capture the general patterns of app behaviors in sensitive accesses. We examine each app trace in two complementary views: callsite view concerning unique callsites regardless of the times a callsite is invoked, and instance view counting all call instances. For each feature in the callsite view, there is a dual feature in the instance view.
An app may invoke sources and sinks for legitimate purposes. Thus, source/sink invocations can only be regarded as sensitive but not necessarily vulnerable. We consider a source vulnerable if it reaches at least one sink callsite, and a sink vulnerable if there is at least one invoked source that reaches the sink, both through method-level control flows (i.e., dynamic call sequences). While a conservative (imprecise) approximation, the reachability based on control flows at method level is cheaper to compute and potentially more resilient to malware evasions (Maiorca et al., 2015), compared to tracking sensitive data flows (Avdiienko et al., 2015). This is also supported by our evaluation results with obfuscated benchmarks. Note that we do not count the numbers of sensitive flows (nor compute all of them) but only use the reachability in the SAD profile.
We categorize sensitive data accesses with respect to five categories of information sources mostly retrieve (i.e., Account, Calendar, Location, Network info, and System configurations). We also categorize sensitive operations with respect to six categories of operations sinks mostly perform (i.e., Account setting, File operation, Logging, Network access, Messaging, and System setting). We chose these categorizes because they were the predominant ones according to our previous empirical study in this regard (Cai and Ryder, 2016, 2017b).
3.2. SAD Profile Construction
Constructing the SAD profile for an app is reduced to extracting the 52 features from the app. We use our Android app characterization toolkit (Cai and Ryder, 2017a, c) based on Soot (Lam et al., 2011) for the extraction. First, the app is instrumented for tracing. To overcome the vulnerability of static analysis to code obfuscation, we probe for invocation of all methods in the APK bytecode, including those in exception-handling constructs (e.g., catch and finally blocks) and those invoked via reflection. Next, the instrumented app is exercised with automatically generated test inputs for minutes. Lastly, all the features are computed from the collected trace. To identify the calls to sources and sinks from the trace, we use the source/sink lists generated by SUSI (Rasthofer et al., 2014) and our manual categorization that refines the original one (Cai and Ryder, 2017b, c).A dynamic call graph with call-frequency annotations is built to facilitate computing the features, especially those based on the statistics about vulnerable sources and sinks. Note that since we use very large and conservative lists of predefined (18K) sources and (7.2K) sinks, we consider accesses in apps sensitive very conservatively (which is reasonable for detecting malware).
4. Datasets & Characterization
| Category | Name | Year(s) | #A.S. | #C.S. | #E.S. |
| Benign apps | oldBen | 2010-2014 | 1,221 | 1,111 | 1063 |
| newBen | 2017 | 2,210 | 2,048 | 1612 | |
| total | 2010-2017 | 3,431 | 3,159 | 2,675 | |
| Malware | oldMal | 2010-2012 | 2,000 | 1,833 | 1591 |
| Mal13 | 2013 | 415 | 399 | 335 | |
| Mal14 | 2014 | 160 | 142 | 135 | |
| Mal15 | 2015 | 119 | 115 | 115 | |
| Mal16 | 2016 | 203 | 184 | 146 | |
| Mal17 | 2017 | 104 | 102 | 101 | |
| total | 2010-2017 | 3,001 | 2,775 | 2,423 | |
| All apps | total | 2010-2017 | 6,432 | 5,934 | 5,098 |
To understand how the sensitive accesses in Android apps evolve, we collected real-world app samples from early 2010 to mid 2017, and characterized them in terms of their SAD profiles. We first introduce the characterization datasets and then highlight the major findings from the study.
4.1. Datasets
Table 2 gives an overview of our study datasets, including numbers of all samples downloaded (#A.S.), samples characterized (#C.S.), and samples used in the evaluation of our technique (#E.S.).
The first set of 1,221 benign apps (oldBen) was collected by downloading the top 50 popular apps in each app category on Google Play in late 2014. The new benign data set (newBen) was obtained by downloading the top 100 popular apps in each of the app categories on Google Play by May, 2017. The oldMal malware set was obtained by randomly selecting 2,000 apps from the Drebin dataset (Arp et al., 2014). The Mal17 set consists of 104 new malware in the wild we manually collected from various sources. The malware sets for 2013 through 2016 consists of all apps from respective years in the AndroZoo dataset (Allix et al., 2016) that were identified as malware by AV tools (out of 63) of VirusTotal (virustotal.com, 2017) as recorded there.
Our entire datasets include 3,431 benign and 3,001 malicious samples, for a total of 6,432 benchmarks. Constructing the SAD profile for some of these benchmarks were not successful. Most of those failing cases were due to missing assets in APKs and thus cannot be executed for tracing. Among others, some either have corrupted APKs (which cannot be unpacked for analysis) or cannot be instrumented due to the inability of Soot to process their bytecode; the rest cannot be installed or did not produce a a useful trace (i.e., having non-zero line coverage). The #C.S. column of Table 2 lists the numbers of samples in each dataset for which we were able to obtain a meaningful SAD profile (we used one profile per benchmark app). These apps (valid samples), a total of 5,934, were used in our characterization study. We elaborate on the numbers of the last column in Section 6.1.
4.2. Experimental Settings
We produced the SAD profile of each valid sample by running the instrumented app on an Android emulator (Nexus One), with SDK 6.0 (API 23), 2G RAM, and 1G SD storage. The emulator ran on an Ubuntu (15.04) desktop of 16G memory and 8-core 2.6GHz CPU. Each app was exercised for ten minutes by the random inputs generated by Monkey (Google, 2017). We used Monkey because it achieves an average code coverage at least comparable to other existing alternatives (research prototypes) while with the best usability and reliability. We chose instead of a longer time in consideration of the time expense of the study given the large number of apps, and the previous finding that Monkey attained its highest coverage in ten minutes in an average case (Choudhary et al., 2015). To minimize bias, we run each app in a fresh emulator setting (by restarting a clean emulator for each app).
The total trace size of all valid sample SAD profiles is about 128GB. Collecting the traces took over an effective time of three months. The line coverage of the per-sample traces ranged from 1.8% to 97.1%, for a mean of 48.2%, standard deviation of 22.1%, and median of 50.1%. With our toolkit, a real Android device can be easily plugged in to produce traces for DroidSpan as well. We used an emulator in order to test the robustness of our dynamic detection approach to malware evasion techniques targeting dynamic analysis (e.g., hiding malicious behaviors when they detected being run on an emulator) (Rasthofer et al., 2017).
4.3. Evolutionary Characteristics
We present the most important results of our characterization, based on the SAD profiles of 5,934 apps (3,159 benign and 2,775 malicious) over the past seven years. To understand the evolutionary patterns of sensitive accesses of Android apps, we computed the summary statistics for each of the 8 datasets separately and compare among them.
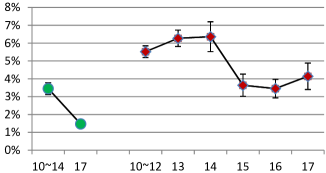
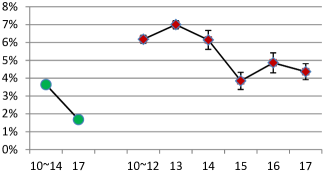
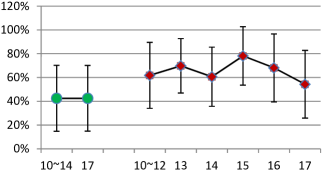
4.3.1. Evolution in Use Extent
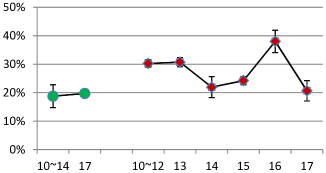
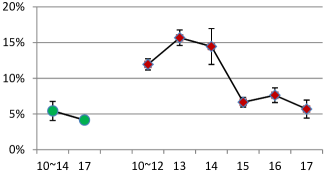
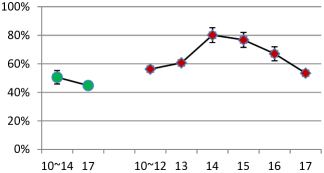
Figure 1 shows the patterns regarding the extent of those accesses in terms of source and sink calls in both the callsite and instance views. In each chart, we show the average-case SAD profiles for benign versus malicious apps, separately, with respect to all the characterization datasets. Since we are interested in comparing the means, we computed the 0.95 confidence interval for each mean to estimate how these sample means approximate those of the respective populations. Data points underlying these means are values of corresponding features (see Table 2).
 |
 |
| (a) Source callsite | (b) Sink callsite |
 |
 |
| (c) Source call instance | (d) Sink call instance |
 |
 |
| (e) Vulnerable source callsite | (f) Vulnerable sink callsite |
 |
 |
| (g) Vulnerable source call instance | (h) Vulnerable sink call instance |
The first four charts indicate that the sensitive accesses were substantial (given our conservative definition of such accesses) in all the benchmarks studied, in either views. Among all method invocations, calls to sources were even more extensive than calls to sinks (20-80% versus 5-40%), partly because the predefined list of sources is much larger than the list of sinks we referred to. Partly due to the same reason, as the next four charts show, percentages of sources that can reach sinks (i.e., vulnerable sources) were much lesser compared to vulnerable sinks (1-7% versus 10-20%): the dominators for the former were much larger. As expected, benign apps had generally less extensive accesses to sensitive information and operations than malware, both in terms of the diversity of source/sink APIs invoked (i.e., the callsite view) and the frequency of those API calls (i.e., the instance view). In contrast to these numbers themselves, however, the more important is the evolutionary trends revealed by the comparison of these numbers over the years, which we discuss below.
Evolution of benign apps. While we only studied two benign datasets, they were at least 3 years apart. Figure 1 shows that over this period of time, sensitive accesses in benign apps tend to drop, but only slightly (by less than 5%) in terms of callsites and call instances targeting sinks and call instances targeting sources. An exception was the trend in terms of source callsites (chart (a)): benign apps of 2017 had tiny increase in this feature compared to three years ago. Thus, it appeared that benign apps were making a little more diverse source API calls, but less frequently overall ((c)).
Evolution of malware. Malware experienced ups and downs in sensitive accesses with respect to any of the 8 metrics depicted in Figure 1. Interestingly, over the years, malicious apps tend to increase in the extent of these accesses at some point but then drop, eventually lower than the early time. Consider vulnerable sink call instances (chart (h)) for example, from 2010 through 2014, the extent grew continuously (from 12 to 18%) and then kept decreasing afterwards (by 11%). Despite the different scales ( axis), the gaps between 2010 and 2017 revealed that the malware reduced significantly in the diversity of sensitive APIs invoked, but relatively lesser in the frequency of such calls. An implication of this observation is that malware tended to concentrate on a smaller set of APIs for sensitive access.
Benign versus malware. Most importantly, regardless of the fluctuations seen by both malware and benign apps, the differences in the extent of sensitive accesses between the two groups were very consistent: a visual horizontal dividing line between them could be drawn in any of the charts of Figure 1. In other words, while both have changed within the group, the patterns of the differences appeared to be quite stable, suggesting the 8 metrics to be able to consistently differentiate malware from benign apps.
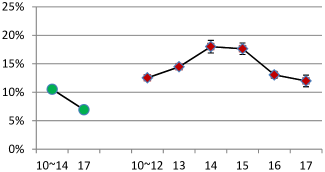
4.3.2. Evolution in Dominating Categories
 |
 |
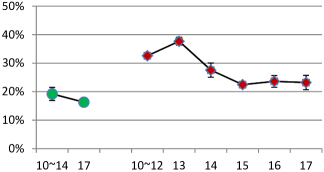
Most of the features in our SAD profile concern the categories of source/sink APIs associated with the sensitive accesses. Our results clearly indicate that in both malware and benign apps, among all sources exercised, the dominating ones were those retrieving network information, while calls to sinks related to account settings dominated all sink calls. This observation was consistent regardless of the views and whether the sources/sinks were vulnerable or not.
Figure 2, in the format as Figure 1, depicts the evolutionary trends concerning these two dominating categories of sensitive access, in terms of all call instances to sources (left) and sinks (right). Compared to the use extent, the means had wider confidence intervals, meaning that these numbers were more approximate and there were larger variations among individual apps within each dataset. Nevertheless, the average-case metrics still clearly reveal consistent patterns as seen above. Sensitive accesses in benign apps exhibited an almost unchanged focus on the two top categories. In contrast, malware again saw more variations over the years, experiencing ups and downs like in the overall use extent. However, the fluctuations were much smaller in general. Finally and most importantly, the clear division between the benign apps and malware was quite consistent over years (albeit the gaps were larger at some points than at others). We have observed similar patterns in benign apps and malware separately, and in the consistent differentiation between the two groups, in other source/sink categories as well.
5. The DroidSpan System
This section presents DroidSpan, our novel Android app classification approach using supervised learning based on the defining features of the SAD profile.
Overview of approach. DroidSpan is a dynamic malware detection system based on the SAD profile. Like existing ML-based app classification systems, DroidSpan works in two major phases: training and testing. In the training phase, it relies on a set of labeled app samples to build a prediction model. Then in the testing phase, the trained model is applied to classify novel apps. Our main goal with and motivation for DroidSpan, however, is that this model can be used effectively (i.e., with high classification performance) some time after it is trained, so that emerging malware can be discovered by the system without being retrained on samples for the new malware. Intuitively, the longer the time span the better, and more sustainable the system.
To make the prediction model sustainable, the key is that the underlying features can, for a relatively long period of time, distinguish benign apps from malware To that end, DroidSpan uses the features that define the SAD profile of an Android app (Table 1). Our longitudinal characterization (Section 4.3) shows that, with the evolution of malware attack strategies and the Android system, benign apps and malware developed in different years tends to exhibit generally similar behaviors in terms of their SAD profile. Moreover, the discrimination between both groups appeared to be clearly consistent. These findings provide an essential grounding for DroidSpan to achieve sustainable classification over years.
Feature extraction. Extracting the SAD features is needed both for obtaining the sample set for training DroidSpan and for later predicting the label of a novel app using DroidSpan. We compute the features of all training and testing apps as described in Section 3.
Classification. To find the best ML model for DroidSpan, we have performed a comparative study of DroidSpan variants using most of the supervised classification models provided by the Scikit-learn library (Pedregosa et al., 2011). These models include: random forest (RF), support vector machines (SVM) with both linear and radial basis function kernels, decision trees/C4.5 (DT), -nearest neighbours (NN), naive Bayes (NB) with three possible probability models (Gaussian, Multinomial Bernoulli), AdaBoost, Gradient Tree Boosting, Extra Trees, and the Bagging classifier. By comparing these variants of DroidSpan with respect to classification performance (precision, recall, and F1-measure), we found that RF consistently achieved the best performance on any of our datasets. Thus, we chose RF as the learning algorithm for DroidSpan. DroidSpan is first trained on benign apps labeled as BENIGN and malicious apps all labeled as MALICIOUS, and then classifies a novel app as either of the two labels.
6. Evaluation
We assessed DroidSpan in terms of classification performance and efficiency, versus MamaDroid. We chose MamaDroid as the baseline approach because it is a state-of-the-art ML-based malware detection system and shares a similar goal to ours (i.e., sustainable detection). Also, both systems use features based on API calls in an app, albeit MamaDroid extracts features with static analysis, using FlowDroid (Arzt et al., 2014) to build call graphs while DroidSpan is based on pure dynamic analysis.
Our evaluation consists of two main separate studies. In Study I, we assess the performance of DroidSpan with training and testing apps developed in a same period of time (referred to as same-period detection). In Study II, we focus on evaluating the sustainability of DroidSpan by assessing its performance when it is trained on older datasets and tests newer ones, spanning one to five years (referred to as detection over time). We performed an additional study, Study III, to assess the resiliency of DroidSpan to sophisticated obfuscation schemes adopted in modern Android apps (malware in particular).
6.1. Used Benchmarks
We started with the same valid samples as described in (the #C.S. column of) Table 2. MamaDroid failed to analyze some samples due to the limitation of its underlying analysis by FlowDroid (as the authors discussed (Mariconti et al., 2017)). For a fair comparison, we removed those samples to make sure the comparison is based on exactly the same datasets. The #E.S. column of Table 2 lists the remaining samples in each dataset that were eventually used in our evaluation studies.
Assessing the performance of both techniques needs mixed datasets each consisting of both malware and benign apps. Thus, we used several combinations of characterization datasets for our evaluation. Specifically, for Study I, we combined the oldBen set with relatively older malware sets (oldMal, Mal13, and Mal14), and newBen set with relatively newer malware sets (Mal15, Mal16, and Mal17). Thus, we had six mixed datasets each covering a different malware set. In addition, we consider all the available benchmarks constituting an all-data set.
For Study II, we used the combinations of malware and benign datsets such that we take the oldest malware set (oldMal) for training to test each of the newer malware sets. In this way, we can test the sustainability of the two techniques for the longest possible time span with respect to our datasets. We used the two benign sets, separately for two repetitions of this study.
We used an additional dataset, named MalObf, for Study III. This dataset was obtained from the Contagio subset in the Praguard obfuscation benchmark suite (Maiorca et al., 2015). It initially includes 237 malicious apps that each adopted three obfuscation schemes together: encryption, renaming, and reflection. For 17 of these apps, DroidSpan failed to produce valid SAD profiles. Thus, MalObf consists of 220 samples used in Study III.
6.2. Methodology
In our evaluation, we gauged the performance of DroidSpan versus the baseline in terms of three metrics: precision, recall, and F1-measure (accuracy), as defined below.
Give an app under classification, is a true positive (TP) if the true label is (i.e., BENIGN or MALICIOUS) and the predicted class label is ; it is a false positive (FP) if the true label is not and the predicted label is ; it is a true negative (TN) if the true label is not but the predicted label is not , it is a false negative (FN) if the true label is and the predicated label is not . Accordingly, regardless of the number of classes (different labels) in the model: Precision () = , Recall () = , and F1 = . For evaluating malware detection, these metrics are computed concerning =MALICIOUS only.
In Study I, for each of totally seven evaluation datasets, we compute results from a 10-fold CV to facilitate comparison with the baseline (which was partially evaluated so originally). We further performed an independent testing using the biggest dataset (all-data). Specifically, we randomly selected 30% samples from each class (malware or benign) in this dataset and reserved them as unseen/novel samples. By doing so, we intend to test the capability of both techniques in classifying new apps (albeit from the same time period as the training set) and to complement the CV results.
For Study II, we used each of the mixed evaluation datasets considered for this study, as either training or testing data. Since there were no intersections between each pair of these training and testing datasets, this study essentially performs independent testings.
In Study III, we used the entire MalObf set for testing and the oldBen+oldMal set for training. These two datasets do not have any common apps. Thus, this study also performs an independent testing.
Both techniques used the same RF algorithm. For DroidSpan, we used 100 estimators and left other parameters as default in Scikit-learn. For MamaDroid, we used the parameters as described in (Mariconti et al., 2017). MamaDroid was developed to work in two modes. For ease of comparison, we simply report the best results of any mode in our evaluation results for MamaDroid. We used the same experimental settings for all evaluation studies as for the characterization (Section 4.2).
6.3. Study I: Same-Period Detection
In this study, we aimed to gauge the performance for classifying apps developed in the same period of time as were the training samples. As mentioned earlier, we used both 10-fold CV and independent testing for this evaluation.
| Dataset | DroidSpan (our work) | MamaDroid (Mariconti et al., 2017) | ||||
|---|---|---|---|---|---|---|
| P | R | F1 | P | R | F1 | |
| all-data | 0.937 | 0.937 | 0.937 | 0.945 | 0.942 | 0.943 |
| oldBen+oldMal | 0.948 | 0.948 | 0.946 | 0.960 | 0.960 | 0.958 |
| oldBen+Mal13 | 0.948 | 0.948 | 0.946 | 0.926 | 0.926 | 0.923 |
| oldBen+Mal14 | 0.939 | 0.933 | 0.929 | 0.935 | 0.931 | 0.923 |
| newBen+Mal15 | 0.981 | 0.981 | 0.980 | 0.982 | 0.981 | 0.980 |
| newBen+Mal16 | 0.986 | 0.986 | 0.985 | 0.970 | 0.972 | 0.970 |
| newBen+Mal17 | 0.977 | 0.980 | 0.974 | 0.971 | 0.972 | 0.968 |
| Overall average | 0.959 | 0.959 | 0.956 | 0.956 | 0.955 | 0.952 |
Cross validation. Table 3 lists the validation results of our approach versus the baseline, in terms of the three classification performance metrics described earlier: precision (P), recall (P), and F1 measure (F1). Each row of the table shows these metrics for both techniques obtained from one of the seven datasets (first column), except for that the last row shows the simple averages of the numbers in the same column. To facilitate comparison, on any dataset, the higher metrics are marked in bold face. Note that each number was the average of numbers of the same metric across the ten passes of the 10-fold CV, and the F1 measures were the averages of per-pass F1 instead of being computed from the averaged precisions and recalls.
Overall, the numbers between the two compared approaches are very close for any specific dataset and individual metrics. In general, both techniques performed well for same-period detection, achieving 93 99% F1 accuracy. Either technique had better performance at some datasets than the other. By overall average, DroidSpan had slightly higher performance than the baseline. However, the differences were quite small, especially in terms of the F1 measure. In sum, the cross validation suggests that both techniques have no significant difference in classification performance.
Independent testing. As a known limitation, cross validation may suffer from biases in its results due to possible overfitting. To complement with an independent testing, we used 70% of benchmarks in the all-data set to train both techniques, and then tested against them with the other samples in this set. Our results show again similar results between the two techniques compared, with DroidSpan obtaining a 95.6% F1 accuracy versus the baseline number of 94.7% by MamaDroid. Thus, the independent testing confirmed that both techniques performed almost equally well (without significant difference).
In all, through two evaluation strategies, we note that DroidSpan can obtain high-accuracy for same-period detection, comparable to a state-of-the-art approach MamaDroid. It is also worth mentioning that, despite the different datasets used, the same-period detection performance results we obtained in this study were almost the same to what were reported in the original evaluation of MamaDroid (Mariconti et al., 2017) (93-99% versus 92-98% of F1), with respect to the same validation method (i.e., 10-fold CV).
| Training dataset | Techniques | Testing dataset | ||||||||||||||
| oldBen+Mal13 | oldBen+Mal14 | oldBen+Mal15 | oldBen+Mal16 | oldBen+Mal17 | ||||||||||||
| P | R | F1 | P | R | F1 | P | R | F1 | P | R | F1 | P | R | F1 | ||
| oldBen+ oldMal | DroidSpan | 0.999 | 0.979 | 0.989 | 0.999 | 0.881 | 0.937 | 0.999 | 0.875 | 0.933 | 0.999 | 0.870 | 0.930 | 0.999 | 0.709 | 0.830 |
| MamaDroid | 0.942 | 0.935 | 0.935 | 0.886 | 0.877 | 0.880 | 0.626 | 0.780 | 0.694 | 0.606 | 0.833 | 0.702 | 0.469 | 0.266 | 0.340 | |
| newBen+Mal13 | newBen+Mal14 | newBen+Mal15 | newBen+Mal16 | newBen+Mal17 | ||||||||||||
| newBen+ oldMal | DroidSpan | 0.997 | 0.973 | 0.985 | 0.991 | 0.837 | 0.908 | 0.984 | 0.750 | 0.857 | 0.978 | 0.800 | 0.880 | 0.971 | 0.698 | 0.812 |
| MamaDroid | 0.863 | 0.999 | 0.927 | 0.667 | 0.846 | 0.746 | 0.564 | 0.780 | 0.655 | 0.545 | 0.885 | 0.675 | 0.473 | 0.261 | 0.337 | |
6.4. Study II: detection over time
Recall that the main objective of our technique is that it can sustain its detection capabilities (in terms of performance numbers) over time. Thus, this study aims at testing DroidSpan against this objective by training it with old malware set and testing malicious apps developed in the following one to five years. We intended to see whether how using older versus newer benign samples in the training would affect the performance of sustainable malware detectors. Thus, we used both the old and new benign sets during the training, separately. Next, we examine the classification performance in this setting by looking at the numbers, and the sustainability, by focusing on the change trend in the performance over years.
Classification performance. Table 4 shows the detailed results on the classification performance of DroidSpan against the baseline approach. Given each of the five relatively newer malware sets (from 2013 through 2017) used for testing and each of the two benign datasets used for training (along with the old malware set consistently), we had ten rounds of independent testing. In the table, the three metrics, precision (P), recall R, and F1 accuracy (F1) are listed for each round, and each of the two techniques compared. For example, when trained on OldBen+oldMal and tested on oldBen+Mal16, the precision, recall, and F1 of MamaDroid were 46.9%, 26.6%, and 34%, respectively. For each round, the better performance numbers (between our work and the baseline) in any metric were highlighted by bold face.
The upper half of the table shows the results when using the old benign set for training. Both DroidSpan and MamaDroid exhibited great performance (98% versus 93% F1) when detecting malware developed just one year after the trained malware samples were developed. For a time span of two years, the performance of both techniques started dropping by about 5% in F1. Both techniques saw the decrease in both precision and recall. However, the reason was mainly because of the degraded precision (by 6%) for MamaDroid, while for DroidSpan the main cause was the decrease in recall (by 9%). When detecting malware further into the feature, the results reveal that DroidSpan remained highly accurately (with 93% F1) up to four years. Even for a five-year span, it still attained a reasonable F1 accuracy of 83%. Note that the precision was always high at 99%, and it was the drop in recall that led to the the reduction in F1 accuracy. This is likely to be in line with the fact that dynamic analysis tends to give precise results with imperfect recall (since the analysis considers a subset of possible executions only). By contrast, MamaDroid did not sustain beyond the two year span, with F1 dropped to 70% in four years and 34% by the fifth year. The main causes continued to the decrease in precision, although for the five-year span it was the very low recall (26%) that caused the poor F1 accuracy.
The bottom half of the table shows the results for using the new benign sets in the training. In terms of the percentage numbers, the performance of both techniques was lower (by 2-5% in F1) than when the old benign set was involved in training. Yet the comparative trends between the two techniques for each time span did not change much, nor did other observations from the upper half of the table (e.g., DroidSpan mainly dropped in recall while MamaDroid in precision, except for the longest span). Overall, for detecting malware two years in the future, DroidSpan attained 91% F1 accuracy (versus 75% by MamaDroid). The contrasts between our work and the baseline were 88% versus 68%, and 81% versus 33%, for four- and five-year spans, respectively.
It is worth noting that we confirmed, using different datasets, that MamaDroid kept high performance (over 90%) for one year only and reasonable performance (above 80%) for at most two years: these were the findings from the original evaluation of MamaDroid.
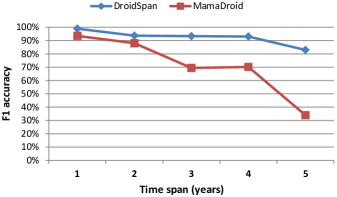
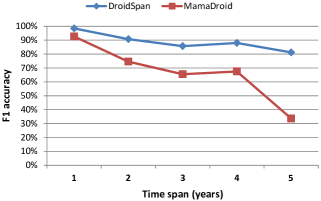
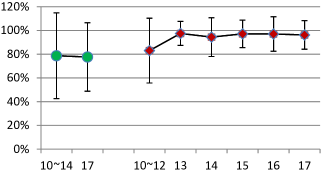
Sustainability. Figures 3 and 4 depicts the trends of classification performance changes in terms of F1 accuracy with DroidSpan versus MamaDroid, for using the old and new benign sets for training, respectively. The plotted data points were the same F1 numbers from Table 4. The two graphics clearly illustrate the overall sustainability patterns of both techniques in one to five years. As shown, while both classification approaches deteriorate over time, ours did so much slower than the baseline. Not only were the performance of DroidSpan always higher than MamaDroid at any of the five time spans studied, overall the gap enlarged continuously with the increase in the length of the time span. These contrasts suggest that our work can sustain with high accuracy much longer than, thus clearly outperforms in sustainability, this state-of-the-art solution.
6.5. Study III: Resiliency
Since many Android apps, malicious ones in particular, were obfuscated more or less (mainly in their code) (Tam et al., 2017), it is crucial for a malware detector to be resilient to code obfuscation to be practically useful. As we discussed earlier, DroidSpan is dynamic while monitoring all calls (including reflective and exception-driven ones) at runtime, it should be robust to typical code obfuscation schemes such as string encryption, reflection, and class/method renaming (Maiorca et al., 2015). To verify this hypothesis, in this study, we attempted to assess the resiliency of our technique to obfuscation against the baseline, using the MalObf dataset. All the three mentioned types of obfuscation schemes were applied in each app of this dataset.
Trained on the oldBen+oldMal, DroidSpan has been able to identify the malware in MalObf, with almost perfect performance (99% precision, recall, and F1). This empirical result supports our hypothesis above. We also intended to do this same study on MamaDroid. However, the sophisticated analysis of FlowDroid (Arzt et al., 2014) underlying the feature computation step of MamaDroid failed at any of the obfuscated apps due to the limitations of FlowDroid. While we cannot compare the performance between the two techniques against these obfuscated apps, as a static approach MamaDroid is likely to be more vulnerable to obfuscation than our dynamic technique.
6.6. Efficiency Results
We report the efficiency numbers with respect to all our datasets. The overhead of DroidSpan is dominated by the cost for computing the SAD profiles of the training samples. The instrumentation took from 2 to 315 seconds (mean 33.9, std 36.7) per malicious app, with slightly (10s on average) higher costs for benign apps. The profiling took a constant time of 10 minutes per app. Extracting SAD features from a trace took an average of 15s for an app. Given the small feature set it used, DroidSpan only spent very short time (within 3s) on model training and testing with the RF algorithm. Beyond the 128G traces in total for all the 5,934 apps (we currently simply stored all traces in plain text), other storage costs were trivial (i.e., 7M for storing all the feature files).
On the same datasets, we experienced efficiency difficulties with MamaDroid in all its three steps. The static analysis cost of FlowDroid is known to be substantial. Despite a configuration for low analysis precision it used, MamaDroid took about 16 days to finish the call-graph construction for our benchmarks (mean of 4min per app). For its best-performing (i.e., package) mode, MamaDroid also appeared slow with feature computation due to its very-high memory consumption as discussed in (Mariconti et al., 2017) (recall it has 150K feature values per app). This step took almost 3 days in our experiments, resulting in 11G feature files. The last step, training and testing, again was expensive because of loading the large feature files. For example, it spent about an hour for training on the newBen+oldMal mixed dataset. These numbers, even considering the per-app averages, are much higher than those reported in (Mariconti et al., 2017) (with 40-core CPU and 128G RAM), possibly because of our lower hardware configuration. Due to the dominating cost for tracing, DroidSpan tends to incur higher total costs per app. However, the significantly higher sustainability and performance along with better resiliency may justify the reasonable extra costs.
7. Threats to Validity and Limitations
In this section, we discuss various factors that may affect the validity of our results and performance of DroidSpan, along with its limitations.
One validity threat lies in the benchmark selection in our studies: the limited numbers of benign apps and malware used may not represent all respective Android apps. For a dynamic analysis, our dataset size is (at least among) the largest in the literature, but not as large as many used for static Android analysis approaches. To reduce this threat, we managed to obtain reasonably large datasets and purposely chose apps from a diverse set of sources.
Results of dynamic analyses are commonly subject to the availability and coverage of run-time inputs, which poses another threat to our results (the characterization findings in particular). The traces used in our studies may not well represent all the behaviors of the apps. Profiling a large number of Android apps (which needs an effective automatic input generator) with high coverage is still an open research topic. To reduce this threat, we have used best resources available to obtain high-coverage inputs for our studies, at the cost of longer total time for using our technique (i.e., 10min tracing per app). However, for the characterization study, the most important findings were about the evolutionary patterns of run-time app behaviors (rather than the numbers themselves), which tend to be less sensitive to the input coverage. For our malware detection technique, the high and sustainable classification accuracy shown through extensive experiments suggest even lesser dependence on the coverage. Nevertheless, a minimal piece of app trace that is usable by our technique is required for classifying the app.
A threat to validity of our conclusion is that the characterization findings and the merits of DroidSpan may not be exactly observed with different datasets. We attempted to reduce this risk through the diversity of our datasets. The general consistency in the results on MamaDroid between the authors’ original study and ours on different datasets suggests that our study results may not be much biased, which helps support our conclusion drawn from the results.
We have shown through a separate study (Study III) that our technique appeared to be resilient to encryption, reflection, and renaming attacks. DroidSpan could be vulnerable to other advanced app obfuscation and malware evasion schemes. However, it only relies on identifying source/sink APIs from execution traces (instead of code). These APIs are part of the Android SDK classes, obfuscating which is not currently feasible. In addition, tt is well known that tricky malware can evade detection by withholding their malicious behaviors when they find being executed on an emulator. Our highly positive evaluation results obtained from traces collected on an emulator suggests that emulator evasion does not seem to much affect the effectiveness DroidSpan. We have suggested that, due to the typically higher overhead of dynamic analysis (for profiling), DroidSpan can take relatively longer time. Another limitation is that substantial updates in the Android SDK for source/sink APIs may affect the performance of our technique, and thus would trigger retraining (with the updated source/sink lists).
8. Related Work
We discuss prior works closely related to ours, on app characterization and malware detection for Android.
Characterization of Android apps. Previous characterization studies of Android apps mostly focused on metrics extracted from the app code. For example, in (Enck et al., 2011), 1,100 popular apps were studied to understand their use and misuse of private information of mobile phones and users through reverse engineering. A few dynamic characterization studies exist, which concern the installation and activation methods of malware only (Zhou and Jiang, 2012) or execution structure of benign apps only (Cai and Ryder, 2016, 2017b). Another examples include the dynamic study (Wei et al., 2012) that profiles apps in terms of their inter-component communications (ICC) and network traffic. CopperDroid (Tam et al., 2015) can be used for characterizing system calls in apps, and the recently developed toolkit in (Cai and Ryder, 2017a) serves both static and dynamic characterizations.
In contrast, our characterization is purely dynamic, focusing on run-time sensitive accesses in both benign and malicious apps. More importantly, our characterization aims at a longitudinal examination of the evolution of Android apps. The characterization of evaluation datasets in (Mariconti et al., 2017) reveals the evolutionary characteristics of both malware and benign apps also, but it instead focuses on API calls in apps and is static.
Android Malware Detection. Numerous approaches have been proposed for detecting Android malware, by statically analyzing data and/or control flows (Feng et al., 2014; Grace et al., 2012; Yang et al., 2014; Tripp et al., 2016), API use (Wu et al., 2012; Aafer et al., 2013; Yang et al., 2014; Zhang et al., 2014; Avdiienko et al., 2015), and/or installation-time permission (Arp et al., 2014; Wu et al., 2012; Saracino et al., 2016; Avdiienko et al., 2015; Chen et al., 2016). ICCDetector (Xu et al., 2016) distinguishes malware from benign apps based on their different patterns in ICCs. Most recently, DroidSieve (Suarez-Tangil et al., 2017) used resource-centric features to classify obfuscated apps, while MamaDroid (Mariconti et al., 2017) aimed at sustainable detection, using a Markov model of API calls after abstracting them to family and package levels.
Dynamic malware detectors have mainly exploited monitoring system and/or API calls in apps (Burguera et al., 2011; Afonso et al., 2015; Chen et al., 2016), or high-level behaviors exhibited through the usage of system resources such as file and network access (Shabtai et al., 2012). Some of these approaches used static features in addition to dynamic ones (Lindorfer et al., 2015; Chen et al., 2016; Saracino et al., 2016). Approaches relied on static calls in app code are generally vulnerable to code obfuscation (e.g., reflection) (Suarez-Tangil et al., 2017).
As suggested by the study in (Mariconti et al., 2017), prior approaches are rarely shown to be capable of sustainable detection. For example, DroidAPIMiner (Aafer et al., 2013), which was used as the baseline of MamaDroid, did not even sustain its capabilities for a year without retraining (Mariconti et al., 2017). DroidSpan targets a better sustainability (and resiliency) of malware detection than Mamadroid, using only dynamic features based on the extent and distribution of exercised sensitive accesses and vulnerable, method-level control flows in app executions. As a static detector, MudFlow (Avdiienko et al., 2015) builds a normal behavior model based on the statement-level sensitive data flows in a training set of benign apps in order to identify new malware.
9. Conclusion
As malware continues to be rampant in Android threatening its large user base, defending against Android malware is crucial. Numerous approaches have been proposed, mostly training a learning model to predict the label of novel apps. Yet, existing approaches tend not to sustain without retraining, which however is not practical for detecting emerging malware.
In this paper, we introduce DroidSpan, a novel malware detection approach based on a new behavior profile of Android apps that models the distribution of their sensitive accesses. We start with a longitudinal characterization of this profile. Our findings reveal consistent differences between benign apps and malware over the past seven years, despite the evolution of both groups. These findings explain why DroidSpan sustains high accuracy for up to at least four years, without retraining, as also supported by our extensive empirical evidences. We also showed that DroidSpan outperforms the state-of-the-art peer approach with demonstrated sustainability in terms of the length of sustaining period for high accuracy and resilience to various obfuscation schemes, at reasonable costs.
References
- (1)
- Mal (2015) 2015. Android malware accounts for 97% of all malicious mobile apps. http://www.scmagazineuk.com/updated-97-of-malicious-mobile-malware-targets-android/article/422783/. (2015).
- Aafer et al. (2013) Yousra Aafer, Wenliang Du, and Heng Yin. 2013. DroidAPIMiner: Mining API-Level Features for Robust Malware Detection in Android. In SecureComm. 86–103.
- Afonso et al. (2015) Vitor Monte Afonso, Matheus Favero de Amorim, André Ricardo Abed Grégio, Glauco Barroso Junquera, and Paulo Lício de Geus. 2015. Identifying Android malware using dynamically obtained features. Journal of Computer Virology and Hacking Techniques 11, 1 (2015), 9–17.
- Allix et al. (2016) Kevin Allix, Tegawendé F Bissyandé, Jacques Klein, and Yves Le Traon. 2016. Androzoo: Collecting millions of android apps for the research community. In Proceedings of Working Conference on Mining Software Repositories. 468–471.
- Arp et al. (2014) Daniel Arp, Michael Spreitzenbarth, Malte Hubner, Hugo Gascon, and Konrad Rieck. 2014. Drebin: Efficient and Explainable Detection of Android Malware in Your Pocket. In Proceedings of Network and Distributed System Security Symposium.
- Arzt et al. (2014) Steven Arzt, Siegfried Rasthofer, Christian Fritz, Eric Bodden, Alexandre Bartel, Jacques Klein, Yves Le Traon, Damien Octeau, and Patrick McDaniel. 2014. FlowDroid: Precise Context, Flow, Field, Object-sensitive and Lifecycle-aware Taint Analysis for Android Apps. In Proceedings of ACM Conference on Programming Language Design and Implementation. 259–269.
- Avdiienko et al. (2015) Vitalii Avdiienko, Konstantin Kuznetsov, Alessandra Gorla, Andreas Zeller, Steven Arzt, Siegfried Rasthofer, and Eric Bodden. 2015. Mining apps for abnormal usage of sensitive data. In Proceedings of IEEE/ACM International Conference on Software Engineering. 426–436.
- Burguera et al. (2011) Iker Burguera, Urko Zurutuza, and Simin Nadjm-Tehrani. 2011. Crowdroid: behavior-based malware detection system for Android. In Proceedings of ACM workshop on Security and privacy in smartphones and mobile devices. 15–26.
- Cai and Ryder (2016) Haipeng Cai and Barbara Ryder. 2016. Understanding application behaviours for android security: A systematic characterization. Computer Science Technical Reports (2016).
- Cai and Ryder (2017a) Haipeng Cai and Barbara Ryder. 2017a. DroidFax: A toolkit for systematic characterization of Android applications. In Proceedings of International Conference on Software Maintenance and Evolution (ICSME). 643–647.
- Cai and Ryder (2017b) Haipeng Cai and Barbara Ryder. 2017b. Understanding Android Application Programming and Security: A Dynamic Study. In International Conference on Software Maintenance and Evolution (ICSME). 364–375.
- Cai and Ryder (2017c) Haipeng Cai and Barbara G Ryder. 2017c. Artifacts for Dynamic Analysis of Android Apps. In Software Maintenance and Evolution (ICSME), 2017 IEEE International Conference on. IEEE, 659–659.
- Chen et al. (2016) Sen Chen, Minhui Xue, Zhushou Tang, Lihua Xu, and Haojin Zhu. 2016. StormDroid: A Streaminglized Machine Learning-Based System for Detecting Android Malware. In Proceedings of ACM Asia Conference on Computer and Communications Security. 377–388.
- Choudhary et al. (2015) Shauvik Roy Choudhary, Alessandra Gorla, and Alessandro Orso. 2015. Automated Test Input Generation for Android: Are We There Yet?. In Proceedings of IEEE/ACM International Conference on Automated Software Engineering. 429–440.
- Dash et al. (2016) Santanu Kumar Dash, Guillermo Suarez-Tangil, Salahuddin Khan, Kimberly Tam, Mansour Ahmadi, Johannes Kinder, and Lorenzo Cavallaro. 2016. DroidScribe: Classifying Android Malware Based on Runtime Behavior. Proceedings of IEEE Mobile Security Technologies (2016).
- Enck et al. (2011) William Enck, Damien Octeau, Patrick McDaniel, and Swarat Chaudhuri. 2011. A study of android application security. In Proceedings of the 20th USENIX conference on Security. 21–21.
- Faruki et al. (2015) Parvez Faruki, Ammar Bharmal, Vijay Laxmi, Vijay Ganmoor, Manoj Singh Gaur, Mauro Conti, and Muttukrishnan Rajarajan. 2015. Android security: a survey of issues, malware penetration, and defenses. IEEE Communications Surveys & Tutorials 17, 2 (2015), 998–1022.
- Feng et al. (2014) Yu Feng, Saswat Anand, Isil Dillig, and Alex Aiken. 2014. Apposcopy: Semantics-Based Detection of Android Malware through Static Analysis. In FSE.
- Galal et al. (2015) Hisham Shehata Galal, Yousef Bassyouni Mahdy, and Mohammed Ali Atiea. 2015. Behavior-based features model for malware detection. Journal of Computer Virology and Hacking Techniques (2015), 1–9.
- Google (2017) Google. 2017. Android Monkey. http://developer.android.com/tools/help/monkey.html. (2017).
- Grace et al. (2012) Michael Grace, Yajin Zhou, Qiang Zhang, Shihong Zou, and Xuxian Jiang. 2012. Riskranker: scalable and accurate zero-day Android malware detection. In Proceedings of ACM International Conference on Mobile Systems, Applications, and Services. 281–294.
- Kolbitsch et al. (2009) Clemens Kolbitsch, Paolo Milani Comparetti, Christopher Kruegel, Engin Kirda, Xiao-yong Zhou, and XiaoFeng Wang. 2009. Effective and Efficient Malware Detection at the End Host.. In Proceedings of USENIX Security Symposium. 351–366.
- Lam et al. (2011) Patrick Lam, Eric Bodden, Ondrej Lhoták, and Laurie Hendren. 2011. Soot - a Java Bytecode Optimization Framework. In Cetus Users and Compiler Infrastructure Workshop. 1–11.
- Lindorfer et al. (2015) Martina Lindorfer, Matthias Neugschwandtner, and Christian Platzer. 2015. Marvin: Efficient and comprehensive mobile app classification through static and dynamic analysis. In Proceedings of IEEE Computer Software and Applications Conference, Vol. 2. 422–433.
- Maiorca et al. (2015) Davide Maiorca, Davide Ariu, Igino Corona, Marco Aresu, and Giorgio Giacinto. 2015. Stealth attacks: An extended insight into the obfuscation effects on Android malware. Computers & Security 51 (2015), 16–31.
- Mariconti et al. (2017) Enrico Mariconti, Lucky Onwuzurike, Panagiotis Andriotis, Emiliano De Cristofaro, Gordon Ross, and Gianluca Stringhini. 2017. MAMADROID: Detecting Android Malware by Building Markov Chains of Behavioral Models. In Proceedings of Network and Distributed System Security Symposium.
- Pedregosa et al. (2011) Fabian Pedregosa, Gaël Varoquaux, Alexandre Gramfort, Vincent Michel, Bertrand Thirion, Olivier Grisel, Mathieu Blondel, Peter Prettenhofer, Ron Weiss, Vincent Dubourg, et al. 2011. Scikit-learn: Machine learning in Python. Journal of Machine Learning Research 12, Oct (2011), 2825–2830.
- Rasthofer et al. (2014) Siegfried Rasthofer, Steven Arzt, and Eric Bodden. 2014. A Machine-learning Approach for Classifying and Categorizing Android Sources and Sinks.. In Proceedings of Network and Distributed System Security Symposium.
- Rasthofer et al. (2017) Siegfried Rasthofer, Steven Arzt, Stefan Triller, and Michael Pradel. 2017. Making Malory Behave Maliciously: Targeted Fuzzing of Android Execution Environments. In Proceedings of IEEE/ACM International Conference on Software Engineering.
- Research (2016) International Data Corporation (IDC) Research. 2016. Android dominating mobile market. http://www.idc.com/promo/smartphone-market-share/. (2016).
- Saracino et al. (2016) Andrea Saracino, Daniele Sgandurra, Gianluca Dini, and Fabio Martinelli. 2016. Madam: Effective and efficient behavior-based Android malware detection and prevention. IEEE Transactions on Dependable and Secure Computing (2016).
- Shabtai et al. (2012) Asaf Shabtai, Uri Kanonov, Yuval Elovici, Chanan Glezer, and Yael Weiss. 2012. “Andromaly”: A Behavioral Malware Detection Framework for Android Devices. Journal of Intelligent Information Systems 38, 1 (2012), 161–190.
- Suarez-Tangil et al. (2017) Guillermo Suarez-Tangil, Santanu Kumar Dash, Mansour Ahmadi, Johannes Kinder, Giorgio Giacinto, and Lorenzo Cavallaro. 2017. DroidSieve: Fast and accurate classification of obfuscated Android malware. In Proceedings of ACM Conference on Data and Application Security and Privacy. 309–320.
- Tam et al. (2017) Kimberly Tam, Ali Feizollah, Nor Badrul Anuar, Rosli Salleh, and Lorenzo Cavallaro. 2017. The evolution of Android malware and Android analysis techniques. Comput. Surveys 49, 4 (2017), 76.
- Tam et al. (2015) Kimberly Tam, Salahuddin J Khan, Aristide Fattori, and Lorenzo Cavallaro. 2015. CopperDroid: Automatic Reconstruction of Android Malware Behaviors.. In Proceedings of Network and Distributed System Security Symposium.
- Tan et al. (2015) Darell JJ Tan, Tong-Wei Chua, Vrizlynn LL Thing, et al. 2015. Securing Android: a survey, taxonomy, and challenges. Comput. Surveys 47, 4 (2015), 1–45.
- Tripp et al. (2016) Omer Tripp, Marco Pistoia, Pietro Ferrara, and Julia Rubin. 2016. Pinpointing Mobile Malware Using Code Analysis. In Proceedings of the International Workshop on Mobile Software Engineering and Systems. 275–276.
- virustotal.com (2017) virustotal.com. 2017. VirusTotal. (2017). https://www.virustotal.com/.
- Wei et al. (2012) Xuetao Wei, Lorenzo Gomez, Iulian Neamtiu, and Michalis Faloutsos. 2012. ProfileDroid: multi-layer profiling of Android applications. In Proceedings of ACM International Conference on Mobile Computing and Networking. 137–148.
- Wu et al. (2012) Dong-Jie Wu, Ching-Hao Mao, Te-En Wei, Hahn-Ming Lee, and Kuo-Ping Wu. 2012. Droidmat: Android malware detection through manifest and API calls tracing. In Proceedings of Asia Joint Conference on Information Security. 62–69.
- Xu et al. (2016) Ke Xu, Yingjiu Li, and Robert H Deng. 2016. ICCDetector: ICC-Based Malware Detection on Android. IEEE Transactions on Information Forensics and Security 11, 6 (2016), 1252–1264.
- Yang et al. (2014) Chao Yang, Zhaoyan Xu, Guofei Gu, Vinod Yegneswaran, and Phillip Porras. 2014. DroidMiner: Automated mining and characterization of fine-grained malicious behaviors in Android applications. In Proceedings of European Symposium on Research in Computer Security. 163–182.
- Zhang et al. (2014) Mu Zhang, Yue Duan, Heng Yin, and Zhiruo Zhao. 2014. Semantics-aware Android malware classification using weighted contextual api dependency graphs. In Proceedings of ACM Conference on Computer and Communications Security. 1105–1116.
- Zhou and Jiang (2012) Yajin Zhou and Xuxian Jiang. 2012. Dissecting Android malware: Characterization and evolution. In Proceedings of IEEE Symposium on Security and Privacy. 95–109.