The dearth of difference between central and satellite galaxies II. Comparison of observations with L-GALAXIES and EAGLE in star formation quenching
Abstract
As we demonstrated in Paper I, the quenched fractions of central and satellite galaxies as function of halo mass are extremely similar, as long as one controls for stellar mass. The same holds for the quenched fractions as a function of central velocity dispersion, which is tightly correlated with black hole mass, as long as one controls for both stellar and halo mass. Here we use mock galaxy catalogs constructed from the latest semi-analytic model, L-GALAXIES, and the state-of-the-art hydrodynamical simulation, EAGLE, to investigate whether these models can reproduce the trends seen in the data. We also check how the group finder used to identify centrals and satellites impacts our results. We find that L-GALAXIES fails to reproduce the trends. The predicted quenched fraction of central galaxies increases sharply with halo mass around and with black hole mass around M⊙, while the predicted quenched fraction of satellites increases with both halo and black hole masses gradually. In contrast, centrals and satellites in EAGLE follow almost the same trend as seen in the data. We discuss the implications of our results for how feedback processes regulate galaxy quenching.
Subject headings:
galaxies: general – galaxies: groups: general – galaxies: evolution1. Introduction
Star formation quenching is an essential process in galaxy formation and evolution since redshift about 2.5 (e.g. Bundy et al., 2006; Faber et al., 2007; Muzzin et al., 2012; Tomczak et al., 2014; Barro et al., 2017). However, what causes the star formation to quench is still an unsolved problem. Many observational studies have found that the quenched fraction of galaxies depends strongly on other intrinsic properties of galaxies, such as stellar mass, bulge-to-total light-ratio and central stellar velocity dispersion (e.g. Driver et al., 2006; Cameron et al., 2009; Wuyts et al., 2011; Mendel et al., 2013; Fang et al., 2013; Bluck et al., 2014; Woo et al., 2015; Wang et al., 2018a), as well as on the environments they reside in (e.g. Balogh et al., 2004; van den Bosch et al., 2007; Peng et al., 2010, 2012; Woo et al., 2013; Wang et al., 2016, 2018c).
Central and satellite galaxies in dark matter halos, as represented observationally by galaxy groups (e.g. Yang et al., 2005), are usually assumed to experience different quenching processes, because of their different locations and motions within the host halos. This is supported by observations that the quenched fraction of centrals is found to strongly depend on their structures, but only weakly on their host halo mass (Fang et al., 2013; Bluck et al., 2014; Woo et al., 2015) and environmental density (e.g. Peng et al., 2010, 2012), while the quenched fraction of satellites appears to be more sensitive to their environments (Abadi et al., 1999; Balogh et al., 2000; Blanton & Roweis, 2007; van den Bosch et al., 2008a; Weinmann et al., 2009; Peng et al., 2010; Wolf et al., 2009; Woo et al., 2013). In fact, the differences in the quenching properties between centrals and satellites are usually used to estimate the efficiency of satellite-specific quenching processes (e.g. van den Bosch et al., 2008a; Wetzel et al., 2012; Knobel et al., 2013; Kovač et al., 2014; Knobel et al., 2015; Wang et al., 2018c).
However, there is growing evidence that centrals and satellites are not as different as expected. For example, when dividing galaxies into several narrow stellar mass bins, Hirschmann et al. (2014) found that the quenched fractions of centrals and satellites respond to their local densities in a similar way. Knobel et al. (2015) found that, if satellites have similar stellar mass as the centrals, the two populations have on average the same quenched fraction. Similarly, Bluck et al. (2016) found that the quenching properties of massive satellites are identical to those of centrals of the same stellar mass. Wang et al. (2018c) analyzed the quenched fractions in samples controlled by both stellar mass and halo mass, and found that satellites and centrals in those controlled samples have similar quenching properties. They demonstrated that the different quenching behaviours of centrals and satellites found previously are mainly due to the fact that satellites, on average, reside in more massive halos than centrals of the same stellar mass. In particular, although centrals and satellites of similar stellar masses (or residing in halos of similar masses) reside in halos of different halos mass (or have different stellar mass distributions), their quenched fractions follow the same correlation with stellar mass (or halo mass).
More recently, in the first paper of this series, Wang et al. (2018b, hereafter Paper I) presented a comprehensive analysis on the quenching properties of centrals and satellites based on the SDSS group catalog of (Yang et al., 2007, 2009), including the quenched fraction as a function of stellar mass, bulge-to-total light ratio, central velocity dispersion, halo mass and halo-centric radius. The results show that the central and satellite populations exhibit similar trends of quenched fraction with all the variables considered. Moreover, we found that the fractions of Seyfert and radio galaxies, which relate to different types of AGN feedback, are also the same for centrals and satellites, as long as the stellar and halo mass are controlled. This suggests that the quenching mechanisms working on centrals and satellites are related to these internal and environmental parameters in a similar way.
Understanding how, when, and where galaxies quench their star formation is one of the most muddled, outstanding problems in galaxy formation. Different models for galaxy formation and evolution often make very different assumptions and/or predictions. Among them, semi-analytic galaxy formation models (SAM; e.g. White & Frenk, 1991; Kang et al., 2005; Bower et al., 2006; Croton et al., 2006; Bower et al., 2008; Somerville et al., 2008; Parry et al., 2009; Lu et al., 2011; Guo et al., 2011; Lee et al., 2014; Lu et al., 2014; Gonzalez-Perez et al., 2014; Somerville et al., 2015; Ruiz et al., 2015; Henriques et al., 2015) and hydro-dynamical simulations (e.g. Katz et al., 1992; Springel et al., 2001; Springel & Hernquist, 2003; Springel et al., 2005; Kereš et al., 2009; Angulo et al., 2012; Vogelsberger et al., 2014b, a; Schaye et al., 2015) are two powerful tools to trace galaxy formation and evolution in cosmological volumes. SAMs are phenomenological models that use approximate/empirical formula to describe all baryonic processes relevant to galaxy formation, such as gas accretion, heating and cooling, star formation, feedback from stars and AGN, mergers, and stripping due to tides and ram pressure. Because of their different locations within host halos, centrals and satellites in SAMs are assumed to undergo different quenching processes (see e.g. Henriques et al., 2017). For example, the stripping of hot and cold gas associated with galaxies is assumed to only act on satellites. In addition, the efficiency of radio AGN feedback is assumed to depend on the associated hot gas mass, which may be very different between centrals and satellites. Hydro-dynamical simulations, on the other hand, evolve the dark matter and baryonic components in a self-consistent way, though some assumptions have also to be adopted to model subgrid physics (see e.g. Springel & Hernquist, 2003). More importantly, centrals and satellites are not treated differently a priori, and their differences, if any, result directly from a complicated interaction between the baryonic content of a galaxy and its environment, while the (subgrid) modelling of star formation and feedback processes carry no knowledge of this environment.
In general, the current models are able to reproduce many global properties of observed galaxies, such as their abundance, their clustering, and the overall trend of the quenched fraction as a function of galaxy environment and galaxy properties (see the model papers cited above). However, they usually have difficulties in matching details of the quenched fraction (Hirschmann et al., 2014; Somerville & Davé, 2015; Khandai et al., 2015; Furlong et al., 2015; Guo et al., 2016; Henriques et al., 2017). This indicates that improvements in the treatments of quenching processes in semi-analytic models and in the sub-grid prescriptions in hydro-dynamic simulations are still required.
In this paper, we compare the observational results obtained in Paper I with theoretical predictions, based on both the L-GALAXIES semi-analytical galaxy formation model of Henriques et al. (2015), and the state-of-the-art hydro-dynamic simulation EAGLE (Evolution and Assembly of GaLaxies and their Environments; Schaye et al., 2015). In particular, we focus on whether the models can reproduce the similarity among centrals and satellites seen in the data. The comparisons between observations and models and between different models on the central-satellite difference may provide valuable insight into quenching mechanisms, thereby helping to improve galaxy formation models. Since the halo masses and central/satellite classification in the data are based on the group finder of Yang et al. (2005), which carries its own uncertainties, it is important to take this into account when comparing models and/or simulations to data. In particular, Campbell et al. (2015) have shown that the red fraction of central galaxies as function of halo mass is not well recovered by the group finder. We therefore construct mock data sets from L-GALAXIES and EAGLE, and run the same group finder over these mock data sets in order to facilitate a more meaningful comparison.
The remainder of this paper is organized as follows. In Section 2 we present the galaxy formation models and the mock catalogs constructed from them. In Section 3 we compare the observational results in Paper I with predictions from L-GALAXIES and EAGLE. In Section 4 we examine the uncertainties that may be caused by the group finder. We discuss the implications of our results in Section 5.
2. Galaxy Formation Models and Mock catalogs
Semi-analytic galaxy formation models and hydro-dynamic simulations, which take into account various baryonic processes, are the most powerful tools to study galaxy formation and evolution. Here we use data from the latest version of the Munich model, L-GALAXIES111http://galformod.mpa-garching.mpg.de/public/LGalaxies (Henriques et al., 2015, 2017) and the state-of-the-art hydrodynamic simulation, EAGLE222http://eagle.strw.leidenuniv.nl/ (Schaye et al., 2015; Crain et al., 2015; Furlong et al., 2015), to compare with the observational results we have obtained in Paper I.
2.1. L-GALAXIES and EAGLE
The L-GALAXIES model used here, as described in detail in Henriques et al. (2015), is an updated version of the Munich semi-analytic model (e.g. Croton et al., 2006; Guo et al., 2011) built upon the Millennium Simulation (Springel et al., 2005) assuming the Planck cosmology: , and (Planck Collaboration et al., 2014b). L-GALAXIES employs a Markov Chain Monte Carlo (MCMC) method to explore the high-dimensional parameter space to match the observed galaxy abundance and quenched fraction as a function of stellar mass from redshift of 3 down to 0. To better match the observational results, Henriques et al. (2015) made some changes in the model, including delaying the reincorporation of galaxy wind ejecta, eliminating the ram-pressure stripping in small halos, and modifying the model for radio mode AGN feedback. Due to the mass resolution limits of the Millennium Simulation, L-GALAXIES does not include galaxies with 109.5M⊙.
In L-GALAXIES, two major processes are assumed to play important roles in quenching star formation (or maintaining a low star formation rate) in passive galaxies: environmental effects on satellites, and radio mode feedback from central supermassive black holes. Heating from radio mode feedback is set to be proportional to the black hole mass and the hot gas mass in the halo (for centrals) or subhalo (for satellites) in question. Thus, the quenched fraction predicted by L-GALAXIES is directly linked to the mass of the hot gas and that of the central black hole, in the sense that galaxies with more hot gas and a more massive central black hole are more likely to be quenched. For satellites, additional “satellite specific” quenching processes are taken into account. After a satellite falls into a massive galaxy cluster, stripping of gas due to tidal interactions and ram pressure is assumed to remove its hot and cold gas reservoir gradually, subsequently leading to star formation quenching (see also Gunn & Gott, 1972; Toomre & Toomre, 1972; Moore et al., 1996; Boselli & Gavazzi, 2006; Read et al., 2006; Balogh et al., 2000; Weinmann et al., 2009; Wang et al., 2015). In the current version of L-GALAXIES (Henriques et al., 2015), the ram-pressure is assumed to remove the hot gas of satellites only in massive halos with M⊙. In addition, the gas surface density threshold for turning cold gas into stars is reduced by a factor of almost two in comparison with the value assumed earlier. Here we use the snapshot at , which roughly corresponds to the median redshift of our SDSS galaxy sample (see Paper I). The simulation box is 480.3 Mpc/h on a side.
EAGLE consists of a number of hydrodynamic simulations that follow the formation and evolution of galaxies and supermassive black holes in the cold dark matter universe. The adopted cosmology is also the Planck cosmology, but with slightly different parameters from that of L-GALAXIES: , and (Planck Collaboration et al., 2014a). These simulations adopt advanced smoothed particle hydrodynamics and subgrid physical models for gas cooling, metal enrichment, black hole growth, and stellar and AGN feedback. Free parameters in the feedback models are calibrated using the galaxy stellar mass function and the stellar mass - black hole mass relation at (Crain et al., 2015; Furlong et al., 2015). The Chabrier (2003) initial mass function and the Bruzual & Charlot (2003) stellar population model are used to obtain luminosities and stellar masses of individual galaxies based on their star formation histories. In a simulation like EAGLE, the same subgrid physical prescriptions are used for both centrals and satellites, and the differences between galaxies come directly from the formation and evolution processes. For example, the AGN feedback is assumed to depend on the local gas properties rather than on the gas properties of the whole halo. Similarly, the stripping processes of hot and cold gas associated with galaxies are directly modeled from first principles, independent of whether a galaxy is a central or satellite. In this paper, we use the simulation Ref-L100N1504, which has a box size of 100 Mpc and uses 2 particles. The masses of gas and dark matter particles are 1.81M⊙ and 9.70M⊙, respectively. The simulation contains more than 11,000 dark matter halos with masses above 1011M⊙, and nearly 10,000 galaxies with masses comparable to or larger than that of the Milky Way.
The cosmological parameters used in L-GALAXIES and EAGLE are not exactly the same as the ones used in Paper I. However, the differences are sufficiently small that this should not affect any of our results regarding the quenching properties of centrals and satellites. Another subtle difference regards the definition of centrals and satellites. In EAGLE, centrals are defined as the most massive galaxies in their host halos, with all other galaxies being satellites (Furlong et al., 2015). In L-GALAXIES, on the other hand, a central galaxy is defined as the galaxy that resides at the center of the main progenitor halo, which is the progenitor that evolves along the main trunk of the halo merger tree. This is not necessarily the most massive galaxy within that halo. However, we find that more than 97% of all centrals identified in L-GALAXIES are the most massive galaxies. Therefore, this subtle difference in central/satellite classification will not significantly impact any of our results.
2.2. Mock catalogs and definition of the quenched population
Our goal is to investigate the quenching properties of centrals and satellites for L-GALAXIES and EAGLE, and examine whether or not the models can reproduce the trends seen in the SDSS data. To make reliable comparisons with the observations, we construct mock catalogs of galaxies for both L-GALAXIES and EAGLE, so as to take into account observational selection effects (for details see Lim et al., 2017). In both case, we first stack the duplicates of the original simulation box side by side to construct a sufficiently large volume. We then choose a location for the observer in the constructed volume, and calculate the redshift and the apparent magnitude for each galaxy based on its luminosity, distance and movement with respect to the observer. Finally, we select a flux-limited sample of galaxies from a light cone covering the redshift range , which is similar to the range covered by the SDSS data. All comparisons are based on the mock catalogs, unless specified otherwise. Since the volume of the EAGLE simulation is quite small (), there are many repeated sources in its mock catalog. Therefore, the error bars of the statistics for massive galaxies and halos may be significantly underestimated in the EAGLE sample.
In Section 3, we use the mock galaxy catalogs thus constructed, together with the halo masses and central/satellite classification taken directly from the models, to analyze the correlations of the quenching properties with various other galaxy and environmental parameters. We refer to these mock catalogs as L-GALAXIES and EAGLE, respectively. In Section 4, we will take into account the uncertainties induced by the group finder. We apply the same group finder as used for the SDSS data to the two mock galaxy catalogs to select galaxy groups and to assign halo masses to them according to their characteristic, total stellar mass, following the method developed in Yang et al. (2005, 2007). For clarity, we refer to the mock galaxy catalogs with halo masses and central/satellite classification as inferred from the group finder as L-GALAXIES+GF and EAGLE+GF, respectively.
For our analysis, we use a number of quantities provided by L-GALAXIES and EAGLE, including star formation rate (SFR), stellar mass (), host halo mass (), the mass of the central supermassive black hole (), and the scaled halo-centric radius (), defined as the projected distance from the galaxy to the host group center in units of the halo virial radius of the host group. To compare with the results in Paper I, we treat the luminosity-weighted average of the positions of member galaxies in a group as the group center, and define the group virial radius as the radius within which the dark matter halo has an overdensity of 180 (see Equation 5 in Yang et al., 2007).
In paper I, we adopted the demarcation line suggested by Bluck et al. (2016) to separate galaxies into star-forming and quenched populations. In Appendix A, we show the specific SFR- diagram for SDSS, L-GALAXIES and EAGLE. As one can see, the results for the two models are quite different from the SDSS data. Thus, adopting the same demarcation line for the two models as for the SDSS galaxies is inappropriate. Instead, for L-GALAXIES/EAGLE, we first divide the galaxies into 15 stellar mass bins from M⊙ to M⊙. We then sort the galaxies in each bin by their SFRs, and set the SFR threshold below which the model galaxies are considered to be quenched such that the resulting quenched fraction as a function of stellar mass for the two models are exactly the same as that for the SDSS galaxies. The SFR threshold as a function of stellar mass for both L-GALAXIES and EAGLE are presented in Appendix A.
The quenched fraction () for the mock catalogs is calculated in the following way by using the method to correct the Malmquist bias. For a given subsample (S), the quenched fraction () is defined as:
| (1) |
Here is the number of galaxies in subsample S, is the weight given to galaxy , and represents the corresponding quenched status: if the galaxy is quenched, otherwise . As in Paper I, the error in the quenched fraction is estimated by using 1000 bootstrap samples.
3. Comparisons of L-GALAXIES and EAGLE with SDSS data
In this section, we investigate whether the similarity between centrals and satellites seen in Paper I for SDSS galaxies can be reproduced by L-GALAXIES and EAGLE.
We emphasize that the quenched populations for the two models are redefined so that a meaningful comparison between models and observational data can be made. In Appendix A, we also use an identical threshold to separate galaxies into star-forming and quenched populations for both the observation and the models. As one can see, both models can reproduce the overall trend of the quenched fraction increasing with stellar mass. However they both underestimate the quenched population, and the results for EAGLE are even worse than those for L-GALAXIES. These results are broadly consistent with those obtained before by, e.g., Furlong et al. (2015) and Henriques et al. (2017). We refer the reader to these papers for details. In the following, we adopt the new definition for quenched population (see Section 2.2 and Appendix A) and analyze the quenched fraction as a function of galaxy stellar mass, halo mass and central black hole mass separately for centrals and satellites in the L-GALAXIES and EAGLE catalogs (see Section 2), and compare the results with the SDSS results obtained in Paper I. Note that the halo masses and central/satellite classification used here are the true values taken directly from the models.
3.1. Dependence of the quenched fraction on stellar mass and halo mass
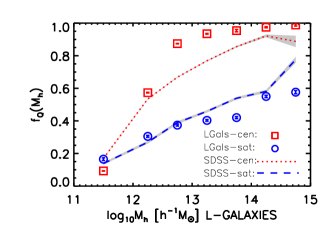

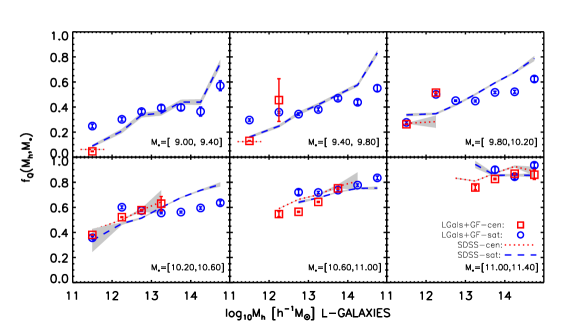
In Figure 1, we present the - relations for centrals (red squares) and satellites (blue circles) based on L-GALAXIES (left panel) and EAGLE (right panel). For comparison, the results for SDSS galaxies, taken from the left panel of figure 2 in Paper I, are also shown. As one can see, both L-GALAXIES and EAGLE are able to reproduce the overall trends of with for both the centrals and satellites. At fixed halo mass, the centrals are more frequently quenched than satellites, consistent with the observational data. For L-GALAXIES, the - relations are in fairly good agreement with the data, except at intermediate halo mass (M⊙), where the predicted quenched fraction of centrals is significantly higher than observed. In contrast, centrals in EAGLE are less frequently quenched than in the SDSS almost over the entire halo mass range. Moreover, satellites in EAGLE appear to be more sensitive to halo mass than what is seen in the data. In general, as far as the overall - relations are concerned, L-GALAXIES is in better agreement with the SDSS data than EAGLE.
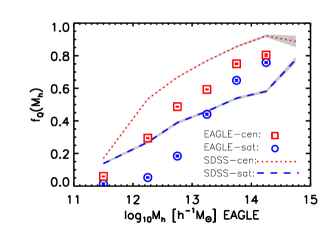
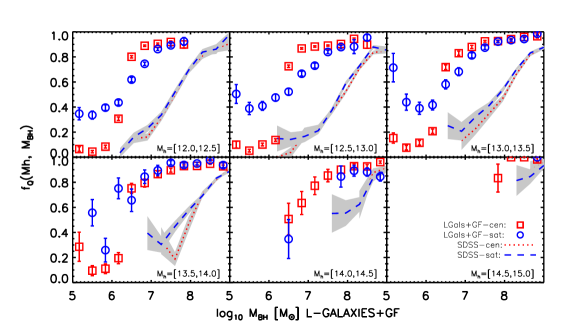
To see the dependence of on in more detail, we divide the galaxies into six stellar mass bins, and show the - relations for individual stellar mass bins in Figure 2. For comparison, the corresponding results for SDSS galaxies, taken from the top panels of figure 3 in Paper I, are also presented. Compared with SDSS, the satellites in L-GALAXIES exhibit weaker dependence of the quenched fraction on halo mass at low stellar masses, but stronger dependence at high stellar masses. For centrals, on the other hand, the predicted dependence by L-GALAXIES is stronger than that in the SDSS over the entire stellar mass range. More importantly, at given stellar mass the - relations for centrals and satellites are different, contrary to what is seen in the SDSS data. The quenched fraction of central galaxies increases rapidly with halo mass around M⊙ and is close to unity for M⊙. This trend appears without strong dependence on stellar mass. In contrast, the quenched fraction of satellites increases gradually with halo mass and the halo mass dependence strengthens with increasing stellar mass. This is in good agreement with the results of Hirschmann et al. (2014), who used the SAM of Guo et al. (2011) and found that centrals are more frequently quenched than satellites at fixed local density when galaxies are divided into a series of narrow stellar mass bins. Since the two populations exhibit very different dependence on halo mass and reside in different halos at given stellar mass, a cusp appears in the - relation for all galaxies, in disagreement with the observational results (e.g. Peng et al., 2012; Hirschmann et al., 2014; Woo et al., 2015; Wang et al., 2018c, Paper I).
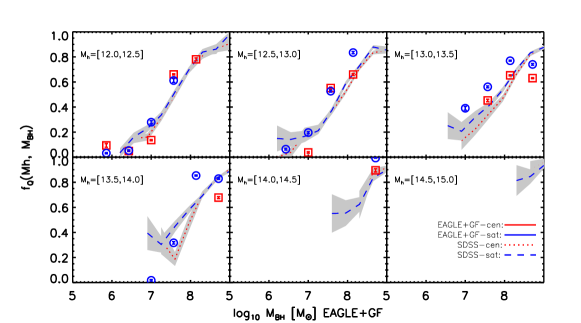
For EAGLE, the difference of centrals and satellites shown in Figure 1 is reduced when stellar mass is controlled, as shown in Figure 2. EAGLE galaxies show a steeper dependence on than SDSS galaxies at M⊙, but overall the agreement with the data is fairly good. Note that there are only 233 and 30 galaxies in the original simulation box for the two largest stellar mass bins, respectively. Hence, these results carry a large uncertainty, which is not properly captured by the errorbars shown, due to the fact that the mock catalog is constructed using repeated stacking of the EAGLE simulation volume.
These results clearly show that L-GALAXIES fails to reproduce the similarity in quenching properties between centrals and satellites. EAGLE, on the other hand, yields - relations that reveal significant discrepancies with respect to the data, but it does predict that centrals and satellites have similar quenching properties when controlled for both stellar and halo mass.
3.2. The -MBH relation at fixed halo and stellar masses
Several other galaxy properties, such as the bulge-to-total light ratio, bulge mass, and central velocity dispersion, are found to be better correlated with the quenched fraction than stellar mass (e.g. Driver et al., 2006; Bell, 2008; Wuyts et al., 2011; Mendel et al., 2013; Fang et al., 2013; Woo et al., 2015; Wang et al., 2018a). More recently, using observations of 91 galaxies with directly measured black hole masses, Terrazas et al. (2016) found that quenched galaxies have more massive black holes than star-forming galaxies of similar stellar mass. Consistent with this, the central velocity dispersion of a galaxy, which is tightly correlated with black hole mass, also correlates with whether a galaxy is quenched or not (Bluck et al., 2016; Teimoorinia et al., 2016). It is thus interesting to compare the predicted - relations of centrals and satellites in L-GALAXIES and EAGLE, both among each other and against observational data. Since the black hole masses for SDSS galaxies are not available, we follow Bluck et al. (2016) and estimate the black hole masses by using the well established - relation (e.g. Ho, 2008; Kormendy & Ho, 2013; McConnell & Ma, 2013). Specifically, we use the relation, , obtained by Saglia et al. (2016), which has an observed scatter of about 0.46 dex.
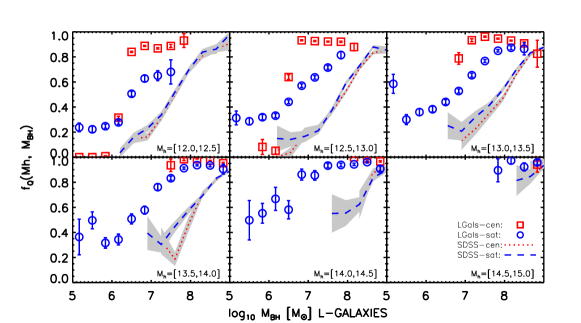
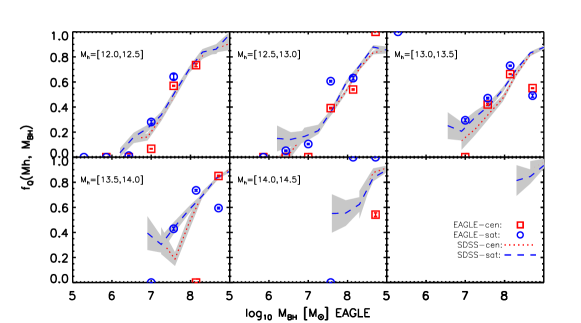
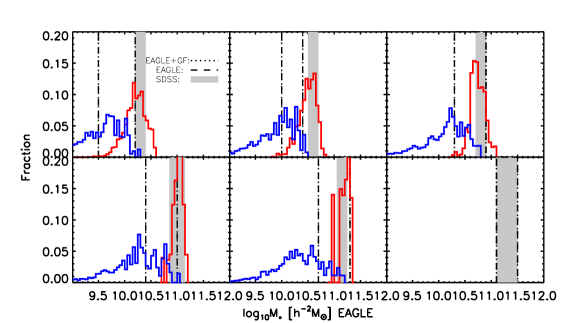
Figure 3 shows the - relations of centrals (red dashed line) and satellites (blue dashed line) for L-GALAXIES (top group of panels) and EAGLE (bottom group of panels) in a series of halo mass bins. For comparison, the corresponding results for SDSS galaxies are also presented (the same results as shown in figure 7 of Paper I, but with replaced with ). In order to eliminate the effects of stellar mass, the centrals and satellites shown in each panel are restricted to a narrow stellar mass bin. For each halo mass bin, the stellar mass bin is selected to make sure that we have sufficiently many centrals and satellites (see Appendix B). Thus, the stellar mass bin chosen varies with halo mass. Moreover, the stellar mass distributions for SDSS, L-GALAXIES and EAGLE galaxies are different, and so the stellar mass bins are slightly different for them, even for a given halo mass bin (see Appendix B). Since the difference is small and our purpose is to compare centrals and satellites, this does not affect any of our conclusions.
As shown in Figure 3, L-GALAXIES reproduces the overall trend in the data, in that the quenched fraction increases with . However, there are discrepancies. At low , the quenched fractions at given black hole mass predicted by the model are much higher than in the data. Our tests show that these discrepancies are caused by the fact that the black hole masses predicted by L-GALAXIES are systematically lower than those for SDSS galaxies of the same stellar mass (see also Terrazas et al., 2016). In addition, the predicted - relation for centrals show a clear jump, with the quenched fraction increasing rapidly from close to zero at to almost unity above . The results for satellites are very different, particularly for galaxies in low mass halos. The - relation of satellites is smooth and does not show the jump around seen for centrals. We emphasize, however, that the systematic underprediction of black hole mass is unlikely the main cause for the difference between centrals and satellites, as the problem with black hole mass appears in both populations. We suspect that the difference may be related to the different efficiency in AGN fueling and feedback, as discussed in Section 5.
In contrast to L-GALAXIES, the range of the black hole masses predicted by EAGLE is similar to that of SDSS galaxies at given halo and stellar mass. This is largely expected, as the feedback efficiency in EAGLE has been calibrated to match the amplitude of the observed galaxy-black hole mass relation. In the three low halo mass bins, the predicted - relations are in good agreement with the SDSS data. Most importantly, the relations for centrals and satellites are very similar, consistent with what is seen in the data. For more massive halos, the results show large fluctuations, due to the small numbers of galaxies in the corresponding mass bins.
In summary, L-GALAXIES and EAGLE predict very different - relations for both centrals and satellites. Whereas the EAGLE results are in excellent agreement with the SDSS data, the trends predicted by L-GALAXIES are extremely discrepant. We will discuss the implications of these results in Section 5.
3.3. Dependence of the - relation on halo mass and halo-centric distance
Satellite galaxies are usually assumed to experience a number of ‘satellite-specific’ quenching processes, such as tidal interaction (e.g. Toomre & Toomre, 1972; Read et al., 2006), ram-pressure stripping (e.g. Gunn & Gott, 1972; Abadi et al., 1999; Hester, 2006; Wang et al., 2015) and strangulation (Larson et al., 1980; Balogh et al., 2000; van den Bosch et al., 2008a). All these may lead to dependence of on halo-centric distance. Indeed, satellites of a given stellar mass are found to be more frequently quenched near group/cluster centers than in the outer parts (e.g. Weinmann et al., 2006; van den Bosch et al., 2008b; Wetzel et al., 2012; Kauffmann et al., 2013; Wang et al., 2018c). In Paper I, we found that the value of depends on halo-centric distance significantly only for galaxies with low masses, and that there seems to be a stellar mass threshold for given halo mass, above which the quenched fraction becomes independent of halo-centric distance. In this subsection, we test whether or not L-GALAXIES and EAGLE can reproduce this observational result.
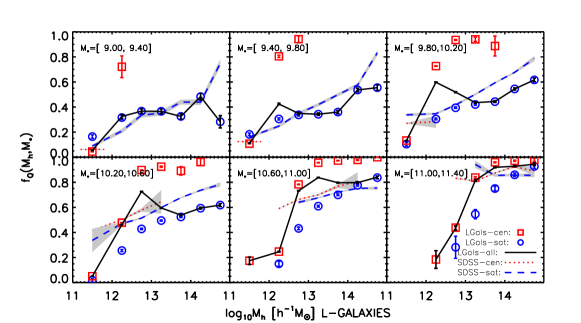
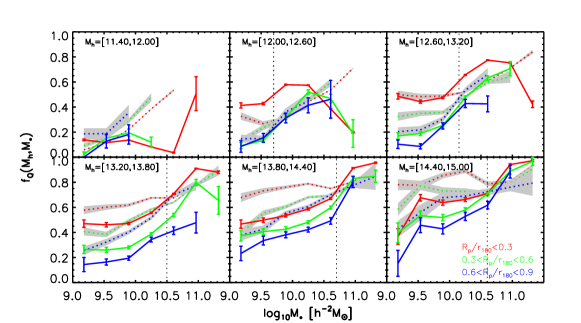
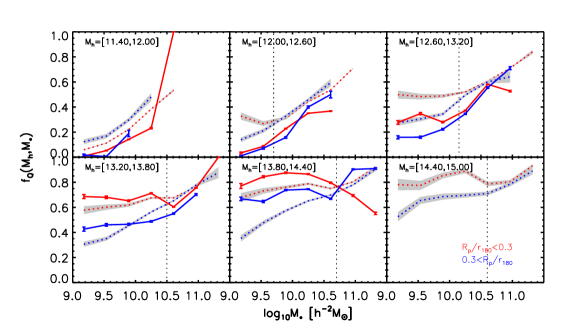
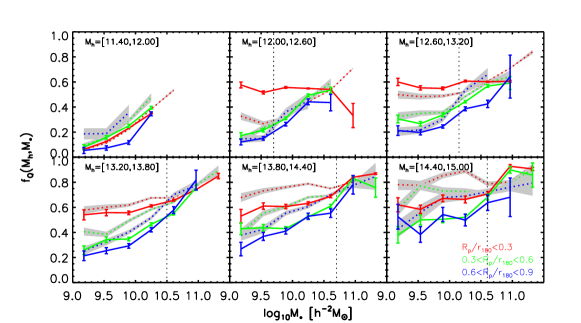
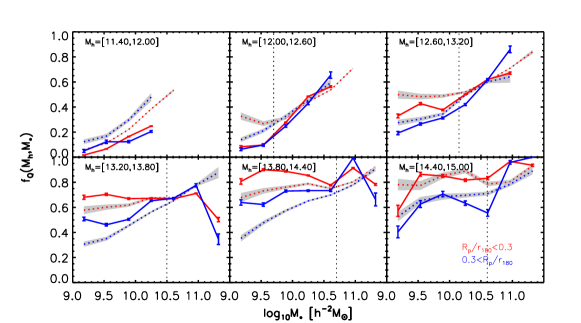
Figure 4 shows the - relation in the six halo mass bins, as predicted by L-GALAXIES (top group of panels) and by EAGLE (bottom group of panels), with each sample further divided according to halo-centric distance. For comparison, we also present similar results for SDSS galaxies (taken from Paper I) in dotted lines with shaded regions. The dotted vertical lines indicate the stellar mass threshold derived from the observational results, above which the quenched fraction becomes independent of halo-centric distance. We divide L-GALAXIES galaxies into three halo-centric distance bins, and EAGLE galaxies into two bins to achieve better statistics. Since centrals and satellites of similar stellar mass show very similar dependence on halo-centric distance, at least in the data (see Paper I), we do not investigate centrals and satellites separately.
Both L-GALAXIES and EAGLE can successfully reproduce the trend that galaxies located closer to the group center are more frequently quenched over almost the entire halo mass range. However, above the stellar mass thresholds, indicated by the vertical lines, the quenched fraction predicted by L-GALAXIES still shows significant dependence on halo-centric distance, at least for intermediate halo mass bins (M⊙M⊙), which is inconsistent with the observational result. In contrast, EAGLE appears to match the data much better, at least in the intermediate halo mass range from M⊙ to M⊙. Note that no EAGLE results are plotted for the halo mass bin , due the the small number of massive galaxies in the EAGLE simulation (see Figure 8).
4. Uncertainties induced by the group finder algorithm

The SDSS results shown above and in Paper I are based on the galaxy group catalog constructed using the halo-based group finder developed by Yang et al. (2005, 2007). The results presented in the previous section do not take into account uncertainties that may be induced by the group finder. In particular, the group finder assigns halo masses to each group based on the group’s total, characteristic stellar mass (see Yang et al., 2007, for details), and characterizes galaxies as centrals or satellites based on their stellar mass rank within the group, with centrals being the brightest group members. This invariably comes with some errors. In a recent study, Campbell et al. (2015) has shown that these errors typically reduce the differences between centrals and satellites, making them appear more similar than they really are. In this section, we investigate the reliability of our results against potential uncertainties introduced by the group finder.
4.1. Dependence on stellar mass, halo mass, black hole mass and halo-centric distance
To do this, we use the L-GALAXIES+GF and EAGLE+GF catalogs, described in Section 2, to derive the statistics of model galaxies. Note that, for these two catalogues, the halo masses and central/satellite classification are obtained from the group finder. The upper and lower sets of panels in Figure 5 show the quenched fractions as a function of halo mass for galaxies in the same six stellar mass bins as before, as obtained from L-GALAXIES+GF and EAGLE+GF, respectively. The SDSS results are also plotted for comparison.
For L-GALAXIES, the group finder clearly has a dramatic impact on the quenched fractions. In particular, the large differences between centrals and satellites evident in Figure 2 are now significantly reduced. However, the - relations for centrals and satellites obtained from L-GALAXIES+GF are still significantly different for the two lowest stellar mass bins, and . Moreover, the group finder tends to make the - relations flatter for both centrals and satellites. In particular, for satellites in halos with M⊙, the quenched fraction is almost independent of halo mass. In contrast, the quenched fraction of the observed satellites reveals a strong mass dependence.
The group finder has a much weaker impact on the results of the EAGLE simulation. As shown in the lower set of panels in Figure 5, the - relations obtained from EAGLE+GF for centrals and satellites have only changed slightly compared to the results shown in Figure 2. In particular, the impact of the group finder on the quenched fraction is similar for centrals and satellites, and the flattening effect that plagues the L-GALAXIES results is not significant for EAGLE.
The fact that the group finder significantly reduces the difference among the - relations of centrals and satellites for the L-GALAXIES model is somewhat unfortunate. It makes the quenching properties of L-GALAXIES and EAGLE appear more similar than they really are. As a result, the shortcomings of the group finder prevent us from clearly preferring one model over the other, at least when it comes to the difference in quenching statistics for centrals and satellites that are controlled for both halo mass and stellar mass. However, as we will see below, when it comes to the black hole mass dependence and the dependence on halo-centric radius, EAGLE+GF clearly outperforms L-GALAXIES+GF.
The - relations obtained from L-GALAXIES+GF and EAGLE+GF are shown in Figure 6 for six halo mass bins. As in Section 3.2, centrals and satellites are restricted to narrow stellar mass bins (see Appendix B) to eliminate the dependence on stellar mass. For the L-GALAXIES model, applying the group finder does not change the results too much; the large difference between centrals and satellites can still be seen for . In particular, the strong jump of for centrals at does not change significantly from L-GALAXIES to L-GALAXIES+GF. For the EAGLE model, the group finder algorithm also has only weak impact on the - relations of centrals and satellites, although the uncertainties are large, particularly for more massive halos.
The reason why the - relation is less sensitive to the group finder than the - relation, is simply because does not enter in, or derive from, the group finder, whereas does; the only way that the group finder can impact the - relations is through mis-classification of centrals and satellites. The results presented here suggest that this is not a major source of error. The implication is, that the similarity in the relations between and central velocity dispersion for centrals and satellites presented in Paper I is not an artifact of the group finder. Since central velocity dispersion is strongly correlated with black hole mass, we argue that the SDSS data is in much better agreement with EAGLE than with L-GALAXIES.
Finally, Figure 7 presents the - relations in different halo-centric distance intervals predicted by L-GALAXIES+GF and EAGLE+GF. For L-GALAXIES, the application of the group finder changes some details in the relationship, but the overall trends remain. For massive halos, with , the results from L-GALAXIES+GF are now in better agreement with the SDSS results. However, for halos with , the significant dependence of on halo-centric radius is still apparent for galaxies above the stellar mass threshold indicated by the dotted, vertical lines. For EAGLE, the group finder has little impact, and the - relations are very similar to the results shown in Figure 4.
4.2. Uncertainties introduced by the group finder


In order to better understand how and why the group finder impacts the results, and why the impact is so much larger for L-GALAXIES than for EAGLE, we now take a closer look at how the group finder performs for both models. The most relevant pieces of information provided by the group finder are the halo masses and the central/satellite classification. In order to better understand how the group finder impacts our results, we therefore examine the mis-classification rate and the reliability of the assigned halo masses in L-GALAXIES+GF and EAGLE+GF. The upper panels of Figure 8 plot the halo masses assigned by the group finder versus true halo mass, for both L-GALAXIES and EAGLE. The scatter in the assigned halo mass as a function of the true halo mass is shown in the bottom panels. Overall, there is a good linear relation between the assigned and true masses for both L-GALAXIES and EAGLE. However, the relation given by L-GALAXIES has significantly larger scatter, especially for massive halos (0.4 dex). For EAGLE, the scatter is much smaller, 0.2 dex, and shows almost no dependence on halo mass. We have also checked the mis-classification rate of centrals versus satellites, defined as the fraction of centrals/satellites in L-GALAXIES (or EAGLE) but classified as satellites/centrals in L-GALAXIES+GF (or EAGLE+GF). The mis-classification rates of centrals and satellites in L-GALAXIES+GF are 0.06 and 0.33, while they are about 0.03 and 0.16 in EAGLE+GF.
We can thus conclude, that overall the group finder performs significantly better in EAGLE than in L-GALAXIES. Further tests show that the main reason for this difference is that EAGLE predicts a much tighter relation between halo mass and the total stellar mass of its member galaxies (see Figure 13 in the Appendix). Since the group finder assigns halo masses under the ansatz of a one-to-one, monotonic relation between total stellar mass and halo mass, the poor performance of the group finder in the case of L-GALAXIES is easily understood.
Another issue that plays an important role is the central/satellite mis-classification, which causes centrals and satellites in the group catalog to look more similar than they really are (Campbell et al., 2015). Since the mis-classification is significantly larger in L-GALAXIES than in EAGLE, the difference between L-GALAXIES+GF and L-GALAXIES is larger than between EAGLE+GF and EAGLE. The fact that centrals and satellites in EAGLE are intrinsically more similar to each other than in L-GALAXIES (cf. Figure 2), adds to this enhanced effect of the group finder in the case of L-GALAXIES.
The difference in the performance of the group finder for L-GALAXIES and EAGLE is a concern, as it is not known a priori whether L-GALAXIES or EAGLE is a better representation of the real Universe. Here we use an independent test to show that the EAGLE simulation is more reminiscent of the real Universe than the population of galaxies in the L-GALAXIES semi-analytical model.
As shown above, the problem of the group finder in its application to L-GALAXIES is the large uncertainties in the assigned halo mass. It is well known that halo clustering depends strongly on halo mass (e.g. Mo & White, 1996; Sheth et al., 2001). Hence, if there are large errors in the assigned halo masses, this should reveal itself in the clustering properties of the galaxy groups. In particular, at the massive end, where the halo bias depends strongly on halo mass, large errors will result in a significant reduction of the mass dependence of the clustering of the groups. This idea was tested in Wang et al. (2008), who measured the relative bias of groups selected from the Yang et al. (2007) SDSS galaxy group catalog. They found that clustering-dependence on the inferred group mass to be in excellent agreement with that expected for halos in the CDM concordance cosmology. This indicates that the errors in the inferred group masses have to be relatively small. We now repeat this analysis of Wang et al. (2008) by measuring the relative halo bias as inferred from L-GALAXIES+GF, EAGLE+GF, and SDSS, and comparing the results with theoretical expectations.
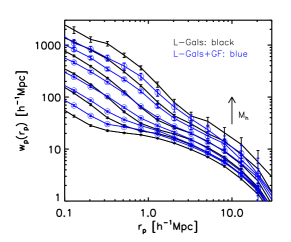
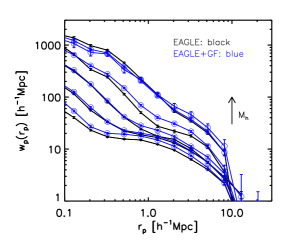
To estimate the halo bias, for each group catalog, we divide halos (groups) into six halo mass bins uniformly spaced in between and to . We calculate the projected two-point cross correlation function (2PCCF) between the groups in each mass bin and all galaxies in the corresponding catalog. The 2PCCFs so obtained are shown in Figure 9 as the black and blues lines for L-GALAXIES/EAGLE and L-GALAXIES+GF/EAGLE+GF, respectively. Errors are estimated using the bootstrap method (e.g. Barrow et al., 1984), and the details for calculating the 2PCCF can be found in Li et al. (2006). Note that the results for L-GALAXIES/EAGLE are independent of the group finder, while those for L-GALAXIES+GF/EAGLE+GF are affected by the group finder.
The clustering amplitude increases with increasing halo mass, in agreement with the fact that more massive halos are more strongly clustered. For L-GALAXIES, the group finder leads to a higher 2PCCF for the lowest halo mass bin, and a significantly lower 2PCCF for the three highest halo mass bins (M⊙), especially at scales Mpc. For EAGLE, the difference between EAGLE and EAGLE+GF are smaller than that between L-GALAXIES and L-GALAXIES+GF, although significant differences are present in the lowest halo mass bin. The 2PCCFs of EAGLE and EAGLE+GF drops sharply at Mpc, which is a consequence of the small simulation volume.
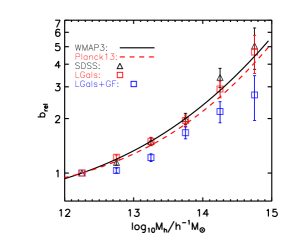
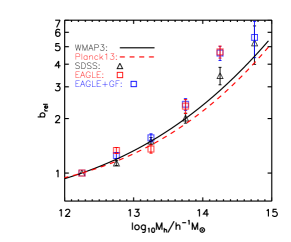
To quantify the change of the clustering amplitude with halo mass, we estimate the relative bias, defined as the ratio between the clustering amplitude for halos of given and that for halos of . The relative bias is calculated using the 2PCCFs in the range 4 Mpc 20 Mpc for L-GALAXIES, while that for EAGLE is calculated using the measurements within 4 Mpc 10 Mpc to reduce the impact of the box size. The results are shown in the bottom panels of Figure 9. For comparison, we also show the theoretical predictions of the Sheth et al. (2001) model for the two cosmological models, Planck adopted by L-GALAXIES and EAGLE, and WMAP3 adopted by Yang et al. (2007) when constructing the SDSS group catalog.
As can be seen, the relative halo bias for L-GALAXIES and EAGLE agree well with the theoretical curve. The halo bias obtained from L-GALAXIES+GF is, however, much lower than that from L-GALAXIES. This again indicates the failure of the group finder in the application to L-GALAXIES. In contrast, the halo bias obtained from EAGLE+GF resembles that from EAGLE and follows well the theoretical prediction, indicating that the group finder works successfully for EAGLE. More importantly, the halo bias of SDSS follows closely the theoretical prediction, as in EAGLE, and very different from that in L-GALAXIES. Unless our theoretical prediction for the mass dependence of the halo bias is significantly in error, this indicates that the scatter between halo mass and total stellar mass in the SDSS is not significantly larger than in the EAGLE simulation, and smaller than what is predicted by L-GALAXIES. It also suggests that the mass estimates for the SDSS groups are reliable, at least in a statistical sense.
5. Summary and discussion
In Paper I, we found that the quenched fraction correlates with a variety of parameters, such as halo mass, stellar mass, central velocity dispersion, bulge-to-total ratio, and halo-centric distance, and that the correlations are almost identical for central and satellite galaxies as long as the samples are properly controlled. In the present paper, we investigate the quenching properties of galaxies in two galaxy formation models, L-GALAXIES and EAGLE, and examine whether these two different models can reproduce the similarity between the quenching properties of centrals and satellites. We mimic the observations by constructing flux-limited mock galaxy samples from the two galaxy formation models. Since our main focus is on the difference between the two populations of galaxies, rather than on the overall trends predicted by the models, we define ‘quenched’ galaxies in the model samples such that they match the observed - relation of SDSS galaxies. The results from the two models are presented both with and without adopting the group finder, so that the uncertainties induced by the group finder can be examined. Our main results are as follows:
-
•
At given stellar mass, the overall - relations for L-GALAXIES agree with the observational results better than those for EAGLE. However, the L-GALAXIES model predicts significantly higher quenched fractions for centrals than for satellites at fixed halo mass and stellar mass. In contrast, the differences between centrals and satellites in the EAGLE simulation are much smaller.
-
•
The L-GALAXIES model predicts very different - relations for centrals and satellites at given halo mass and stellar mass. In particular, the predicted quenched fraction for centrals changes rapidly from about zero to about one around , while the quenched fraction of satellites reveals a much weaker dependence on . In contrast, the EAGLE simulation predicts - relations for centrals and satellites that are very similar, when controlling for both stellar and halo mass.
-
•
The L-GALAXIES model fails to reproduce the observed independence of on halo-centric distance for massive galaxies at low to intermediate halo mass (). EAGLE, on the other hand, matches the observations at these halo mass bins better.
-
•
After applying group finder, the results for EAGLE only change slightly. In contrast, the group finder significantly reduces the differences between centrals and satellites in L-GALAXIES, especially for the dependence of on halo mass. However, significant differences between the two populations remain, in particular regarding the dependence of on black hole mass.
-
•
Overall, the group finder works better on EAGLE than on L-GALAXIES, yielding better halo mass assignments and better central-satellite identification. This indicates that the performance of the group finder depends significantly on the detailed predictions of galaxy formation models. As an additional test of the performance of the group finder, we examined the clustering of the groups identified by the group finder. In the case of L-GALAXIES, the inferred clustering as a function of group mass is inconsistent with the expected mass dependence of the halo bias. EAGLE, on the other hand, is similar to the SDSS data, in that the inferred clustering of the groups is in excellent agreement with expectations based on the halo bias. This suggests that the amount of scatter in the relation between halo mass and total stellar mass in EAGLE is in agreement with that in the SDSS data, while L-GALAXIES predicts a scatter that is too large. In addition, the fact that the measured halo-bias for the SDSS groups agrees well with the theoretical expectations suggests that the results inferred from the SDSS group catalog are reliable.
As we have shown, centrals and satellites in L-GALAXIES have very different quenching properties, even when stellar mass and halo mass are fixed. This difference is likely caused by the fact that L-GALAXIES, and SAMs in general, treat centrals and satellites differently. In particular, SAMs typically include a number of processes that operate only on satellite galaxies. In early versions of various SAMs, it was assumed that satellite-specific processes strip satellite galaxies of their hot gas reservoir as soon as they become a satellite galaxy, i.e., as soon as they are accreted by a halo more massive than their own (e.g. De Lucia et al., 2004; Kang et al., 2005; Croton et al., 2006). As first pointed out in Weinmann et al. (2006), this leads to a rapid decline of star formation and a fraction of red or quenched satellites that is much higher than observed. Subsequent SAMs therefore adopted a more gentle stripping of the hot gas (e.g. Font et al., 2008; Kang & van den Bosch, 2008; Weinmann et al., 2010; Guo et al., 2011). In the more recent L-GALAXIES SAM of Henriques et al. (2015), ram-pressure is assumed to only operate in the most massive halos. Although these modifications reduce the difference between centrals and satellites, the results presented here suggest that the remaining differences may still be too large.
Another origin for the large differences between centrals and satellites in L-GALAXIES may come from the particular treatment of AGN feedback, which is assumed to be proportional to both black hole mass and the mass of the surrounding hot gas. For centrals, this results in a quenched fraction as function of black hole mass that is almost step-function-like, transiting from close to zero to close to unity around (see Figure 3). The quenched fraction of satellite galaxies, on the other hand, reveals a much weaker dependence on black hole mass. We have examined the hot gas mass fractions of centrals and satellites in L-GALAXIES of similar stellar mass and halo mass. In general, central galaxies have much more hot gas than satellites. More importantly, the amount of hot gas in centrals varies little from galaxy-to-galaxy (at fixed stellar mass), whereas the hot gas mass fraction of satellites spans several orders of magnitude. As a consequence, the impact of AGN feedback on centrals is almost entirely regulated by the mass of the black hole. For satellites, on the other hand, the much broader distribution of hot gas mass fractions explains the much weaker dependence on black hole mass.
Contrary to L-GALAXIES, the EAGLE simulation nicely reproduces the similarities between centrals and satellites regarding correlations of the quenched fraction with various other quantities. The simulation may, therefore, provide useful insights into the various processes that cause galaxies to quench their star formation. Whereas L-GALAXIES assume that the AGN feedback feedback efficiency depends on the total mass of hot gas, in EAGLE the amount of feedback energy is assumed to depend on the local density and temperature of the gas surrounding the central black hole. Since these local gas properties are likely to be less strongly affected by the environment than the total hot gas mass, this may explain why centrals and satellites in EAGLE appear more similar.
The comparison with SDSS data presented here suggests that the quenching properties of galaxies in EAGLE are in better agreement with the data than those in L-GALAXIES. However, we caution that the results based on the group finder can cause centrals and satellite to appear more similar than they are in reality. Indeed, after applying the halo-based group finder of Yang et al. (2005) over mock data extracted from L-GALAXIES, some of the dramatic differences between centrals and satellites present in the SAM are drastically suppressed. Nevertheless, significant differences with respect to the SDSS data remain, and an analysis of the clustering properties of the L-GALAXIES groups clearly suggests that it is far more significantly impacted by group finder errors than either EAGLE or SDSS. We are therefore cautiously confident that the EAGLE simulations better captures the physics of galaxy quenching than the L-GALAXIES semi-analytical model.
References
- Abadi et al. (1999) Abadi, M. G., Moore, B., & Bower, R. G. 1999, MNRAS, 308, 947
- Angulo et al. (2012) Angulo, R. E., Springel, V., White, S. D. M., et al. 2012, MNRAS, 426, 2046
- Balogh et al. (2004) Balogh, M. L., Baldry, I. K., Nichol, R., et al. 2004, ApJ, 615, L101
- Balogh et al. (2000) Balogh, M. L., Navarro, J. F., & Morris, S. L. 2000, ApJ, 540, 113
- Barro et al. (2017) Barro, G., Faber, S. M., Koo, D. C., et al. 2017, ApJ, 840, 47
- Barrow et al. (1984) Barrow, J. D., Bhavsar, S. P., & Sonoda, D. H. 1984, MNRAS, 210, 19P
- Bell (2008) Bell, E. F. 2008, ApJ, 682, 355
- Blanton & Roweis (2007) Blanton, M. R., & Roweis, S. 2007, AJ, 133, 734
- Bluck et al. (2014) Bluck, A. F. L., Mendel, J. T., Ellison, S. L., et al. 2014, MNRAS, 441, 599
- Bluck et al. (2016) —. 2016, MNRAS, 462, 2559
- Boselli & Gavazzi (2006) Boselli, A., & Gavazzi, G. 2006, PASP, 118, 517
- Bower et al. (2006) Bower, R. G., Benson, A. J., Malbon, R., et al. 2006, MNRAS, 370, 645
- Bower et al. (2008) Bower, R. G., McCarthy, I. G., & Benson, A. J. 2008, MNRAS, 390, 1399
- Bruzual & Charlot (2003) Bruzual, G., & Charlot, S. 2003, MNRAS, 344, 1000
- Bundy et al. (2006) Bundy, K., Ellis, R. S., Conselice, C. J., et al. 2006, ApJ, 651, 120
- Cameron et al. (2009) Cameron, E., Driver, S. P., Graham, A. W., & Liske, J. 2009, ApJ, 699, 105
- Campbell et al. (2015) Campbell, D., van den Bosch, F. C., Hearin, A., et al. 2015, MNRAS, 452, 444
- Chabrier (2003) Chabrier, G. 2003, PASP, 115, 763
- Crain et al. (2015) Crain, R. A., Schaye, J., Bower, R. G., et al. 2015, MNRAS, 450, 1937
- Croton et al. (2006) Croton, D. J., Springel, V., White, S. D. M., et al. 2006, MNRAS, 365, 11
- De Lucia et al. (2004) De Lucia, G., Kauffmann, G., & White, S. D. M. 2004, MNRAS, 349, 1101
- Driver et al. (2006) Driver, S. P., Allen, P. D., Graham, A. W., et al. 2006, MNRAS, 368, 414
- Faber et al. (2007) Faber, S. M., Willmer, C. N. A., Wolf, C., et al. 2007, ApJ, 665, 265
- Fang et al. (2013) Fang, J. J., Faber, S. M., Koo, D. C., & Dekel, A. 2013, ApJ, 776, 63
- Font et al. (2008) Font, A. S., Bower, R. G., McCarthy, I. G., et al. 2008, MNRAS, 389, 1619
- Furlong et al. (2015) Furlong, M., Bower, R. G., Theuns, T., et al. 2015, MNRAS, 450, 4486
- Gonzalez-Perez et al. (2014) Gonzalez-Perez, V., Lacey, C. G., Baugh, C. M., et al. 2014, MNRAS, 439, 264
- Gunn & Gott (1972) Gunn, J. E., & Gott, III, J. R. 1972, ApJ, 176, 1
- Guo et al. (2011) Guo, Q., White, S., Boylan-Kolchin, M., et al. 2011, MNRAS, 413, 101
- Guo et al. (2016) Guo, Q., Gonzalez-Perez, V., Guo, Q., et al. 2016, MNRAS, 461, 3457
- Henriques et al. (2015) Henriques, B. M. B., White, S. D. M., Thomas, P. A., et al. 2015, MNRAS, 451, 2663
- Henriques et al. (2017) —. 2017, MNRAS, 469, 2626
- Hester (2006) Hester, J. A. 2006, ApJ, 647, 910
- Hirschmann et al. (2014) Hirschmann, M., De Lucia, G., Wilman, D., et al. 2014, MNRAS, 444, 2938
- Ho (2008) Ho, L. C. 2008, ARA&A, 46, 475
- Kang et al. (2005) Kang, X., Jing, Y. P., Mo, H. J., & Börner, G. 2005, ApJ, 631, 21
- Kang & van den Bosch (2008) Kang, X., & van den Bosch, F. C. 2008, ApJ, 676, L101
- Katz et al. (1992) Katz, N., Hernquist, L., & Weinberg, D. H. 1992, ApJ, 399, L109
- Kauffmann et al. (2013) Kauffmann, G., Li, C., Zhang, W., & Weinmann, S. 2013, MNRAS, 430, 1447
- Kereš et al. (2009) Kereš, D., Katz, N., Fardal, M., Davé, R., & Weinberg, D. H. 2009, MNRAS, 395, 160
- Khandai et al. (2015) Khandai, N., Di Matteo, T., Croft, R., et al. 2015, MNRAS, 450, 1349
- Knobel et al. (2015) Knobel, C., Lilly, S. J., Woo, J., & Kovač, K. 2015, ApJ, 800, 24
- Knobel et al. (2013) Knobel, C., Lilly, S. J., Kovač, K., et al. 2013, ApJ, 769, 24
- Kormendy & Ho (2013) Kormendy, J., & Ho, L. C. 2013, ARA&A, 51, 511
- Kovač et al. (2014) Kovač, K., Lilly, S. J., Knobel, C., et al. 2014, MNRAS, 438, 717
- Larson et al. (1980) Larson, R. B., Tinsley, B. M., & Caldwell, C. N. 1980, ApJ, 237, 692
- Lee et al. (2014) Lee, J., Yi, S. K., Elahi, P. J., et al. 2014, MNRAS, 445, 4197
- Li et al. (2006) Li, C., Kauffmann, G., Jing, Y. P., et al. 2006, MNRAS, 368, 21
- Lim et al. (2017) Lim, S. H., Mo, H. J., Lu, Y., Wang, H., & Yang, X. 2017, MNRAS, 470, 2982
- Lu et al. (2011) Lu, Y., Kereš, D., Katz, N., et al. 2011, MNRAS, 416, 660
- Lu et al. (2014) Lu, Y., Wechsler, R. H., Somerville, R. S., et al. 2014, ApJ, 795, 123
- McConnell & Ma (2013) McConnell, N. J., & Ma, C.-P. 2013, ApJ, 764, 184
- Mendel et al. (2013) Mendel, J. T., Simard, L., Ellison, S. L., & Patton, D. R. 2013, MNRAS, 429, 2212
- Mo & White (1996) Mo, H. J., & White, S. D. M. 1996, MNRAS, 282, 347
- Moore et al. (1996) Moore, B., Katz, N., Lake, G., Dressler, A., & Oemler, A. 1996, Nature, 379, 613
- Muzzin et al. (2012) Muzzin, A., Wilson, G., Yee, H. K. C., et al. 2012, ApJ, 746, 188
- Parry et al. (2009) Parry, O. H., Eke, V. R., & Frenk, C. S. 2009, MNRAS, 396, 1972
- Peng et al. (2012) Peng, Y.-j., Lilly, S. J., Renzini, A., & Carollo, M. 2012, ApJ, 757, 4
- Peng et al. (2010) Peng, Y.-j., Lilly, S. J., Kovač, K., et al. 2010, ApJ, 721, 193
- Planck Collaboration et al. (2014a) Planck Collaboration, Ade, P. A. R., Aghanim, N., et al. 2014a, A&A, 571, A1
- Planck Collaboration et al. (2014b) —. 2014b, A&A, 571, A16
- Read et al. (2006) Read, J. I., Wilkinson, M. I., Evans, N. W., Gilmore, G., & Kleyna, J. T. 2006, MNRAS, 366, 429
- Ruiz et al. (2015) Ruiz, A. N., Cora, S. A., Padilla, N. D., et al. 2015, ApJ, 801, 139
- Saglia et al. (2016) Saglia, R. P., Opitsch, M., Erwin, P., et al. 2016, ApJ, 818, 47
- Schaye et al. (2015) Schaye, J., Crain, R. A., Bower, R. G., et al. 2015, MNRAS, 446, 521
- Sheth et al. (2001) Sheth, R. K., Mo, H. J., & Tormen, G. 2001, MNRAS, 323, 1
- Somerville & Davé (2015) Somerville, R. S., & Davé, R. 2015, ARA&A, 53, 51
- Somerville et al. (2008) Somerville, R. S., Hopkins, P. F., Cox, T. J., Robertson, B. E., & Hernquist, L. 2008, MNRAS, 391, 481
- Somerville et al. (2015) Somerville, R. S., Popping, G., & Trager, S. C. 2015, MNRAS, 453, 4337
- Springel & Hernquist (2003) Springel, V., & Hernquist, L. 2003, MNRAS, 339, 289
- Springel et al. (2001) Springel, V., White, S. D. M., Tormen, G., & Kauffmann, G. 2001, MNRAS, 328, 726
- Springel et al. (2005) Springel, V., White, S. D. M., Jenkins, A., et al. 2005, Nature, 435, 629
- Teimoorinia et al. (2016) Teimoorinia, H., Bluck, A. F. L., & Ellison, S. L. 2016, MNRAS, 457, 2086
- Terrazas et al. (2016) Terrazas, B. A., Bell, E. F., Henriques, B. M. B., et al. 2016, ApJ, 830, L12
- Tomczak et al. (2014) Tomczak, A. R., Quadri, R. F., Tran, K.-V. H., et al. 2014, ApJ, 783, 85
- Toomre & Toomre (1972) Toomre, A., & Toomre, J. 1972, ApJ, 178, 623
- van den Bosch et al. (2008a) van den Bosch, F. C., Aquino, D., Yang, X., et al. 2008a, MNRAS, 387, 79
- van den Bosch et al. (2008b) van den Bosch, F. C., Pasquali, A., Yang, X., et al. 2008b, ArXiv e-prints
- van den Bosch et al. (2007) van den Bosch, F. C., Yang, X., Mo, H. J., et al. 2007, MNRAS, 376, 841
- Vogelsberger et al. (2014a) Vogelsberger, M., Zavala, J., Simpson, C., & Jenkins, A. 2014a, MNRAS, 444, 3684
- Vogelsberger et al. (2014b) Vogelsberger, M., Genel, S., Springel, V., et al. 2014b, Nature, 509, 177
- Wang et al. (2015) Wang, E., Wang, J., Kauffmann, G., Józsa, G. I. G., & Li, C. 2015, MNRAS, 449, 2010
- Wang et al. (2018a) Wang, E., Li, C., Xiao, T., et al. 2018a, ApJ, 856, 137
- Wang et al. (2018b) Wang, E., Wang, H., Mo, H., et al. 2018b, ArXiv e-prints
- Wang et al. (2016) Wang, H., Mo, H. J., Yang, X., et al. 2016, ApJ, 831, 164
- Wang et al. (2018c) Wang, H., Mo, H. J., Chen, S., et al. 2018c, ApJ, 852, 31
- Wang et al. (2008) Wang, Y., Yang, X., Mo, H. J., et al. 2008, ApJ, 687, 919
- Weinmann et al. (2009) Weinmann, S. M., Kauffmann, G., van den Bosch, F. C., et al. 2009, MNRAS, 394, 1213
- Weinmann et al. (2010) Weinmann, S. M., Kauffmann, G., von der Linden, A., & De Lucia, G. 2010, MNRAS, 406, 2249
- Weinmann et al. (2006) Weinmann, S. M., van den Bosch, F. C., Yang, X., & Mo, H. J. 2006, MNRAS, 366, 2
- Wetzel et al. (2012) Wetzel, A. R., Tinker, J. L., & Conroy, C. 2012, MNRAS, 424, 232
- White & Frenk (1991) White, S. D. M., & Frenk, C. S. 1991, ApJ, 379, 52
- Wolf et al. (2009) Wolf, C., Aragón-Salamanca, A., Balogh, M., et al. 2009, MNRAS, 393, 1302
- Woo et al. (2015) Woo, J., Dekel, A., Faber, S. M., & Koo, D. C. 2015, MNRAS, 448, 237
- Woo et al. (2013) Woo, J., Dekel, A., Faber, S. M., et al. 2013, MNRAS, 428, 3306
- Wuyts et al. (2011) Wuyts, S., Förster Schreiber, N. M., van der Wel, A., et al. 2011, ApJ, 742, 96
- Yang et al. (2009) Yang, X., Mo, H. J., & van den Bosch, F. C. 2009, ApJ, 695, 900
- Yang et al. (2005) Yang, X., Mo, H. J., van den Bosch, F. C., & Jing, Y. P. 2005, MNRAS, 356, 1293
- Yang et al. (2007) Yang, X., Mo, H. J., van den Bosch, F. C., et al. 2007, ApJ, 671, 153
figuresection
Appendix A A: Defining the population of quenched galaxies
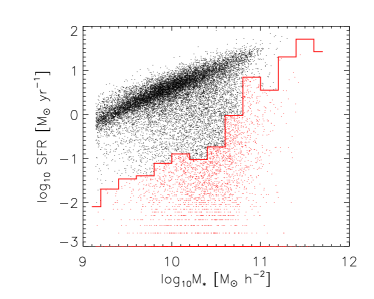
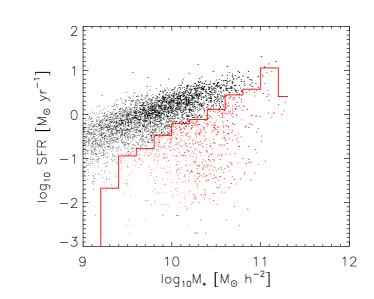
To allow for a meaningful comparison of the quenching fractions in the data and the models, we define the quenched fractions in L-GALAXIES and EAGLE such that they match the observed - relation of SDSS galaxies. Figure 10 shows the SFR- relation for the SF and quenched galaxies in L-GALAXIES and EAGLE. The red demarcation line indicates the SFR thresholds, below which galaxies are considered quenched. This definition is not commonly used in the literature, but is adopted here so that a meaningful comparison between models and observational data can be made. Note that a galaxy defined as quenched in this way, may still be actively forming stars in the L-GALAXIES or EAGLE simulations.
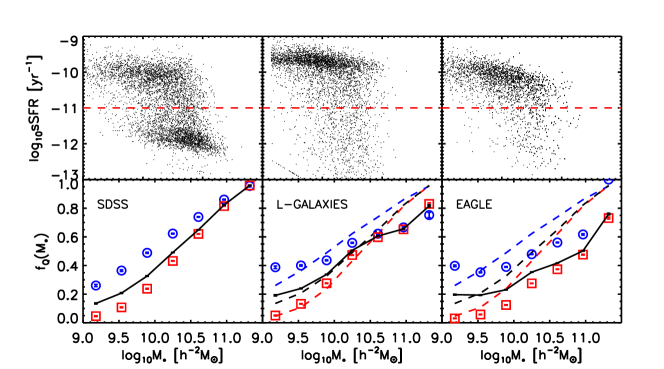
To get an overall impression of the - relation predicted by the models, here we present results based on the commonly used definition of quenched population for all the three samples, L-GALAXIES, EAGLE, and SDSS. The upper panels of Figure 11 plot the sSFR versus stellar mass for galaxies in the SDSS (left-hand panel), the L-GALAXIES model (middle panel) and the EAGLE simulations (right-hand panel). Whereas the SDSS data reveals a very pronounced population of quenched galaxies, this is not the case for L-GALAXIES or EAGLE. This is mainly because the models predict many galaxies with zero SFR, which falls below the scale of the plots. If we split the populations in quenched and star-forming at a sSFR of , indicated by the dashed lines in the top panels, we obtain the quenched fractions as function of stellar mass indicated in the lower panels. Both L-GALAXIES and EAGLE reproduce the global trends seen in the SDSS data of increasing with mass, and of satellites (blue circles) having higher quenched fractions than centrals (red squares) at fixed stellar mass. However, L-GALAXIES under-predicts the quenched fraction of galaxies at the massive end ((M⊙)10.6). The EAGLE simulation fairs even worse in reproducing the detailed - relations observed in the SDSS. In order for our results not to be affected by these overall differences, at each stellar mass bin we define the sSFR below which galaxies are defined to be quenched such that both L-GALAXIES and EAGLE yield - relations relations that are identical to the SDSS results (see §2.2) for details).
Appendix B B: Controlled stellar mass ranges for EAGLE (EAGLE+GF) and L-GALAXIES (L-GALAXIES+GF)
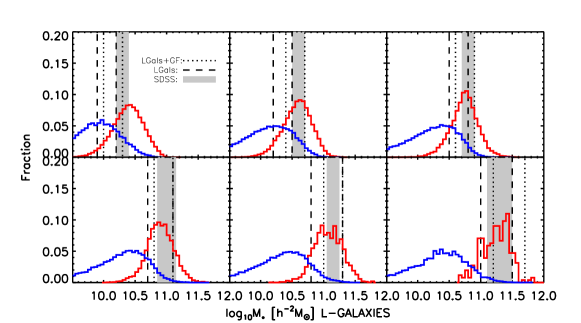
In order to compare the - relations of centrals and satellites, we have to control both stellar mass and halo mass. However, it is known that centrals and satellites occupy different loci in the stellar mass and halo mass plane. In Figure 12, we show the stellar mass distributions of centrals and satellites in various halo mass bins for L-GALAXIES (top group of panels) and EAGLE (bottom group of panels). The distributions for SDSS galaxies can be found in figure 5 of paper I. The overlap between the two populations is usually narrow and varies with halo mass. For each halo mass bin, the stellar mass range is manually selected to make sure that there are a large enough number of centrals and satellites to facilitate a meaningful comparison. The stellar mass ranges for L-GALAXIES, L-GALAXIES+GF, EAGLE, and EAGLE+GF are marked in Figure 12. For comparison, the shaded regions show the corresponding stellar mass ranges for SDSS galaxies. For L-GALAXIES, the halo masses assigned by the group finder are quite different from the true halo masses (see Figure 8), which explains why the selected stellar mass ranges for L-GALAXIES and L-GALAXIES+GF are somewhat different. Since the stellar mass distributions in each halo mass bin are different among L-GALAXIES, EAGLE and SDSS, the chosen stellar mass bins for the two models and the observations are also different. As one can see, the controlled stellar mass ranges for SDSS galaxies are higher than those for L-GALAXIES and EAGLE, especially in less massive halos (M⊙). The differences are reduced at the massive end. Specifically, the controlled stellar mass ranges of L-GALAXIES+GF are more consistent with those of SDSS than L-GALAXIES. The controlled stellar mass ranges are the same for EAGLE and EAGLE+GF, which are systematically lower than those of SDSS. The reader should keep these differences in mind when interpreting the results in Figures 3 and 6.
Appendix C C: The total stellar mass of member galaxies versus the halo mass of groups for L-GALAXIES and EAGLE


As shown in Figure 8, for the L-GALAXIES model there is a large scatter (up to 0.4 dex) between the real halo mass and the halo mass assigned by the group finder. This scatter is significantly smaller (0.2 dex) in the case of the EAGLE simulations. The group finder assign halo masses to each group assuming a tight correlation between halo mass and the total stellar mass of its member galaxies. Hence, the fact that the masses assigned to the groups in EAGLE are more accurate than in the case of L-GALAXIES is likely to have its origin in a larger scatter between halo mass and total stellar mass in L-GALAXIES. To test this, Figure 13 plots the relationship between the total stellar mass, , of member galaxies and halo mass for groups in both L-GALAXIES (left) and EAGLE (right). The lower panels plot the corresponding scatter in as function of halo mass. Overall, L-GALAXIES indeed reveals a larger amount of scatter, reaching dex at M⊙. In contrast, the scatter in EAGLE is only dex around that mass scale. Hence, we conclude that the main origin for the larger errors in the assigned group masses in L-GALAXIES is a larger scatter in the relation between halo mass and total stellar mass of its member galaxies.