The AMY (Air Microwave Yield) experiment to measure the GHz emission from air shower plasma
Abstract
The aim of the Air Microwave Yield (AMY) experiment is to investigate the Molecular Bremsstrahlung Radiation (MBR) emitted from an electron beam induced air-shower. The measurements have been performed with a 510 MeV electron beam at the Beam Test Facility (BTF) of Frascati INFN National Laboratories in a wide frequency range between 1 and 20 GHz. We present the experimental apparatus and the first results of the measurements. Contrary to what have been reported in a previous similar experiment Gorham-SLAC , we have found that the intensity of the emission is strongly influenced by the particular time structure of the accelerator beam. This makes very difficult the interpretation of the emission process and a realistic extrapolation of the emission yield to the plasma generated during the development of an atmospheric shower.
Keywords:
UHECR, microwave emission, test beam:
96.50.sd1 Introduction
The fluorescence technique is a well established method to detect the cosmic rays at energies ¿ eV. It provides a calorimetric measurement of the primary energy from the detection of the radiation produced by the de-excitation of the atmospheric nitrogen. Fluorescence telescopes are used by the Pierre Auger Observatory PAO and Telescope Array TARio , which are the largest detectors of cosmic rays that were ever built. The fluorescence measurements are used to determine the energy scale Verzi of the surface array detector. However, this can be done only in small fraction of events detected by the surface array since the fluorescence telescopes can run only during moonless nights with an overall duty cycle of about 10%.
Recently, a new detection technique alternative to the fluorescence one has been proposed Gorham-SLAC , in which cosmic rays are detected measuring the MBR radiation at frequencies of few GHz produced during the shower development. MBR is expected to be emitted by low energy electrons during their interaction with the field of the neutral molecules. Alike the fluorescence emission, MBR should be isotropic and un-polarized. A GHz telescope would be very similar to a fluorescence one, but with the fundamental advantage of a 100% duty cycle.
The new technique has been proposed after the first observation of the GHz radiation from air shower plasmas Gorham-SLAC . This was measured at the Stanford Linear Accelerator Center (SLAC) using a 28 GeV electron beam. The measurements have been performed in a 1 m3 copper anechoic Faraday chamber in the frequency band 1.56.0 GHz. Before entering into the chamber, the beam was collided with a 90% Al2O3 10% SiO2 target. The signal was found to decay exponentially with 10 ns and to scale with the square of the beam energy, indicating that the emission is fully coherent. The measured density flux of the radiation was .
Due to the high potential of an MBR telescope, in the past few years several activities started trying to address the feasibility of this new detection technique. AMBER Gorham-SLAC ; Imen-Arena2014 , MIDAS Imen-Arena2014 ; midas and EASIER Imen-Arena2014 are prototype GHz detectors installed at the Auger Observatory. Another detector, CROME, has been set up within the KASCADE-Grande array crome . Several shower candidates have been detected, but the emission mechanism has not been identified. In general, the measurements disfavour the hypothesis of coherent emission, which is in contrast to what has been reported in Gorham-SLAC .
Other measurements have been done using a 3 MeV electron beam of the Van de Graaff at the Argonne National Laboratory (USA) maybe and using a 95 keV electron beam from an electrostatic gun conti . Both experiments reported a linear scaling of the radiation intensity with the beam energy, which means that the radiation is not emitted coherently. Moreover the measured intensity is significantly lower than the one reported in Gorham-SLAC .
It is worth noting that the inconsistencies between the recent measurements and the first test performed at SLAC Gorham-SLAC could be due to several factors. Although the MBR is a well known process in plasma physics, there are many uncertainties in the estimate of the emitted intensity Gorham-SLAC ; Imen-theory . For example, the density of the plasma could affect significantly the degree of coherence of the radiation and in general, the plasma conditions could depend on the individual source of particles.
The aim of the AMY experiment is to study the MBR emission in a wide frequency range, between 1 and 20 GHz, using the electron beam of the BTF, Frascati. Contrary to the other experiments, the running conditions of AMY are rather similar to the ones of Gorham-SLAC . In this paper we present the experimental apparatus and the first results of the measurements.
2 The experimental apparatus
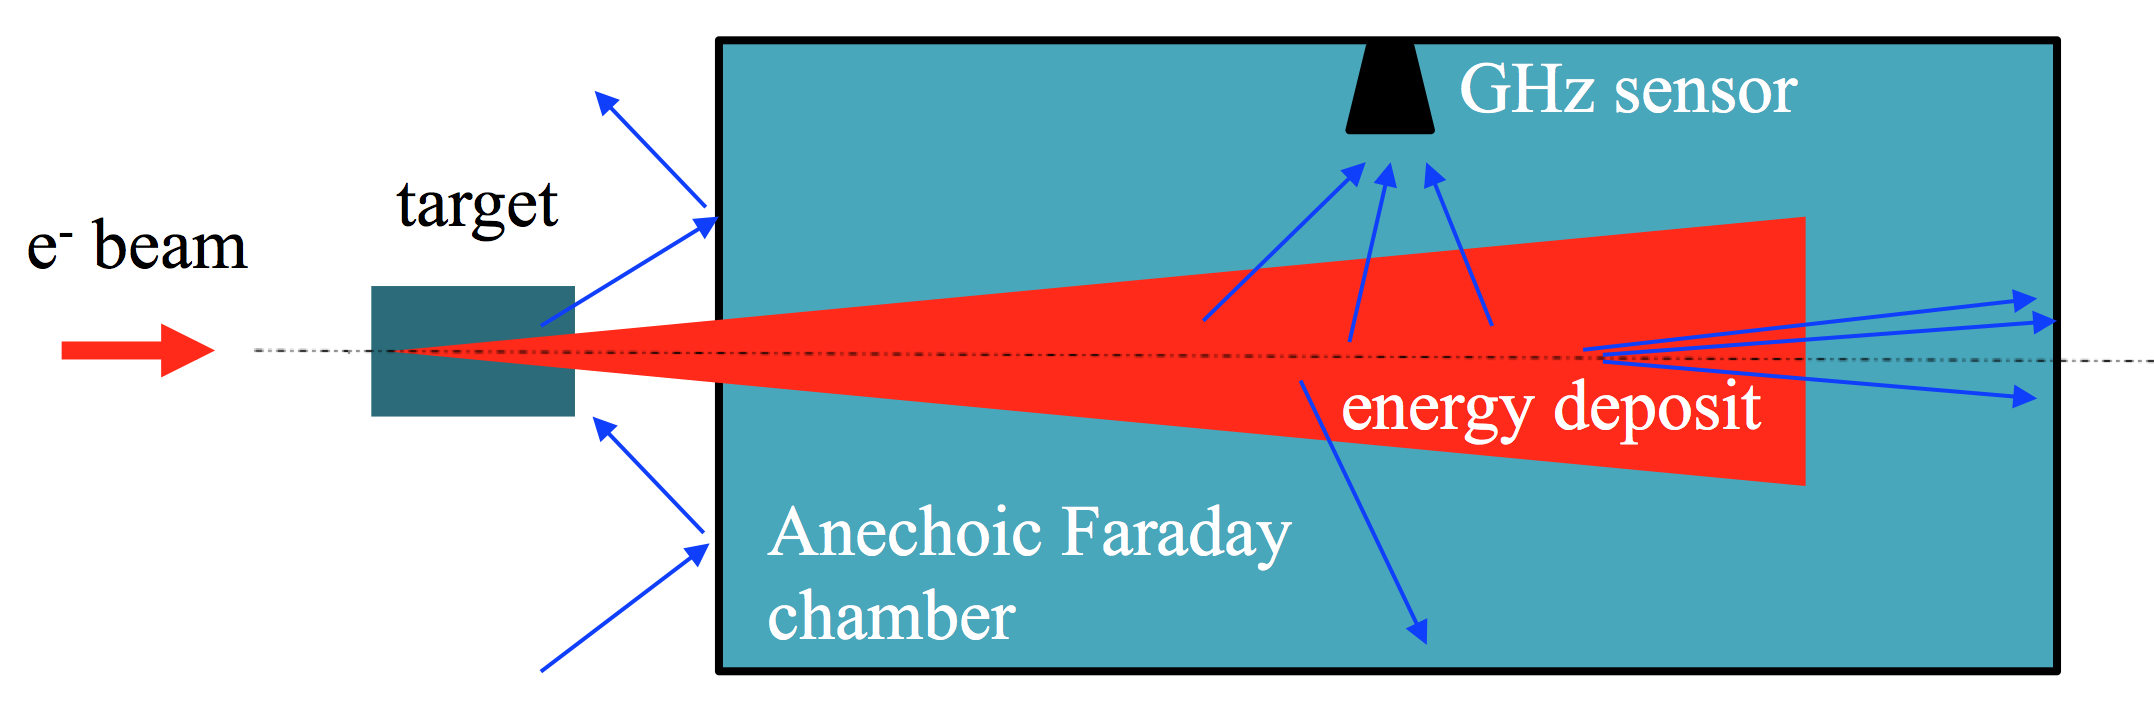
A sketch of the AMY experiment is shown in Fig. 1. The radiation is observed with GHz sensors within an anechoic Faraday chamber, which prevents the background and reflected radiation produced in the BTF hall from entering into the chamber. The beam collides with an interaction target of a variable thickness. This allows to study the MBR radiation as a function of the energy deposit inside the chamber. In fact, since the MBR is expected to be produced by the secondary electrons, its intensity should be proportional to the energy deposited as in the case of the fluorescence radiation.
2.1 The accelerator beam and the interaction target
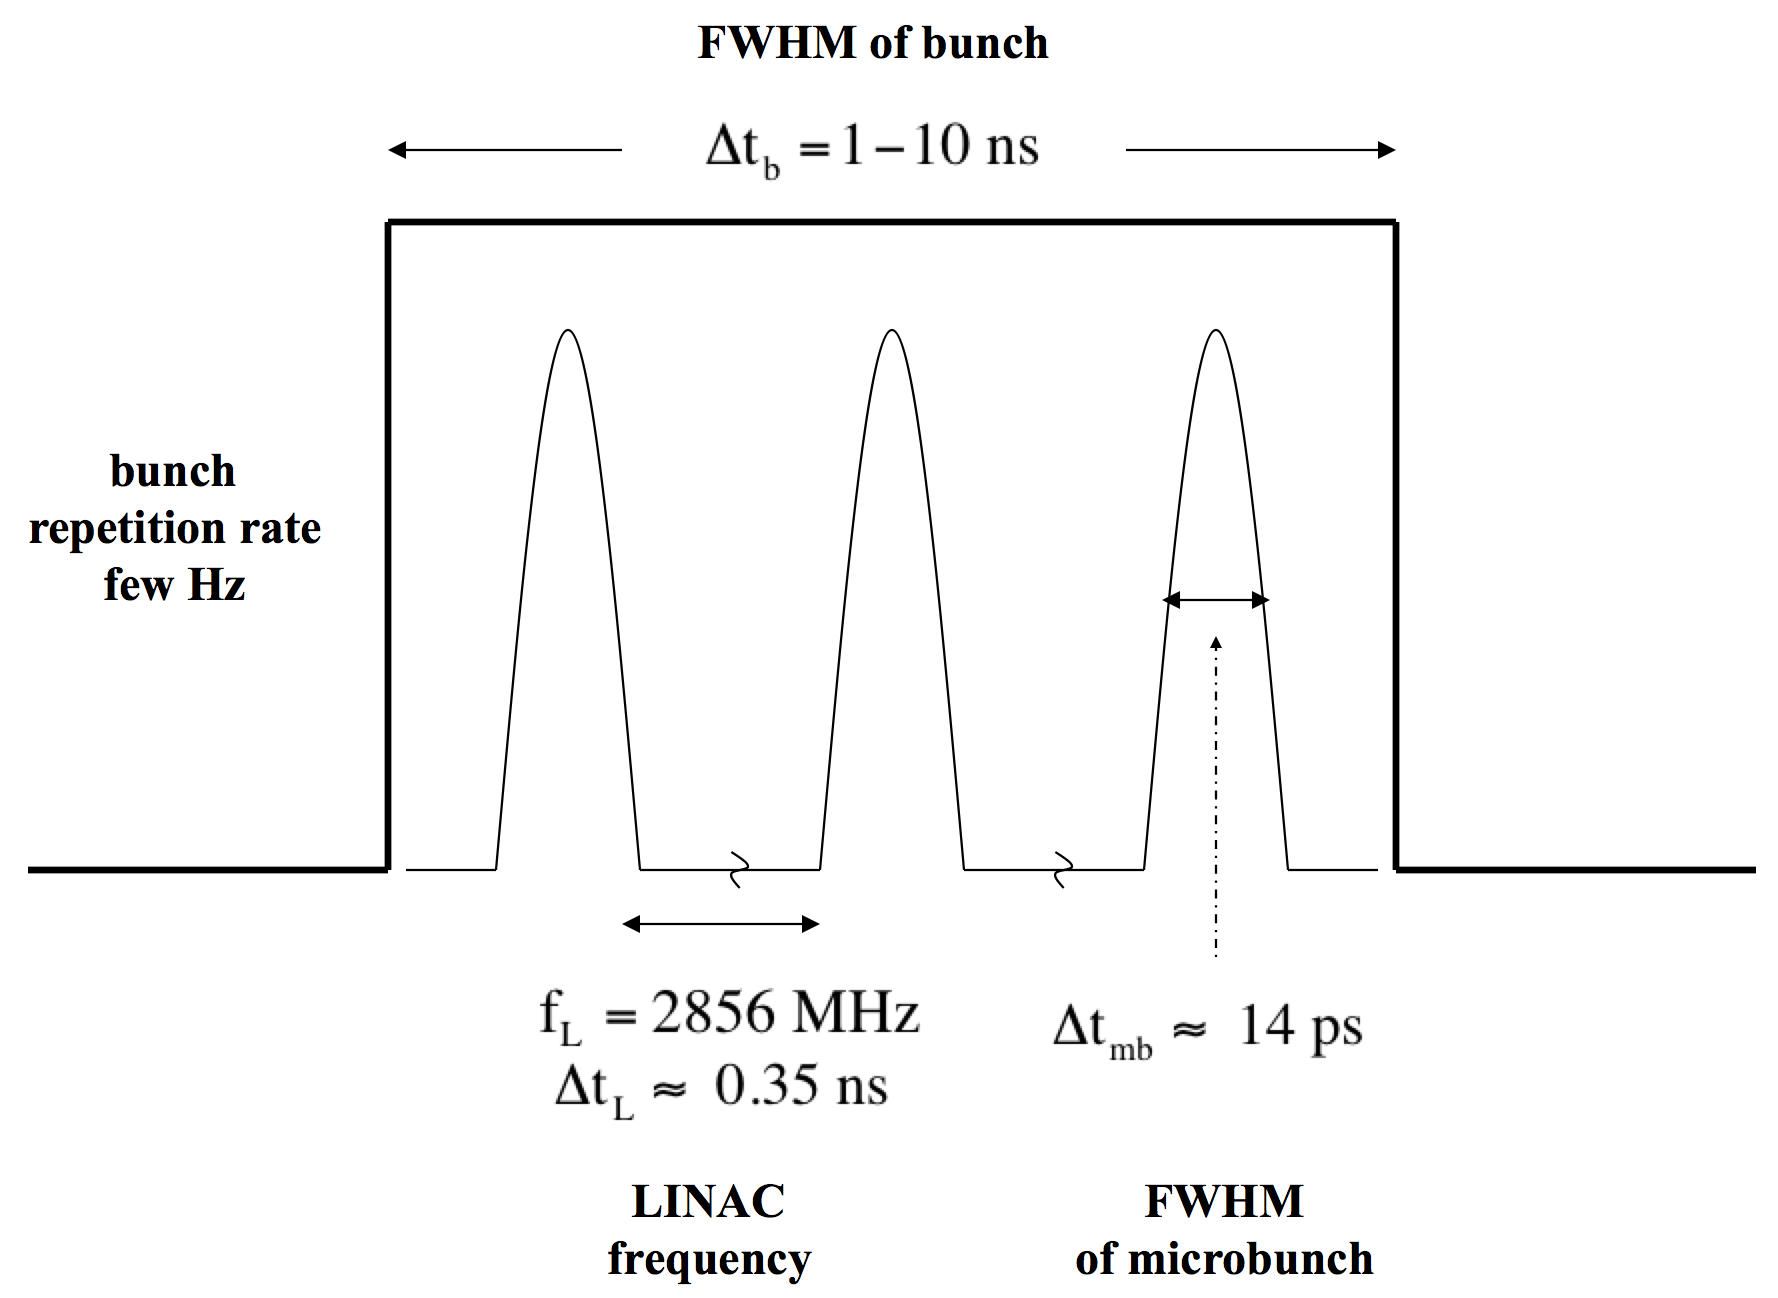
BTF btf is a part of the DANE accelerator complex, which is composed of a dedicated transfer line, driven by a pulsed magnet, that allows to divert electrons or positrons from the end of the high intensity LINAC towards a 100 m2 experimental hall. The LINAC can provide electron bunches with a charge up to /pulse, in an energy range between 25 and 750 MeV, with a bunch length between 110 ns and a maximum repetition rate of 50 Hz. The bunches accelerated by the LINAC are made of several microbunches with a FWHM of 14 ps separated by 0.35 ns, which corresponds to the inverse of the LINAC frequency 2.856 GHz (see the left panel of Fig. 2). The beam intensity is measured by an Integrating Current Transformer BERGOZ ICT 122-070-05-1 placed at the end of the beam pipe in the BTF hall.
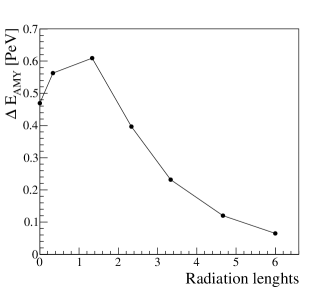
The interaction target consists of 95% pure Al2O3. It is made by six modules remotely controlled by a pneumatic system. Two modules have thickness of 10 cm, three of 7.5 cm and one of 2.5 cm. The maximum thickness is then 45 cm which corresponds to about 7 radiation lengths (X0). The energy deposit within the chamber is simulated using the Geant4 geant4 software. The right panel of Fig. 2 shows the energy deposited by the typical beam used by AMY, electrons with energy 510 MeV. The energy deposit is shown for the various thickness of the target. We have also simulated the energy deposit in the SLAC test Gorham-SLAC . At the maximum, our energy deposit is about a factor 6 larger.
We have done three measurement campaigns, one in 2011 and two in 2012. The first two campaigns were very useful to study and improve the running conditions and the experimental apparatus. The bunch length was 10 ns, 3 ns and 1.5 ns. The latter was available only in the last test of 2012.
2.2 The anechoic Faraday chamber and the DAQ system
The anechoic Faraday chamber was built at the mechanical shop of the physics department of the Roma Tor Vergata university. The dimensions of the chamber (2 m width 4 m long) are mainly constrained by the space available in the BTF hall. To facilitate its
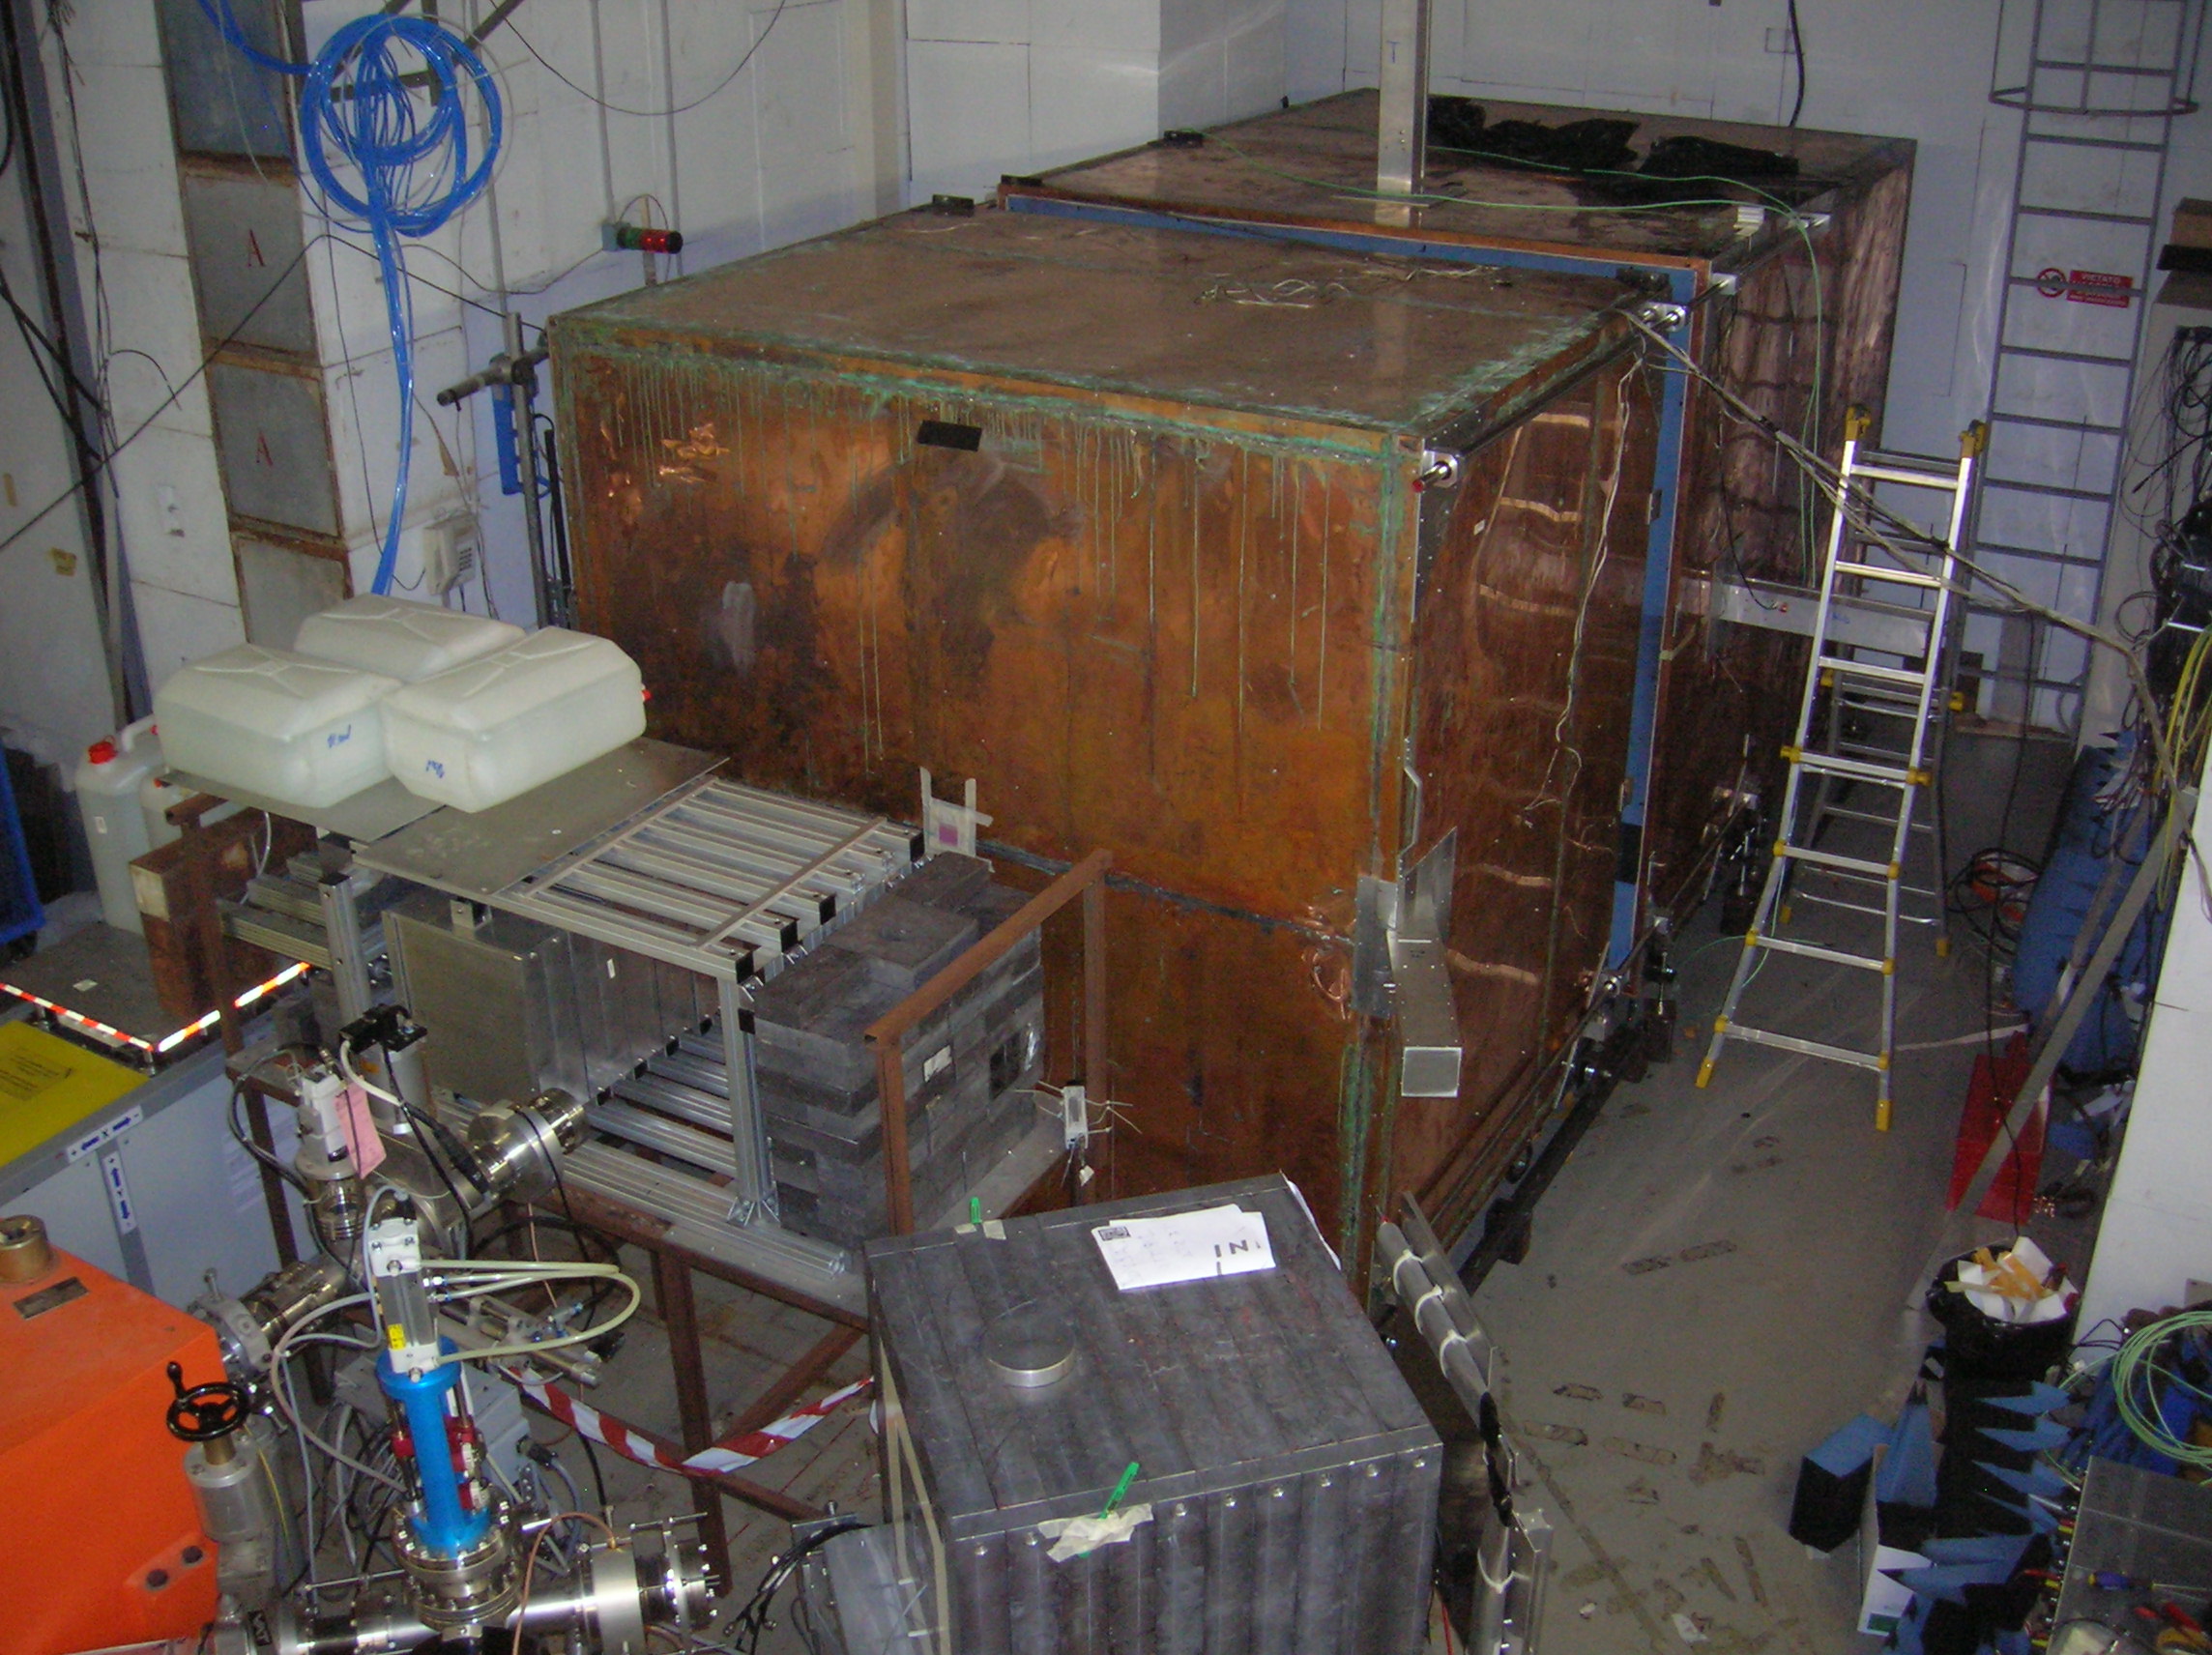
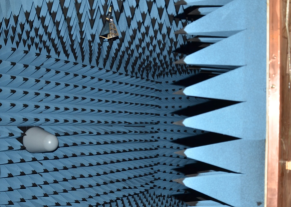
transportation to the BTF, the chamber has been built in 3 modules: two have a length of 1.5 m and one is 1 m long. The left panel of Fig. 3 shows the chamber installed at the BTF. The outer surface is covered by copper and connected to ground. The inner surface of the chamber (see right panel of Fig. 3) is covered by pyramidal RF absorbers (AEP-12 model), which have a height of 30 cm and an absorption range from 35 dB at 1 GHz to 45 dB at 6 GHz and 50 dB at higher frequencies. The shielding of the chamber from outside radiation is better than 80 dB above 2 GHz and it decreases quickly at lower frequencies (at 1 GHz it is 50 dB).
The AMY chamber may host the radio receivers in 5 different positions (corresponding to the aluminum boxes visible in Fig. 3). The support of the radio receivers allows us to change the distance of the antennas from the beam axis and to rotate their polarization plane.
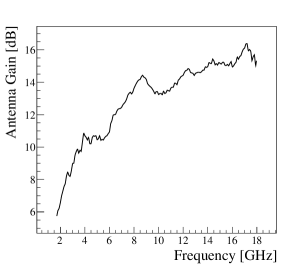
The receivers are two Rohde&Schwarz (R&S) HL050 log-periodic antennas and two RF Spin Double Ridged Waveguide Horn DRH20. Both types of antennas are linearly polarized and operate in a broadband range of input frequencies, from about 1 to 20 GHz. The antennas have been calibrated at the SATIMO StarLab calibration system satimo . The gain of the horn as a function of the frequency is shown in the left panel of Fig. 4.
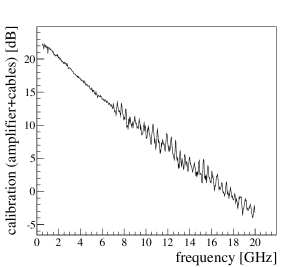
The output signal of each radio receiver was amplified by about 26 dB using the Minicircuits wide band amplifier ZVA-213-S+ (800 MHz21 GHz). The signals were sent through 20 m low loss cables to the control room and acquired by a Lecroy SDA 830Zi-A oscilloscope, which has four input channels with a 20 GHz real time bandwidth and a sampling rate of 40 GS/s. The channels were calibrated using a Rohde&Schwarz SMF100A signal generator (range 100 kHz22 GHz) and a Rohde&Schwarz SFSV30 spectrum analyzer (range 9 kHz-30 GHz and 40 MHz bandwidth). The overall calibration curve including the amplifier and cables is shown in the right panel of Fig. 4. The loss at higher frequencies is due to the cables.
3 Data analysis
The key point of the measurement is the understanding of high background arising from the Cherenkov and transition radiations produced by the relativistic electrons. These radiations are linearly polarized in the plane containing the beam axis and the direction of the radiation.

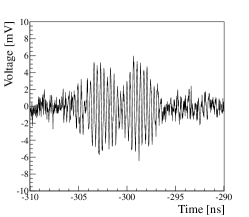
When the antenna polarization plane is parallel to the beam axis (co-pol configuration) the antenna signal is very high and dominated by the Cherenkov contribution as shown in the left panel of Fig. 5. When the polarization plane is perpendicular to the beam axis (cross-pol configuration) the signal is much lower as shown in the right panel of Fig. 5.
The signal has a double peak structure, clearly evident in the cross-pol configuration. We have made several tests that have excluded that this time structure is due to reflections in the electronic chain and in the chamber. Contrary to the first peak, the second one is un-polarized. This is shown in the central panel of Fig. 5 where the co-pol signal of the left panel was acquired with the oscilloscope scale saturated, increasing in this way the sensitivity to low signals.
The second peak is very interesting because it is un-polarized, which is the experimental signature of the MBR that distinguishes it from the Cherenkov radiation. Moreover, it is slightly delayed in time and this is consistent with MBR and Cherenkov signals respectively dominated by the emission at the center and the beginning of the chamber.
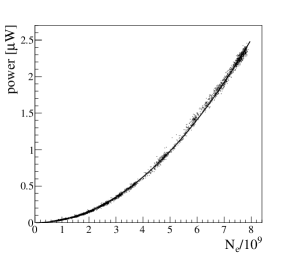
The cross-pol signal was found to be fully coherent. The power of the signal as a function of the number of electrons per bunch is well described by a quadratic power law as shown in the left panel of Fig. 6. The power has been calculated from the root mean square of the oscilloscope trace in a time window around the signal and subtracting the background contribution calculated using the beginning of the trace, when the beam is not yet present in the chamber.
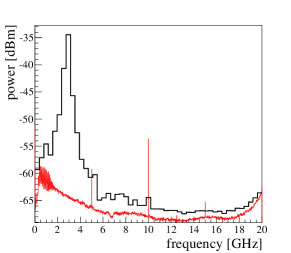
The right panel of Fig. 6 shows the frequency spectrum of the signal (black) obtained using the Fourier Transform of the oscilloscope traces and averaging over many events. The contribution from the background is shown in red. The spectrum is dominated by a peak centered at the LINAC frequency ( = 2.856 GHz). The data refer to the cross-pol signal with a target of 2.3 X0 thickness. The same analysis applied to the co-pol signal shows the same feature. In addition, the large intensity of the co-pol signal allows to point out the presence of other peaks at multiples of .
We have developed a detailed simulation of the Cherenkov contribution according to the model developed in jaime . The simulation qualitatively reproduces the observed spectrum. The peaks of the signal are due to the constructive interference of the radiation emitted by the beam microbunches and the power of the signal scales quadratically with the beam intensity. Therefore we conclude that the coherence of the cross-pol signal is induced by the LINAC. This implies that the process generating the cross-pol signal is very prompt and we can not exclude that it could arise from the Cherenkov emission.
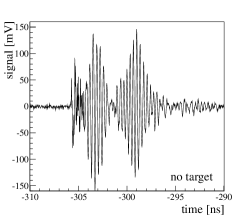
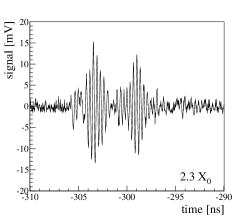
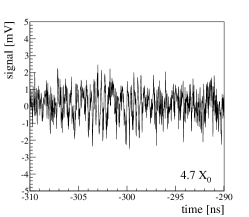
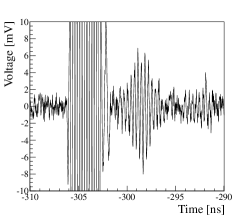
Another important feature of the cross-pol signal is the dependence between its intensity and the thickness of the interaction target. Fig. 7 shows the raw oscilloscope traces for when there is no target and for 2.3 and 4.7 X0. The signal decreases from 100 mV to 1 mV which corresponds to a factor in power. This fall of the power can not be explained by the change of the energy deposit, which is only a factor 5 (see Fig. 2). A similar trend has been observed for the co-pol signal. This behavior is interpreted as the result of a loss of coherence, which is caused by a larger average distance between the electrons after their collision with the target.
4 Conclusions
We have presented the AMY experiment and the first results of the measurements done at BTF, Frascati. We do not confirm the previous results obtained at SLAC Gorham-SLAC . The observed signal seems to be very prompt like the Cherenkov radiation and the coherence is certainly caused by the particular time structure of the beam. The AMY measurements can be used to put an upper limit on the intensity of the MBR process. The best limit can be obtained with the largest target thickness. The analysis is still preliminary. Using the signal with 4.7 X0, the calibration of the detector and considering that the signal is mainly concentrated in a narrow bandwidth of about 1 GHz around the LINAC frequency, we obtain a density flux W/m2/Hz.
References
- (1) P. W. Gorham et al., Phys. Rev. D 78, (2008) 032007
- (2) The Pierre Auger Collaboration, Nucl. Instrum. Meth. A 523, (2004) 50
- (3) H. Sagawa, TA Collaboration, Proc. 33rd ICRC 2013, Rio de Janeiro, Brazil icrc2013-0128 and references therein
- (4) V. Verzi, Pierre Auger Collaboration, Proc. 33rd ICRC 2013, Rio de Janeiro, Brazil icrc2013-0928, arXiv:1307.5059 [astro-ph]
- (5) I. Al Samarai, “Radio detection of Cosmic Rays in the GHz band at the Pierre Auger Observatory”, these proceedings
- (6) J. Alvarez-Muñiz et al., Phys. Rev. D 86, (2012) 051104(R)
- (7) R. Smida et al., arXiv:1108.0588v2 [hep-ex]
- (8) M. Monasor et al., arXiv:1108.6321
- (9) E. Conti et al., arXiv:1408.5886 [astro-ph]
- (10) I. Al Samarai et al., arXiv:1409.5051 [astro-ph]
- (11) G. Mazzitelli et al., Nucl. Instr. and Methods A 515, (2003) 524
- (12) S. Agostinelli et al., Nucl. Instrum. Meth. A 506, (2003) 250
- (13) L. J. Foged and A. Scannavini, Radioengineering, VOL. 18, NO. 4, 461, 2009
- (14) J. Alvarez-Muñiz et al., Phys.Rev. D 81, (2010) 123009