A WISE Survey of Circumstellar disks in the Upper Scorpius Association11affiliation: Based on observations made with the Wide-field Infrared Survey Explorer, the Two Micron All Sky Survey, the Gaia mission, the United Kingdom Infrared Telescope Infrared Deep Sky Survey, the NASA Infrared Telescope Facility, the Cerro Tololo Inter-American Paranal Observatory, the Southern Astrophysical Research Telescope, and the Spitzer Space Telescope.
Abstract
We have performed a survey for new members of the Upper Sco association that have circumstellar disks using mid-infrared photometry from the Wide-field Infrared Survey Explorer (WISE). Through optical and near-infrared spectroscopy, we have confirmed 185 candidates as likely members of Upper Sco with spectral types ranging from mid-K to M9. They comprise 36% of the known disk-bearing members of the association. We also have compiled all available mid-infrared photometry from WISE and the Spitzer Space Telescope for the known members of Upper Sco, resulting in a catalog of data for 1608 objects. We have used these data to identify the members that exhibit excess emission from disks and we have classified the evolutionary stages of those disks with criteria similar to those applied in our previous studies of Taurus and Upper Sco. Among 484 members with excesses in at least one band (excluding five Be stars), we classify 296 disks as full, 66 as evolved, 19 as transitional, 22 as evolved or transitional, and 81 as evolved transitional or debris. Many of these disks have not been previously reported, including 129 full disks and 50 disks that are at more advanced evolutionary stages.
Subject headings:
accretion, accretion disks - brown dwarfs - protoplanetary disks - stars: formation - stars: low-mass - stars: pre-main sequence1. Introduction
Thorough surveys for the disk-bearing members of nearby star-forming regions and young associations are important for studies of the evolution of circumstellar disks. The Upper Scorpius subgroup (11 Myr; Pecaut et al., 2012) in the Scorpius-Centaurus OB association is a particularly valuable laboratory for studying disk evolution. It contains one of the nearest and richest populations of disk-bearing stars ( pc, , Preibisch & Mamajek, 2008; Luhman & Mamajek, 2012, this work) and those disks span a wide range evolutionary stages (Carpenter et al., 2009). In addition, because the natal cloud has dispersed, the members have relatively low extinction (), enabling observations of ultraviolet and optical signatures of accretion.
Most of the known circumstellar disks in Upper Sco have been identified using mid-infrared (IR) photometry from the Spitzer Space Telescope (Werner et al., 2004) and the Wide-field Infrared Survey Explorer (WISE; Wright et al., 2010; Rieke et al., 2005; Carpenter et al., 2006, 2008, 2009; Chen et al., 2005, 2011; Riaz et al., 2009, 2012; Luhman & Mamajek, 2012; Rizzuto et al., 2012, 2015; Dawson et al., 2013; Pecaut & Mamajek, 2016). However, no study has searched all known members for evidence of disks in a uniform manner. In addition, the current membership list for Upper Sco is likely to be incomplete, so the same is likely true for the disk-bearing members as well. To work towards a more complete census of disks in Upper Sco, we have performed a survey for new disk-bearing members using data from WISE and wide-field optical and near-IR surveys (Section 2) and we have classified the disks among all known members with the methods applied to an earlier compilation of members by Luhman & Mamajek (2012) (Section 3).
2. Identification of New Disk-bearing Members of Upper Sco
2.1. Boundary between Upper Sco and Ophiuchus
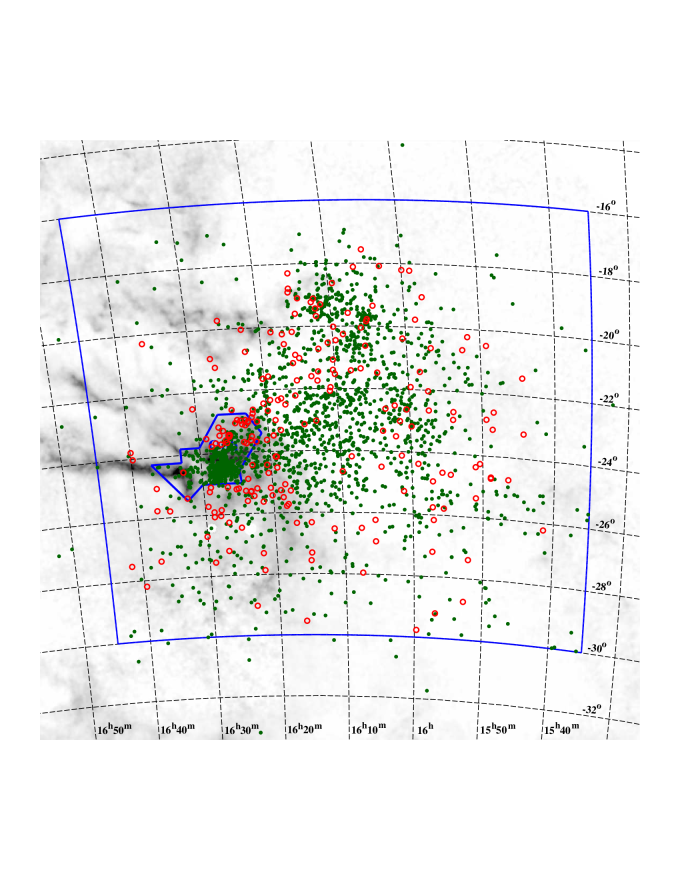
The Ophiuchus star-forming region (1 Myr, Wilking et al., 2008) is projected against the eastern edge of Upper Sco, as illustrated in Figure 1. To help define our survey field for Upper Sco, we describe our selection of a boundary between the two populations.
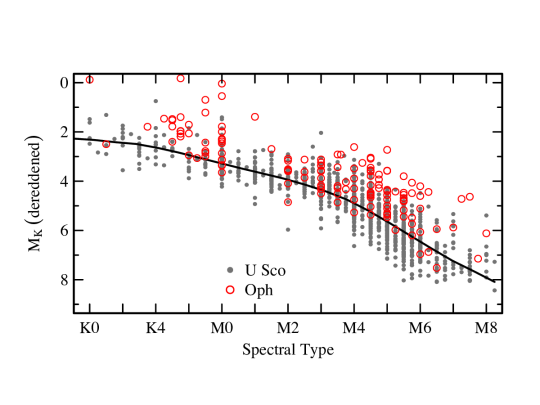
We have compiled a list of all stars that have been identified as likely members of either Upper Sco or Ophiuchus (Wilking et al., 2008; Luhman et al., 2018, references therein). We adopted near-IR photometry for those stars from the Point Source Catalog of the Two Micron All Sky Survey (2MASS; Skrutskie et al., 2006) and the tenth data release of the United Kingdom Infrared Telescope Infrared Deep Sky Survey (UKIDSS; Lawrence et al., 2007). When both catalogs contained photometry for a given star, we adopted the measurement with the smaller error. We estimated the extinction for each object using (or when was unavailable) and the intrinsic photospheric values from Luhman et al. (2010) and Pecaut & Mamajek (2013). We calculated extinction-corrected absolute magnitudes in () for the stars that have parallax measurements with errors of 10% from the second data release (DR2) of Gaia (Gaia Collaboration, 2016, 2018). In Figure 2, we plot extinction-corrected as a function of spectral type for the members of Upper Sco from Luhman et al. (2018) and the Ophiuchus members projected against the L1688 cloud. The members of the latter are systematically brighter at a given spectral type, which is a reflection of its younger age.
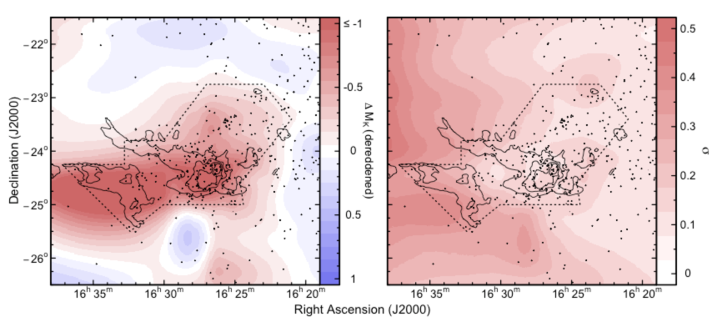
We have used the brighter values of for members of Ophiuchus to define a spatial boundary between Ophiuchus and Upper Sco. We computed the median values of extinction-corrected as a function of spectral type for Upper Sco by applying local linear quantile regression with the function lprq in the R package quantreg (Koenker, 2016). For each young star in the vicinity of Ophiuchus, we calculated the offset in extinction-corrected from the median sequence of Upper Sco (). Negative values of correspond to positions above (brighter than) the sequence for Upper Sco. We derived the average as a function of spatial position using a single order local regression (LOESS) as implemented in R (R Core Team, 2013), which we show in Figure 3. We also include in Figure 3 estimates of the errors in those average values of , which are based on bootstrapping. The Ophiuchus cloud core as well as large areas to the east and north contain stars that are significantly brighter, and hence younger, than the median sequence for Upper Sco. We have selected a boundary for Ophiuchus that encompasses the dark clouds and the areas in which and the corresponding errors are low. The resulting boundary is defined in Table 1 and is marked in Figures 1 and 3. We use this boundary for separating young stars into membership lists for Upper Sco and Ophiuchus in our survey and in Luhman et al. (2018). However, a single spatial boundary is unlikely to be sufficient to fully separate the two populations. In fact, multiple populations are likely present within the region that we have defined for Ophiuchus (Bouvier & Appenzeller, 1992; Martín et al., 1998; Wilking et al., 2005). For instance, Pillitteri et al. (2016) have identified a cluster of stars surrounding the star Oph that is noticeably older than the stars associated with the cloud core (which is south of Oph).
2.2. Candidate Members from WISE
Our survey for new disk-bearing members of Upper Sco is based primarily on data from the WISE mission (Wright et al., 2010). During its fully cryogenic phase between January and July of 2010, WISE obtained images of the entire sky in four bands centered at 3.4, 4.6, 12, and 22 m, which are denoted as through . The telescope continued to collect data in , , and through September of 2010 with cryogens remaining in one of its two tanks. Following exhaustion of the second tank, WISE operated in and through January of 2011 (NEOWISE, Mainzer et al., 2011). The images exhibited an angular resolution of and for through and , respectively. Data from the fully cryogenic phase and the entire 13-month mission were released in the WISE All-Sky Source Catalog and the AllWISE Source Catalog, respectively. We initially used the WISE All-Sky Catalog for our survey. We repeated our analysis with the AllWISE Source Catalog when it was released.
We began our search by retrieving all WISE sources between right ascensions () of 15h35m and 16h45m and declinations () of and (J2000), which encompass most of the known members of Upper Sco (Figure 1). For our survey of Upper Sco, we focused on WISE sources that are outside of the boundary of Ophiuchus that was adopted in the previous section. In addition, we have considered only sources that have errors in and and are not flagged as a diffraction spike in either of those bands by the parameter cc_flag. Measurements in and with errors were not used.
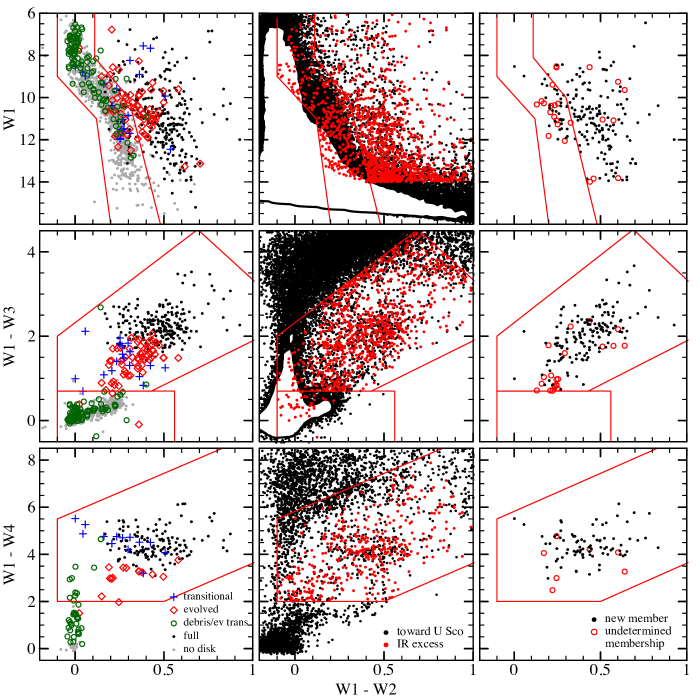
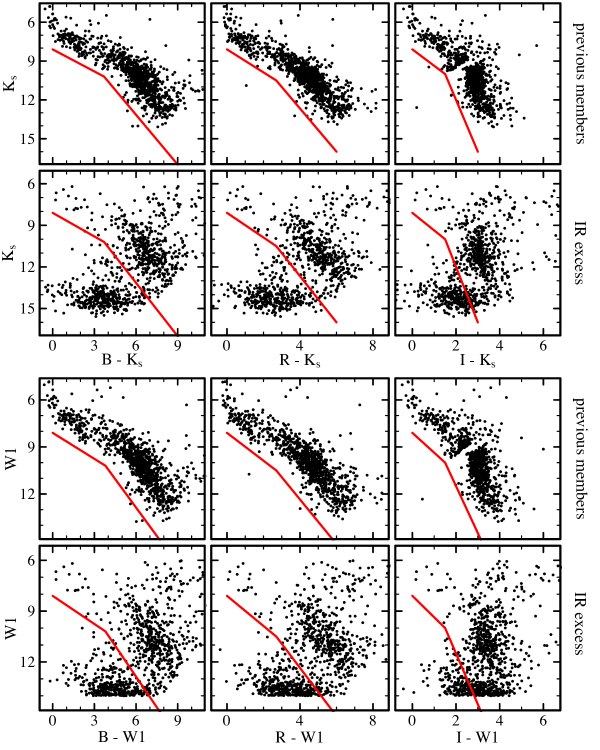
We have constructed a color-magnitude diagram (CMD) and two color-color diagrams from the WISE data for the known members of Upper Sco, which are shown in the left column of Figure 4. The members that have disks are indicated (Section 3.3). In each diagram, the members without excesses form a sequence or clump with bluer colors while members with excesses have a broader distribution of redder colors. We defined boundaries in those diagrams that separate members with and without excesses. Although colors of indicate an excess relative to photospheric values, we adopted a boundary of because of the large number of sources at –2, nearly all of which are probably nonmembers. As a result, our survey is not sensitive to disk-bearing stars with small excesses in . We note that WISEA J161935.70195043.0 (EPIC 205008727, Cody et al., 2017) is the reddest known member in the WISE colors with and , placing it beyond the limits of the diagrams in Figure 4. Its colors are indicative of a protostar or a star with an edge-on disk. The presence of the former in Upper Sco would be surprising given the age of the association. The optical spectrum from Cody et al. (2017) exhibited strong continuum veiling and emission lines and a spectral type of K7–M3. Our near-IR spectrum of the star shows similar characteristics.
In the middle column of Figure 4, we show the CMD and color-color diagrams for WISE sources toward Upper Sco that are not known members of the association. We have marked sources that exhibit an IR excess in at least one diagram (based on the boundaries that we have defined), have excesses in all available bands longward of the shortest wavelength at which an excess is present, and have . Sources that lack detections in bands at longer wavelengths are included as candidates only if those limits are consistent with an excess. These criteria produced 800 candidate disk-bearing members of Upper Sco.
2.3. Additional Membership Constraints
In a large survey field like the one that we have considered in Upper Sco, candidate disk-bearing objects identified with WISE photometry can contain significant contamination from field stars and galaxies (Esplin et al., 2014). As a result, we have attempted to further refine our sample of WISE candidates by applying additional membership constraints.
We visually inspected the images of the candidates from WISE, 2MASS, and the Digitized Sky Survey. We rejected candidates that moved noticeably between different epochs (i.e., those with high proper motions), appeared to be galaxies based on their extended emission, or were not reliably detected or were blended with other objects in the WISE bands that seemed to show excesses. We also removed sources that have been classified as field stars or galaxies through spectroscopy from previous studies.
To check whether the WISE candidates have optical and near-IR data that are consistent with membership in Upper Sco, we have plotted in Figure 5 CMDs for the previously known members and the candidates using , from the U.S. Naval Observatory B1.0 Catalog (USNO-B1.0; Monet et al., 2003), and from the 2MASS Point Source Catalog. For sources with detections in both USNO epochs, we have adopted the more recent measurements. In each diagram, we defined a boundary that follows the lower envelope of the sequence of known members, as indicated in Figure 5. Candidates that appear below any of those boundaries are rejected. We note that CMDs in additional optical and near-IR bands can be constructed for Upper Sco with more recent wide-field surveys like UKIDSS, Gaia (Perryman et al., 2001), and Pan-STARRS1 (Kaiser et al., 2002, 2010).
Some of the WISE candidates appear within the Spitzer images that have been obtained for small portions of Upper Sco. We retrieved the available photometry for those candidates from the Spitzer Enhanced Imaging Products (SEIP) Source List. We checked whether the Spitzer data show excesses indicative of disks for the WISE candidates that have excesses in and that lack detections in and . Known members of Upper Sco with excesses at have colors between the 5.8 and 8.0 m bands of Spitzer that are greater than 0.3. Therefore, we rejected the WISE candidates that are bluer than that threshold.
Finally, we checked whether our candidates from WISE have proper motions that are consistent with membership using data from the fourth and fifth releases of the U.S. Naval Observatory CCD Astrograph Catalog (UCAC4,UCAC5, Zacharias et al., 2013, 2017). Candidates are retained if the 1 errors of their motions overlap with a radius of 10 mas yr-1 from the median value of the motions of known members. This criterion is satisfied by 90% of the known members. A more detailed description of the UCAC5 motions for the known members of Upper Sco is provided by Luhman et al. (2018).
The criteria in this section resulted in the rejection of % of the disk-bearing stars identified with WISE.
2.4. Spectroscopy of Candidate Members
2.4.1 Observations
We performed spectroscopy on 233 candidate disk-bearing stars to measure their spectral types and check for signatures of youth. Two of these candidates are components of a pair that is unresolved in the WISE data (WISEA J155101.25252310.0). Twelve candidates in our spectroscopic sample were initially identified with the WISE All-Sky Catalog and UCAC4 but are no longer candidates in our final analysis that uses the AllWISE Source Catalog and UCAC5. Ten of those stars lack mid-IR excesses or do not satisfy our proper motion criteria when using the latter catalogs. The remaining stars, WISE J160027.15223850.5 and WISE J160414.16212915.5, were absent from the AllWISE Source Catalog. Although our survey focuses on the area outside of our adopted boundary for Ophiuchus, we have included in our spectroscopic sample 29 candidates that appear within that boundary.
The spectra were taken with SpeX (Rayner et al., 2003) at the NASA Infrared Telescope Facility (IRTF), the Goodman High Throughput Spectrograph at the Southern Astrophysical Research Telescope (SOAR), and the Cerro Tololo Ohio State Multi-Object Spectrograph (COSMOS) and the Astronomy Research using the Cornell Infra Red Imaging Spectrograph (ARCoIRIS) at the 4 m Blanco telescope at the Cerro Tololo Inter-American Observatory (CTIO). The instrument configurations are summarized in Table 2. The dates and instruments are indicated for the targets in Upper Sco and Ophiuchus in Tables 3 and 4, respectively.
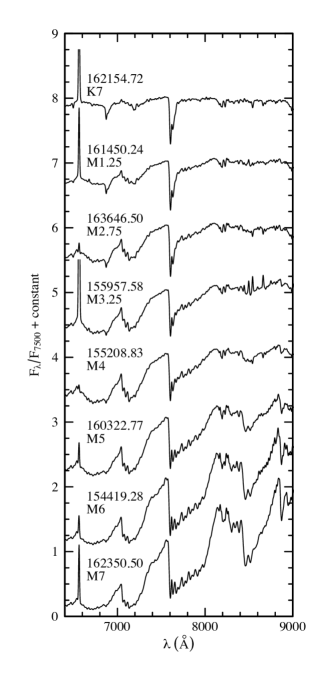
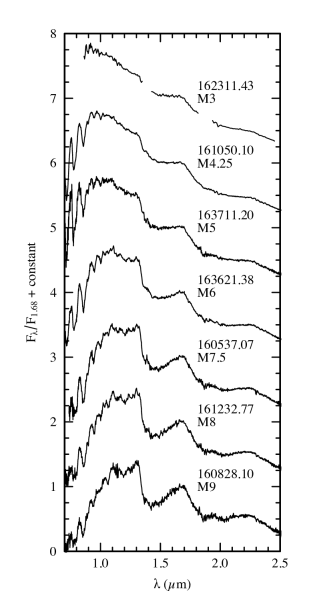
We reduced the Goodman and COSMOS spectra using routines in IRAF. The steps of reduction included flat-field correction, the extraction of spectra, and wavelength calibration. The SpeX data were reduced using the Spextool package (Cushing et al., 2004) and were corrected for telluric absorption in the manner described by Vacca et al. (2003). We reduced the ARCoIRIS data in the same manner as the SpeX data using a modified version of Spextool. Samples of the reduced optical and near-IR spectra are included in Figures 6 and 7, respectively. All of the reduced spectra from our survey are provided in electronic files that accompany those figures.
2.4.2 Spectral Classification
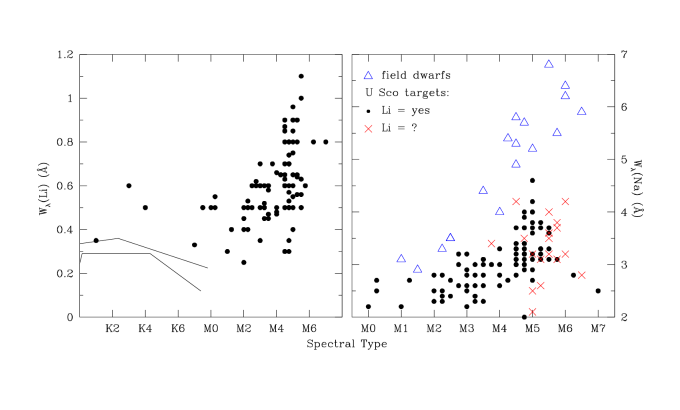
To determine whether the candidates in our spectroscopic sample are likely to be members of Upper Sco and Ophiuchus, we have measured their spectral types and checked their spectra for evidence of youth. Given the magnitude range of our candidates, they should have spectral types of K–M if they are members. Thus, any targets with earlier types are probably field stars. Among K and M types, we use Li I absorption and gravity-sensitive features (e.g., Na I, H2O; Martín et al., 1996; Luhman et al., 1997; Lucas et al., 2001) to distinguish young objects from field stars. In Figure 8, we show the Li and Na equivalent widths for K–M and M types, respectively, for our targets that were observed with optical spectroscopy with the exception of the stars classified as giants. We also include the upper envelopes for Li data in IC 2602 (45 Myr) and the Pleiades (125 Myr) from Neuhäuser et al. (1997) and measurements of Na for a sample of standard field dwarfs from our previous surveys and Filippazzo et al. (2016). All of the Li and Na data for our targets in Figure 8 are consistent with the youth implied by the IR excesses.
Dwarfs and giants were classified with optical and IR spectra of standards (Henry et al., 1994; Kirkpatrick et al., 1991, 1997; Cushing et al., 2005; Rayner et al., 2009). We also applied those standard spectra to optical and IR spectra of young stars at M5 and M0, respectively. We classified the optical spectra of young stars at M5 with the average spectra of standard dwarfs and giants (Luhman et al., 1997, 1998; Luhman, 1999) and we classified the IR spectra of young M-type stars with standard spectra based on optically-classified young stars (Luhman et al., 2017).
In Tables 3 and 4, we list the spectral types, membership classifications, and equivalent widths of Li and Na (when available) for our spectroscopic sample. We have classified 216 of the 233 candidates as young stars. Two of the young stars, WISEA J160104.73261653.5 and J162847.63262002.6, are not considered members of Upper Sco because their proper motions are inconsistent with membership (Tian et al., 2017). The remaining 214 young stars are adopted as members of Upper Sco (185) or Ophiuchus (29). Some (19) of these members have been independently uncovered by previous studies (Rizzuto et al., 2015; Ansdell et al., 2016; Pecaut & Mamajek, 2016; Cody et al., 2017; Best et al., 2017). Those stars can be identified in the compilation of known members of Upper Sco from Luhman et al. (2018) via the presence of spectral types from both this work and a previous study.
There remain 30 candidate disk-bearing stars in our survey field for Upper Sco that lack spectroscopy and that are not rejected by the criteria for CMDs and proper motions from Luhman et al. (2018). These stars are listed in Table 5 and are plotted in the CMD and color-color diagrams in the right column of Figure 4. We also include in those diagrams the new members of Upper Sco from this work.
2.5. Completeness of Census of Members with Disks
In the absence of severe crowding, the AllWISE Source Catalog is % complete at , , , and (Cutri et al., 2012, 2013). Meanwhile, our selection criteria include thresholds of , , , and . By combining the completeness limits of AllWISE with our criteria, we estimate that our sample of candidates should have % completeness for stars with excesses in , , and at , , and , respectively, which correspond to members with spectral types of M7.5, M4.5, and M0. Most disk-bearing stars have excesses that are at least 1–2 mag larger than the color thresholds that we have applied (see Figure 4), so the completeness limits for stars with excesses in and are likely fairly high down to even later spectral types than those estimates (M6 and M2). We have not obtained spectra of all disk-bearing candidates from our survey, but the number of remaining candidates that lack spectra (30) is small compared to the total number of known members with disks (500), so they have little effect on our assessment of the completeness of the census of disks in Upper Sco.
2.6. Membership Constraints from Gaia
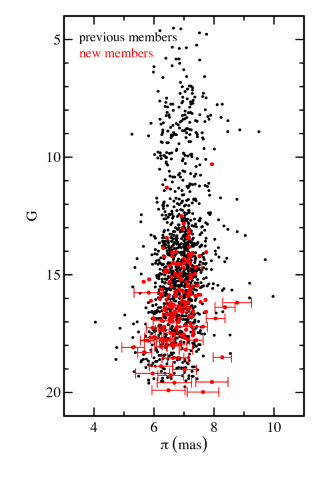
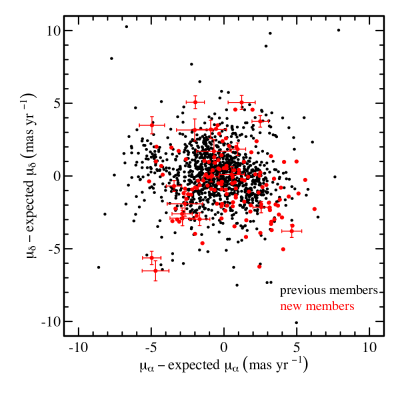
Gaia DR2 provides measurements of parallaxes and proper motions for most of the stars in our spectroscopic sample. We can use these data to assess the membership of the spectroscopic targets that we have classified as members of Upper Sco. In Figures 9, we plot Gaia versus parallax for the 1181 previously known members compiled by Luhman et al. (2018) and the 141 new members from our survey that have Gaia DR2 parallaxes with errors of %. We also compare these two samples in Figure 10, where we show the offsets in the Gaia proper motions relative to the motions expected for the positions and parallaxes of the stars assuming the median space velocity of known Upper Sco members that have radial velocity measurements from Gaia ( km s-1). In both diagrams, most of the stars that we have classified as new members have parallaxes and motions similar to those of the previously known members. Among the new members that are outliers in proper motion or parallax, all but one, WISEA J154126.53-261325.5, have large values of the parameter that characterizes the astrometric goodness of fit, which may indicate that the astrometry is erroneous, possibly because of a binary companion. WISEA J154126.53-261325.5 is on the outskirts of Upper Sco and is an outlier in proper motion but shows strong evidence of youth in its spectrum and in the presence of excess emission from a circumstellar disk. It may be a young interloper, but we adopt it as member of Upper Sco for purposes of this study.
3. Disk Classifications
3.1. Mid-IR Photometry
To identify the circumstellar disks in Upper Sco and to classify their evolutionary stages, we have compiled all available mid-IR photometry from Spitzer and WISE for the catalog of 1631 known members from Luhman et al. (2018), which includes the new members found in this study.
3.1.1 Spitzer
The images from Spitzer were obtained with the Infrared Array Camera (IRAC; Fazio et al., 2004) and the Multiband Imaging Photometer for Spitzer (MIPS; Rieke et al., 2004). IRAC produced images with a field of view of and FWHM of – in four bands centered at 3.6, 4.5, 5.8, and 8.0 m, which are denoted as [3.6], [4.5], [5.8], and [8.0]. For the band at 24 m ([24]) utilized in our work, MIPS produced images with a field of view of and a FWHM of .
We have adopted the IRAC and MIPS measurements that are available from Luhman & Mamajek (2012). For stars that were observed by Spitzer but that were absent from that study, we have measured aperture photometry from the SEIP mosaics. The photometry was measured with the phot task in IRAF using aperture radii of 2.5 pixels for [3.6] and [4.5] and 3 pixels for [5.8], [8.0], and [24]. The mosaic pixel scales were for IRAC and for MIPS. The inner/outer radii of the background annuli were 4/7, 4/7, 4/7, 5/7, and 5/7 pixels for the five bands, respectively. These measurements were calibrated so that the same methods applied to stars from Luhman & Mamajek (2012) produced photometry that matched the data in that study, on average. For members that were blended with other stars, we applied point spread function (PSF) subtraction to remove the contamination from the neighboring star prior to the aperture photometry. For each of the four bands of IRAC, the camera detected all members that were within its field of view with the exception of unresolved companions. At least one band of IRAC photometry is available for 447 members. Images from MIPS encompassed 579 members, 424 of which were detected. Our compilation of IRAC and MIPS photometry for known members of Upper Sco is presented in Table 6.
3.1.2 WISE
We have retrieved photometry in – for the known members of Upper Sco from the WISE All-Sky Catalog and the AllWISE Source Catalog. For bright stars, some data in and are subject to larger errors in the latter than the former (Cutri et al., 2013), so we have adopted the data at and from the All-Sky Catalog and otherwise have adopted the data from the AllWISE Source Catalog. We have omitted measurements at because of their large systematic errors (Cutri et al., 2012). For the members that lack entries in AllWISE, we inspected the WISE images to check for detections. When detections were present, we adopted any available measurements from the AllWISE Reject Table and the WISE All-Sky Source Catalog. For all members with WISE counterparts, we inspected the four bands of WISE images to check for false detections, contamination from diffraction spikes of other stars, blending with other stars, extended emission, and offsets in the centroids from shorter to longer wavelengths. The latter can indicate that a very red source (typically a galaxy) is blended with the target and is dominant in and . We excluded photometry of this kind if a contaminating source could be identified in other images with higher resolution (e.g., UKIDSS). Otherwise, if a contaminant could not be identified in other data, the presence of an offset centroid is noted in Table 6.
Our compilation of WISE data is included with the Spitzer photometry in Table 6. At least one band of WISE photometry is available for 1598 members. The members that lack WISE photometry are unresolved from brighter stars, saturated, or not detected. Table 6 contains a total of 1608 members that have photometry from either Spitzer or WISE. The remaining 23 known members that lack data from either facility are not included in Table 6. These objects are too faint for detection, unresolved from brighter stars or diffraction spikes, or saturated in all bands (Antares).
3.2. Measurements of Excess Emission
As done in a similar study of IRAC and WISE data in Upper Sco by Luhman & Mamajek (2012), we have searched for the presence of IR excess emission from disks among the known members of the association using colors between and [4.5], [8.0], [24], , , and . We have included our adopted values of in Table 6. When computing the colors, we have ignored data with errors and for [4.5]/[8.0] and [24]//, respectively. We have corrected the colors for extinction using the estimates of from Luhman et al. (2018) and the following extinction relations: , , , , , and (Ascenso et al., 2013; Schlafly et al., 2016; Xue et al., 2016, references therein).
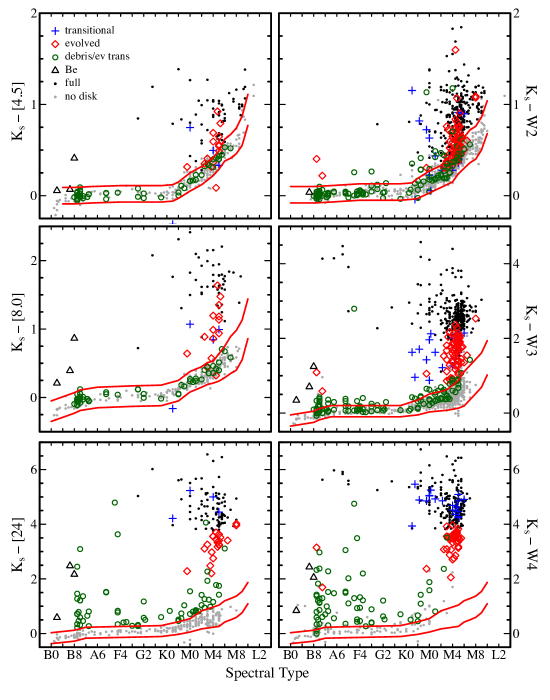
In Figure 11, we plot the extinction-corrected IR colors of the known members of Upper Sco as a function of spectral type. As in the WISE CMDs and color-color diagrams from Section 2, we have marked the stars with disks (Section 3.3). In each color, the data exhibit a well-defined sequence of blue colors that correspond to stellar photospheres and a wide range of redder colors that likely indicate the presence of excess emission from disks. To identify the stars that have color excesses, we began by deriving a fit to the photospheric sequence in each color. For the latest spectral types where some of the sequences are not well-populated, we adopted the colors of young photospheres measured in other star-forming regions (Luhman et al., 2010, K. Luhman in preparation). We did not attempt to identify excesses for objects later than L0 since their intrinsic colors are uncertain. In each color, we defined a boundary that follows the lower envelope photospheric sequence and used the reflection of that boundary above the sequence as a threshold for identifying excesses, as indicated in Figure 11. Similar criteria for excesses were applied to Spitzer and WISE data in Upper Sco and Taurus by Luhman & Mamajek (2012) and Esplin et al. (2014).
For WISE sources that have offset centroids in or (Section 3.1.2, “offset” in Table 6), we report an excess in those bands only if an excess is also present in bands at shorter wavelengths that do not show a shifted centroid. WISEA J160600.62195711.8 is a pair (based on UKIDSS images) that lacks resolved spectral types for its components and is not resolved by WISE, so it appears as a single entry in Table 6. The centroid for the pair appears to be centered on the southern component, which is therefore responsible for the excess. If a given band exhibited an excess but data at longer wavelengths were inconsistent with an excess, that band was not marked as showing an excess. The presence of an excess is marked as unknown or uncertain for some stars because of contamination by diffraction spikes, extended emission, or nearby stars. If only a marginal excess was present in a band and data at longer wavelengths were unavailable, the excess was marked as tentative. Among the 1608 members of Upper Sco that have photometry from either Spitzer or WISE (Table 6), we find excesses and tentative excesses in at least one band for 489 and 34 sources, respectively.
3.3. Disk Classes in Upper Sco
As done in our previous studies of disks in Upper Sco and Taurus (Luhman & Mamajek, 2012; Esplin et al., 2014), we have classified the evolutionary status of the circumstellar disks in Upper Sco using a scheme that includes the following classes (Kenyon & Bromley, 2005; Rieke et al., 2005; Hernández et al., 2007; Luhman et al., 2010; Espaillat et al., 2012): full disks are optically thick at IR wavelengths and lack significant clearing of primordial dust and gas; pre-transitional disks and transitional disks have large inner gaps or holes in their dust distributions, respectively; evolved disks are becoming optically thin but have not undergone significant clearing; evolved transitional disks are optically thin and have large holes; debris disks consist of dust produced by collisions of planetesimals.
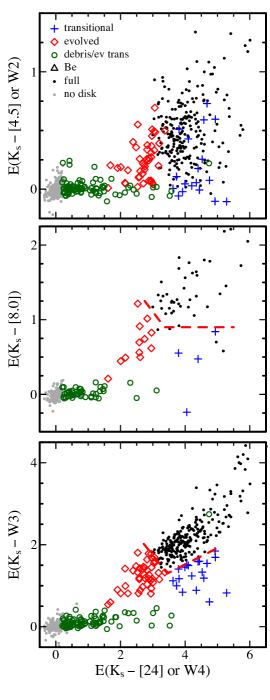
For members of Upper Sco found to exhibit IR excesses in the previous section, we have estimated disk classes using extinction-corrected color excesses (e.g., ), which are computed using the fits to the photospheric sequences in Figure 11 that we previously described. The resulting excesses at [4.5], [8.0], , and [24] are plotted in Figure 12. For sources that lack [4.5] or [24], we show the excesses in or . To distinguish full disks from disks that are more evolved, we have applied the color excess thresholds defined by Esplin et al. (2014) for , , and , which are indicated in Figure 12. We have modified the threshold in the diagram with and [24]/ so that it extends to (. Sources above at least one of the two boundaries shown in Figure 12 are classified as full disks. Pre-transitional disks are encompassed by these criteria for full disks. Among the remaining objects with bluer color excesses, we applied the same criteria for transitional, evolved, evolved transitional, and debris disks as in Esplin et al. (2014) except that we have revised the threshold for from 3.55 to 3.6 to slightly better align with a natural separation between transitional and evolved transitional/debris disks (see Figure 11). Although WISEA J161055.09253121.9 (HIP 79288) is above the full disk boundaries, it is treated as a debris or evolved transitional disk as in previous studies (Luhman & Mamajek, 2012, references therein). For stars that do not appear in Figure 11 because they lack photometry in one of the necessary bands for that diagram (particularly [24] and ), we have estimated the disk classes in the same manner as in Luhman & Mamajek (2012) and Esplin et al. (2014).
Our disk classifications are included in Table 6. Among the 484 members with excesses in at least one band (excluding five Be stars), we classify 296 disks as full, 66 as evolved, 19 as transitional, 22 as evolved or transitional, and 81 as evolved transitional or debris. Many of these disks have not been previously reported, including 129 full disks and 50 disks that are at more advanced evolutionary stages. In addition, we find tentative evidence for one evolved disk, three full disks, and 30 debris or evolved transitional disks. As mentioned in Section 2.2, one member of Upper Sco, WISEA J161935.70195043.0, has sufficiently red mid-IR colors that it appears to be an edge-on full disk or a class I protostar.
3.4. Comparison to Previous Classifications
For disks in Upper Sco that have been previously classified, most of our classifications agree with those from the previous studies (e.g., Luhman & Mamajek, 2012; Dawson et al., 2013; Rizzuto et al., 2015; Pecaut & Mamajek, 2016). We discuss a few exceptions in this section.
Cody & Hillenbrand (2018) identified a sample of 288 stars toward Upper Sco and Ophiuchus that exhibit mid-IR excess emission from disks and that have well-measured light curves from Kepler’s K2 mission. Among the 190 stars from that sample that are within our survey field for Upper Sco, 179 are in the compilation of known members that we have examined for disks (Luhman et al., 2018). We do not find IR excesses for three of those 179 stars, which consist of EPIC 210282528, EPIC 203385048, and EPIC 204637622 (WISEA J163334.90183254.4, WISEA J161816.17261908.3, WISEA J160420.97213041.6). An absence of disks is consistent with the K2 variability of those stars according to the analysis of Cody & Hillenbrand (2018). Among the 11 stars from Cody & Hillenbrand (2018) that are absent from the list of members that we considered, six are in our sample of remaining disk-bearing candidates that lack spectroscopy (EPIC 203716389, EPIC 203789325, EPIC 204347824, EPIC 204397879, EPIC 204487447, EPIC 204982702) and five did not satisfy the criteria we applied to the WISE data (EPIC 204495624, EPIC 204874314, EPIC 203604427, EPIC 203337814, EPIC 203082998). Among the latter five stars, EPIC 204495624 does show excesses in and but it was not selected as a candidate because the errors in those bands were too high for consideration. EPIC 204874314 has a small excess that is below our threshold. The other three do not appear to show excesses when unreliable WISE detections are excluded.
Lodieu et al. (2018) reported possible excesses in for two L-type members, UGCS J160731.61214654.4 (VISTA 16072146) and WISEA J161144.37221544.6 (VISTA J16112215). In images from UKIDSS, the former is from a pair of objects. These three UKIDSS sources are blended and appear as a single source in the images from WISE. The centroid of the WISE detection is roughly midway between the L-type object and the pair, indicating that the pair contribute significantly to the flux. As a result, we conclude that the WISE data cannot be used to assess the presence of a disk. For the other L-type member from Lodieu et al. (2018) with a possible excess, WISEA J161144.37221544.6, the intrinsic photospheric colors near its spectral type (L3) are too uncertain to determine whether an excess is present. Its value of is only slightly higher than our adopted threshold for L0 (see Figure 11). If the intrinsic colors of young L-type objects continue to become redder beyond L0, then its would not exhibit an excess.
4. Conclusion
We have performed a survey for new disk-bearing members of Upper Sco and have identified and classified the disks among all known members of the association. Our results are summarized as follows:
-
1.
We have identified candidate disk-bearing members of Upper Sco via mid-IR excesses in photometry from WISE and have further refined the resulting sample with photometry from Spitzer, 2MASS, and USNO and proper motions from UCAC4 and UCAC5. Through optical and near-IR spectroscopy, we have confirmed 185 candidates as likely members of Upper Sco (mid-K through M9), 19 of which have been reported in previous studies. These 185 members comprise 36% of the known disk-bearing stars in the association. We also have found 29 new stars with disks in the outskirts of Ophiuchus.
-
2.
We have compiled all available mid-IR photometry from Spitzer and WISE for the known members of Upper Sco adopted by Luhman et al. (2018), which include those found in this study. We find that 1608 members have photometry from at least one of the two facilities. Our catalog serves as an update to a previous compilation of Spitzer and WISE data for members by Luhman & Mamajek (2012). Through that study and the one that we present, all Spitzer and WISE images of the known members have been visually inspected to check for false detections and contamination by diffraction spikes, extended emission, and nearby stars.
-
3.
We have searched for the presence of IR excess emission from disks among the known members of Upper Sco using several colors between and bands from Spitzer and WISE. For the 484 stars that exhibit significant excesses (excluding five Be stars), we have classified the evolutionary stages of the disks (Espaillat et al., 2012) with criteria similar to those applied in our previous studies of Taurus and Upper Sco (Luhman & Mamajek, 2012; Esplin et al., 2014). We classify 296 disks as full, 66 as evolved, 19 as transitional, 22 as evolved or transitional, and 81 as evolved transitional or debris. Many of these disks have not been previously reported, including 129 full disks and 50 disks that are at more advanced evolutionary stages.
References
- Ansdell et al. (2016) Ansdell, M., Gaidos, E., Rappaport, S. A., et al. 2016, ApJ, 816, 69
- Ascenso et al. (2013) Ascenso, J., Lada, C. J., Alves, J., Román-Zúñiga, C. G., & Lombardi, M. 2013, A&A, 549, 135
- Best et al. (2017) Best, W. M. J., Liu, M. C., Magnier, E. A., et al. 2017, ApJ, 837, 95
- Bouvier & Appenzeller (1992) Bouvier, J. & Appenzeller, I. 1992, A&AS, 92, 481
- Carpenter et al. (2008) Carpenter, J. M., Bouwman, J., Silverstone, M. D., et al. 2008, ApJS, 179, 423
- Carpenter et al. (2006) Carpenter, J. M., Mamajek, E. E., Hillenbrand, L. A., & Meyer, M. R. 2006, ApJ, 651, L49
- Carpenter et al. (2009) Carpenter, J. M., Mamajek, E. E., Hillenbrand, L. A., & Meyer, M. R. 2009, ApJ, 705, 1646
- Chen et al. (2005) Chen, C. H., Jura, M., Gordon, K. D., & Blaylock, M. 2005, ApJ, 623, 493
- Chen et al. (2011) Chen, C. H., Mamajek, E. E., Bitner, M. A., et al. 2011, ApJ, 738, 122
- Cody & Hillenbrand (2018) Cody, A. M. & Hillenbrand, L. A. 2018, submitted
- Cody et al. (2017) Cody, A. M., Hillenbrand, L. A., David, T.J., et al. 2017, ApJ, 836, 41
- Cushing et al. (2005) Cushing, M. C., Rayner, J. T., & Vacca, W. D. 2005, ApJ, 623, 1115
- Cushing et al. (2004) Cushing, M. C., Vacca, W. D., & Rayner, J. T. 2004, PASP, 116, 362
- Cutri et al. (2012) Cutri, R. M., Wright, E. L., Conrow, T., et al. 2012, Explanatory Supplement to the WISE All-Sky Data Release Products
- Cutri et al. (2013) Cutri, R. M., Wright, E. L., Conrow, T., et al. 2013, Explanatory Supplement to the AllWISE Data Release Products
- Dawson et al. (2013) Dawson, P., Scholz, A., Ray, T. P., et al. 2013, MNRAS, 429, 903
- Dobashi et al. (2005) Dobashi, K., Uehara, H., Kandori, R., et al. 2005, PASJ, 57, 1
- Espaillat et al. (2012) Espaillat, C., Ingleby, L., Hernandez, J., et al. 2012, ApJ, 747, 103
- Esplin et al. (2014) Esplin, T. L., Luhman, K. L., & Mamajek, E. E. 2014, ApJ, 784, 126
- Fazio et al. (2004) Fazio, G. G., Hora, J. L., Allen, L. E., et al. 2004, ApJS, 154, 10
- Filippazzo et al. (2016) Filippazzo, J. C., Giorla Godfrey, P., Cruz, K. L., et al. 2016, The BDNYC Database v1.0, Zenodo, http://doi.org/10.5281/zenodo.45169
- Gaia Collaboration (2018) Gaia Collaboration, Brown, A. G. A., Vallenari, A., et al. 2018, arXiv:1804.09365
- Gaia Collaboration (2016) Gaia Collaboration, Prusti, T., de Bruijne, J. H. J., et al. 2016, A&A, 595, A1
- Henry et al. (1994) Henry, T. J., Kirkpatrick, J. D., & Simons, D. A. 1994, AJ, 108, 1437
- Hernández et al. (2007) Hernández, J., Hartmann, L., Megeath, T., et al. 2007, ApJ, 662, 1067
- Kaiser et al. (2002) Kaiser, N., Aussel, H., Burke, B. E., et al. 2002, Proc. SPIE, 4836, 154
- Kaiser et al. (2010) Kaiser, N., Burgett, W., Chambers, K., et al. 2010, Proc. SPIE, 7733, 12
- Kenyon & Bromley (2005) Kenyon, S. J., & Bromley, B. C. 2005, AJ, 130, 269
- Kirkpatrick et al. (1997) Kirkpatrick, J. D., Henry, T. J., & Irwin, M. J. 1997, AJ, 113, 1421
- Kirkpatrick et al. (1991) Kirkpatrick, J. D., Henry, T. J., & McCarthy, D. W. 1991, ApJS, 77, 417
- Koenker (2016) Koenker, R. 2016, quantreg: Quantile Regression. R package version 5.21, http://CRAN.R-project.org/package=quantreg
- Lawrence et al. (2007) Lawrence, A., Warren, S. J., Almaini, O., et al. 2007, MNRAS, 379, 1599
- Lodieu et al. (2018) Lodieu, N., Zapatero Osorio, M. R., Béjar, V. J. S., & Peña Ramírez, K. 2018, MNRAS, 473, 2020
- Lucas et al. (2001) Lucas, P. W., Roche, P. F., Allard, F., & Hauschildt, P. H. 2001, MNRAS, 326, 695
- Luhman (1999) Luhman, K. L. 1999, ApJ, 525, 466
- Luhman et al. (2010) Luhman, K. L., Allen, P. R., Espaillat, C., Hartmann, L., & Calvet, N. 2010, ApJS, 186, 111
- Luhman et al. (2018) Luhman, K. L., Herrmann, K. A., Mamajek, E. E., Esplin, T. L., & Pecaut, M. J. 2018, AJ, submitted
- Luhman et al. (1997) Luhman, K. L., Liebert, J., & Rieke, G. H. 1997, ApJ, 489, L165
- Luhman & Mamajek (2012) Luhman, K. L., & Mamajek, E. E. 2012, ApJ, 758, 31
- Luhman et al. (2017) Luhman, K. L., Mamajek, E. E., Shukla, S. J., & Loutrel, N. P. 2017, AJ, 153, 46
- Luhman et al. (1998) Luhman, K. L., Rieke, G. H., Lada, C. J., & Lada, E. A. 1998, ApJ, 508, 347
- Mainzer et al. (2011) Mainzer, A., Bauer, J., Grav, J., et al. 2011, ApJ, 731, 53
- Martín et al. (1998) Martín, E. L., Montmerle, T., Gregorio-Hetem, J., & Casanova, S. 1998, MNRAS, 300, 733
- Martín et al. (1996) Martín, E. L., Rebolo, R., & Zapatero Osorio, M. R. 1996, ApJ, 469, 706
- Monet et al. (2003) Monet, D. G., Levine, S. E., Canzian, B., et al. 2003, AJ, 125, 984
- Neuhäuser et al. (1997) Neuhäuser, R., Torres, G., Sterzik, M. F., & Randich, S. 1997, A&A, 325, 647
- Pecaut & Mamajek (2013) Pecaut, M. J. & Mamajek, E. E. 2013, ApJS, 208, 9
- Pecaut & Mamajek (2016) Pecaut, M. J. & Mamajek, E. E. 2016, MNRAS, 461, 794
- Pecaut et al. (2012) Pecaut, M. J., Mamajek, E. E., & Bubar, E. J. 2012, ApJ, 746, 154
- Perryman et al. (2001) Perryman, M. A. C., de Boer, K. S., Gilmore, G., et al. 2001, A&A, 369, 339
- Pillitteri et al. (2016) Pillitteri, I., Wolk, S. J., Chen, H. H., & Goodman, A. 2016, A&A, 592, 88
- Preibisch & Mamajek (2008) Preibisch, T., & Mamajek, E. 2008, in Handbook of Star Forming Regions, Vol. 2, The Southern Sky, ed. B. Reipurth (ASP Monograph Publications, Vol. 5; San Francisco, CA: ASP), 235
- R Core Team (2013) R Core Team, 2013, R Foundation for Statistical Computing, Vienna, Austria, http://www.R-project.org
- Rayner et al. (2009) Rayner, J. T., Cushing, M. C., & Vacca, W. D. 2009, ApJS, 185, 289
- Rayner et al. (2003) Rayner, J. T., Toomey, D. W., Onaka, P. M., et al. 2003, PASP, 115, 362
- Riaz et al. (2009) Riaz, B., Lodieu, N., & Gizis, J. E. 2009, ApJ, 705, 1173
- Riaz et al. (2012) Riaz, B., Lodieu, N., Goodwin, S., Stamatellos, D., & Thompson, M. 2012, MNRAS, 420, 2497
- Ridge et al. (2006) Ridge, N. A., Di Francesco, J., Kirk, H., et al. 2006, AJ, 131, 2921
- Rieke et al. (2005) Rieke, G. H., Su, K. Y. L., Stansberry, J. A., et al. 2005, ApJ, 620, 1010
- Rieke et al. (2004) Rieke, G. H., Young, E. T., Engelbracht, C. W., et al. 2004, ApJS, 154, 25
- Rizzuto et al. (2015) Rizzuto, A. C., Ireland, M. J., & Kraus, A. L. 2015, MNRAS, 448, 2737
- Rizzuto et al. (2012) Rizzuto, A. C., Ireland, M. J., & Zucker, D. B. 2012, MNRAS, 421, L97
- Schlafly et al. (2016) Schlafly, E. F., Meisner, A. M., Stutz, A. M., et al. 2016, ApJ, 821, 78
- Skrutskie et al. (2006) Skrutskie, M., Cutri, R. M., Stiening, R., et al. 2006, AJ, 131, 1163
- Tian et al. (2017) Tian, H., Gupta, P., Sesar, B., et al. 2017, ApJS, 232, 4
- Vacca et al. (2003) Vacca, W. D., Cushing, M. C., & Rayner, J. T. 2003, PASP, 115, 389
- Werner et al. (2004) Werner, M. W., Roellig, T. L., Low, F. J., et al. 2004, ApJS, 154, 1
- Wilking et al. (2005) Wilking, B. A., Meyer, M. R., Robinson, J. G., & Greene, T. P. 2005, AJ, 130, 1733
- Wilking et al. (2008) Wilking, B. A., Gagné, M., & Allen, L. E. 2008, in Handbook of Star Forming Regions, Vol.2, The Southern Sky, ed. B. Reipurth (ASP Monograph Publications, Vol. 5; San Francisco, CA: ASP), 235
- Wright et al. (2010) Wright, E. L., Eisenhardt, P. R. M., Mainzer, A. K., et al. 2010, AJ, 140, 1868
- Xue et al. (2016) Xue, M., Jiang, B. W., Gao, J., et al 2016, ApJS, 224, 23
- Zacharias et al. (2017) Zacharias, N., Finch, C.T., & Frouard, J. 2017, AJ, 153, 166
- Zacharias et al. (2013) Zacharias, N., Finch, C.T., Girard, T.M., et al. 2013, AJ, 145, 44
| Right Ascension (J2000) | Declination (J2000) |
|---|---|
| (deg) | (deg) |
| 246.157 | 24.60 |
| 245.250 | 23.40 |
| 245.750 | 22.75 |
| 246.750 | 22.75 |
| 246.750 | 23.80 |
| 247.510 | 23.80 |
| 248.200 | 24.25 |
| 248.200 | 24.25 |
| 249.300 | 25.50 |
| 248.100 | 25.00 |
| 247.510 | 25.00 |
| 246.100 | 25.00 |
| Telescope/Instrument | Disperser/Aperture | Wavelengths/Resolution | Targets |
|---|---|---|---|
| CTIO 4 m/COSMOS | red VPH/ slit | 0.55–0.95 m/3 Å | 101 |
| SOAR/Goodman | 400 l mm-1/ slit | 0.54-0.94 m/6 Å | 34 |
| CTIO 4 m/ARCoIRIS | slit | 0.8–2.47 m/R=3500 | 10 |
| IRTF/SpeX | prism/ slit | 0.8–2.5 m/R=150 | 89 |
| Source NameaaCoordinate-based identifications from the AllWISE Source Catalog when available. Otherwise, identifications are from the WISE All-Sky Source Catalog. | Spectral Type | (Li) | (Na) | Instrument | Date | Member? |
|---|---|---|---|---|---|---|
| (Å) | (Å) | |||||
| WISEA J154126.53-261325.5 | M5.75 | SpeX | 2015 Apr 21 | Y | ||
| WISEA J154419.28-231306.9 | M6 | 3.2 | COSMOS | 2015 May 11 | Y | |
| WISEA J154425.49-212641.0 | M3.25 | 0.45 | 2.6 | Goodman | 2014 Jun 16 | Y |
| WISEA J154626.94-244322.8 | M4.75 | 0.70 | 3.7 | COSMOS | 2015 May 11 | Y |
| WISEA J154824.44-223549.8 | M3.75 | 0.70 | 3.0 | COSMOS | 2015 May 13 | Y |
Note. — This table is available in its entirety in a machine-readable form. A portion is shown is here for guidance regarding its form and content.
| Source NameaaCoordinate-based identifications from the AllWISE Source Catalog. | Spectral Type | (Li) | (Na) | Instrument | Date | Member? |
|---|---|---|---|---|---|---|
| (Å) | (Å) | |||||
| WISEA J162224.95-232955.1 | M3.5 | 0.60 | 2.3 | COSMOS | 2015 May 13 | Y |
| WISEA J162235.61-233733.9 | M2 | ARCoIRIS | 2016 Jun 19 | Y | ||
| WISEA J162247.18-230013.4 | M3.5 | ARCoIRIS | 2016 Jun 19 | Y | ||
| WISEA J162248.63-230218.0 | M5.75 | SpeX | 2015 Apr 19 | Y | ||
| WISEA J162308.78-225743.0 | M0.25 | 0.50 | 2.5 | Goodman | 2014 Jun 17 | Y |
Note. — This table is available in its entirety in a machine-readable form. A portion is shown is here for guidance regarding its form and content.
| Source NameaaCoordinate-based identifications from the AllWISE Source Catalog. | ||||
|---|---|---|---|---|
| WISEA J154255.15253610.2 | 9.770.02 | 9.640.02 | 9.050.04 | 7.750.19 |
| WISEA J154703.73260118.6 | 12.050.02 | 11.760.02 | 10.460.10 | 8.400.34 |
| WISEA J154919.75225729.8 | 9.390.02 | 9.170.02 | 8.680.03 | 6.910.09 |
| WISEA J155125.62270743.4 | 11.330.02 | 11.160.02 | 10.070.06 | 7.830.24 |
| WISEA J155233.92265112.5 | 11.040.02 | 10.530.02 | 9.290.04 | 8.520.39 |
Note. — This table is available in its entirety in a machine-readable form. A portion is shown is here for guidance regarding its form and content.
| Column Label | Description |
|---|---|
| Name | Source nameaaCoordinate-based identifications from the AllWISE Source Catalog when available. Otherwise, identifications are from the WISE All-Sky Source Catalog, 2MASS All-Sky Point Source Catalog, or Data Release 10 of the UKIDSS Galactic Clusters Survey. |
| RAdeg | Right Ascension (J2000) |
| DEdeg | Declination (J2000) |
| SpType | Adopted spectral typebbLuhman et al. (2018). |
| Ksmag | band magnitude |
| e_Ksmag | Error in band magnitude |
| r_Ksmag | Reference for band magnitudecc2 = 2MASS Point Source Catalog; u = UKIDSS Data Release 10 |
| Ak | Extinction in bbLuhman et al. (2018). |
| 3.6mag | Spitzer [3.6] band magnitude |
| e_3.6mag | Error in [3.6] band magnitude |
| f_3.6mag | Flag on [3.6] band magnitudeddnodet = non-detection; sat = saturated; out = outside of the camera’s field of view; bl = photometry may be affected by blending with a nearby star; ext = photometry is known or suspected to be contaminated by extended emission (no data given when extended emission dominates); dif = photomtery may be affected by a diffraction spike; bin = includes an unresolved binary companion; unres = too close to a brighter star to be detected; false = detection from WISE catalog appears false or unreliable based on visual inspection; off = and/or detection appears offset from the detection (no data given when offset is due to a known source); err = magnitudes brighter than 6 are erroneous. |
| 4.5mag | Spitzer [4.5] band magnitude |
| e_4.5mag | Error in [4.5] band magnitude |
| f_4.5mag | Flag on [4.5] band magnitudeddnodet = non-detection; sat = saturated; out = outside of the camera’s field of view; bl = photometry may be affected by blending with a nearby star; ext = photometry is known or suspected to be contaminated by extended emission (no data given when extended emission dominates); dif = photomtery may be affected by a diffraction spike; bin = includes an unresolved binary companion; unres = too close to a brighter star to be detected; false = detection from WISE catalog appears false or unreliable based on visual inspection; off = and/or detection appears offset from the detection (no data given when offset is due to a known source); err = magnitudes brighter than 6 are erroneous. |
| 5.8mag | Spitzer [5.8] band magnitude |
| e_5.8mag | Error in [5.8] band magnitude |
| f_5.8mag | Flag on [5.8] band magnitudeddnodet = non-detection; sat = saturated; out = outside of the camera’s field of view; bl = photometry may be affected by blending with a nearby star; ext = photometry is known or suspected to be contaminated by extended emission (no data given when extended emission dominates); dif = photomtery may be affected by a diffraction spike; bin = includes an unresolved binary companion; unres = too close to a brighter star to be detected; false = detection from WISE catalog appears false or unreliable based on visual inspection; off = and/or detection appears offset from the detection (no data given when offset is due to a known source); err = magnitudes brighter than 6 are erroneous. |
| 8.0mag | Spitzer [8.0] band magnitude |
| e_8.0mag | Error in [8.0] band magnitude |
| f_8.0mag | Flag on [8.0] band magnitudeddnodet = non-detection; sat = saturated; out = outside of the camera’s field of view; bl = photometry may be affected by blending with a nearby star; ext = photometry is known or suspected to be contaminated by extended emission (no data given when extended emission dominates); dif = photomtery may be affected by a diffraction spike; bin = includes an unresolved binary companion; unres = too close to a brighter star to be detected; false = detection from WISE catalog appears false or unreliable based on visual inspection; off = and/or detection appears offset from the detection (no data given when offset is due to a known source); err = magnitudes brighter than 6 are erroneous. |
| 24mag | Spitzer [24] band magnitude |
| e_24mag | Error in [24] band magnitude |
| f_24mag | Flag on [24] band magnitudeddnodet = non-detection; sat = saturated; out = outside of the camera’s field of view; bl = photometry may be affected by blending with a nearby star; ext = photometry is known or suspected to be contaminated by extended emission (no data given when extended emission dominates); dif = photomtery may be affected by a diffraction spike; bin = includes an unresolved binary companion; unres = too close to a brighter star to be detected; false = detection from WISE catalog appears false or unreliable based on visual inspection; off = and/or detection appears offset from the detection (no data given when offset is due to a known source); err = magnitudes brighter than 6 are erroneous. |
| W1mag | WISE band magnitudeeePhotometry from AllWISE Source Catalog except for WISEAR J161336.90-232730.0, WISEAR J163810.80-294040.6, and WISEAR J160017.31-223650.8, which are from the AllWISE Reject Table, and WISE J160414.16-212915.5, WISE J160027.15-223850.5, WISE J161320.78-175752.3, WISE J162230.38-241119.2, WISE J162210.14-240905.4, WISE J161317.38-292220.0, WISE J161837.22-240522.8, and WISE J162620.15-223312.8, which are from the WISE All-Sky Source Catalog. |
| e_W1mag | Error in band magnitude |
| f_W1mag | Flag on band magnitudeddnodet = non-detection; sat = saturated; out = outside of the camera’s field of view; bl = photometry may be affected by blending with a nearby star; ext = photometry is known or suspected to be contaminated by extended emission (no data given when extended emission dominates); dif = photomtery may be affected by a diffraction spike; bin = includes an unresolved binary companion; unres = too close to a brighter star to be detected; false = detection from WISE catalog appears false or unreliable based on visual inspection; off = and/or detection appears offset from the detection (no data given when offset is due to a known source); err = magnitudes brighter than 6 are erroneous. |
| W2mag | WISE band magnitudeeePhotometry from AllWISE Source Catalog except for WISEAR J161336.90-232730.0, WISEAR J163810.80-294040.6, and WISEAR J160017.31-223650.8, which are from the AllWISE Reject Table, and WISE J160414.16-212915.5, WISE J160027.15-223850.5, WISE J161320.78-175752.3, WISE J162230.38-241119.2, WISE J162210.14-240905.4, WISE J161317.38-292220.0, WISE J161837.22-240522.8, and WISE J162620.15-223312.8, which are from the WISE All-Sky Source Catalog. |
| e_W2mag | Error in band magnitude |
| f_W2mag | Flag on band magnitudeddnodet = non-detection; sat = saturated; out = outside of the camera’s field of view; bl = photometry may be affected by blending with a nearby star; ext = photometry is known or suspected to be contaminated by extended emission (no data given when extended emission dominates); dif = photomtery may be affected by a diffraction spike; bin = includes an unresolved binary companion; unres = too close to a brighter star to be detected; false = detection from WISE catalog appears false or unreliable based on visual inspection; off = and/or detection appears offset from the detection (no data given when offset is due to a known source); err = magnitudes brighter than 6 are erroneous. |
| W3mag | WISE band magnitudeeePhotometry from AllWISE Source Catalog except for WISEAR J161336.90-232730.0, WISEAR J163810.80-294040.6, and WISEAR J160017.31-223650.8, which are from the AllWISE Reject Table, and WISE J160414.16-212915.5, WISE J160027.15-223850.5, WISE J161320.78-175752.3, WISE J162230.38-241119.2, WISE J162210.14-240905.4, WISE J161317.38-292220.0, WISE J161837.22-240522.8, and WISE J162620.15-223312.8, which are from the WISE All-Sky Source Catalog. |
| e_W3mag | Error in band magnitude |
| f_W3mag | Flag on band magnitudeddnodet = non-detection; sat = saturated; out = outside of the camera’s field of view; bl = photometry may be affected by blending with a nearby star; ext = photometry is known or suspected to be contaminated by extended emission (no data given when extended emission dominates); dif = photomtery may be affected by a diffraction spike; bin = includes an unresolved binary companion; unres = too close to a brighter star to be detected; false = detection from WISE catalog appears false or unreliable based on visual inspection; off = and/or detection appears offset from the detection (no data given when offset is due to a known source); err = magnitudes brighter than 6 are erroneous. |
| W4mag | WISE band magnitudeeePhotometry from AllWISE Source Catalog except for WISEAR J161336.90-232730.0, WISEAR J163810.80-294040.6, and WISEAR J160017.31-223650.8, which are from the AllWISE Reject Table, and WISE J160414.16-212915.5, WISE J160027.15-223850.5, WISE J161320.78-175752.3, WISE J162230.38-241119.2, WISE J162210.14-240905.4, WISE J161317.38-292220.0, WISE J161837.22-240522.8, and WISE J162620.15-223312.8, which are from the WISE All-Sky Source Catalog. |
| e_W4mag | Error in band magnitude |
| f_W4mag | Flag on band magnitudeddnodet = non-detection; sat = saturated; out = outside of the camera’s field of view; bl = photometry may be affected by blending with a nearby star; ext = photometry is known or suspected to be contaminated by extended emission (no data given when extended emission dominates); dif = photomtery may be affected by a diffraction spike; bin = includes an unresolved binary companion; unres = too close to a brighter star to be detected; false = detection from WISE catalog appears false or unreliable based on visual inspection; off = and/or detection appears offset from the detection (no data given when offset is due to a known source); err = magnitudes brighter than 6 are erroneous. |
| Exc4.5 | Excess present in [4.5]? |
| Exc8.0 | Excess present in [8.0]? |
| Exc24 | Excess present in [24]? |
| ExcW2 | Excess present in ? |
| ExcW3 | Excess present in ? |
| ExcW4 | Excess present in ? |
| DiskType | Disk Type |
Note. — This table is available in its entirety in a machine-readable form.