R-matrix calculations of electron collisions with lithium atom at low energies
Abstract
R-matrix calculations of the electron collisions with lithium atom at energies below the 3 excitation threshold are presented. The , and phase shifts calculated in the near-threshold energy range are in excellent agreement with previous theoretical studies. The threshold behavior of the phase shift is accurately analyzed along with the resonance located at the scattering energy meV. The phase shifts and cross sections calculated here show two resonances below the 3 threshold that have not been previously reported.
pacs:
34.80.Bm, 34.80.DpI Introduction
Ultra-long-range Rydberg molecules, for the first time theoretically predicted by Greene et al. (2000), are very exotic systems in which one atom in its ground state interacts with another atom in its highly excited Rydberg state with the distance of the nuclei varying between and a.u Greene et al. (2000); Khuskivadze et al. (2002); Hamilton et al. (2002). The existence and character of the electronic bound states of these molecules is determined by the low-energy interaction between the Rydberg electron and the neutral atom in the ground state. Typically, this interaction is approximated by the -wave zero-range Fermi pseudopotential Fermi (1934) and its -wave extension Omont (1977); Hamilton et al. (2002) or by the finite-range model potential Khuskivadze et al. (2002). Both models are constructed using the -wave and -wave phase shifts of the corresponding electron-atom scattering process at energies below the lowest threshold of the electronic excitation.
So far, the ultra-cold quantum gases, particularly those consisting of the heavier alkali metals, have provided the most suitable environment for the experimental realization and study of the ultra-long-range Rydberg molecules Bendkowsky et al. (2009); Bellos et al. (2013); Bendkowsky et al. (2010). The design and interpretation of these experiments requires accurate theoretical models of the long-range Rydberg molecules and, therefore, accurate phase shifts of the electron collisions with the alkali-metal atoms at the low scattering energies Bahrim et al. (2001). Recently, Schmid et al. (2018) proposed an experiment to study the ion-atom scattering in the ultracold regime based on the photoionization of the Li-Li ultra-long-range Rydberg molecules. Although the low-energy e--Li scattering has been studied both theoretically Burke and Taylor (1969); Norcross (1971); Moores (1986); Buckman and Clark (1994) and experimentally Leep and Gallagher (1974); Jaduszliwer et al. (1981); Buckman and Clark (1994), the demand for the accurate and consistent data by the experimental research groups dealing with the ultra-long-range Rydberg molecules involving lithium justifies us to revisit this topic using very accurate contemporary computational methods.
The ab initio calculations by Norcross (1971) provide very accurate characterization of the and electron collisions with the lithium atoms at very low scattering energies between 0.1 meV and 68 meV. The phase shifts calculated in this energy range are fitted to the modified effective range theory (MERT) O’Malley et al. (1961) and the accurate values of the singlet and triplet scattering lengths are obtained.
However, Norcross (1971) calculated the and scattering phase shifts only for three values of the scattering energies between 0.13 eV and 0.4 eV. Although the extrapolation of the phase shifts towards very low energies using the MERT is adequate, it is questionable in the case since the lowest resonance is located below the interval where the scattering calculations were performed.
The low-energy e--Li scattering was also studied by Burke and Taylor (1969) using the close-coupling (CC) expansion where the states of the neutral target were approximated by the Hartree-Fock wave functions. The ranges of the scattering energies at which the phase shifts are calculated in Norcross (1971) and Burke and Taylor (1969) overlap between 0.1 eV and 0.9 eV. Although the , and phase shifts calculated by Burke and Taylor (1969) are in excellent agreement with those published by Norcross (1971) in this energy interval, their phase shift raises more rapidly with decreasing scattering energy than in Ref. Norcross (1971). As a result, each of these two works Norcross (1971); Burke and Taylor (1969) predicts the Ramsauer-Townsend minimum at different energies. Moreover, the low-energy phase shift and cross section published in Burke and Taylor (1969) show a clear resonance at eV. However, the character of the cross section below this resonance suggests that the calculations by Burke and Taylor (1969) yield different threshold behavior than that predicted by Norcross (1971).
The experimental research of the electron-atom scattering becomes increasingly more challenging with decreasing collision energies. Jaduszliwer et al. (1981) measured the total e--Li scattering cross section above the 2 threshold. The excitation cross sections were measured by Leep and Gallagher (1974). However, to our best knowledge, no experimental results have been published for the scattering energies below the lowest excitation threshold. Therefore, in order to compare the present calculations with the experiment, it was necessary to perform the R-matrix computations for the energies above the 2 excitation threshold. Another theoretical study in this energy region was published by Moores (1986) who utilized the CC approach involving five lowest states of the target.
The goal of this paper is to introduce such a model of the e--Li collisions that provides accurate results from very low scattering energies to the 3 threshold of the electronic excitation. Parametrization of the phase shifts at very low scattering energies presented in this paper provides the data necessary for the research of the ultra-long range Rydberg molecules and other phenomena where the electrons interact with the neutral lithium atom at low energies. Extension of the calculations towards the energies above the 2 excitation threshold uncovers new resonances that were not mentioned in the previously published papers. The reason why they do not appear in the previously published studies Moores (1986); Leep and Gallagher (1974) is that the energy grids at which the cross sections were calculated Moores (1986) and measured Leep and Gallagher (1974); Jaduszliwer et al. (1981) were not fine enough to resolve the corresponding narrow structures.
The atomic units are used throughout the paper unless stated otherwise. Since lithium is a very light element, no spin-orbit interaction or other relativistic effects are considered in this work. The rest of this paper is organized as follows: Section II deals with the representation of the Li+ core by a model potential, the parameters of the R-matrix calculations are discussed in Section III. The phase shifts and cross sections are analyzed in Section IV.
II Model Potential of Li+
In the calculations discussed below, the target atom is represented by its valence electron in the presence of the spherically symmetric potential that models the closed-shell core of Li+. This model potential is constructed individually for every angular momentum of the valence electron. It is optimized in such way that the energies of the low-lying bound states supported by coincide with the energies of the ground and low excited states of the lithium atom.
The form of used in this work is
| (1) |
where , , and are the parameters to be optimized, a.u. is the polarizability of the Li+ core Pouchan and Bishop (1984) and
| (2) |
is the cut-off function regularizing the potential at the origin. Eq. (1) is a generalization of the potential employed by Pan et al. (1996) that is -independent and the polarization part of the potential vanishes less rapidly with decreasing value of than in constructed in this work. Very similar -dependent model potential was developed to represent the Li+ core by Marinescu et al. (1994) in their research of the dispersion coefficients for the alkali-metal dimers. Generally, in the research of the interactions between electrons in the continuum and neutral atoms or positive ions, the cationic cores have been very successfully modeled by this form of the potential (see Refs. Greene (1990); Pan et al. (1996); Marinescu et al. (1994) as well as Aymar et al. (1996) and references therein).
The set of parameters , , and was optimized using the non-linear least squares method independently for . The accurate theoretical Frolov et al. (2014) and experimental Moore (1971) energies of five lowest states with respect to the ionization threshold for every were taken as the data to be matched by the model. In every iteration, it was necessary to diagonalize the one-particle Hamiltonian operator where is the operator of the kinetic energy. The match of the obtained eigenenergies with the experimental data then determined the adjustments of in the next iteration. Note that the index plays a role of the principal quantum number as known in the atomic physics. In the calculations presented here, was represented by the radial basis set consisting of 2000 B-splines Bachau et al. (2001) that spanned the sphere with radius 240 a.u. This size of the sphere was chosen with respect to the fact that the classical turning point of the highest fitted bound state is at a.u. Sufficient radial interval beyond this limit allowed for the accurate exponential decrease of the wave function and eliminated the artifacts of the finite box.
The values of the parameters optimized to represent Li+ in the R-matrix calculations discussed below are listed in Table 1. The model potential with these parameters yielded less than 1 meV deviation of the calculated energy levels from lowest five experimental values Moore (1971) for every .
The best match between the experimental energies of the -states and the spectrum of the was achieved when the lowest eigenvalue was omitted from the optimization of and the second eigenenergy was compared with the ground state of the lithium atom. This is related to the fact that the 1 orbital in lithium is doubly occupied by the core electrons and the lowest -orbital available for the valence electron is that possesses one node. As a result, supports one very deeply bound core-like non-physical state with the energy a.u. with respect to the ionization threshold. This orbital is very compact, its classical turning point is located at a.u. The eigenenergies above this state very accurately correspond to the experimental energy levels of the lithium atom Moore (1971).
For , the energies of the lithium bound states are so close to the corresponding levels of the hydrogen atom that with very good approximation the Coulomb potential can be taken instead of .
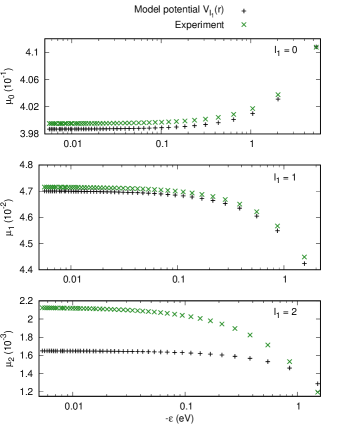
Although it is not the main objective of this work, it is interesting to mention that also yields accurate energies of the excited states higher than those to which was optimized. Fig. 1 shows the quantum defects calculated for Seaton (1966). Its good correspondence to the experimental results Goy et al. (1986); Lorenzen and Niemax (1983) (note the order-of-magnitude decrease of with increasing value of ) implies that also correctly models the -, - and - Rydberg states of the Li atom.
The aim of the extensive radial basis set utilized in the optimization discussed above is to eliminate the effects of the finite basis set as much as possible and to provide the model potential that is independent of the basis set. Note that this approach is different from the method frequently used in quantum chemistry to represent the atomic cores by the potentials. In such calculations, mainly based on the Gaussian basis sets, the parameters of the potential are optimized for one specific basis set that becomes part of the model along with the optimized potential (see Guérout et al. (2010) and references therein).
In the calculations of the electron collisions with lithium at low energies, Norcross (1971) also used a model potential to represent the Li+ core. The parameters of the scaled Thomas-Fermi potential Stewart and Rotenberg (1965) with additional polarization term were optimized to accurately reproduce the energies of two lowest eigenstates of the lithium atom. The Thomas-Fermi potential was also utilized by Moores (1986) to calculate the 1 core wave functions of Li+. The valence orbitals of the neutral lithium were obtained from the e--Li+ scattering calculations. On the other hand, Burke and Taylor (1969), in their work, represented the lithium atom by the Hartree-Fock wave function and constrained the 1 orbital to be doubly occupied in all the terms considered in the following CC expansion of the scattering wave function.
In the two-electron calculations, the approximation of the noble-gas-like core by the model potential can be corrected by including the dielectronic term introduced by Chisholm and Öpik (1964) in the two-electron Hamiltonian:
| (3) |
where and are the radial coordinates of the first and second electron, respectively, is the angle between their position vectors, is the th Legendre polynomial, is the cut-off parameter and is the quadrupole polarizability of the core. This term describes the interaction between the valence and scattering electrons via the dipole and quadrupole moments induced on the core. Although this correction becomes more important for the heavier alkali metals, it was included in the R-matrix calculations presented in this work with a.u. Maroulis and Bishop (1986). The value of the cut-off parameter a.u. was chosen in such way that the electron affinity of Li- obtained by the diagonalization of the two-electron Hamiltonian discussed in Section III including the correction (3) coincides with the accurate experimental value 0.617 eV Dellwo et al. (1992). The electron affinity calculated using the value of mentioned above is 0.620 eV.
III R-matrix Calculations
The scattering calculations discussed below were performed using the R-matrix computer program by Tarana and Čurík (2016) originally designed to calculate the electronic states of the long-rang Rydberg molecules. The notation introduced in Ref. Tarana and Čurík (2016) was adopted in this section. The reader is also referred there for the definitions of the open and closed one-particle wave functions and two-electron configurations (see also Ref. Aymar et al. (1996)). Only the inner-region part of the program by Tarana and Čurík (2016) was used in this work. The outer-region code was developed independently and it consists of the propagation of the R-matrix in the long-range potentials of the target Baluja et al. (1982); Pan et al. (1996) as well as of the construction of the -matrix, -matrix and calculation of the phase shifts and cross sections Zatsarinny (2006); Taylor (2006); Nesbet (1980).
The radius of the R-matrix sphere was set to a.u. This allows for equally accurate treatment of both short-range and long-range interactions between the target atom and the incident electron. The long-range effects become particularly important at the scattering energies near the 2 threshold. This is the energy range from which the accurate values of the MERT parameters can be obtained. Since the full interaction of the electrons with each other as well as with the Li+ core is considered in the inner region, the treatment of the long-range effects inside this relatively large sphere is not restricted only to the potential due to the static dipole polarizability of the target. It also includes the effects of the higher multipoles of the ground and excited states. Similarly large spheres were used by Pan et al. (1996) in their R-matrix calculations of the photodetachment of Li-.
The set of 154 radial B-splines of the 6th order was used inside the R-matrix sphere to represent the closed and open single-particle wave functions Tarana and Čurík (2016). For every one-electron angular momentum , 25 lowest closed orbitals were included in the closed part of the ansatz for the two-electron wave function. All possible excitations involving these orbitals were included in the construction of the corresponding configuration interaction (CI) Hamiltonian matrix . Lowest 6, 6, 5, 3, and 1 closed orbitals among the -, -, -, - and -states, respectively, were included in the open part of the two-electron wave function ansatz Tarana and Čurík (2016) as the scattering channels. This extensive basis set ensures very accurate treatment of all the correlation and polarization effects. Our tests showed that further augmentation of the basis set has negligible impact on the calculated scattering quantities.
The CI matrix representing the two-electron Hamiltonian in the inner region (including the dielectronic term (3) and Bloch operator Aymar et al. (1996); Tennyson (2010); Zatsarinny (2006); Tarana and Čurík (2016)) was diagonalized and using the eigenvalues (R-matrix poles) , the R-matrix was calculated as
| (4) |
where is the total energy of the e--Li system and are the surface amplitudes – projections of the th eigenstate of on the target state with the angular momentum and on the partial wave of the scattered electron Aymar et al. (1996); Tennyson (2010); Zatsarinny (2006); Tarana and Čurík (2016). The multi-index denotes the scattering channel.
Since the total angular momentum , total spin and total parity of the e--Li system are good quantum numbers, the scattering calculation can be performed independently for each symmetry and the cross sections calculated in this way can be summed to obtain the results that can be compared with the experiments.
It is worth mentioning at this point that the spectrum of includes a set of non-physically low R-matrix poles . This is an artifact of the very low-lying compact orbital with energy discussed in Section II. In the eigenstates corresponding to these low-lying R-matrix poles, the configurations where the compact 1-like orbital is singly- or doubly-occupied are dominant and not strongly coupled to the configurations involving the higher valence orbitals. Since, in addition, this core-like target state was not included in the CC expansion as the scattering channel, there are no surface amplitudes associated with it. As a result, these non-physically low-lying eigenstates of do not appear in the pole-expansion (4) of the R-matrix and they do not affect the results of the scattering calculations.
This work is dealing with the kinetic energies of the incident electron eV where only the 2 and 2 channels are open. The 2 channel opens at the energy eV above the 2 threshold and the threshold of the 3 channel is located at eV. Although all the remaining higher channels included in the scattering calculations are closed, their presence ensures the accurate treatment of the long-range e--Li interaction in the outer region represented by the transition dipole moments coupling the target states Pan et al. (1996); Tennyson (2010). In spite of the large R-matrix box, the propagation of the R-matrix Baluja et al. (1982) in the long-range tail of the lithium potential to the distance 2700 a.u. from the center was necessary to obtain converged phase shifts at energies below 1 meV suitable for the calculation of the MERT parameters.
One way to assess the representation of the e--Li interaction by the dipole potentials coupling the target states outside the R-matrix sphere is to calculate the static dipole polarizabilities of the ground and excited states of the target from the dipole moments used in the present R-matrix propagation Friedrich (2006):
| (5) |
where and are the eigenstates of the target and the matrix element in the numerator of Eq. (5) is the -component of the corresponding transition dipole moment. This equation yields polarizability of the lithium atom in the ground state a.u. that is in excellent agreement with previously published theoretical and experimental values varying between 163.74 a.u. and 164.19 a.u. (see Ref. Puchalski et al. (2011) and references therein). The contribution from the term to the series (5) represents more than 99% of the calculated value and all the higher terms are its small corrections.
For the excited state 2, Eq. (5) yields the static dipole polarizability a.u. that is lower than previously published theoretical and experimental values varying between 125.2 a.u. and 135.7 a.u. (see Tang et al. (2009) and references therein). This suggests that including only the excited target states from the R-matrix channel space is not sufficient to accurately treat the polarizability in Eq. (5). However, our test scattering calculations (not presented in this paper) showed that including more target states in the expansion of the scattering wave function has negligible influence on the calculated phase shifts and cross sections.
The R-matrix propagated to the distance 2700 a.u. from the center is used to match the linear combination of the regular and irregular free-particle solutions of the Schrödinger equation in the open channels Zatsarinny (2006). This yields the -matrix and its subsequent diagonalization provides the scattering phase shifts. The scattering amplitudes and cross sections are then calculated using the standard methods of the multi-channel scattering theory Taylor (2006). It is not necessary to consider the closed channels in the matching of the free-particle solutions and to perform any elimination of the closed channels Aymar et al. (1996). In this case, the energy range around the threshold where the closed channels influence the results, is negligible.
IV Results
IV.1 Phase shifts
In this section, the dependence of the phase shifts on the kinetic energy of the incident electron is presented as follows: Below the 2 threshold, is a single phase shift corresponding to the partial wave of the scattered electron according to the total symmetry of the e--Li system. Above the 2 threshold, is the sum of all the eigenphases obtained by the diagonalization of the multi-channel -matrix. The superscript denotes the multiplicity of the e--Li system. Since the parity and since the electron collisions with lithium in its excited states are not a subject of this work, it is sufficient to deal only with those symmetries where as only in these the colliding electron is coupled with the ground state of the target. Therefore, it is not necessary to use parity index to denote the phase shifts in different symmetries.
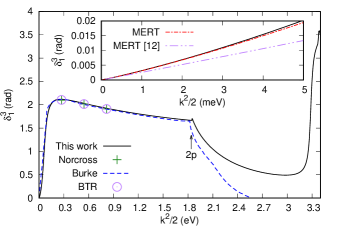
The phase shift calculated using the R-matrix method is plotted in Fig. 2. Its comparison with the results calculated by Norcross (1971) shows an excellent agreement for the energy range between 0.1 meV and 0.8 eV.
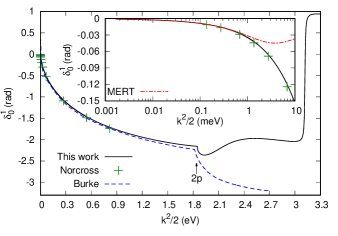
The rapid decrease at very low scattering energies is the consequence of the bound state of Li-. The low-energy -wave phase shifts calculated in this work can be parametrized by the MERT O’Malley et al. (1961)
| (6) |
where is the scattering length, denotes the effective range, and is the logarithmic derivative of the Gamma function. This fit yields the scattering length and corresponding effective range . While the optimized value of is sensitive to the energy interval taken for the non-linear fit, the scattering length does not considerably change. Moreover, if the ground-state polarizability is treated as a fitting parameter, its value from the inner-region calculations is reconstructed and the scattering length remains unchanged.
The scattering length obtained from the R-matrix calculations discussed here is slightly lower than the value 3.04 reported by Norcross (1971). Possible reason for this subtle difference can lay in the fact that the R-matrix propagation utilized in this work allows for stable evaluation of at lower energies than those considered by Norcross (1971). As a result, the MERT parametrization performed at lower collision energies can also yield slightly different value of . As can be seen in the inset of Fig. 2, the MERT parametrization O’Malley et al. (1961) of the phase shift considerably deviates from the R-matrix results at scattering energies above 1 meV.
Below the 2 excitation threshold, the R-matrix calculations also show an agreement with the results obtained by Burke and Taylor (1969). The discrepancy increases at the scattering energies above the 2 threshold due to the terms in the CC expansion involving the target orbitals with higher energies and angular momenta that are not included in Burke and Taylor (1969). However, they are necessary for accurate representation of the interaction between the incident electron and the valence electron of the target. This issue of the truncated CC expansion in Burke and Taylor (1969) is not specific only for the scattering but it is common for all the symmetries.
Another structure in the calculated phase shifts that can be seen in Fig. 2 is the narrow resonance below the 3 threshold. It can be very accurately fitted to the Breit-Wigner formula Taylor (2006)
| (7a) | |||
| where is the background phase shift slowly varying with the energy, | |||
| (7b) | |||
is the position of the resonance and is its width. Since Eqs. (7b) can be applied to the resonances in any symmetry, the indices and are omitted from the notation of the resonant and background phase shifts. When is assumed to be slowly varying function of the energy
| (8) |
the fit yields eV and meV. The optimized values of and are listed in Table 2.
| MERT | Resonances | ||||||
|---|---|---|---|---|---|---|---|
| symmetry | R-matrix | Norcross (1971) | (eV) | (meV) | |||
| , | 3.117 | 11 | 1.932 | -0.292 | |||
| , | |||||||
| 0.062 | 68 | 0.504 | -2.582 | 2.423 | |||
| 3.285 | 45 | 0.107 | 0.087 | ||||
The analysis of the CI configurations contributing to the resonant wave function reveled that this resonance has Feshbach character with the dominant configuration . To our best knowledge, this resonance has not been reported in any previously published papers dealing with the e--Li collisions. Due to its symmetry, this resonance is expected to appear in the two-photon detachment spectrum of Li- at the photon energy a.u. Similar spectrum was calculated by Glass et al. (1998). However, the highest photon energy considered in that work was 0.05 a.u.
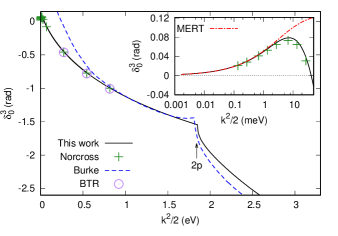
Fig. 3 shows the comparison of the phase shifts calculated using the R-matrix method with previously published results. Like in the case of singlet discussed above, the data obtained in this work are in very good agreement with those calculated by Norcross (1971). As a result, the energy at which changes from positive to negative (that corresponds to the Ramsauer-Townsend minimum in the cross section) calculated in this work also matches very well with the value obtained by Norcross (1971). Fitting of the calculated phase shifts to MERT O’Malley et al. (1961) yields the scattering length and the effective range that is consistent with the previously published value Norcross (1971). As can be seen in the inset of Fig. 3, the MERT parametrization of is valid at energies below 5 meV. The steep increase of the -wave phase shift at very low energies followed by the rapid drop is characteristic for the scattering systems that possess the virtual state Taylor (2006) (represented by a pole of the -matrix on the negative imaginary axis in the complex momentum plane) with sufficiently small energy.
The reason behind the deviation of the phase shifts calculated by Burke and Taylor (1969) from the results presented in this work and those obtained by Norcross (1971) is that the CC method, as formulated by Burke and Taylor (1969), does not guarantee that the continuum wave functions of the colliding electron are orthogonal to the Hartree-Fock orbitals of the target Norcross (1969). When Norcross (1969, 1971) introduced this orthogonality into the CC equations formulated by Burke and Taylor (1969) as the additional constraint (circles denoted as BTR in Fig. 3), the phase shifts calculated in this way became consistent with those obtained using other approaches discussed in this work. This orthogonality issue is common to all the symmetries discussed here, except the scattering Norcross (1969). It is another limitation of the computational method used in Ref. Burke and Taylor (1969) in addition to the truncation of the CC expansion mentioned above.
The phase shifts calculated using the R-matrix method are in excellent agreement with the results of Norcross (1971) at all three energy points where the latter are provided (see Fig. 4).
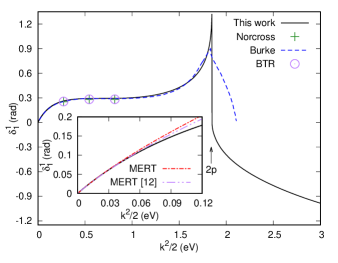
In Ref. Norcross (1971), these were extrapolated towards the low energies near the threshold using the -wave MERT O’Malley et al. (1961), as
| (9) |
with the value of the fitting parameter . The parametrization of our R-matrix results at the scattering energies below 10 meV using Eq. (9) yields similar value . As can be seen in the inset of Fig. 4, this parametrization fits the ab initio results for energies below 50 meV. In spite of the issue with the orthogonality of the continuum wave functions and target orbitals discussed above, at energies below the 2 threshold, the phase shifts obtained by Burke and Taylor (1969) are in encouraging agreement with our R-matrix calculations and the orthogonality correction Norcross (1971) does not considerably change the results. Rigorously, Eq. (9) above should contain an additional term not involving O’Malley et al. (1961). Its presence is dictated by the Wigner threshold law for the short-range interactions. Since only the whole coefficients in front of can be fitted and since is constant, we used the form (9) in order to have like-to-like comparison with the MERT fit by Norcross (1971).
Norcross (1971) also performed the low-energy -wave MERT extrapolation of the phase shift calculated at the same three energy points between 0.2 eV and 0.8 eV as in the symmetry and obtained the value of the fitting parameter . However, the adequacy of this extrapolation can be called into question as the there is a resonance below 100 meV that changes the threshold behavior of the phase shift and the MERT expansion may not be valid above this energy (see Fig. 5).
The value optimized by fitting our R-matrix results to Eq. (9) at energies sufficiently below this resonance is considerably smaller, . As can be seen in the inset of Fig. 5, this parametrization is more consistent with the ab initio results than the parametrization in Ref. Norcross (1971).
The fit of the low-energy resonance shown in Fig. 5 is disturbed by the threshold effects. The phase shift in the corresponding energy interval can be accurately fitted to Eqs. (7b) assuming the near-threshold behavior of the background phase shift consistent with Eq. (9)
| (10) |
where the value of is chosen so that , and are the fitting variables. This optimization yields meV and meV. The optimized values of , and are listed in Table 2. Generally, the interaction of the resonance with the threshold can be more complicated than present ad hoc assumption that the phase shift is simply a sum of the Breit-Wigner formula (7b) and -wave MERT expression (9). The narrower the fitted resonance is, the more accurate values of and this approach yields since the rapid increase of occurs at smaller energy scale than the steady change due to the threshold behavior. Therefore, this parametrization provides a numerically accurate model of the low-energy behavior of the phase shift suitable for the construction of related zero-range potentials Omont (1977); Hamilton et al. (2002).
Another resonance appears just below the 3 excitation threshold (see Fig. 5) and, assuming that is linear (Eq. (8)), it can be parametrized using the Breit-Wigner formula (7b) where eV and meV.
The and phase shifts calculated in this study are plotted in Fig. 6 along with the results obtained by Burke and Taylor (1969).
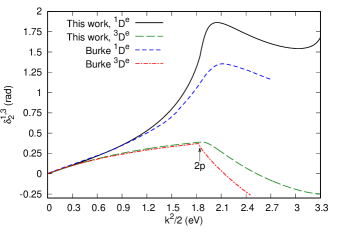
While the triplet phase shifts agree very well below the 2 threshold, the singlet results of Burke and Taylor (1969) are, for energies above 1.2 eV, lower than those obtained from the R-matrix calculations presented here. The phase shift steeply raises above this energy reaching the highest value above the 2 threshold. Likewise to the low-energy resonance discussed in the text above, the fit of this resonance by the Breit-Wigner formula (7b) is complicated by its interaction with the threshold. In this case, however, the resonant structure in the phase shifts reaches the energy regions both below and above the 2p threshold. Therefore, has different energy dependence below and above the 2 threshold. Since this resonance is relatively broad compared to the other resonances discussed above, the steep increase of the phase shift cannot be attributed only to . This makes the values of and very sensitive to the form of and to the energy range taken for the fit. Note that this resonance also appears in the two-photon detachment spectrum of Li- calculated by Glass et al. (1998).
In addition to the symmetries discussed above, the R-matrix calculations were also performed for the higher total angular momenta of the e--Li system up to in both singlet and triplet. Corresponding phase shifts (not shown in this paper) are generally smaller than those for presented above and there are no resonances in the energy interval below the 3 threshold. However, their inclusion in the calculation of the cross sections is necessary to achieve the convergence and agreement with the experimental results.
IV.2 Cross sections
All the scattering cross sections presented in this section are averaged over the initial spin states and summed over the final spin states Nesbet (1980). The integral cross sections for the elastic scattering calculated using the R-matrix method are plotted in Fig. 7.
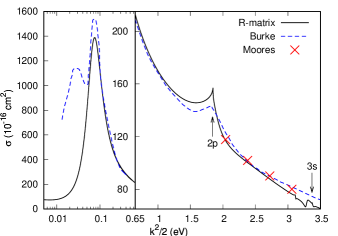
The dominant structure in the cross sections is the narrow peak located at 75 meV that corresponds to the low-lying resonance discussed above (see Fig. 5 and Table 2). The change of the phase shift from positive to negative values shown in the inset of Fig. 3 is reflected in the elastic cross section as the Ramsauer-Townsend minimum located around 7 meV. As can be seen in Fig. 7, the resonance peak calculated in this work is in good agreement with that published by Burke and Taylor (1969). However, their calculation yields one more peak at lower energy. It is most likely an artifact caused by the non-orthogonality of the continuum wave functions on the target orbitals Norcross (1969) that is particularly problematic in the scattering.
Another sharp peak in the elastic cross section occurs at the energy 1.84 eV where the 2-channel opens. It is a consequence of the resonance (see the corresponding phase shifts in Fig. 6) and very pronounced threshold behavior in the and symmetries (Wigner cusp). In order to obtain converged cross sections in this energy region, it is necessary to include all the total angular momenta of the e--Li system up to for both singlet and triplet configurations. The difference of the cross sections obtained from the R-matrix calculations discussed in this work and those reported by Burke and Taylor (1969) corresponds to the discrepancy of the phase shifts discussed above. Fig. 7 also shows the comparison with the elastic cross section calculated by Moores (1986) who utilized the CC approach involving five lowest states of the target. These results are in slightly better agreement with the R-matrix cross sections than those by Burke and Taylor (1969) obtained using more limited CC expansion, although the elastic cross section calculated by Moores (1986) decreases with the energy more slowly than our results presented here.
Although the and resonances located close to the 3-threshold are narrow (see Table 2), our results plotted in Fig. 7 show that they do not dramatically change the magnitude of the cross sections. Due to a sparse energy grid at which Moores (1986) evaluated the cross sections, these resonances do not appear in that theoretical study.
As can be seen in Fig. 8, our R-matrix calculations including the higher angular momenta and target orbitals with higher energies yield lower cross sections for the electronic excitation to the 2 state than the CC expansion of Burke and Taylor (1969).
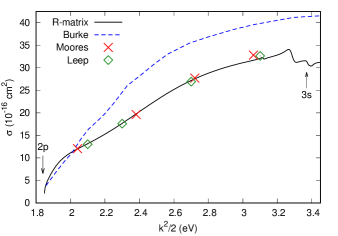
The excellent agreement with the results of Moores (1986) and with the experimental data of Leep and Gallagher (1974) shows that the five-states CC expansion Moores (1986) provides converged and quantitatively accurate results of the electronic excitation in the energy range between the 2 and 3 threshold.
The sum of the elastic and excitation cross section between the 2 and 3 thresholds is plotted in Fig. 9.
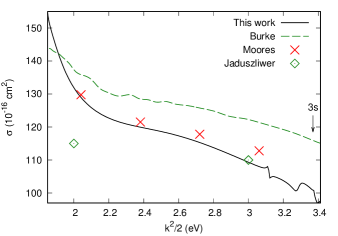
Present results are lower than the total cross section reported by Burke and Taylor (1969) and slightly lower than that published by Moores (1986). Out of all the three theoretical results, present R-matrix cross sections are closest to the experimental data observed by Jaduszliwer et al. (1981) in the energy region below the 3 threshold. Fig. 9 shows that the experimental value at energy of 3 eV is in excellent agreement with the R-matrix calculations presented here. It is not straightforward to address the difference that can be seen at the energy of 2 eV. It is well known that the crossed-beam scattering experiments become more challenging at lower collision energies. The energy profile of the incident electron beam becomes broader and it is more difficult to form a well focused beam.
V Conclusions
The aim of the present study is to provide accurate ab initio data for the e--Li scattering that can be used for modeling ultra-long-range Rydberg molecules containing the Li atom. In the first step, the atomic core of Li+ is replaced by a model potential whose parameters are fitted to accurately reproduce the atomic excitation energies. By very extensive size of the one-electron basis set we attempted to eliminate any impact of this basis on the model potential, i.e. the functional form of the potential should be considered independent of the basis set.
The optimized model potential is then used in the following two-electron R-matrix method developed by the authors Tarana and Čurík (2016) to compute the phase shifts for the total angular momentum up to and for the collision energies up to the 3 excitation threshold. The phase shifts up to , in both singlet and triplet channels, are discussed in detail, while the higher -values are only used to obtain converged integral cross sections presented in this work.
Phase shifts for ( and symmetries) agree well with previous calculations of Norcross (1971) and Burke and Taylor (1969) up to the first excitation threshold. The low-energy tail of the latter data required a correction to properly incorporate orthogonality of the continuum states for the symmetry and it was carried out by Norcross (1971). The obtained low-energy MERT parameters can be considered as refinements of those published by Norcross (1971). For higher collision energies, our results deviate from those of Burke and Taylor (1969). Moreover, we report a narrow 3 Feshbach resonance at 3.117 eV located in symmetry.
Phase shifts for are dominated by the resonance that was very well represented in calculations of Burke and Taylor (1969) and omitted by Norcross (1971). The narrow character of the resonance allowed us to fit the phase shift as a sum of the threshold-law phase and the Breit-Wigner formula. Resulting MERT parameter disagrees with the one provided by Norcross (1971) as the latter was determined from higher collision energies for whose the resonance at 62 meV does not exist.
The resonance that can be seen in phase shifts is wider when compared to those in lower total angular momenta . Strong background together with the presence of the 2 excitation threshold provides very difficult situation for determination of the resonance parameters. Therefore, they are not given in the present study. Moreover, our results start to deviate from calculations of Burke and Taylor (1969) already well below the 2 excitation threshold.
The elastic as well as inelastic integral cross sections were calculated for the energies below the 3 excitation threshold. At very low energies, our results show the Ramsauer-Townsend minimum at 7 meV whereas in the calculations of Burke and Taylor (1969), this minimum is disturbed by a presence of an additional low-energy peak. Above the 2 excitation threshold, the total cross section of Burke and Taylor (1969) becomes gradually higher than in the present calculations, mainly due to higher electronic excitation cross sections. Our results in this case agree well with those by Moores (1986). Furthermore, out of all three calculations, the present data exhibit the best agreement with the experimental total cross sections Jaduszliwer et al. (1981).
The lack of any experimental data on the e--Li scattering for collision energies under 2 eV strongly underlines a necessity for the accurate theoretical results that could be utilized in design of ultra-cold molecular experiments Schmid et al. (2018). Moreover, we believe that the techniques reported here for the construction of the model potential replacing the atomic core can be also used for the heavier alkali atoms.
Acknowledgements.
M.T. acknowledges the support of the Czech Science Foundation (Project No. P203/17-26751Y). The contributions of R.Č. were supported by the Czech Science Foundation (Grant No. 18-02098S).References
- Greene et al. (2000) C. H. Greene, A. S. Dickinson, and H. R. Sadeghpour, Phys. Rev. Lett. 85, 2458 (2000).
- Khuskivadze et al. (2002) A. A. Khuskivadze, M. I. Chibisov, and I. I. Fabrikant, Phys. Rev. A 66, 042709 (2002).
- Hamilton et al. (2002) E. L. Hamilton, C. H. Greene, and H. R. Sadeghpour, J. Phys. B 35, L199 (2002).
- Fermi (1934) E. Fermi, Nuovo Cimento 11, 157 (1934).
- Omont (1977) A. Omont, J. Phys. (Paris) 38, 1343 (1977).
- Bendkowsky et al. (2009) V. Bendkowsky, B. Butscher, J. Nipper, J. P. Shaffer, R. Low, and T. Pfau, Nature 458, 1005 (2009).
- Bellos et al. (2013) M. A. Bellos, R. Carollo, J. Banerjee, E. E. Eyler, P. L. Gould, and W. C. Stwalley, Phys. Rev. Lett. 111, 053001 (2013).
- Bendkowsky et al. (2010) V. Bendkowsky, B. Butscher, J. Nipper, J. B. Balewski, J. P. Shaffer, R. Löw, T. Pfau, W. Li, J. Stanojevic, T. Pohl, and J. M. Rost, Phys. Rev. Lett. 105, 163201 (2010).
- Bahrim et al. (2001) C. Bahrim, U. Thumm, and I. I. Fabrikant, Phys. Rev. A 63, 042710 (2001).
- Schmid et al. (2018) T. Schmid, C. Veit, N. Zuber, R. Löw, T. Pfau, M. Tarana, and M. Tomza, Phys. Rev. Lett. 120, 153401 (2018).
- Burke and Taylor (1969) P. G. Burke and A. J. Taylor, J. Phys. B: At. Mol. Phys. 2, 869 (1969).
- Norcross (1971) D. W. Norcross, J. Phys. B: At. Mol. Phys. 4, 1458 (1971).
- Moores (1986) D. L. Moores, J. Phys. B: At. Mol. Phys. 19, 1843 (1986).
- Buckman and Clark (1994) S. J. Buckman and C. W. Clark, Rev. Mod. Phys. 66, 539 (1994).
- Leep and Gallagher (1974) D. Leep and A. Gallagher, Phys. Rev. A 10, 1082 (1974).
- Jaduszliwer et al. (1981) B. Jaduszliwer, A. Tino, B. Bederson, and T. M. Miller, Phys. Rev. A 24, 1249 (1981).
- O’Malley et al. (1961) T. F. O’Malley, L. Spruch, and L. Rosenberg, J. Math. Phys. 2, 491 (1961).
- Pouchan and Bishop (1984) C. Pouchan and D. M. Bishop, Phys. Rev. A 29, 1 (1984).
- Pan et al. (1996) C. Pan, A. F. Starace, and C. H. Greene, Phys. Rev. A 53, 840 (1996).
- Marinescu et al. (1994) M. Marinescu, H. R. Sadeghpour, and A. Dalgarno, Phys. Rev. A 49, 982 (1994).
- Greene (1990) C. H. Greene, Phys. Rev. A 42, 1405 (1990).
- Aymar et al. (1996) M. Aymar, C. H. Greene, and E. Luc-Koenig, Rev. Mod. Phys. 68, 1015 (1996).
- Frolov et al. (2014) A. M. Frolov, M. B. Ruiz, and D. M. Wardlaw, Chem. Phys. Lett. 608, 191 (2014).
- Moore (1971) C. E. Moore, in Nat. Stand. Ref. Data Ser., NSRDS-NBS 35 Vol. I (Reprint of NBS Circ. 467, Vol. I, 1949) (Nat. Bur. Stand., U.S., 1971).
- Bachau et al. (2001) H. Bachau, E. Cormier, P. Decleva, J. E. Hansen, and F. Martín, Rep. Prog. Phys. 64, 1815 (2001).
- Seaton (1966) M. J. Seaton, Proc. Phys. Soc. 88, 801 (1966).
- Goy et al. (1986) P. Goy, J. Liang, M. Gross, and S. Haroche, Phys. Rev. A 34, 2889 (1986).
- Lorenzen and Niemax (1983) C.-J. Lorenzen and K. Niemax, Phys. Scr. 27, 300 (1983).
- Guérout et al. (2010) R. Guérout, M. Aymar, and O. Dulieu, Phys. Rev. A 82, 042508 (2010).
- Stewart and Rotenberg (1965) J. C. Stewart and M. Rotenberg, Phys. Rev. 140, A1508 (1965).
- Chisholm and Öpik (1964) C. D. H. Chisholm and U. Öpik, Proc. Phys. Soc. 83, 541 (1964).
- Maroulis and Bishop (1986) G. Maroulis and D. M. Bishop, J. Phys. B: At. Mol. Phys. 19, 369 (1986).
- Dellwo et al. (1992) J. Dellwo, Y. Liu, D. J. Pegg, and G. D. Alton, Phys. Rev. A 45, 1544 (1992).
- Tarana and Čurík (2016) M. Tarana and R. Čurík, Phys. Rev. A 93, 012515 (2016).
- Baluja et al. (1982) K. Baluja, P. Burke, and L. Morgan, Comput. Phys. Commun. 27, 299 (1982).
- Zatsarinny (2006) O. Zatsarinny, Comput. Phys. Commun. 174, 273 (2006).
- Taylor (2006) J. Taylor, Scattering Theory: The Quantum Theory of Nonrelativistic Collisions, Dover Books on Engineering (Dover Publications, 2006).
- Nesbet (1980) R. K. Nesbet, Variational methods in electron-atom scattering theory (Plenum Press New York, 1980).
- Tennyson (2010) J. Tennyson, Phys. Rep. 491, 29 (2010).
- Friedrich (2006) H. Friedrich, Theoretical Atomic Physics (Springer, 2006).
- Puchalski et al. (2011) M. Puchalski, D. Kȩdziera, and K. Pachucki, Phys. Rev. A 84, 052518 (2011).
- Tang et al. (2009) L.-Y. Tang, Z.-C. Yan, T.-Y. Shi, and J. F. Babb, Phys. Rev. A 79, 062712 (2009).
- Glass et al. (1998) D. H. Glass, P. G. Burke, C. J. Noble, and G. B. Wöste, J. Phys. B: At., Mol. Opt. Phys. 31, L667 (1998).
- Norcross (1969) D. W. Norcross, J. Phys. B: At. Mol. Phys. 2, 1300 (1969).