Multi-band effects in in-plane resistivity anisotropy of
strain-detwinned disordered Ba(Fe1-xRux)2As2
Abstract
In-plane resistivity anisotropy was measured in strain-detwinned as-grown and partially annealed samples of isovalently-substituted () and the results were contrasted with previous reports on anneal samples with low residual resistivity. In samples with high residual resistivity, detwinned with application of strain, the difference of the two components of in-plane resistivity in the orthorhombic phase, , was found to obey Matthiessen rule irrespective of sample composition, which is in stark contrast with observations on annealed samples. Our findings are consistent with two-band transport model in which contribution from high mobility carriers of small pockets of the Fermi surface has negligible anisotropy of residual resistivity and is eliminated by disorder. Our finding suggests that magnetic/nematic order has dramatically different effect on different parts of the Fermi surface. It predominantly affects inelastic scattering for small pocket high mobility carriers and elastic impurity scattering for larger sheets of the Fermi surface. Published: Journal of Physics: Condensed Matter 30 315601 (2018).
Upon cooling, the parent compounds of iron-arsenide superconductors, (), undergo a structural phase change from a tetragonal to an orthorhombic crystal lattice at a characteristic temperature Ca-phasetransition . This structural symmetry lowering is usually accompanied or followed by magnetic ordering below from a paramagnetic to a stripe type antiferromagnetic (AFM) state Cruz . The trend for coupled but split orthorhombic/magnetic transitions is quite general for underdoped compounds of iron based materials, including NdFeAsO (1111 family), NaFeAs (111 family), with FeSe (11 family) being the only exception where orthorhombic distortion is followed by magnetic ordering only under pressure FeSeKothapati .
In contrast to minute magnitude of the orthorhombic distortion (typically less than 0.5% Blombergstrain ), large in-plane anisotropy of the normal-state electronic properties in the orthorhombic/antiferromagnetic phase of iron-based superconductors has been demonstrated by a variety of experimental probes, such as resistivity detwinning ; FisherScience1 , thermopower thermopower ; thermopower2 , Nernst effect thermopower2 ; Nernst , optical conductivity optics1 ; optics2 , neutron scattering neutrons , Raman scattering Raman , scanning tunneling microscopy AllanSTM , ARPES FisherReview , and ultrasound ultrasound , see Refs. FisherReview, ; RFMReview, for review. It was argued that large anisotropy is driven by the electronic degree of freedom, referred to as electronic nematic instability RFMReview . There is though intense debate as to the exact mechanism the electronic anisotropy appears.
The electrical conductivity of a metal, , depends both on parameters of the Fermi surface, reflected in the ratio known as the Drude weight ( is carrier density, is carrier effective mass), and the scattering rate , representing sum of elastic (, residual impurity/defect scattering) and inelastic (, scattering on phonons and/or magnons) contributions. The anisotropy in the nematic phase can be caused by both Fermi surface anisotropies arising, for instance, from the ferroorbital order triggered at the nematic transition ferroorbital1 ; ferroorbital2 ; ferroorbital3 and/or anisotropic scattering rates, both elastic, due to the development of local magnetic order around an impurity elastic1 ; elastic2 , and inelastic, due to the scattering of electrons by anisotropic magnetic fluctuations inelastic1 ; inelastic2 known to exist above neutrons .
Stress-dependent optical reflectivity studies in Co-doped BaFe2As2 (BaCo122 in the following) point to a dominant effect of the Drude weight optics1 ; optics2 in the development of in-plane anisotropy. However, reconstruction of the Fermi surface by additional periodicity introduced by stripe magnetic order below the magnetic transition severely complicates the analysis folding1 ; folding2 . Anisotropic reconstruction of the Fermi surface and the appearance of small pockets of high mobility carriers (similar to “Dirac cones”) Diraccones1 ; Diraccones2 ; Diraccones3 , may dramatically alter the resistivity anisotropy anisotropyDirac ; anisotropyDirac2 . Disentangling these contributions is fundamental to reveal the origin of the resistivity anisotropy in the nematic state.
Systematic studies of resistivity anisotropy over different materials provide important insight into this complicated problem. Evolution of the resistivity anisotropy with chemical substitution was studied in the model pnictide, for the cases of electron doping (Co substitution for Fe) FisherScience1 , hole doping (K substitution for Ba) Chen ; BlombergNature , as well as isoelectron substitution of As by P FisherP and of Fe by Ru UchidaRu . The results in both magnetically ordered state below and in the nematic state above show striking electron-hole asymmetry: whereas in the former the resistivity anisotropy is strongly enhanced by increasing the Co-doping concentration, in the latter the resistivity anisotropy is very small, and even changes sign from with increasing K-doping concentration to . Similar inverse anisotropy is found in other hole-doped compositions, (Ca,Na)Fe2As2 CaNa and Ba(Fe,Cr)2As2 Crdoping .
On the other hand in Fe(Se,Te) system, the anisotropy sign is similar to hole doped BaFe2As2 for both terminal compositions, FeTe FeTe and FeSe FeSe . The latter case is of particular interest since here tetragonal-to-orthorhombic transition is not accompanied by magnetic ordering and thus Fermi surface reconstruction. This enabled us to find that inelastic scattering provides dominant contribution to in-plane resistivity anisotropy of this material.
Study of iso-electron substitution systems provides an important advantage, since here electronic structure to zero degree remains composition independent. Unlike the Co and K substitutions, Ru does not introduce charge carriers in the Ba(Fe1-xRux)2As2 (BaRu122 in the following). ARPES study has shown that for a wide range of Ru concentration , the Fermi surface properties – such as the Fermi velocity and the Fermi wave-vector – remain practically unchanged with respect to those of the parent compound Kaminski . Thus, is an ideal compound to disentangle the contributions to the resistivity anisotropy arising from changes in the Fermi surface and from changes in the impurity concentration.
L. Liu et al. has recently found that resistivity anisotropy of the carefully annealed samples of BaRu122 is negligible in limit. They suggest that the increasing anisotropy with Ru composition is due to anisotropic impurity scattering, a conclusion different from our finding of dominant contribution of inelastic scattering in FeSe FeSe . In this study we revisit in-plane anisotropy in iso-electron substituted BaRu122 using crystals of significantly higher residual resistivity. We found that the difference between the two components of in-plane resistivity, , obeys Matthiessen rule in a broad composition range of dirty BaRu122, but their ratio remains strongly temperature dependent. We interpret this observation as an indication of strong band-dependent anisotropy of the elastic scattering, negligible for high mobility carriers and sizable for low mobility carriers.
I Experimental
Single crystals of Ba(Fe1-xRux)2As2 were grown using high temperature FeAs flux technique Thaler1 . The samples used in this study have relatively low Ru content and do not suffer from inhomogeneous dopant distribution. Sample compositions were determined with wavelength dispersive x-ray electron microprobe analysis (WDS) using a JOEL JXA-8200 electron-microprobe. Measurements were performed on 12 spots on sample surface. The compositions presented here are average with variance of approximately 0.2%. Most of the samples were not heat treated after growth, we refer to these samples as as-grown in the following. For reference purpose we also used samples of pure BaFe2As2, annealed at 800C for 24 hours RWHu . These samples showed temperature dependent resistivity with residual resistivity ratio (RRR) 5, intermediate between as-grown samples (RRR3) and long-term annealed samples, RRR30, studied in Refs. anisotropyDirac2, ; UchidaRu, . We refer to these samples as partially annealed in the following.
White - light, optical images were taken at temperatures down to 5 K using a polarization microscope Leica DMLM with the polarizer and analyzer almost in the crossed position, as described in detail in Ref. domains, . For initial sample screening, imaging was performed at the base temperature of 5 K, significantly below the temperatures of the coincident structural magnetic transitions for all compositions studied. We used 50 to 100 thickness slabs cleaved out of the crystals, and selected slabs with the clearest domain patterns. Sample bars for resistivity measurements were cut using a precision wire saw with typical dimensions of 1 mm wide, 4 mm long and 0.1 mm thick, the long direction being parallel to the tetragonal [110] crystal direction, which below becomes either the orthorhombic or axes.
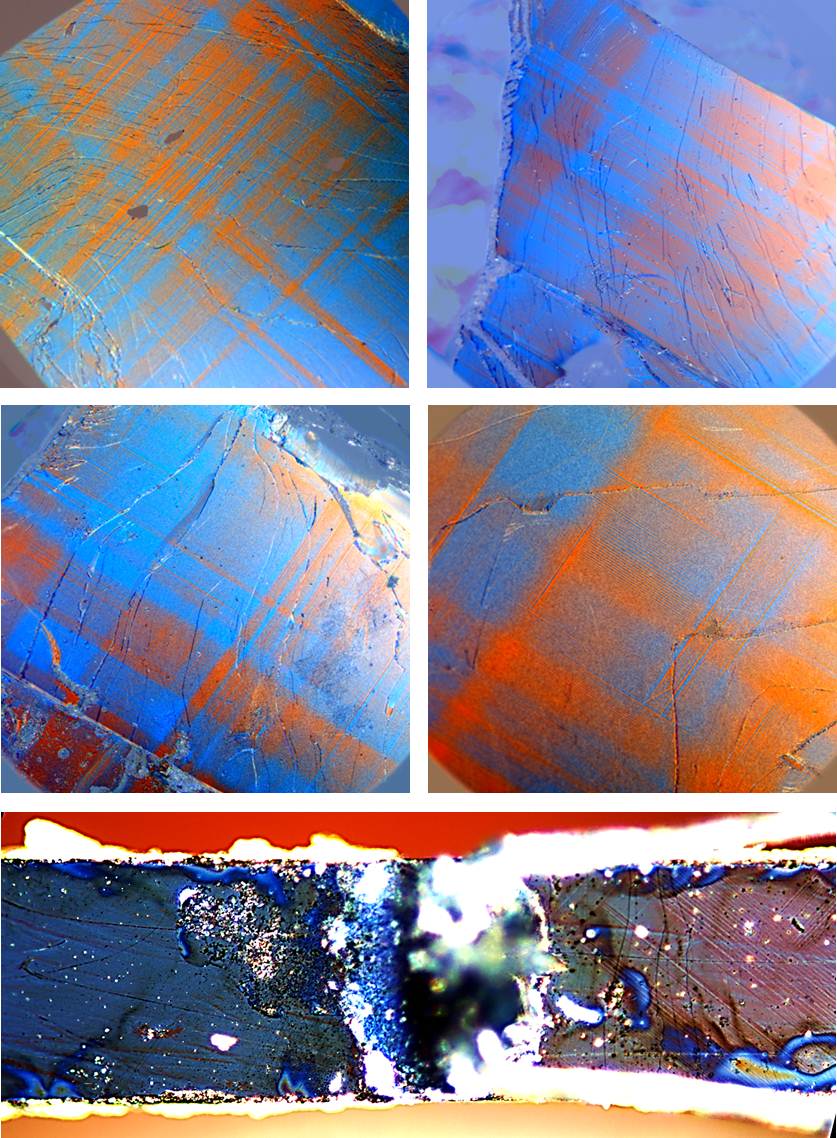
Contacts to the samples were made by soldering 50 Ag wires using Sn SUST ; patent . Strain was applied using push-screw horse-shoe device detwinning through potential wires, as described in detail in our previous papers detwinning ; detwinningSr . Samples remained under strain through the whole thermal cycle of resistivity measurements and during optical imaging, used to verify the completeness of the detwinning. In the bottom panel of Fig. 1 we show images of domains in the strain-free portion of the samples between current and potential contacts, as well as domain-free area between potential contacts. Four-probe resistivity measurements were made in Quantum design PPMS.
The detwinning process was performed as follows: Temperature dependent resistivity measurements and polarized optical microscopy images, at 5 K, were taken first on unstrained samples. Strain was then applied to samples in small, increasing increments. After each increase, samples were imaged under polarized microscopy and temperature dependent resistivity measurements were made. As the strain increases, the domain orientation with the longer, orthorhombic -axis, parallel to the strain becomes energetically more favorable than the other three domain orientations and consequently occupies an increasing fraction of the sample volume with increasing strain.
This process was continued until domains were no longer visible under polarized microscopy and resistivity anisotropy at low temperatures saturated (very similar to that found in previous study, Fig. 1 of Ref. UchidaRu ). Our previous X-ray diffraction studies detwinning ; detwinningSr have shown that when sufficient strain has been applied to a sample that domains are no longer visible, more than 90% of the sample volume fraction is represented by the dominant domain and is called the detwinned state.
In the twinned (unstrained) state, the sample is comprised of an equal population of each domain orientation and consequently the resistivity is the average resistivities along the and -axes, which we denote as . In the detwinned (strained) state, the sample is almost exclusively comprised of domains whose orthorhombic -axis is aligned parallel to the strain and therefore the direction of current flow for the resistivity measurement, which we denote as . From this we may calculate the resistivity along the orthorhombic -axis as .
II Results and Discussion
II.1 Temperature-dependent resistivity
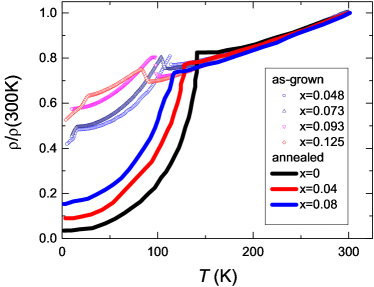
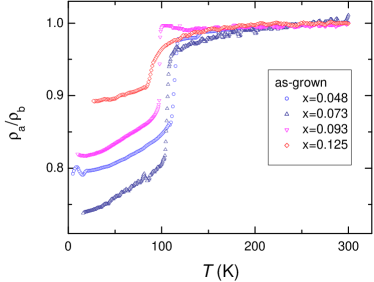
In Fig. 2 we show temperature-dependent resistivity of the as-grown samples of BaRu122 used in this study, with =0.048, 0.073, 0.093 and 0.125. To facilitate the comparison, we plot the data using normalized resistivity scale, , which removes error of geometric factor determination resulting in approximately 10% variation of . Most of the samples show filamentary superconductivity below 20 K, related to inhomogeneous strain distribution Paglione ; Colombier ; SKKim . For reference we plot similar measurements by L. Liu et al. on annealed samples UchidaRu . Two differences between as-grown and annealed samples should be pointed. As naturally expected, as-grown samples have significantly higher residual resistivity and hence lower residual resistivity ratio, RRR=. However, this difference is clearly visible only in the data below the temperature of the structural/magnetic transition , seen as a clear anomaly in . The temperature of the structural/magnetic transition itself in as-grown samples is always lower than in the annealed samples, and is suppressed more rapidly by combined action of substitution/disorder than by Ru substitution itself. This is very similar to the known effect of artificial disorder introduced by electron irradiation Kyuil ; TcTN on the temperatures of structural and superconducting transitions.
Significant variation of the residual resistivity of the samples, however, does not affect much resistivity of the samples at room temperature, in gross violation of Matthiessen rule. The actual value of resistivity remains unchanged within error bars of our measurements (mainly determined by the statistical error of geometric factor determination in prone to cracks micaceous samples of BaFe2As2 based materials anisotropy ; pseudogap ) for all Ru concentrations Rucaxis , and coincides within the same uncertainty with the value determined by L. Liu et al. for annealed samples UchidaRu . Moreover, normalizing slopes of the curves in the interval 250 to 300 K (the range where no strain induced anisotropy is observed) we obtain same, within 1% accuracy of the procedure, offset of the curves. For all the following analysis we accepted =300 cm for samples of all .
Observation of gross Matthiessen rule violation is in line with expectation for conductivity mechanism change in the ordered state below due to electronic structure modification. It reflects both change (decrease) of the carrier density with respect to paramagnetic state above and appearance of novel type of high mobility carriers, Dirac fermions, formed in the nodal areas of spin-density wave gap nodalSDW . Detailed Shubnikov-de Haas oscillation measurements on detwinned crystals of the parent BaFe2As2 in the magnetically ordered state reveled one hole and two electron pockets of the Fermi surface folding1 , with all pockets being three-dimensional in nature. The electrons belonging to pocket are located close to band-crossing points referred to as Dirac points. Due to high mobility these carriers are dominating the conductivity of annealed samples at low temperatures Diraccones1 ; Diraccones2 ; Diraccones3 ; anisotropyDirac ; anisotropyDirac2 , and are responsible for huge high-field magnetoresistance Diraccones1 ; Diraccones2 , strongly diminished in disordered samples folding1 .
For our following discussion it is important to understand that disorder selectively suppresses contribution of high mobility carriers. The conductivity of a metal with multiple sheets of the Fermi surfaces is determined by a sum of partial conductivities, . For simplicity lets consider a metal with two types of carriers. Carriers of type 1 are usual carriers, with density , Fermi velocity , effective mass and scattering time . Carriers of type 2 represent Dirac fermions, and are characterized by , , . As was shown by Kuo et al. anisotropyDirac from the analysis of the normal state magnetoresistance, the two contributions are of similar magnitude in non-annealed samples. Despite , conductivities and may be comparable due to a difference in effective masses/Fermi velocities. For samples with impurities, however, scattering rates for impurity, and inelastic , processes are added as , with saturation at in residual resistivity range. In samples with disorder, scattering rates on impurities for each type of carrier are dramatically different. The mean free path of the carriers in residual resistivity range is of the order of inter-impurity distance, , and thus . Due to , this leads to . As a result, in relatively dirty samples scattering rate on impurities for high mobility carriers becomes significantly higher than inelastic scattering rate. It is natural to assume that inelastic scattering rates for two types of carriers and are similar, though it is not necessary the case for strongly -dependent magnetic scattering. That is why once determines conductivity of high mobility carriers and is effectively diminished.
Important conclusion of this discussion is that even in a metallic state, without change of the band structure, the Matthiessen rule can be obeyed only as long as one carrier type is dominating the total conductivity. It can be obeyed approximately if the two types of carriers have similar properties and thus similar . Thus analyzing temperature-dependent resistivity as a function of disorder, we can highlight different contributions to conductivity and scattering. Detwinned samples give an additional bonus in this respect, here the difference between and would to a notable extent diminish contribution of inelastic scattering events.
II.2 Anisotropic resistivity
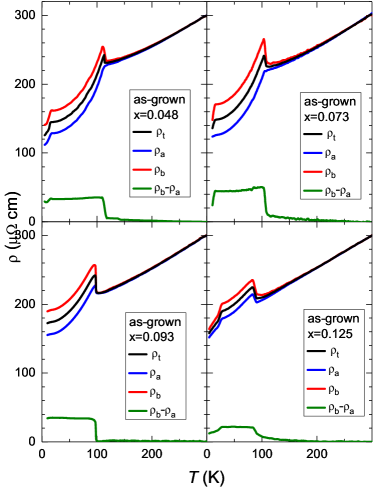
In Fig. 3 we plot temperature-dependent anisotropic resistivity as measured in strain-free twinned state, , strained state, , and calculated and the difference . The data are shown for samples with =0.048 (top left panel), =0.073 (top right), =0.093 (bottom left) and =0.125 (bottom right). Of note that the difference remains almost temperature independent in as-grown samples of all compositions.
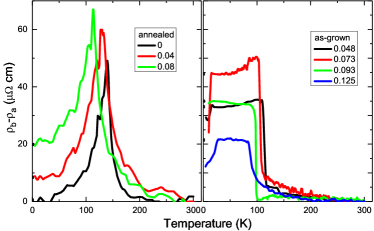
In Fig. 4 we plot temperature-dependent resistivity difference for annealed samples of BaRu122, =0, 0.04 and 0.08, data from Ref. UchidaRu, and as-grown samples with up to 0.125. The difference between the two data sets is dramatic. In disordered samples the difference remains nearly temperature-independent, while in annealed pure samples takes a sharp maximum below and decreases to zero on further cooling. Addition of Ru leads to build-up of finite residual difference at 0 in annealed samples. These results clearly suggest that high mobility carriers which dominate conductivity of pure samples at low temperatures, do not have any anisotropy of the residual resistivity, while “normal” carriers do. The temperature dependent part of resistivity in pure samples comes from “normal” carriers close to and from high mobility carriers at going to zero. Note also that the difference immediately below is comparable in annealed and as grown samples.
As we discussed above, observation of essentially temperature-independent difference for two components of in-plane resistivity is strong indication that one band is dominating transport of dirty samples, and conductivity of high mobility carriers is essentially eliminated. In situation of one dominant band we can distinguish between anisotropy of transport determined by Drude weight (Fermi surface) and by scattering. The Drude weight enters as a multiplicative factor into the expression for conductivity, and thus we should expect temperature independent ratio. In Fig. 5 we plot ratio of the component resistivities in disordered samples of BaRu122. In all cases the ratio shows rapid decrease from =1 above to lower values immediately below transition, followed by monotonic decrease on cooling. Observation of temperature dependent ratio of the in-plane resistivity components in conjunction with temperature -independent difference, see right panel of Fig. 4, strongly suggests that the anisotropy is determined by residual resistivity.
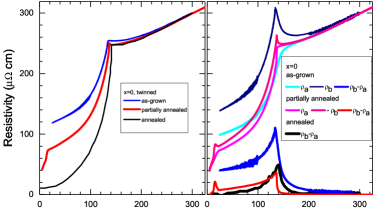
To get an additional insight into suggested switchover, in Fig. 6 we compare temperature-dependent anisotropic resistivity of pure BaFe2As2 with different annealing conditions. We plot data for as grown sample, intermediately annealed sample and carefully annealed sample (data from Ref. UchidaRu, ). Left panel shows resistivity of the samples in the twinned state, revealing monotonic decrease of residual resistivity with improved annealing. Right panel shows data in the detwinned state as well as the temperature-dependent difference. As can be seen, the residual term in the difference rapidly increases with disorder, confirming the trend found in Ru-doped samples. Of interest, the magnitude of increase below does not show monotonic dependence. The difference is the largest in the samples with the biggest effect above . This observation may suggest that the difference may come from a difference in the detwinning conditions, i.e. the value of compressive, as in Ref. UchidaRu, , or expansive stress used to detwin the samples.
In Fig. 7 we summarize our observations plotting and as a function of (left panel) for as-grown, partially annealed and annealed samples. We also plot vs , explicitly checking the linear relation between the two. In our analysis we ignored features due to partial superconductivity, observed in many samples below approximately 20 K. Two trends can be noticed. In addition to rising in ultra-pure samples, reflecting suppression of the contribution of high mobility carriers, a decrease of vs starts in heavily disordered samples. A non-monotonic feature observed for sample =0.073 coincides in with doping anomaly of Seebeck effect evolution, suggested as either originating from Fermi surface topology change (Lifshits transition) or gross change in transport scheme Halyna . From our data we can conclude that at least this crossover is not due to suppression of Dirac fermion contribution, which happens at lower .
The data of Fig. 7 clearly show that there are several processes involved in the evolution of resistivity anisotropy. High mobility carriers show no in-plane anisotropy of the electronic transport on . This conclusion is similar to the experimental observation of negligible resistivity anisotropy in residual range in FeSe FeSe . In FeSe all sheets of the Fermi surface are small TerashimafermiologyFeSe and of relatively high mobility. Observation of temperature independent difference for all dirty samples of BaRu122 as opposed to temperature dependent ratio, Figs. 4 and 5 implies that residual resistivity rather than the electronic structure is responsible for the anisotropy of the “normal” carriers.
III Conclusion
The main conclusions of this study may be summarized as follows. Resistivity of ultrapure annealed samples at low temperatures is mainly determined by high mobility carriers. This contribution does not show any anisotropy in residual resistivity range. Anisotropic contribution of normal mobility electrons can be clearly seen in samples with high residual resistivity, in which contribution of high mobility carriers is quenched by disorder, and in a temperature range immediately below . This contribution reveals temperature-independent difference of anisotropic resistivity components, which suggests its relation to anisotropy of residual resistivity. It does not show temperature-independent ratio of the components, as would be expected for anisotropy determined by the Fermi surface parameters. The reduced anisotropy in both elastic and inelastic channels in annealed samples is determined by the dominance in the conductivity of the high mobility carriers, strongly diminished in disordered as-grown samples. Our finding suggests that magnetic/nematic order has dramatically different effect on different parts of the Fermi surface. It predominantly affects inelastic scattering for small pocket high mobility carriers and elastic impurity scattering for larger sheets of the Fermi surface.
Acknowledgements.
The authors acknowledge useful discussions with R. M. Fernandes. This work was supported by the U.S. Department of Energy (DOE), Office of Science, Basic Energy Sciences, Materials Science and Engineering Division. The research was performed at the Ames Laboratory, which is operated for the U.S. DOE by Iowa State University under contract DE-AC02-07CH11358.References
- (1) Ni N, Nandi S, Kreyssig A, Goldman A I, Mun E D, Bud’ko S L and Canfield P C 2008 Phys. Rev. B 78 014523
- (2) de la Cruz C, Huang Q, Lynn J W, Li J Y, Ratcliff W, Zarestky J L, Mook H A, Chen G F, Lou J L, Wang N L and Dai P C 2008 Nature 453 899
- (3) Kothapalli K, Böhmer A E, Jayasekara W T, Ueland B G, Das P, Sapkota A, Taufour V, Xiao Y, Alp E, Bud’ko S L, Canfield P C, Kreyssig A and Goldman A I 2016 Nature Comm. 7 12728
- (4) Blomberg E C, Kreyssig A, Tanatar M A, Fernandes R M, Kim M G, Thaler A, Schmalian J, Bud’ko S L, Canfield P C, Goldman A I and Prozorov R 2012 Phys. Rev. B 85 144509
- (5) Tanatar M A, Blomberg E C, Kreyssig A, Kim M G , Ni N, Thaler A, Bud’ko S L, Canfield P C, Goldman A I, Mazin I I and Prozorov R 2010 Phys. Rev. B 81 184508
- (6) Chu J-H, Analytis J G, De Greve K, McMahon P L, Islam Z, Yamamoto Y and Fisher I R 2010 Science 329 824
- (7) Jiang Shuai, Jeevan H S, Dong Jinkui and Gegenwart P 2013 Phys. Rev. Lett. 110 067001
- (8) Matusiak Marcin, Babij Michał and Wolf Thomas 2018 Phys. Rev. B 97 100506(R)
- (9) Matusiak Marcin, Rogacki Krzysztof and Wolf Thomas 2018 Phys. Rev. B 97 220501(R)
- (10) Mirri C, Dusza A, Bastelberger S, Chu J-H, Kuo H-H, Fisher I R and Degiorgi L 2014 Phys. Rev. B 90 155125
- (11) Mirri C, Dusza A, Bastelberger S, Chinotti M, Degiorgi L, Chu J-H, Kuo H-H and Fisher I R 2015 Phys.Rev. Lett. 115 107001
- (12) Lu Xingye, Park J T, Zhang Rui, Luo Huiqian, Nevidomskyy A H, Si Qimiao and Dai Pengcheng 2014 Science 345 657
- (13) Gallais Y, Fernandes R M, Paul I, Chauvière L, Yang Y-X, Méasson M-A, Cazayous M, Sacuto A, Colson D and Forget A 2013 Phys. Rev. Lett. 111 267001
- (14) Chuang T M, Allan M P, Lee Jinho, Xie Yang, Ni Ni, Bud’ko S L, Boebinger G S, Canfield P C and Davis J C 2010 Science 327 181
- (15) Fisher I R, Degiorgi L and Shen Z X 2011 Rep. Progr. Phys. 74 124506
- (16) Fernandes R M, VanBebber L H, Bhattacharya S, Chandra P, Keppens V, Mandrus D, McGuire M A, Sales B C, Sefat A S and Schmalian J 2010 Phys. Rev. Lett. 105 157003
- (17) Fernandes R M, Chubukov A V and Schmalian J 2014 Nature Phys. 10 97
- (18) Chen C-C, Maciejko J, Sorini A P, Moritz B, Singh R R P and Devereaux T P 2010 Phys. Rev. B 82 100504
- (19) Lv W and Phillips P 2011 Phys. Rev. B 84 174512
- (20) Liang S, Alvarez G, Sen C, Moreo A and Dagotto E 2012 Phys. Rev. Lett. 109 047001
- (21) Allan M P, Chuang T-M, Massee F, Xie Yang , Ni N, Bud’ko S L, Boebinger G S, Wang Q, Dessau D S, Canfield P C, Golden M S and Davis J C 2013 Nature Phys. 9 220
- (22) Gastiasoro Maria N, Paul I, Wang Y, Hirschfeld P J Andersen Brian M 2014 Phys. Rev. Lett. 113 127001
- (23) Fernandes R M, Abrahams E and Schmalian J 2011 Phys. Rev. Lett. 107 217002
- (24) Breitkreiz M, Brydon P M R and Timm C 2014 Phys. Rev. B 90 121104(R)
- (25) Terashima Taichi, Kurita Nobuyuki, Tomita Megumi, Kihou Kunihiro, Lee Chul-Ho, Tomioka Yasuhide, Ito Toshimitsu, Iyo Akira, Eisaki Hiroshi, Liang Tian, Nakajima Masamichi, Ishida Shigeyuki, Uchida Shin-ichi, Harima Hisatomo and Uji Shinya 2011 Phys. Rev. Lett. 107 176402
- (26) Valenzuela B, Bascones E and Calderon M J 2010 Phys. Rev. Lett. 105 207202
- (27) Huynh Khuong K, Tanabe Yoichi and Tanigaki Katsumi 2011 Phys. Rev. Lett. 106 217004
- (28) Tanabe Y, Huynh K K, Urata T, Heguri S, Mu G, Xu J T, Nouchi R and Tanigaki K 2012 Phys. Rev. B 86 094510
- (29) Tanabe Y, Huynh K K, S. Heguri S, Mu G, Urata T, Xu J, Nouchi R, Mitoma N and Tanigaki K 2011 Phys. Rev. B 84 100508(R)
- (30) Kuo Hsueh-Hui, Chu Jiun-Haw, Riggs Scott C, Yu Leo, McMahon Peter L, De Greve Kristiaan, Yamamoto Yoshihisa, Analytis James G and Fisher Ian R 2011 Phys. Rev. B 84 054540
- (31) Ishida S, Liang T, Nakajima M, Kihou K, Lee C H, Iyo A, Eisaki H, Kakeshita T, Kida T, Hagiwara M, Tomioka Y, Ito T and Uchida S 2011 Phys. Rev. B 84 184514
- (32) Ying J J, Wang X F, Wu T, Xiang Z J, Liu R H, Yan Y J, Wang A F, Zhang M, Ye G J, Cheng P, Hu J P and Chen X H 2011 Phys. Rev. Lett. 107 067001
- (33) Blomberg E C, Tanatar M A, Fernandes R M, Mazin I I, Shen Bing , Wen Hai-Hu, Johannes M D, Schmalian J and Prozorov R 2013 Nature Comm. 4 1914
- (34) Kuo H-H, Analytis J G, Chu J-H, Fernandes R M, Schmalian J and Fisher I R 2012 Phys. Rev. B 86 134507
- (35) Liu L, Mikami T, Ishida S, Koshiishi K, Okazaki K, Yoshida T, Suzuki H, Horio M, Ambolode L C C II, Xu J, Kumigashira H, Ono K, Nakajima M, Kihou K, Lee C H, Iyo A, Eisaki H, Kakeshita T, Uchida S and Fujimori A 2015 Phys. Rev. B 92 094503
- (36) Ma J Q, Luo X G, Cheng P, Zhu N, Liu D Y, Chen F, Ying J J, Wang A F, Lu X F, Lei B and Chen X H 2014 Phys. Rev. B 89 174512
- (37) Kobayashi Tatsuya, Tanaka Kiyohisa, Miyasaka Shigeki and Tajima Setsuko 2015 J. Phys. Soc. Jpn. 84094707
- (38) Jiang Juan, He C, Zhang Y, Xu M, Ge Q Q, Ye Z R, Chen F, Xie B P and Feng D L 2013 Phys. Rev. B 88 115130
- (39) Tanatar M A, Böhmer A E, Timmons E I, Schütt M, Drachuck G, Taufour V, Kothapalli K, Kreyssig A, Bud’ko S L, Canfield P C, Fernandes R M and Prozorov R 2016 Phys. Rev. Lett. 117 127001
- (40) Dhaka R S, Liu Chang, Fernandes R M, Jiang Rui, Strehlow C P, Kondo Takeshi, Thaler A, Schmalian Jörg, Bud’ko S L, Canfield P C and Kaminski Adam 2011 Phys. Rev. Lett. 107 267002
- (41) Thaler A, Ni N, Kracher A, Yan J Q, Bud’ko S L and Canfield P C 2010 Phys. Rev. B 82 014534
- (42) Hu Rongwei, Bud’ko Sergey L, Straszheim Warren E and Canfield Paul C 2011 Phys. Rev. B 83 094520
- (43) Tanatar M A, Kreyssig A, Nandi S, Ni N, Bud’ko S L, Canfield P C, Goldman A I and Prozorov R 2009 Phys. Rev. B 79 180508 (R)
- (44) Tanatar M A, Ni N, Bud’ko S L, Canfield P C and Prozorov R 2010 Supercond. Sci. Technol. 23 054002
- (45) Tanatar M A, Prozorov R, Ni N, Bud’ko S L and Canfield P C 2011 U.S. Patent 8,450,246 (Sept.1, 2011).
- (46) Blomberg E C, Tanatar M A, Kreyssig A, Ni N, Thaler A, Hu Rongwei, Bud’ko S L, Canfield P C, Goldman A I and Prozorov R 2011 Phys. Rev. B 83 134505
- (47) Saha S R, Butch N P, Kirshenbaum K, Paglione Johnpierre and Zavalij P Y 2009 Phys. Rev. Lett. 103 037005
- (48) Colombier E, Bud’ko S L, Ni N and Canfield P C 2009 Phys. Rev. B 79 224518
- (49) Kim S K, Torikachvili M S, Colombier E, Thaler A, Bud’ko S L and Canfield P C 2011 Phys. Rev. B 84 134525
- (50) Cho K, Kończykowski M, Murphy J, Kim H, Tanatar M A, Straszheim W E, Shen B, Wen H H and Prozorov R 2014 Phys. Rev. B 90 104514
- (51) Mizukami Yuta, Kończykowski Marcin, Matsuura Kohei, Watashige Tatsuya, Kasahara Shigeru, Matsuda Yuji and Shibauchi Takasada 2017 J. Phys. Soc. Jpn. 86 083706
- (52) Tanatar M A, Ni N, Martin C, Gordon R T,Kim H, Kogan V G, Samolyuk G D, Bud’ko S L, Canfield P C and Prozorov R 2009 Phys. Rev. B 79 094507
- (53) Tanatar M A, Ni N, Thaler A, Bud’ko S L, Canfield P C and Prozorov R 2010 Phys. Rev. B 82 134528
- (54) Tanatar M A, Torikachvili M S, Thaler A, Bud’ko S L, Canfield P C and Prozorov R 2014 Phys. Rev. B 90 104518
- (55) Ran Y, Wang F, Zhai H, Vishwanath A and Lee D H 2009 Phys. Rev. B 79 014505
- (56) Hodovanets H, Mun E D, Thaler A, Bud’ko S L and Canfield P C 2011 Phys. Rev. B 83 094508
- (57) Terashima Taichi, Kikugawa Naoki, Kiswandhi Andhika, Choi Eun-Sang, Brooks James S, Kasahara Shigeru, Watashige Tatsuya, Ikeda Hiroaki, Shibauchi Takasada, Matsuda Yuji, Wolf Thomas, Böhmer Anna E, Hardy Frédéric, Meingast Christoph, Löhneysen Hilbert v, Suzuki Michi-To, Arita Ryotaro and Uji Shinya 2014 Phys. Rev. B 90 144517
- (58) Watson M D, Kim T K, Haghighirad A A, Davies N R, McCollam A, Narayanan A, Blake S F, Chen Y L, Ghannadzadeh S, Schofield A J, Hoesch M, Meingast C, Wolf T and Coldea A I 2015 Phys. Rev. B 91 155106