Competition between Polar and Antiferrodistortive Modes and Correlated Dynamics of the Methylammonium Molecules in MAPbI3 from Anelastic and Dielectric Measurements
Abstract
The mechanisms behind the exceptional photovoltaic properties of the metallorganic perovskites are still debated, and include a ferroelectric (FE) state from the ordering of the electric dipoles of the organic molecules. We present the first anelastic (complex Young’s modulus) and new dielectric measurements on CH3NH3PbI3, which provide new insight on the reorientation dynamics of the organic molecules, and the reason why they do not form a FE state. The permittivity is fitted within the tetragonal phase with an expression that includes the coupling between FE and octahedral tilt modes, indicating that the coupling is competitive and prevents FE ordering. The onset of the orthorhombic phase is accompanied by sharp stiffening, analogous to the drop of permittivity, due to the hindered molecular dynamics. On further cooling, an intense anelastic relaxation process without a dielectric counterpart suggests the reorientation of clusters of molecules with strong antiferroelectric correlations.
ARTOV] Istituto di Struttura della Materia-CNR (ISM-CNR), Area della Ricerca di Roma - Tor Vergata, Via del Fosso del Cavaliere 100, I-00133 Roma, Italy Fis] Dipartimento di Fisica, Università di Roma "La Sapienza", p.le A. Moro 2, I-00185 Roma, Italy \alsoaffiliation[ARTOV] Istituto di Struttura della Materia-CNR (ISM-CNR), Area della Ricerca di Roma - Tor Vergata, Via del Fosso del Cavaliere 100, I-00133 Roma, Italy MLIB] Istituto di Struttura della Materia-CNR (ISM-CNR), Area della Ricerca di Roma 1, Via Salaria, Km 29.300, I-00015 Monterotondo Scalo, Roma, Italy
![[Uncaptioned image]](/html/1807.06860/assets/x1.png)
The metallorganic lead-halide perovskites with formula MAPbX3 (MA = methylammonium ion CH3NH3, X = Cl, Br, I) have been studying since at least the 1980s,1, 2, 3 but started attracting enormous attention in the last years, thanks to their exceptional photovoltaic properties,4 which allow inexpensive solar cells with efficiencies of over 20% to be constructed. Some important issues are still debated, e.g. the manner of dealing with their scarce stability, and the mechanisms responsible for their excellent photovoltaic properties.5 Closely connected with the latter is the often invoked occurrence of ferroelectricity at room temperature. Indeed, an internal field arising from a spontaneous polarization would be highly beneficial to the transport of the photocarriers from the bulk to the electrodes,6 and also the walls separating ferroelectric (FE) domains have been proposed to be potentially beneficial for the generation and mobility of the photocarriers.6, 7 Various indications of ferroelectricity or antiferroelectricity8 (AFE) switchable to FE have been reported, such as Piezo Force Microscopy images of switchable FE domains9 and loops,10, 8, 11 while in the related metallorganic perovskites based on MnCl3 instead of PbI3 octahedra, even a sizeable piezoelectric response has been measured.12 On the other hand, there are also several failed attempts to reveal hard indications of a room temperature FE state, often with alternative explanations for the successful observations,13, 14, 5, 15 so that the issue of ferroelectricity in the organic halide perovskites is considered open.5 Numerous are also the predictions of FE states at room temperature from first principle calculations,6 even though it has been objected that the orientational order of the polar MA molecules would be thermally disrupted starting from very low temperature.16
We report anelastic (complex Young’s modulus) and dielectric measurements of MAPbI3, which in combination reveal new features on the reorientation dynamics of the MA molecules, and the hindrance of their FE ordering by coupling with the tilt modes of the PbI6 octahedra.
MAPbI3 was prepared by a one-step process at room temperature in an environmentally friendly solvent with ultrasound assistance, as described in the Supporting Information (SI). X-ray diffraction on the microcrystalline powder showed a single tetragonal phase without contaminants like PbI2 or hydrates of the compound. The samples were pressed as discs and thin bars (SI).
The complex Young’s modulus, , whose reciprocal is the compliance , the mechanical analogue of the dielectric susceptibility, was measured by exciting the flexural modes of the bars suspended in vacuum on thin wires. The resonance frequencies are ,17 and therefore, choosing a reference temperature , one can plot . The elastic energy loss was measured from the free decay or from the resonance curve under forced vibration. The complex dielectric permittivity, , with losses , was measured on the discs or fragments of the bars. Experimental details and some information on anelasticity are found in the SI.
Figure 1 presents the anelastic spectrum of a MAPbI3 bar measured during cooling and subsequent heating, at , 2.5 and 6.1 kHz. The upper panel shows the real part of the complex Young’s modulus normalized to the maximum value in the cubic (C) phase, and the lower panel the elastic energy loss (for the structural phases see e.g. Refs. 10, 18). There are two sharp steps in at the transition temperature K to the tetragonal (T) phase, with K of hysteresis between heating and cooling, and at the transition to the orthorhombic (O) phase below K, with K of hysteresis. A steplike softening, like that at , is expected from the standard Landau theory both for tilt and FE phase transitions. In fact, the softening is due to the coupling between strain and the order parameter, tilt angle or polarization , which in both cases are described by a term or in the free energy.19 A typical example of perovskite showing both transitions is PbZr1-xTixO3 (PZT), where the polar interactions producing ferroelectricity are much stronger than the lattice mismatch between the anharmonic PbO framework and the rigid (Ti/Zr)O6 octahedra, which cause octahedral tilting.20 Therefore, in PZT the Curie temperature is larger than the tilt transition temperature and also the steplike softening at is larger than that at . In the metallorganic halides the opposite is true: they exhibit clear multiple tilt transitions, but the FE state at room temperature is, if any, weak, unconventional and controversial, except for few exceptions.12, 21 The comparison between the elastic and dielectric responses, the latter practically unperturbed around (Fig. 8 of SI and Refs. 3, 22, 23), leaves no doubt that the transition at this temperature involves only octahedral tilting.
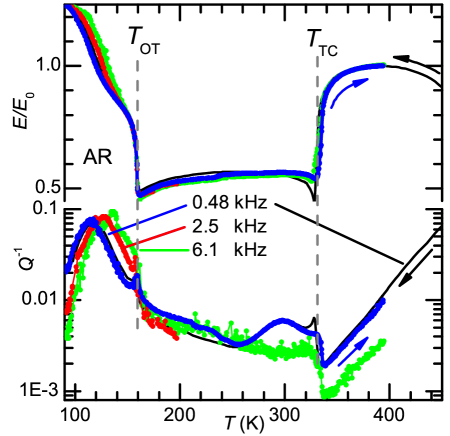
The steplike stiffening, instead of softening, below is a less conventional behavior. Few cases have been reported, where stiffening occurs at a transition involving octahedral tilting; in BaCeO3 and SrZrO3 this occurs passing from a orthorhombic or tetragonal tilted high temperature phase to the orthorhombic phase,24, 25 with the same tilt pattern of MAPbI3 ( in Glazer’s notation, see SI), but the stiffening could not be explained within the usual Landau treatment.24, 25 Also PbZrO3 stiffens when passing from the untilted or disorderly tilted FE phase to the AFE tilted () phase, but in that case the stiffening can be explained by the loss of the piezoelectric softening, when passing from the FE to the AFE phase (note 12 of Ref. 26). We believe that, in the case of MAPbI3, the stiffening when entering in the O phase has two main causes: the loss of mobility of the MA molecules and the stabilization of shorter and hence stiffer NHI bonds.27 As shown by high frequency dielectric,2 inelastic neutron scattering,28 NMR29 and ultrafast 2D vibrational spectroscopy30 experiments, the mean reorientation time of MA with electric dipole in the C and T phases is extremely short, s, and causes a Debye dielectric relaxation2
| (1) |
| (2) |
where is the vacuum permittivity, the Boltzmann constant, m-3 the number of MA per unit volume, their relaxation time, close to the reorientation time. The MA posses also an elastic dipole31, 17 with anisotropic component , and therefore the compliance , which is the mechanical analogue of the dielectric susceptibility , must contain a contribution identical to Eq. (1) but with instead of . Then, there is a maximum in the losses at , while for shorter , or higher , the mechanical loss is negligible and the compliance softened of . Extrapolating the Arrhenius law with s and K found from high frequency dielectric relaxation,2 we find that the condition would occur around 50 K at our frequencies, but, if the MA get abruptly blocked in the O phase, then the restiffening to the unrelaxed compliance occurs sharply at , contributing to the observed anomaly. Further stiffening below may result from the strengthening of the shorter HI bonds. The loss of mobility of the MA must not be complete at , however, because still an important anelastic relaxation, labeled AR in Fig. 1, is observed within the O phase.
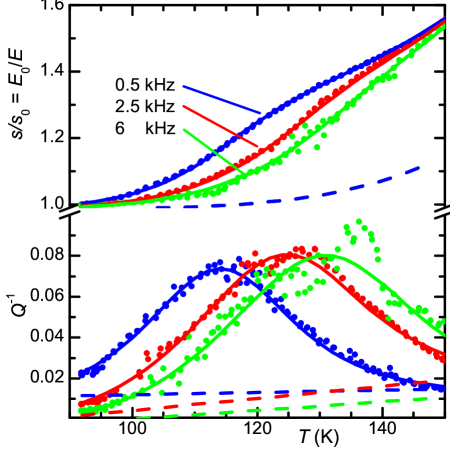
This relaxation is much broader than simple Debye, and the fit in Fig. 2 has been obtained with
| (3) |
which is the Havriliak-Negami expression
for broadened dielectric relaxations, with the inversion of the Cole-Davidson distribution with respect to small and large ,32 which follows the Arrhenius law. An average asymmetry between the initial and final energies of the elementary relaxation events,33 has been introduced in order to reproduce the increase of the intensity with , instead of the decrease as . For the background (dashed lines) contribution to the real part we chose , and linear backgrounds for the losses. The main fitting parameters are: s, K, , , K. It results that the relaxation times not only are broadly distributed (), but also highly correlated. In fact, is two orders of magnitude larger than for typical independent relaxations of molecules and point defect, while it is characteristic of extended/correlated defects, such as domain walls and dislocations.17
Indeed, relaxation of the walls between the different variants of O domains is expected, and the same is true within the T phase, where the curves are much broader and with little dispersion in frequency, so conforming to the typical signature of domain wall relaxation. The fitted peak in the O phase, instead, is much more sharp and intense than the DW relaxation within the T phase, and this suggests that a considerable fraction of MA contributes to it. Also in the paraelectric phase of [(CH3)2NH2]Co(HCOO)3 an anelastic relaxation process has been found by Resonant Ultrasound Spectroscopy34 (RUS) and attributed to the reorientation of the dimethylammonia. In that case, in the absence of measurements at several frequencies, it has been assumed that the process is simple Debye. In our case, instead, we can also say that the strong correlations between neighboring MA, mediated by octahedral tilting, must be AFE, because the dielectric relaxation does not show the same process as the anelastic one (see Fig. 3 later on). Indeed, the MA in the phase are AFE ordered along the axis.35, 18 Therefore, the anelastic relaxation may arise, for example, from clusters of an even number of MA, which reorient by together with the surrounding octahedral distortions, maintaining the AFE correlation, and hence without a net change of the electric polarization.
Before presenting the dielectric data, we mention that the mechanical properties of MAPbI3 have recently been measured also by RUS36 and ultrasound propagation on crystals,23 probing higher frequencies and presumably elastic constants little sensitive to the MA reorientations, which occur mainly in the tetragonal plane. Those measurements cannot be directly compared with the Young’s modulus reported here, which, being a polycrystalline average, contains the contributions of all the elastic constants.
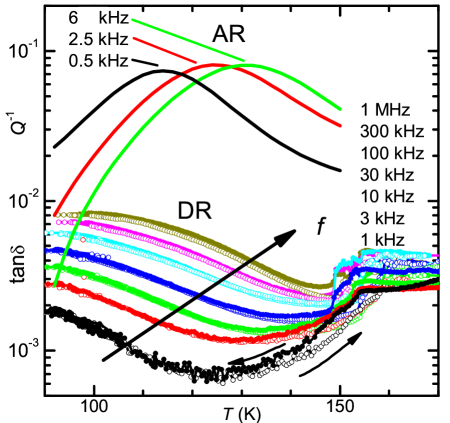
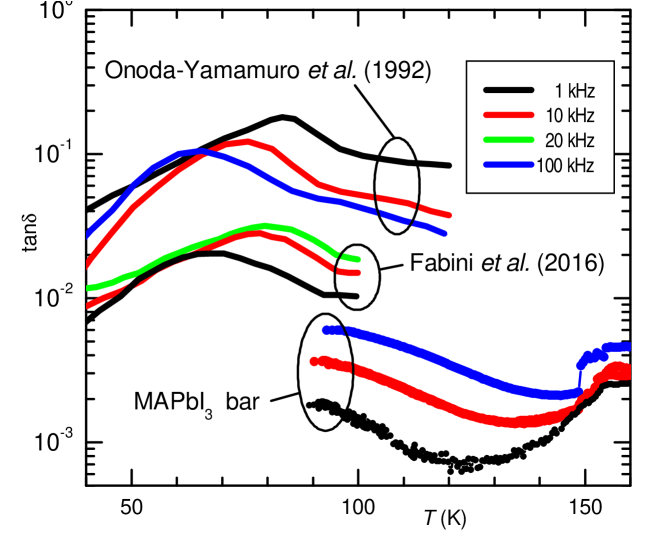
Figure 3 shows the complex permittivity measured on a piece of the sample used in Fig. 2, together with the fitting anelastic curves, and it is clear that a dielectric relaxation exists, but much slower than the anelastic one and with small intensity. Being a very broad relaxation, it might be related to domain walls. This dielectric relaxation, though with smaller intensity, is compatible with the high temperature tails of previous measurements extended to lower temperatures3, 37 (see Fig. 9).
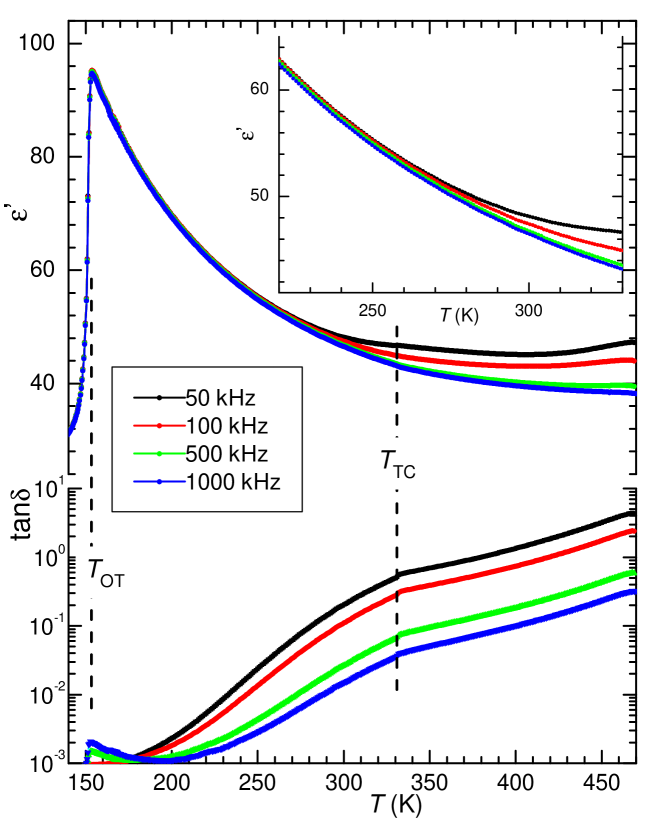
We pass now to the real part of the dielectric permittivity, measured on discs at frequencies up to 1 MHz (see Fig. 4 and Fig. 8), which substantially confirms previous measurements:3, 38, 22, 23 no sign of a transition justifying a normal FE state at room temperature, but an increase of the Curie-Weiss type up to , which suggests that, in the absence of the O/T tilt transition, a FE state might be possible below that temperature. As already mentioned, the permittivity at 90 GHz2 has been fitted with a Debye relaxation, Eqs. (1-2), finding the Arrhenius parameters of and a dipole moment D for MA in MAPbI3 (1 Debye = C m, but using the data in Table II of Ref. 2 we find D for MAPbI3), not far from other estimates of D from low frequency dielectric and first principle calculations.3, 22, 6
The extrapolation of the Arrhenius law so found for to our maximum frequency of 1 MHz, shifts the region of frequency dispersion, , below 90 K, and any frequency dispersion in the T and C phases comes from much slower processes, e.g. Maxwell-Wagner from free charge carriers. These relaxations are present also in our samples above room temperature (Fig 8), but negligible at 1 MHz below 280 K. In these conditions, it is possible to probe the MA dipoles through the term in Eq. (1), which becomes if the MA cooperatively order themselves in a FE phase below . In the context of molecular reorientation, the Clausius-Mosotti formula is used, which can be rewritten as (see SI)
| (4) | |||||
| (5) |
namely the Curie-Weiss formula with Curie constant
| (6) |
Attempts to fit our data with Eq. (20) fail, because of the excessive curvature of the fitting curves. The permittivity is calculated selfconsistently,39, 40 taking into account that the local field felt by the dipole is enhanced by the polarization of the surrounding dipoles. Then, the situation is improved using models where the local field is decreased with respect to the Lorentz field,41, 39, 40 and so is also the rise of with respect to , due to the cooperative ordering. Accordingly, of MAPbI3 has been fitted with the formula of Onsager,41, 39, 40 but since its curvature is now too low to fit the data, the term has been substituted with .3, 42 The fits obtainable in this manner are good, and this is true also for our data, but the problem is that the introduction of in the Onsager formula does not correspond to any physical model. In Onsager’s model the effect of a dipole on its neighbors is totally eliminated, so eliminating from the start the possibility of FE ordering, and the significance of the introduction of and of the magnitude of the MA dipole extracted in this manner is dubious.
We discuss therefore another possible origin of the peculiar rise of below room temperature: the coupling between the reorienting MA and the tilting of the surrounding PbI6 octahedra. This interaction should not be ignored, especially in view of the recent suggestion that the tilt transitions are due more to the H bonds between MA and the halides than to the shrinking of the MAI network with respect to the less compressible PbI6,27 as usual in other perovskites.20
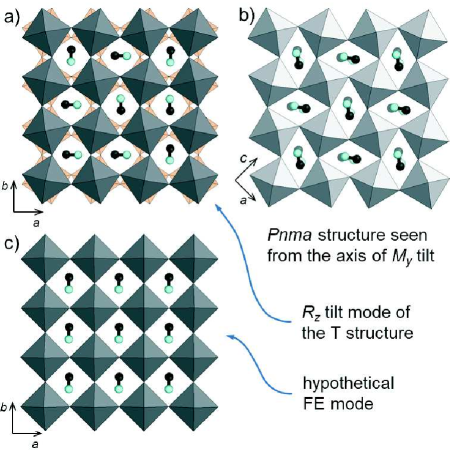
In-phase tilting of the octahedra along an axis creates an antiferrodistortive (AFD) pattern, that competes with the FE ordering of the MA dipoles, as shown in Fig. 5b). This is the case of the O ground state of MAPbI3,18 with tilt pattern in Glazer’s notation (SI), where in-phase tilting about the axis (called mode) creates rhombic channels, and the MA molecules lay within the plane, arranged approximately according to the longer diagonals of the rhombi and in AFE manner along the axis.18 Though tilting is a rather common ground state of perovskites with strong tendency to tilting, in the case of MAPbX3 it seems to be favored by the formation of short NHX hydrogen bonds, and probing the instantaneous local structure suggests that this type of tilts and distortions persists even in the C phase.43, 44 It can be concluded that coupling between the tilt and the FE modes, where the MA must be all parallel (Fig. 5c)), is competitive. The situation is open for the modes, in antiphase along the tilt axis (Fig. 5a); in that case, the MA molecule sits in the middle of two rhombic spaces at 90∘ with each other, so that, in the absence of additional interactions, there is no need for the MA molecules to arrange themselves in an AFD manner. This is confirmed by PZT, a classic FE: in its rhombohedral FE phase it undergoes tilting, and the concomitant small increase of and of the polarization indicate slightly cooperative coupling between and FE modes.20
The effect of coupling between two modes can be described in a phenomenological manner within the Landau theory of phase transitions. The simplest possible expansion of the free energy for our purpose is (SI and Ref. 45)
| (7) |
where the two order parameters are the polarization and tilt angle , and , induce FE and tilt transitions below and , in the absence of coupling (). The biquadratic coupling term is the lowest order mixed term permissible by symmetry in this case. As shown in SI, the dielectric susceptibility obtained from Eq. (10) in the paraelectric and untilted phase is simply i.e. the Curie-Weiss law with Curie constant , unaffected by tilting. This means that, in the temperature range of interest , we can ignore the lower tilt transition at , identify with the mode condensed in the T phase, and set and , since no trace of FE transition is found in the dielectric susceptibility and compliance above . In the T phase, the permittivity becomes (SI)
| (8) | |||||
This formula is the Curie-Weiss law with a correction term to . Besides changing the curvature of , this shifts the onset of the FE transition, when diverges, to
so that a cooperative (competitive) interaction with the tilt mode raises (lowers) with respect to . The above formula assumes ; in order to include , and to relate the phenomenological constants to the magnitude of the electric dipole of the reorienting MA, we compare Eq. (8) with Eqs. (205) and insert there the correction for polar-tilt coupling:
| (9) |
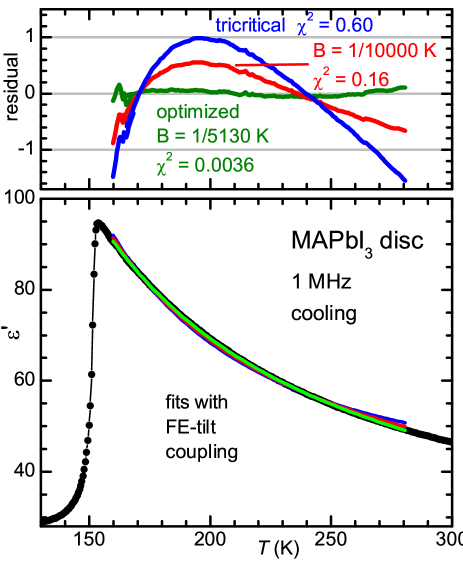
Figure 4 shows the best fit (green curve) with Eq. (15) of measured in a disc at 1 MHz during cooling. The quality of the fit is the same as with formulae like that of Onsager, but the values and meanings of the parameters are quite different. The best fit () with fixed at K, yields K, K, , from which it results K, D and K. Therefore, the coupling between the FE and tilt modes is competitive and the FE transition is even suppressed at any temperature. The fit is quite sensitive to the magnitude of this coupling, as demonstrated by the fact that doubling (red curve) increases of nearly 50 times. The origin for such a strong competitive coupling between the tilt mode and the FE MA ordering may be that the tendency to form short NHI bonds leading to the distortions of the ground state exists also in the T phase.43, 44 The tilt transition at K has been reported to be first-order, as we find here, but also close to tricritical.18 We tried to fit also with the tricritical free energy, by substituting the term with , but the fit yielded similar values of the various parameters with a definitely worse quality (blue curve with 165 times larger than the best fit). The description of first order transitions requires the inclusion of both and terms, which may somewhat improve the fit, thanks to the additional parameter, but with scarce additional insight, in view of the excellent result already obtainable with the simplest free energy.
In conclusion, we presented anelastic ( kHz) and dielectric (1 kHz MHz) measurements on MAPbI3, which can be fitted very well within a comprehensive picture of the reorientation dynamics of the electric and elastic dipoles associated with the MA molecules, their correlations and their coupling with the tilt modes of the PbI3 octahedra. It results that the coupling with the ferroelectric and antiferrodistortive modes is competitive, and prevents the ordering into a ferroelectric phase. At the onset of the tilt transition to the orthorhombic structure the reorientation dynamics of the molecules is strongly hindered, resulting in stiffening of both the dielectric and elastic susceptibilities. Yet, a considerable fraction of MA can still reorient in the orthorhombic phase as clusters of antiferroelectrically correlated dipoles, which give rise to intense anelastic relaxation without a dielectric counterpart.
The authors thank Paolo Massimiliano Latino (ISM-Tor Vergata) for his technical assistance, Sara Notarantonio (ISM-Montelibretti) for the assistance in the synthesis and Dr. Gloria Zanotti for fruitful discussions.
1 Supplementary Information
1.1 Experimental methods
1.1.1 Synthesis
All starting chemicals were purchased from Sigma-Aldrich; methylammonium iodide (CH3NH3I) was synthesized following the method reported in Ref. 46: hydroiodic acid (HI) (aqueous solution 40%) was added stoichiometrically dropwise to methylamine (CH3NH3) (aqueous solution 57%) under stirring at C, and the solution was left 2 h under stirring, then the solvent was removed by rotary evaporation and the solid was washed with diethylether several times and dried under vacuum to yield a white crystalline solid.
MAPbI3 (CH3NH3PbI3) was synthesized following the procedure reported in Ref. 47 with slight modifications; 2.80 g of PbI2 and 2.90 g of CH3NH3I were mixed and ground in a mortar for at least 5’, then the mixture was added to 100 ml of glacial acetic acid in a flask placed in an ultrasonic bath at ambient temperature in agitation for 20’; the solid was decanted and after 8 h was filtered and repeatedly washed with de-aerated anhydrous ethanol and finally with n-hexane. The glossy black microcrystalline solid was then dried under vacuum at C.
1.1.2 XRD
X-ray diffraction (XRD) measurements were performed on a Seifert TT 3003 diffractometer equipped with a secondary graphite monochromator, using Cu K radiation ( 1.5418 Å). Data were collected in the Bragg-Brentano geometry, in the range degrees and counting 4 s/step. The powder sample was protected from air humidity with a Mylar cap, to avoid its gradual decomposition at room temperature.
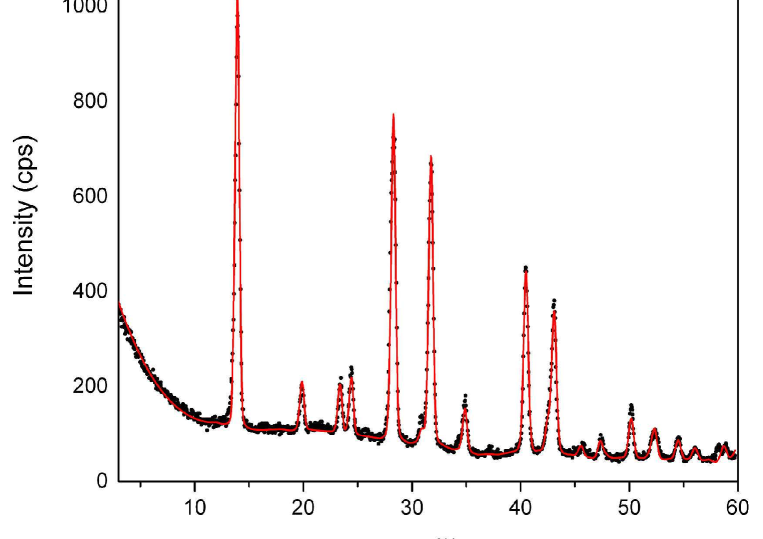
The XRD pattern of a MAPbI3 sample is shown in Fig. S6. All peaks were indexed according to the tetragonal phase. No degradation, with the formation of PbI2 and/or MAPbI3 hydrates, was observed. From the Rietveld refinement48 of data, the MAPbI3 lattice parameters 8.888(2) Å and 12.616(6) Å were obtained, in agreement with the data reported in the literature.49
1.1.3 Pressing
The powder was pressed at 9 tons in discs of 13 mm of diameter and at 10 tons at C in bars mm3. The powders and samples were uniformly black and were exposed to air only for the short times necessary to press them, apply electrodes with Ag paint, and mount them in the air-tight setups for anelastic and dielectric measurements.
1.2 Anelasticity and anelastic measurements
The term "anelastic" was introduced by Zener50 to indicate the time/frequency dependent strain response to an applied stress, in addition to the instantaneous elastic response. The frequency dependent mechanical susceptibility, the compliance , acquires an imaginary part describing the retarded response and the consequent mechanical losses. The anelastic response is due to some internal variable coupled to strain and having its own dynamics, usually expressed in terms of a relaxation time or a spectrum of times. Examples are: point or extended defects, that may change between at least two states with different local strain (elastic dipole); heat flow coupled with change of volume; polarons. The anelastic and dielectric responses may be described with the same formulas, using the correspondence stress electric field, strain electric polarization, electric dipole elastic dipole. The theory of anelastic and dielectric relaxation from point defects has been systematized by Nowick and Heller.31, 17. A major difference between the two phenomena is that the elastic and anelastic response is insensitive to free charges, making it an effective tool for probing defects and phase transitions also in metals and highly conducting materials.
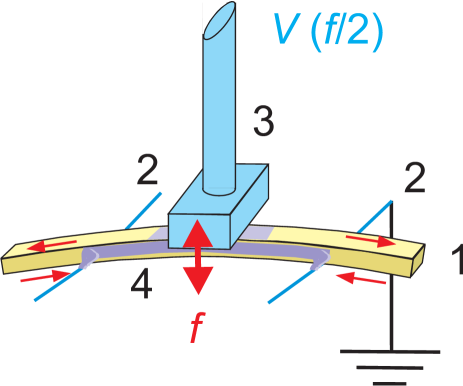
The complex Young’s modulus , or its reciprocal, the compliance , was measured by suspending the bar on thin thermocouple wires in high vacuum ( mbar or up to 0.2 mbar He) and electrostatically exciting their odd flexural modes. The variable temperature insert and the sample holder are described in detail in Ref. 51. Figure S7 schematically shows the sample on the wires and the electrode. The application of a sinusoidal voltage induces an opposite voltage on the top of the sample, which is made conductive with Ag paint and grounded through one of the two thermocouple wires. The resulting electrostatic attraction is . The fact that the sample vibrates at twice the excitation frequency allows the same electrode to be used for the excitation and the detection of the vibration through the modulation of the sample/electrode capacitance. Such a capacitance is part of an external high frequency ( MHz) oscillator, whose modulated frequency is demodulated and provides the vibration amplitude of the sample. The red arrows in Fig. S7 show that during flexure one side of the sample undergoes extension and the other compression, so that what is probed is the Young’s modulus. The resonance frequencies are ,17 where is the geometrical factor for the -th mode, and therefore the Young’s modulus normalized to a reference temperature can be plotted as . Up to three modes could be measured during a same run. The elastic energy loss was measured from the free decay or from the resonance curve under forced vibration.
1.3 Dielectric measurements
The complex dielectric permittivity, , with losses , was measured with a HP 4284A LCR meter with a four-wire probe and an electric field of 0.5 V/mm up to 1 MHz. Temperature was controlled with a modified Linkam HFS600E-PB4 stage filled with N2.
1.4 Additional dielectric curves
The dielectric relaxation we measure in the O phase, though with smaller intensity, is compatible with the high temperature tails of previous measurements extended to lower temperatures3, 37 (Fig. 9)). The differences in amplitude between these measurements may arise from the fact that the residual molecular motions probed at such low temperatures strongly depend on extrinsic factors, such as defects, and the precise domain wall configurations, and the latter depend also on the sample thermal history.
1.5 Glazer’s notation for the octahedral tilt patterns
The notation of Glazer52 describes the rotations of the octahedra in a cubic perovskite: stands for tilting of all the octahedra along an axis of the same angle ; for antiphase tilting, i.e. alternately and along the axis; for no rotation. The rotations about the and pseudocubic axes are written in sequence.
1.6 Permittivity with polarization-tilt coupling from Landau’s theory
The simplest free energy describing a tilt and a FE transition with coupling is (see e.g. Ref. 45)
| (10) | |||||
| (11) | |||||
| (12) |
where and the coefficients of the quadratic terms decrease linearly with temperature, so that above and the minimum of is for (symmetric phase), but below those temperatures double-well minima develop at finite values of and the spontaneous polarization and tilt angle in the FE and tilted phases. The coupling coefficient may be positive (competitive) or negative (cooperative), and coupling terms linear in either or are forbidden by symmetry in the high temperature symmetric phase, whose energy is invariant for changes of the sign of either order parameters. The term is the Legendre transformation from the Helmholtz free energy , whose differential is , to the Gibbs free energy, whose differential is ; in this manner the independent variable changes from to and we can calculate the susceptibility ( because the external field is null, except for the small alternate probe field to measure ).
The equilibrium values of the order parameters in the minima of are found from
| (13) | |||||
| (14) |
We need to calculate and also , which can be obtained in implicit form differentiating the two above equations:
| (15) | |||||
| (16) |
For it is , and
| (17) |
Therefore, the dielectric susceptibility is the Curie-Weiss law with Curie constant , unaffected by the coupling with tilting above the tilting transition, at least in the present approximation of neglecting fluctuations above the transition temperatures. Then, in the temperature range of interest, , we can ignore the second tilt transition at and identify with the mode condensed in the T phase, and set and . In the T phase we set in Eq. (15), with found from the equilibrium condition (14):
or
| (19) | |||||
The FE transition occurs at the temperature for which diverges, and therefore the denominator is null:
so that a cooperative (competitive) interaction with the tilt mode raises (lowers) with respect to .
1.6.1 Integration into the Lorentz–Lorenz formula
The above expression of the permittivity, Eq. (19), is obtained neglecting the electronic and atomic contributions to the polarizabilities and , namely setting , as usual in the context of FE with very large . In the present case, however, this approximation is not well satisfied, and it is better to insert the correction for polar-tilt coupling into the Lorentz–Lorenz formula,39, 40 which is the Clausius-Mosotti formula with the inclusion of all types of polarizabilities
which can be rewritten as
and, after some manipulation, as53
| (20) | |||||
Comparing Eq. (20) and (19) we set the Curie constant
and insert the correction for tilt-polar coupling, , into Eq. (20), finding finally
References
- Wasylishen \latinet al. 1985 Wasylishen, R. E.; Knop, O.; Macdonald, J. B. Cation rotation in methylammonium lead halides. Solid State Commun. 1985, 56, 581
- Poglitsch and Weber 1987 Poglitsch, A.; Weber, D. Dynamic disorder in methylammoniumtrihalogenoplumbates (II) observed by millimeter-wave spectroscopy. J. Chem. Phys. 1987, 87, 6373
- Onoda-Yamamuro \latinet al. 1992 Onoda-Yamamuro, N.; Matsuo, T.; Suga, H. Dielectric study of CH3NH3PbX3 (X = Cl, Br, I). J. Phys. Chem. Solids 1992, 53, 935
- Park 2013 Park, N. G. Organometal Perovskite Light Absorbers Toward a 20% Efficiency Low-Cost Solid-State Mesoscopic Solar Cell. J. Phys. Chem. Lett. 2013, 4, 2423
- Huang \latinet al. 2017 Huang, J.; Yuan, Y.; Shao, Y.; Yan, Y. Understanding the physical properties of hybrid perovskites for photovoltaic applications. Nat. Rev. Mater. 2017, 2, 17042
- Frost \latinet al. 2014 Frost, J. M.; Butler, K. T.; Brivio, F.; Hendon, C. H.; van Schilfgaarde, M.; Walsh, A. Atomistic Origins of High-Performance in Hybrid Halide Perovskite Solar Cells. Nano Lett. 2014, 14, 2584
- Liu \latinet al. 2015 Liu, S.; Zheng, F.; Koocher, N. Z.; Takenaka, H.; Wang, F.; Rappe, A. M. Ferroelectric Domain Wall Induced Band Gap Reduction and Charge Separation in Organometal Halide Perovskites. J. Phys. Chem. Lett. 2015, 6, 693
- Sewvandi \latinet al. 2016 Sewvandi, G. A.; Kodera, K.; Ma, H.; Nakanishi, S.; Feng, Q. Antiferroelectric Nature of CH3NH3PbI3-xClx Perovskite and Its Implication for Charge Separation in Perovskite Solar Cells. Sci. Rep. 2016, 6, 30680
- Kutes \latinet al. 2014 Kutes, Y.; Ye, L.; Zhou, Y.; Pang, S.; Huey, B. D.; Padture, N. P. Direct Observation of Ferroelectric Domains in Solution-Processed CH3NH3PbI3 Perovskite Thin Films. J. Phys. Chem. Lett. 2014, 5, 3335
- Stoumpos \latinet al. 2013 Stoumpos, C. C.; Malliakas, C. D.; Kanatzidis, M. G. Semiconducting Tin and Lead Iodide Perovskites with Organic Cations: Phase Transitions, High Mobilities, and Near-Infrared Photoluminescent Properties. Inorg. Chem. 2013, 52, 9019
- Rakita \latinet al. 2017 Rakita, Y.; Bar-Elli, O.; Meirzadeh, E.; Kaslasi, H.; Peleg, Y.; Hodes, G.; Lubomirsky, I.; Oron, D.; Ehre, D.; Cahen, D. Tetragonal CH3NH3PbI3 is ferroelectric. PNAS 2017, 114, E5504
- You \latinet al. 2017 You, Y. M.; Liao, W. Q.; Zhao, D.; Ye, H. Y.; Zhang, Y.; Zhou, Q.; Niu, X.; Wang, J.; Li, P. F.; Fu, D. W. \latinet al. An organic-inorganic perovskite ferroelectric with large piezoelectric response. Science 2017, 357, 306
- Beilsten-Edmands \latinet al. 2015 Beilsten-Edmands, J.; Eperon, G. E.; Johnson, R. D.; Snaith, H. J.; Radaelli, P. G. Non-ferroelectric nature of the conductance hysteresis in CH3NH3PbI3 perovskite-based photovoltaic devices. Appl. Phys. Lett. 2015, 106, 173502
- Fan \latinet al. 2015 Fan, Z.; Xiao, J.; Sun, K.; Chen, L.; Hu, Y.; Ouyang, J.; Ong, K. P.; Zeng, K.; Wang, J. Ferroelectricity of CH3NH3PbI3 Perovskite. J. Phys. Chem. Lett. 2015, 6, 1155
- Simenas \latinet al. 2017 Simenas, M.; Balciunas, S.; Maczka, M.; Banys, J.; Tornau, E. E. Exploring the Antipolar Nature of Methylammonium Lead Halides: A Monte Carlo and Pyrocurrent Study. J. Phys. Chem. Lett. 2017, 8, 4906
- Filippetti \latinet al. 2015 Filippetti, A.; Delugas, P.; Saba, M. I.; Mattoni, A. Entropy-Suppressed Ferroelectricity in Hybrid Lead-Iodide Perovskites. J. Phys. Chem. Lett. 2015, 6, 4909
- Nowick and Berry 1972 Nowick, A. S.; Berry, B. S. Anelastic Relaxation in Crystalline Solids; Academic Press: New York, 1972
- Whitfield \latinet al. 2016 Whitfield, P. S.; Herro, N.; Guise, W. E.; Page, K.; Cheng, Y. Q.; Milas, I.; Crawford, M. K. Structures, Phase Transitions and Tricritical Behavior of the Hybrid Perovskite Methyl Ammonium Lead Iodide. Sci. Rep. 2016, 6, 35685
- Rehwald 1973 Rehwald, W. The study of structural phase transitions by means of ultrasonic experiments. Adv. Phys. 1973, 22, 721
- Cordero \latinet al. 2014 Cordero, F.; Craciun, F.; Trequattrini, F.; Galassi, C. Effects of coupling between octahedral tilting and polar modes on the phase diagram of the ferroelectric perovskites PbZr1-xTixO3 and (Na1/2Bi1/2)1-xBaxTiO3. Phase Transit. 2014, 87, 255
- Pan \latinet al. 2017 Pan, Q.; Liu, Z. B.; Tang, Y. Y.; Li, P. F.; Ma, R. W.; Wei, R. Y.; Zhang, Y.; You, Y. M.; Ye, H. Y.; Xiong, R. G. A Three-Dimensional Molecular Perovskite Ferroelectric: (3-Ammoniopyrrolidinium)RbBr3. J. Am. Chem. Soc. 2017, 139, 3954
- Govinda \latinet al. 2017 Govinda, S.; Kore, B. P.; Bokdam, M.; Mahale, P.; Kumar, A.; Pal, S.; Bhattacharyya, B.; Lahnsteiner, J.; Kresse, G.; Franchini, C. \latinet al. Behavior of Methylammonium Dipoles in MAPbX3 (X = Br and I). J. Phys. Chem. Lett. 2017, 8, 4113
- Anusca \latinet al. 2017 Anusca, I.; Balciunas, S.; Gemeiner, P.; Svirskas, S.; Sanlialp, M.; Lackner, G.; Fettkenhauer, C.; Belovickis, J.; Samulionis, V.; Ivanov, M. \latinet al. Dielectric Response: Answer to Many Questions in the Methylammonium Lead Halide Solar Cell Absorbers. Adv. Energy Mater. 2017, 7, 1700600
- McKnight \latinet al. 2009 McKnight, R. A.; Howard, C. J.; Carpenter, M. A. Elastic anomalies associated with transformation sequences in perovskites: I. Strontium zirconate, SrZrO3. J. Phys.: Condens. Matter 2009, 21, 015901
- Zhang \latinet al. 2010 Zhang, Z.; Koppensteiner, J.; Schranz, W.; Betts, J. B.; Migliori, A.; Carpenter, M. A. Microstructure dynamics in orthorhombic perovskites. Phys. Rev. B 2010, 82, 014113
- Cordero \latinet al. 2016 Cordero, F.; Craciun, F.; Trequattrini, F.; Galizia, P.; Galassi, C. Elastic aging from coexistence and transformations of ferroelectric and antiferroelectric states in PZT. J. Appl. Phys. 2016, 120, 064104
- Lee \latinet al. 2016 Lee, J. H.; Bristowe, N. C.; Lee, J. H.; Lee, S. H.; Bristowe, P. D.; Cheetham, A. K.; Jang, H. M. Resolving the Physical Origin of Octahedral Tilting in Halide Perovskites. Chem. Mater. 2016, 28, 4259
- Chen \latinet al. 2015 Chen, T.; Foley, B. J.; Ipek, B.; cd M. Tyagi,; Copley, J. D.; Brown, C. M.; Choi, J. J.; Lee, S. H. Rotational dynamics of organic cations in the CH3NH3PbI3 perovskite. Phys. Chem. Chem. Phys. 2015, 17, 31278
- Bernard \latinet al. 2018 Bernard, G. M.; Wasylishen, R. E.; ffand V. Terskikh, C. I. R.; Wu, Q.; Buriak, J. M.; Hauger, T. Methylammonium Cation Dynamics in Methylammonium Lead Halide Perovskites: A Solid-State NMR Perspective. J. Phys. Chem. A 2018, 122, 1560
- Bakulin \latinet al. 2015 Bakulin, A. A.; Selig, O.; Bakker, H. J.; Rezus, Y. A.; Muller, C.; Glaser, T.; Lovrincic, R.; Sun, Z.; Chen, Z.; Walsh, A. \latinet al. Real-Time Observation of Organic Cation Reorientation in Methylammonium Lead Iodide Perovskites. J. Phys. Chem. Lett. 2015, 6, 3663
- Nowick and Heller 1965 Nowick, A. S.; Heller, W. R. Dielectric and anelastic relaxation of crystals containing point defects. Adv. Phys. 1965, 14, 101–166
- Fang 1958 Fang, P. H. A dispersion function of paramagnetic relaxation. Physica 1958, 24, 970
- Cordero 1993 Cordero, F. Anelastic (dielectric) relaxation of point defects at any concentration, with blocking effects and formation of complexes. Phys. Rev. B 1993, 47, 7674–7685
- Thomson \latinet al. 2012 Thomson, R. I.; Jain, P.; Cheetham, A. K.; Carpenter, M. A. Elastic relaxation behavior, magnetoelastic coupling, and order-disorder processes in multiferroic metal-organic frameworks. Phys. Rev. B 2012, 86, 214304
- Swainson \latinet al. 2003 Swainson, I. P.; Hammond, R. P.; Soullière, C.; Knop, O.; Massa, W. Phase transitions in the perovskite methylammonium lead bromide, CH3ND3PbBr3. J. Sol. St. Chem. 2003, 176, 97
- Harwell \latinet al. 2018 Harwell, J. R.; Payne, J. L.; Sajjad, M. T.; Heutz, F. L.; Dawson, D. M.; Whitfield, P. S.; Irvine, J. S.; Samuel, I. W.; Carpenter, M. A. Role of lattice distortion and A site cation in the phase transitions of methylammonium lead halide perovskites. Phys. Rev. Materials 2018, 2, 065404
- Fabini \latinet al. 2016 Fabini, D. H.; Hogan, T.; Evans, H. A.; Stoumpos, C. C.; Kanatzidis, M. G.; Seshadri, R. Dielectric and Thermodynamic Signatures of Low-Temperature Glassy Dynamics in the Hybrid Perovskites CH3NH3PbI3 and HC(NH2)2PbI3. J. Phys. Chem. Lett. 2016, 7, 376
- Gesi 1997 Gesi, K. Effect of hydrostatic pressure on the structural phase transitions in CH3NH3PbX3 (X = Cl, Br, I). Ferroelectrics 1997, 203, 249
- von Hippel 1954 von Hippel, A. R. Dielectrics and waves; M.I.T. Press: Cambridge, Massachusetts, 1954
- Raju 2003 Raju, G. G. Dielectrics in Electric Fields; Marcel Dekker, 2003
- Onsager 1936 Onsager, L. Electric Moments of Molecules in Liquids. J. Am. Chem. Soc. 1936, 58, 1486
- Chen \latinet al. 2016 Chen, Y. F.; Tsai, Y. T.; Bassani, D. M.; Hirsch, L. Experimental evidence of the anti-parallel arrangement of methylammonium ions in perovskites. Appl. Phys. Lett. 2016, 109, 213504
- Beecher \latinet al. 2016 Beecher, A. N.; Semonin, O. E.; Skelton, J. M.; Frost, J. M.; Terban, M. W.; Zhai, H.; Alatas, A.; Owen, J. S.; Walsh, A.; Billinge, S. J. L. Direct Observation of Dynamic Symmetry Breaking above Room Temperature in Methylammonium Lead Iodide Perovskite. ACS Energy Lett. 2016, 1, 880
- Bernasconi and Malavasi 2017 Bernasconi, A.; Malavasi, L. Direct Evidence of Permanent Octahedra Distortion in MAPbBr3 Hybrid Perovskite. ACS Energy Lett. 2017, 2, 863
- Balashova and Tagantsev 1993 Balashova, E. V.; Tagantsev, A. K. Polarization response of crystals with structural and ferroelectric instabilities. Phys. Rev. B 1993, 48, 9979
- Stamplecoskie \latinet al. 2015 Stamplecoskie, K. G.; Manser, J. S.; Kamat, V. P. Dual nature of the excited state in organic-inorganic lead halide perovskites. Energy Environ. Sci. 2015, 8, 208
- Jia \latinet al. 2017 Jia, X.; Hu., Z.; Zhu, Y.; Weng, T.; Wang, J.; Zhang, J.; Zhu, Y. Facile synthesis of organic-inorganic hybrid perovskite CH3NH3PbI3 microcrystals. J. Alloys Compd. 2017, 725, 270.
- Young 1993 Young, R. A., Ed. The Rietveld Method. International Union of Crystallography; Oxford University Press: Oxford, 1993
- Baikie \latinet al. 2013 Baikie, T.; Fang, Y.; Kadro, J. M.; Schreyer, M.; Wei, F.; Mhaisalkar, S. G.; Graetzel, M.; White, T. J. Synthesis and crystal chemistry of the hybrid perovskite (CH3NH3)PbI3 for solid-state sensitised solar cell applications. J. Mater. Chem. A 2013, 1, 5628
- Zener 1948 Zener, C. Elasticity and Anelasticity of Metals; University of Chicago Press: Chicago, 1948
- Cordero \latinet al. 2009 Cordero, F.; Di Bella, L.; Corvasce, F.; Latino, P. M.; Morbidini, A. An insert for anelastic spectroscopy measurements from 80 K to 1100 K. Meas. Sci. Technol. 2009, 20, 015702
- Glazer 1972 Glazer, A. M. The classification of tilted octahedra in perovskites. Acta Cryst. B 1972, 28, 3384
- Fiory 1971 Fiory, A. T. Electric Dipole Interactions Among Polar Defects in Alkali Halides. Phys. Rev. B 1971, 4, 614