Maksim Panchenko and Rafael Auler and Bill Nell and Guilherme Ottoni
Facebook, Inc.
Menlo Park, CA, USA
{maks,rafaelauler,bnell,ottoni}@fb.com
BOLT: A Practical Binary Optimizer for Data Centers and Beyond
Abstract
Performance optimization for large-scale applications has recently become more important as computation continues to move towards data centers. Data-center applications are generally very large and complex, which makes code layout an important optimization to improve their performance. This has motivated recent investigation of practical techniques to improve code layout at both compile time and link time. Although post-link optimizers had some success in the past, no recent work has explored their benefits in the context of modern data-center applications.
In this paper, we present BOLT, a post-link optimizer built on top of the LLVM framework. Utilizing sample-based profiling, BOLT boosts the performance of real-world applications even for highly optimized binaries built with both feedback-driven optimizations (FDO) and link-time optimizations (LTO). We demonstrate that post-link performance improvements are complementary to conventional compiler optimizations, even when the latter are done at a whole-program level and in the presence of profile information. We evaluated BOLT on both Facebook data-center workloads and open-source compilers. For data-center applications, BOLT achieves up to 8.0% performance speedups on top of profile-guided function reordering and LTO. For the GCC and Clang compilers, our evaluation shows that BOLT speeds up their binaries by up to 20.4% on top of FDO and LTO, and up to 52.1% if the binaries are built without FDO and LTO.
1 Introduction
Given the large scale of data centers, optimizing their workloads has recently gained a lot of interest. Modern data-center applications tend to be very large and complex programs. Due to their sheer amount of code, optimizing the code locality for these applications is very important to improve their performance.
The large size and performance bottlenecks of data-center applications make them good targets for feedback-driven optimizations (FDO), also called profile-guided optimizations (PGO), particularly code layout. At the same time, the large sizes of these applications also impose scalability challenges to apply FDO to them. Instrumentation-based profilers incur significant memory and computational performance costs, often making it impractical to gather accurate profiles from a production system. To simplify deployment and increase adoption, it is desirable to have a system that can obtain profile data for FDO from unmodified binaries running in their normal production environments. This is possible through the use of sample-based profiling, which enables high-quality profiles to be gathered with minimal operational complexity. This is the approach taken by tools such as Ispike Luk et al. [2004], AutoFDO Chen et al. [2016], and HFSort Ottoni and Maher [2017]. This same principle is used as the basis of the BOLT tool presented in this paper.
Profile data obtained via sampling can be retrofitted to multiple points in the compilation chain. The point into which the profile data is used can vary from compilation time (e.g. AutoFDO Chen et al. [2016]), to link time (e.g. LIPO Li et al. [2010] and HFSort Ottoni and Maher [2017]), to post-link time (e.g. Ispike Luk et al. [2004]). In general, the earlier in the compilation chain the profile information is inserted, the larger is the potential for its impact, because more phases and optimizations can benefit from this information. This benefit has motivated recent work on compile-time and link-time FDO techniques. At the same time, post-link optimizations, which in the past were explored by a series of proprietary tools such as Spike Cohn et al. [1997], Etch Romer et al. [1997], FDPR Henis et al. [1999a], and Ispike Luk et al. [2004], have not attracted much attention in recent years. We believe that the lack of interest in post-link optimizations is due to folklore and the intuition that this approach is inferior because the profile data is injected very late in the compilation chain.
In this paper, we demonstrate that the intuition described above is incorrect. The important insight that we leverage in this work is that, although injecting profile data earlier in the compilation chain enables its use by more optimizations, injecting this data later enables more accurate use of the information for better code layout. In fact, one of the main challenges with AutoFDO is to map the profile data, collected at the binary level, back to the compiler’s intermediate representations Chen et al. [2016]. In the original compilation used to produce the binary where the profile data is collected, many optimizations are applied to the code by the compiler and linker before the machine code is emitted. In a post-link optimizer, which operates at the binary level, this problem is much simpler, resulting in more accurate use of the profile data. This accuracy is particularly important for low-level optimizations such as code layout.
We demonstrate the finding above in the context of a static binary optimizer we built, called BOLT. BOLT is a modern, retargetable binary optimizer built on top of the LLVM compiler infrastructure Lattner and Adve [2004]. Our experimental evaluation on large real-world applications shows that BOLT can improve performance by up to 20.41% on top of FDO and LTO. Furthermore, our analysis demonstrates that this improvement is mostly due to the improved code layout that is enabled by the more accurate usage of sample-based profile data at the binary level.
Overall, this paper makes the following contributions:
-
1.
It describes the design of a modern, open-source post-link optimizer built on top of the LLVM infrastructure.111BOLT is available at https://github.com/facebookincubator/BOLT.
-
2.
It demonstrates empirically that a post-link optimizer is able to better utilize sample-based profiling data to improve code layout compared to a compiler-based approach.
-
3.
It shows that neither compile-time, link-time, nor post-link-time FDO supersedes the others but, instead, they are complementary.
This paper is organized as follows. Section 2 motivates the case for using sample-based profiling and static binary optimization to improve performance of large-scale applications. Section 3 then describes the architecture of the BOLT binary optimizer, followed by a description of the optimizations that BOLT implements in Section 4 and a discussion about profiling techniques in Section 5. An evaluation of BOLT and a comparison with other techniques is presented in Section 6. Finally, Section 7 discusses related work and Section 8 concludes the paper.
2 Motivation
In this section, we motivate the post-link optimization approach used by BOLT.
2.1 Why sample-based profiling?
Feedback-driven optimizations (FDO) have been proved to help increase the impact of code optimizations in a variety of systems (e.g. Chen et al. [2016]; Dehnert et al. [2003]; Hölzle and Ungar [1994]; Li et al. [2010]; Ottoni [2018]). Early developments in this area relied on instrumentation-based profiling, which requires a special instrumented build of the application to collect profile data. This approach has two drawbacks. First, it complicates the build process, since it requires a special build for profile collection. Second, instrumentation typically incurs very significant CPU and memory overheads. These overheads generally render instrumented binaries inappropriate for running in real production environments.
In order to increase the adoption of FDO in production environments, recent work has investigated FDO-style techniques based on sample-based profiling Chen et al. [2013]; Chen et al. [2016]; Ottoni and Maher [2017]. Instead of instrumentation, these techniques rely on much cheaper sampling using hardware profile counters available in modern CPUs, such as Intel’s Last Branch Records (LBR) Intel Corporation [2011]. This approach is more attractive not only because it does not require a special build of the application, but also because the profile-collection overheads are negligible. By addressing the two main drawbacks of instrumentation-based FDO techniques, sample-based profiling has increased the adoption of FDO-style techniques in complex, real-world production systems Chen et al. [2016]; Ottoni and Maher [2017]. For these same practical reasons, we opted to use sample-based profiling in this work.
2.2 Why a binary optimizer?
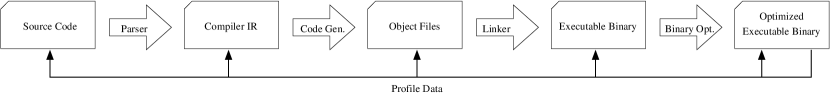
Sample-based profile data can be leveraged at various levels in the compilation pipeline. Figure 1 shows a generic compilation pipeline to convert source code into machine code. As illustrated in Figure 1, the profile data may be injected at different program-representation levels, ranging from source code, to the compiler’s intermediate representations (IR), to the linker, to post-link optimizers. In general, the designers of any FDO tool are faced with the following trade-off. On the one hand, injecting profile data earlier in the pipeline allows more optimizations along the pipeline to benefit from this data. On the other hand, since sample-based profile data must be collected at the binary level, the closer a level is to this representation, the higher the accuracy with which the data can be mapped back to this level’s program representation. Therefore, a post-link binary optimizer allows the profile data to be used with the greatest level of accuracy.
AutoFDO Chen et al. [2016] retrofits profile data back into a compiler’s intermediate representation (IR). Chen et al. Chen et al. [2013] quantified the precision of the profile data that is lost by retrofitting profile data even at a reasonably low-level representation in the GCC compiler. They quantified that the profile data had 84.1% accuracy, which they were able to improve to 92.9% with some techniques described in that work.
The example in Figure 2 illustrates the difficulty in mapping binary-level performance events back to a higher-level representation. In this example, both functions bar and baz call function foo, which gets inlined in both callers. Function foo contains a conditional branch for the if statement on line (02). For forward branches like this, on modern processors, it is advantageous to make the most common successor be the fall-through, which can lead to better branch prediction and instruction-cache locality. This means that, when foo is inlined into bar, block B1 should be placed before B2, but the blocks should be placed in the opposite order when inlined into baz. When this program is profiled at the binary level, two branches corresponding to the if in line (02) will be profiled, one within bar and one within baz. Assume that functions bar and baz execute the same number of times at runtime. Then, when mapping the branch frequencies back to the source code in Figure 2, one will conclude that the branch at line (02) has a 50% chance of branching to both B1 and B2. And, after foo is inlined in both bar and baz, the compiler will not be able to tell what layout is best in each case. Notice that, although this problem can be mitigated by injecting the profile data into a lower-level representation after function inlining has been performed, this does not solve the problem in case foo is declared in a different module than bar and baz because in this case inlining cannot happen until link time.
     (01)     function foo(int x) {
     (02)       if (x > 0) {
     (03)         ... // B1
     (04)       } else {
     (05)         ... // B2
     (06)       }
     (07)     }

     (08)     function bar() {
     (09)       foo(... /* > 0 */); // gets inlined
     (10)     }

     (11)     function baz() {
     (12)       foo(... /* < 0 */); // gets inlined
     (13)     }
Since our initial motivation for BOLT was to improve large-scale data-center applications, where code layout plays a major role, a post-link binary optimizer was very appealing. Traditional code-layout techniques are highly dependent on accurate branch frequencies Pettis and Hansen [1990], and using inaccurate profile data can actually lead to performance degradation Chen et al. [2013]. Nevertheless, as we mentioned earlier, feeding profile information at a very low level prevents earlier optimizations in the compilation pipeline from leveraging this information. Therefore, with this approach, any optimization that we want to benefit from the profile data needs to be applied at the binary level. Fortunately, code layout algorithms are relatively simple and easy to apply at the binary level.
2.3 Why a static binary optimizer?
The benefits of a binary-level optimizer outlined above can be exploited either statically or dynamically. We opted for a static approach for two reasons. The first one is the simplicity of the approach. The second was the absence of runtime overheads. Even though dynamic binary optimizers have had some success in the past (e.g. Dynamo Bala et al. [2000], DynamoRIO Bruening et al. [2003], StarDBT Wang et al. [2007]), these systems incur non-trivial overheads that go against the main goal of improving the overall performance of the target application. In other words, these systems need to perform really well in order to recover their overheads and achieve a net performance win. Unfortunately, since they need to keep their overheads low, these systems often have to implement faster, sub-optimal code optimization passes. This has been a general challenge to the adoption of dynamic binary optimizers, as they are not suited for all applications and can easily degrade performance if not tuned well. The main benefit of a dynamic binary optimizer over a static one is the ability to handle dynamically generated and self-modifying code.
3 Architecture
Large-scale data-center binaries may contain over 100 MB of code from multiple source-code languages, including assembly language. In this section, we discuss the design of the BOLT binary optimizer that we created to operate in this scenario.
3.1 Initial Design
We developed BOLT by incrementally increasing its binary code coverage. At first, BOLT was only able to optimize the code layout of a limited set of functions. With time, code coverage gradually increased by adding support for more complex functions. Even today, BOLT is still able to leave some functions in the binary untouched while processing and optimizing others, conservatively skipping code that violates its current assumptions.
The initial implementation targeted x86_64 Linux ELF binaries and relied exclusively on ELF symbol tables to guide binary content identification. By doing that, BOLT was able to optimize code layout within existing function boundaries. When BOLT was not able to reconstruct the control-flow graph of a given function with full confidence, it would just leave the function untouched.
Due to the nature of code layout optimizations, the effective code size may increase for a couple of reasons. First, this may happen due to an increase in the number of branches on cold paths. Second, there is a peculiarity of x86’s conditional branch instruction, which occupies 2 bytes if a (signed) offset to a destination fits in 8 bits but otherwise takes 6 bytes for 32-bit offsets. Naturally, moving cold code further away showed a tendency to increase the hot code size. If an optimized function would not fit into the original function’s allocated space, BOLT would split the cold code and move it to a newly created ELF segment. Note that such function splitting was involuntary and did not provide any extra benefit beyond allowing code straightening optimizations as BOLT was not filling out the freed space between the split point and the next function.
3.2 Relocations Mode
A second and more ambitious mode was later added to operate by changing
the position of all functions in the binary.
While multiple approaches were considered, the most obvious and
straightforward one was to rely on relocations recorded and saved by the
linker in an executable. Both BFD and Gold linkers provide such an option
(--emit-relocs). However, even with this option, there are still
some missing pieces of information.
An example is the relative offsets for PIC jump tables which are removed
by the linker. Other examples are some relocations that are not
visible even to the linker, such as cross-function references for local
functions within a single compilation unit (they are processed internally
by the compiler). Therefore, in order to detect and fix such references,
it is important to disassemble all the code correctly before trying to
rearrange the functions in the binary. Nevertheless, with relocations, the
job of gaining complete control over code re-writing became much
easier. Handling relocations gives BOLT the ability to change the order
of functions in the binary and split function bodies to further improve
code locality.
Since linkers have access to relocations, it would be possible to use them for similar binary optimizations. However, there are multiple open-source linkers for x86 Linux alone, and which one is being used for any particular application depends on a number of circumstances that may also change over time. Therefore, in order to facilitate the tool’s adoption, we opted for writing an independent post-link optimizer instead of being tied to a specific linker.
3.3 Rewriting Pipeline
Analyzing an arbitrary binary and locating code and data is not trivial. In fact, the problem of precisely disassembling machine code is undecidable in the general case. In practice, there is more information than just an entry point available, and BOLT relies on correct ELF symbol table information for code discovery. Since BOLT works with 64-bit Linux binaries, the ABI requires an inclusion of function frame information that contains function boundaries as well. While BOLT could have relied on this information, it is often the case that functions written in assembly omit frame information. Thus, we decided to employ a hybrid approach using both symbol table and frame information when available.
Figure 3 shows a diagram with BOLT’s rewriting steps. Function discovery is the very first step, where function names are bound to addresses. Later, debug information and profile data are retrieved so that disassembly of individual functions can start.
BOLT uses the LLVM compiler infrastructure Lattner and Adve [2004] to handle disassembly and modification of binary files. There are a couple of reasons LLVM is well suited for BOLT. First, LLVM has a nice modular design that enables relatively easy development of tools based on its infrastructure. Second, LLVM supports multiple target architectures, which allows for easily retargetable tools. To illustrate this point, a working prototype for the ARM architecture was implemented in less than a month. In addition to the assembler and disassembler, many other components of LLVM proved to be useful while building BOLT. Overall, this decision to use LLVM has worked out well. The LLVM infrastructure has enabled a quick implementation of a robust and easily retargetable binary optimizer.
As Figure 3 shows, the next step in the rewriting
pipeline is to build the control-flow graph (CFG) representation for each
of the function. The CFG is constructed using the MCInst objects
provided by LLVM’s Tablegen-generated disassembler. BOLT reconstructs the
control-flow information by analyzing any branch instructions encountered
during disassembly. Then, in the CFG representation, BOLT runs its optimization
pipeline, which is explained in detail in Section 4. For BOLT,
we have added a generic annotation mechanism to MCInst in order to
facilitate certain optimizations, e.g. as a way of recording dataflow
information. The final steps involve emitting functions and using LLVM’s
run-time dynamic linker (created for the LLVM JIT systems) to resolve
references among functions and local symbols (such as basic blocks). Finally,
the binary is rewritten with the new contents while also updating ELF
structures to reflect the new sizes.
3.4 C++ Exceptions and Debug Information
BOLT is able to recognize DWARF DWARF Debugging Standards Committee [2017] information and update it to reflect the code modifications and relocations performed during the rewriting pass.
Figure 4 shows an example of a CFG dump demonstrating
BOLT’s internal representation of the binary for the first two basic
blocks of a function with C++ exceptions and a throw statement.
The function is quite small with only five basic blocks in total, and
each basic block is free
to be relocated to another position, except the entry point.
Placeholders for DWARF Call Frame Information (CFI) instructions are used
to annotate positions where the frame state changes (for example, when the stack
pointer advances). BOLT rebuilds all CFI for the new binary
based on these annotations so the frame unwinder works properly when
an exception is thrown.
The callq instruction at offset 0x00000010
can throw an exception and has a designated landing pad as indicated by
a landing-pad annotation displayed next to it (handler: .LLP0; action: 1).
The last annotation on the line indicates a source line origin for every
machine-level instruction.
Binary Function "_Z11filter_onlyi" after building cfg {
  State       : CFG constructed
  Address     : 0x400ab1
  Size        : 0x2f
  Section     : .text
  LSDA        : 0x401054
  IsSimple    : 1
  IsSplit     : 0
  BB Count    : 5
  CFI Instrs  : 4
  BB Layout   : .LBB07, .LLP0, .LFT8, .Ltmp10, .Ltmp9
  Exec Count  : 104
  Profile Acc : 100.0%
}
.LBB07 (11 instructions, align : 1)
  Entry Point
  Exec Count : 104
  CFI State : 0
    00000000:   pushq   %rbp # exception4.cpp:22
    00000001:   !CFI    $0      ; OpDefCfaOffset -16
    00000001:   !CFI    $1      ; OpOffset Reg6 -16
    00000001:   movq    %rsp, %rbp # exception4.cpp:22
    00000004:   !CFI    $2      ; OpDefCfaRegister Reg6
    00000004:   subq    $0x10, %rsp # exception4.cpp:22
    00000008:   movl    %edi, -0x4(%rbp) # exception4.cpp:22
    0000000b:   movl    -0x4(%rbp), %eax # exception4.cpp:23
    0000000e:   movl    %eax, %edi # exception4.cpp:23
    00000010:   callq   _Z3fooi # handler: .LLP0; action: 1
                                # exception4.cpp:23
    00000015:   jmp     .Ltmp9 # exception4.cpp:24
  Successors: .Ltmp9 (mispreds: 0, count: 100)
  Landing Pads: .LLP0 (count: 4)
  CFI State: 3
.LLP0 (2 instructions, align : 1)
  Landing Pad
  Exec Count : 4
  CFI State : 3
  Throwers: .LBB07
    00000017:   cmpq    $-0x1, %rdx # exception4.cpp:24
    0000001b:   je      .Ltmp10 # exception4.cpp:24
  Successors: .Ltmp10 (mispreds: 0, count: 4),
              .LFT8 (inferred count: 0)
  CFI State: 3
....
4 Optimizations
| Pass Name | Description |
|---|---|
| 1. strip-rep-ret |
Strip repz from repz retq instructions used for legacy AMD processors
|
| 2. icf | Identical code folding |
| 3. icp | Indirect call promotion |
| 4. peepholes | Simple peephole optimizations |
| 5. inline-small | Inline small functions |
| 6. simplify-ro-loads | Fetch constant data in .rodata whose address is known statically and mutate a load into a mov |
| 7. icf | Identical code folding (second run) |
| 8. plt | Remove indirection from PLT calls |
| 9. reorder-bbs | Reorder basic blocks and split hot/cold blocks into separate sections (layout optimization) |
| 10. peepholes | Simple peephole optimizations (second run) |
| 11. uce | Eliminate unreachable basic blocks |
| 12. fixup-branches | Fix basic block terminator instructions to match the CFG and the current layout (redone by reorder-bbs) |
| 13. reorder-functions | Apply HFSort Ottoni and Maher [2017] to reorder functions (layout optimization) |
| 14. sctc | Simplify conditional tail calls |
| 15. frame-opts | Removes unnecessary caller-saved register spilling |
| 16. shrink-wrapping | Moves callee-saved register spills closer to where they are needed, if profiling data shows it is better to do so |
BOLT runs passes with either code transformations or analyses, similar to a compiler. BOLT is also equipped with a dataflow-analysis framework to feed information to passes that need it. This enables BOLT to check register liveness at a given program point, a technique also used by Ispike Luk et al. [2004]. Some passes are architecture-independent while others are not. In this section, we discuss the passes applied to the Intel x86_64 target.
Table 1 shows each individual BOLT optimization pass in the
order they are applied. For example, the first line presents strip-rep-ret
at the start of the pipeline. Notice that passes 1 and 4 are focused on leveraging
precise target architecture information to remove or mutate some instructions.
A use case of BOLT for data-center applications is to allow the user to
trade any optional choices in the instruction space in favor of I-cache
space, such as removing alignment NOPs and AMD-friendly REPZ bytes, or using shorter
versions of instructions. Our findings
show that, for large applications, it is better
to aggressively reduce I-cache occupation, except if the change incurs
D-cache overhead, since cache is one of the most constrained resources in the data-center space.
This explains BOLT’s policy of discarding all NOPs after reading the input binary.
Even though compiler-generated alignment NOPs are generally useful,
the extra space required by them does not pay off and simply stripping them from the binary
provides a small but measurable performance improvement.
BOLT features identical code folding (ICF) to complement the ICF
optimization done by the linker. An additional benefit of doing ICF at the binary
level is the ability to optimize functions that were compiled without the
-ffunction-sections flag and functions that contain jump tables.
As a result, BOLT is able to fold more identical functions than the linkers.
We have measured the reduction of code size for the HHVM binary Adams et al. [2014] to be about 3%
on top of the linker’s ICF pass.
Passes 3 (indirect call promotion), 5 (inline small functions), and 7 (PLT call optimization) leverage call frequency information to either eliminate or mutate a function call into a more performant version. We note that BOLT’s function inlining is a limited version of what compilers perform at higher levels. We expect that most of the inlining opportunities will be leveraged by the compiler (potentially using FDO). The remaining inlining opportunities for BOLT are typically exposed by more accurate profile data, BOLT’s indirect-call promotion (ICP) optimization, cross-module nature, or a combination of these factors.
Pass 6, simplification of load instructions, explores a tricky tradeoff by fetching data from statically known values (in read-only sections). In these cases, BOLT may convert loads into immediate-loading instructions, relieving pressure from the D-cache but possibly increasing pressure on the I-cache, since the data is now encoded in the instruction stream. BOLT’s policy in this case is to abort the promotion if the new instruction encoding is larger than the original load instruction, even if it means avoiding an arguably more computationally expensive load instruction. However, we found that such opportunities are not very frequent in our workloads.
Pass 9, reorder and split hot/cold basic blocks, reorders basic blocks according to the most frequently executed paths, so the hottest successor will most likely be a fall-though, reducing taken branches and relieving pressure from the branch predictor unit.
Finally, pass 13 reorders the functions via the HFSort technique Ottoni and Maher [2017]. This optimization mainly improves I-TLB performance, but it also helps with I-cache to a smaller extent. Combined with pass 9, these are the most effective ones in BOLT because they directly optimize the code layout.
5 Profiling Techniques
This section discusses pitfalls and caveats of different sample-based profiling techniques when trying to produce accurate profiling data.
5.1 Techniques
In recent Intel microprocessors, LBR is a list of the last 32 taken branches. LBRs are important for profile-guided optimizations not only because they provide accurate counts for critical edges (which cannot be inferred even with perfect basic block count profiling Levin [2007]), but also because they make block-layout algorithms more resilient to bad sampling. When evaluating several different sampling events to collect LBRs for BOLT, we found that the performance impact in LBR mode is very consistent even for different sampling events. We have experimented with collecting LBR data with multiple hardware events on Intel x86, including retired instructions, taken branches, and cycles, and also experimented with different levels of Precise Event Based Sampling (PEBS) Intel Corporation [2011]. In all these cases, for a workload for which BOLT provided a 5.4% speedup, the performance differences were within 1%. In non-LBR mode, using biased events with a non-ideal algorithm to infer edge counts can cause as much as 5% performance penalty when compared to LBR, meaning it misses nearly all optimization opportunities. An investigation showed that non-LBR techniques can be tuned to stay under 1% worse than LBR in this example workload, but if LBR is available in the processor, one is better off using it to obtain higher and more robust performance numbers. We also evaluate this effect for HHVM in Section 6.5.
5.2 Consequences for Block Layout
Using LBRs, in a hypothetical worst-case biasing scenario where all samples in a function are recorded in the same basic block, BOLT will lay out blocks in the order of the path that leads to this block. It is an incomplete layout that misses the ordering of successor blocks, but it is not an invalid nor a cold path. In contrast, when trying to infer the same edge counts with non-LBR samples, the scenario is that of a single hot basic block with no information about which path was taken to get to it.
In practice, even in LBR mode, many times the collected profile is contradictory by stating that predecessors execute many times more than its single successor, among other violations of flow equations.222I.e., the sum of a block’s input flow is equal to the sum of its output flow. Previous work Levin [2007]; Novillo [2014], which includes techniques implemented in IBM’s FDPR Henis et al. [1999b], report handling the problem of reconstructing edge counts by solving an instance of minimum cost flow (MCF Levin [2007]), a graph network flow problem. However, these reports predate LBRs. LBRs only store taken branches, so when handling very skewed data such as the cases mentioned above, BOLT satisfies the flow equation by attributing all surplus flow to the non-taken path that is naturally missing from the LBR, similarly to Chen et al. Chen et al. [2013]. BOLT also benefits from being applied after the static compiler: to cope with uncertainty, by putting weight on the fall-through path, it trusts the original layout done by the static compiler. Therefore, the program trace needs to show a significant number of taken branches, which contradict the original layout done by the compiler, to convince BOLT to reorder the blocks and change the original fall-through path. Without LBRs, it is not possible to take advantage of this: algorithms start with guesses for both taken and non-taken branches without being sure if the taken branches, those taken for granted in LBR mode, are real or the result of bad edge-count inference.
5.3 Consequences for Function Layout
BOLT uses HFSort Ottoni and Maher [2017] to perform function reordering based on a weighted call graph. If LBRs are used, the edge weights of the call graph are directly inferred from the branch records, which may also include function calls and returns. However, without LBRs, BOLT is still able to build an incomplete call graph by looking at the direct calls in the binary and creating caller-callee edges with weights corresponding to the number of samples recorded in the blocks containing the corresponding call instructions. However, this approach cannot take indirect calls into account. Even with these limitations, we did not observe a performance penalty as severe as using non-LBR mode for basic block reordering (Section 6.5)
6 Evaluation
This section evaluates BOLT in a variety of scenarios, including Facebook server workloads and the GCC and Clang open-source compilers. A comparison with GCC’s and Clang’s PGO and LTO is also provided in some scenarios.
The evaluation presented in this section was conducted on Linux-based servers featuring Intel microprocessors.
6.1 Facebook Workloads
The impact of BOLT was measured on five binaries inside Facebook’s data centers. The first is HHVM Adams et al. [2014], the PHP virtual machine that powers the web servers at Facebook and many other web sites, including Baidu and Wikipedia. The second is TAO Bronson et al. [2013], a highly distributed, in-memory, data-caching service used to store Facebook’s social graph. The third one is Proxygen, which is a cluster load balancer built on top of the open-source library with the same name Proxygen Team [2017]. Finally, the other two binaries implement a service called Multifeed, which is used to select what is shown in the Facebook News Feed.
In this evaluation, we compared the performance impact of BOLT on top of binaries built using GCC and function reordering via HFSort Ottoni and Maher [2017]. The HHVM binary specifically is compiled with LTO to further enhance its performance. Unfortunately, a comparison with FDO and AutoFDO was not possible. The difficulties with FDO were the common ones outlined in Section 2.1 to deploy instrumented binaries in these applications’ normal production environments. And we found that AutoFDO support in the latest version of GCC available in our environment (version 5.4.1) is not stable and caused either internal compiler errors or runtime errors related to C++ exceptions. Nevertheless, a direct comparison between BOLT and FDO was possible for other applications, and the results are presented in Section 6.2.
Figure 5 shows the performance results for applying BOLT on top of HFSort for our set of Facebook data-center workloads (and, in case of HHVM, also on top of LTO). In all cases, BOLT’s application resulted in a speedup, with an average of 5.4% and a maximum of 8.0% for HHVM. Note that HHVM, despite containing a large amount of dynamically compiled code that is not optimized by BOLT, spends more time in statically compiled code than in the dynamically generated code. Among these applications, HHVM has the largest total code size, which makes it very front-end bound and thus more amenable to the code layout optimizations that BOLT implements.
To better understand the performance benefits of BOLT, we performed a more detailed performance analysis of HHVM. Figure 6 shows BOLT’s improvements on important performance metrics, including i-cache misses, i-TLB misses, branch misses, and LLC misses. Improving branch prediction is an important benefit from the block layout optimization done by BOLT, and for HHVM this metric improved by 11%. Moreover, improving locality leads to better metrics across the entire cache hierarchy, specially the first level of i-cache, which exhibits 18% reduction in misses. It is possible to see a small improvement of 1% in the first level of d-cache as well, due to reordering jump tables for locality and frame optimizations. The observed TLB improvements come from packing accessed instructions and data into fewer pages. To better illustrate how cache and TLB locality are improved, we present heat maps of address-space accesses in Section 6.4.
6.2 Clang and GCC Compilers
BOLT should be able to improve the performance of any front-end bound application, not just data-center workloads. To test this theory, we ran BOLT on two open-source compilers: Clang and GCC.
6.2.1 Clang Setup
For our Clang evaluation, we used the release_60 branch of llvm, clang, and
compiler-rt open-source repositories LLVM
Community [2018]. We built a bootstrapped release version of the
compiler first. This stage1 compiler provided a baseline for our evaluation.
We then built an instrumented version of Clang,333-DLLVM_BUILD_INSTRUMENTED=ON and then used the instrumented
compiler to build Clang again with default options. The collected profile
data was used to do another build of Clang with LTO enabled.444-DLLVM_ENABLE_LTO=Full -DLLVM_PROFDATA_FILE=clang.profdata This is
referred as PGO+LTO in our chart.
Each of the 2 compilers was profiled with our training input, a full build of GCC. We used the Linux perf utility with the option record -e cycles:u -j any,u. The profile from perf was converted using perf2bolt utility into YAML format (-w option). Then the profile was used to optimize the compiler binary using BOLT with the following options:
The four compilers were then used to build Clang, and the overall build time was measured for benchmarking purposes. For all builds above we used ninja instead of GNU make, and for all benchmarks we ran them with -j40 clang options. We chose to build only the clang binary (as opposed to the full build) to minimize the effect of link time on our evaluation.
We have also selected 3 Clang/LLVM source files ranging from small to large sizes and preprocessed those files such that they could be compiled without looking up header dependencies. The 3 source files we used are:
-
•
input1: tools/clang/lib/CodeGen/CGVTT.cpp
-
•
input2: lib/ExecutionEngine/Orc/OrcCBindings.cpp
-
•
input3: lib/Target/X86/X86ISelLowering.cpp
Each of the files was then compiled with -std=c++11 -O2 options multiple times, and the results were recorded for benchmarking purposes. Tests were run on a dual-node 20-core (40-core with hyperthreading) IvyBridge (Intel(R) Xeon(R) CPU E5-2680 v2 @ 2.80GHz) system with 32GiB RAM.
6.2.2 GCC Setup
For our GCC evaluation, we used version 8.2.0. First, GCC was built using the default build process. The result of this bootstrap build was our baseline. Second, we built a PGO version using the following configuration:
Afterwards, make profiledbootstrap was used to generate our PGO version of GCC.
Since BOLT is incompatible with GCC function splitting, we had to repeat the above builds passing BOOT_CFLAGS=-́O2 -g -fno-reorder-blocks-and-partition´ to the make command. The resulting compiler, ready to be BOLTed, was used to build GCC again (our training input), this time without the bootstrap. The profile was then recorded and converted using perf2bolt to YAML format, and the cc1plus binary was optimized using BOLT with the same options used for Clang and later copied over to GCC’s installation directory.
All 4 different types of GCC compilers, 2 without BOLT and 2 with BOLT, were later used to build the Clang compiler using the default configuration.
6.2.3 Experimental Results
Figures 7 and 8 show the experimental results for Clang and GCC, respectively. We observed a significant improvement on both compilers by using BOLT. On top of GCC with PGO, BOLT provided a 7.45% speedup when doing a full build of Clang. On top of Clang with LTO and PGO, a 15.0% speedup when doing a full build of Clang.
Table 2 shows some statistics reported by BOLT as it optimizes the Clang binaries for the baseline and with PGO+LTO applied. These statistics are based on the input profile data. Even when applied on top of PGO+LTO, BOLT has a very significant impact in many of these metrics, particularly the ones that affect code locality. For example, we see that BOLT reduces the number of taken branches by 44.3% over PGO+LTO (69.8% over the baseline), which significantly improves i-cache locality.
| Metric | Over Baseline | Over PGO+LTO |
|---|---|---|
| executed forward branches | -1.6% | -1.0% |
| taken forward branches | -83.9% | -61.1% |
| executed backward branches | +9.6% | +6.0% |
| taken backward branches | -9.2% | -21.8% |
| executed unconditional branches | -66.6% | -36.3% |
| executed instructions | -1.2% | -0.7% |
| total branches | -7.3% | -2.2% |
| taken branches | -69.8% | -44.3% |
| non-taken conditional branches | +60.0% | +13.7% |
| taken conditional branches | -70.6% | -46.6% |
Function:
clang::Redeclarable<clang::TagDecl>::DeclLink::getNext(...)
const
  Exec Count  : 1723213

.Ltmp1100284 (4 instructions, align : 1)
  Exec Count : 1635334
  Predecessors: .Ltmp1100286, .LBB087908
    0000001d:   movq  %r12, %rbx # PointerIntPair.h:152:40
    00000020:   andq  $-0x8, %rbx # PointerIntPair.h:152:40
    00000024:   testb $0x4, %r12b # PointerUnion.h:143:9
    00000028:   je  .Ltmp1100279 # ExternalASTSource.h:462:19
  Successors: .Ltmp1100279 (mispreds: 2036, count: 1635334),
              .LFT680413 (mispreds: 0, count: 0)

.LFT680413 (2 instructions, align : 1)
  Exec Count : 0
  Predecessors: .Ltmp1100284
    0000002a:   testq %rbx, %rbx # ExternalASTSource.h:462:19
    0000002d:   jne .Ltmp1100280 # ExternalASTSource.h:462:19
  Successors: .Ltmp1100280 (mispreds: 0, count: 0),
              .Ltmp1100279 (mispreds: 0, count: 0)

.Ltmp1100279 (9 instructions, align : 1)
  Exec Count : 1769771
  Predecessors: .Ltmp1100284, .LFT680414, .Ltmp1100282,
                .LFT680413
    0000002f:   movq  %rbx, %rax # Redeclarable.h:140:5
    00000032:   addq  $0x28, %rsp # Redeclarable.h:140:5
    00000036:   popq  %rbx # Redeclarable.h:140:5
    00000037:   popq  %r12 # Redeclarable.h:140:5
    00000039:   popq  %r13 # Redeclarable.h:140:5
    0000003b:   popq  %r14 # Redeclarable.h:140:5
    0000003d:   popq  %r15 # Redeclarable.h:140:5
    0000003f:   popq  %rbp # Redeclarable.h:140:5
    00000040:   retq # Redeclarable.h:140:5
6.3 Analysis of Suboptimal Compiler Code Layout
Using BOLT’s -report-bad-layout option, we inspected Clang’s binary built with LTO+PGO to identify frequently executed functions that contain cold basic blocks interleaved with hot ones. Combined with options -print-debug-info and -update-debug-sections, this allowed us to trace the source of such blocks. Using this methodology, we analyzed such suboptimal code layout occurrences among the hottest functions. Our analysis revealed that the majority of such cases originated from function inlining as motivated in the example in Figure 2. Figure 10 illustrates one of these functions at the binary level. This function contains 3 basic blocks, each one corresponding to source code from a different source file. In Figure 10, the blocks are annotated with their profile counts (Exec Count). The source code corresponding to block .LFT680413 is not cold, but it is very cold when inlined in this particular call site. By operating at the binary level and being guided by the profile data, BOLT can easily identify these inefficiencies and improve the code layout.
6.4 Heat Maps
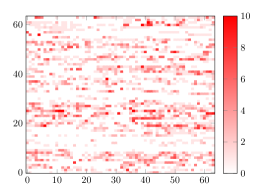
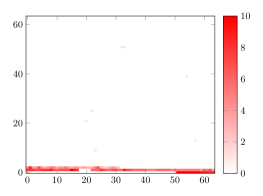
Figure 9 shows heat maps of the instruction address space for HHVM running with Facebook production traffic. Figure 9(a) illustrates addresses fetched through I-cache for the regular binary, while Figure 9(b) shows the same for HHVM processed with BOLT.
This heat map is built as a matrix of addresses. Each line has 64 blocks and the complete graph has 64 lines. The HHVM binary chosen for this study has 148.2 MB of text size, which is fully represented in the heat map. Each block represents 36,188 bytes and the heat map shows how many times, on average, each byte of a block is fetched as indicated by profiling data. For example, the line at from to plots how code is being accessed in the first 2,316,032 bytes of the address space. The average number of times a byte is fetched is reduced by a logarithm function to help visualize the data, so we can easily identify even code that is executed just a few times. Completely white areas show cold basic blocks that were never sampled during profiling, while strong red highlights the most frequently accessed areas of instruction memory.
Figure 9(b) demonstrates how BOLT packs together hot code to use about 4 MB of space instead of the original range spanning 148.2 MB. There is still some activity outside the dense hot area, but they are relatively cold. These functions were ignored by BOLT’s function-reordering pass because they have an indirect tail call. BOLT marks functions it can fully understand as simple as a mechanism to allow it to operate on the binary even if it does not fully process all functions. Those are non-simple functions.
Indirect tail calls are more challenging for static binary rewriters because it is difficult to guess if the target is another function or another basic block of the same function, which could affect the CFG. BOLT leaves these functions untouched. This also explains a large cold block of about 160 KB in the hot area at and : this cold block is part of a large non-simple function whose CFG is not fully processed by BOLT, so it is not split in the same way as other functions.
Function splitting and reordering are important to move cold basic blocks out of the hot area, and BOLT uses these techniques on the vast majority of functions in the HHVM binary. The result is a tight packing of frequently executed code as show in of Figure 9(b), which greatly benefits I-cache and I-TLB.
6.5 Importance of LBR
Not all CPU vendors support a hardware mechanism to collect a trace of the last branches, such as LBRs on Intel CPUs. We compared the impact of using them for BOLT profile versus relying on plain samples with no such traces.
Figure 11 summarizes our evaluation on different metrics for HHVM, in 3 different scenarios: reordering functions using HFSort, reordering basic blocks and applying other optimizations, and with both (all optimizations on). For example, the first data set shows that the overall reduction on instructions executed is 0.35% by having more accurate profiling enabled by LBRs. As Figure 6 shows, total CPU time improvements by using BOLT on HHVM are about 8%. Figure 11 shows us that using LBRs is responsible for about 2% of these improvements. Furthermore, the impact is more significant for basic block layout optimizations than it is for function reordering. The reason is because basic-block reordering requires more fine-grained profiling, at the basic-block level, which is harder to obtain without LBRs.
7 Related Work
Binary or post-link optimizers have been extensively explored in the past. There are two different categories for binary optimization in general: static and dynamic, operating before program execution or during program execution. Post-link optimizers such as BOLT are static binary optimizers. Large platforms for prototyping and testing dynamic binary optimizations are DynamoRIO Bruening et al. [2003] for same host or QEMU Bellard [2005] for emulation. Even though it is challenging to overcome the overhead of the virtual machine with wins due to the optimizations themselves, these tools can be useful in performing dynamic binary instrumentation to analyze program execution, such as Pin Luk et al. [2005] does, or debugging, which is the main goal of Valgrind Nethercote and Seward [2007].
Static binary optimizers are typically focused on low-level program optimizations, preferably using information about the precise host that will run the program. MAO Hundt et al. [2011] is an example where microarchitectural information is used to rewrite programs, although it rewrites source-level assembly and not the binary itself. Naturally, static optimizers tend to be architecture-specific. Ispike Luk et al. [2004] is a post-link optimizer developed by Intel to optimize for the quirks of the Itanium architecture. Ispike also utilizes block layout techniques similar to BOLT, which are variations of Pettis and Hansen Pettis and Hansen [1990]. However, despite supporting architecture-specific passes, BOLT was built on top of LLVM Lattner and Adve [2004] to enable it to be easily ported to other architectures. Ottoni and Maher Ottoni and Maher [2017] present an enhanced function-reordering technique based on a dynamic call graph. BOLT implements the same algorithm in one of its passes.
Profile information is most commonly used to augment the compiler to optimize code based on run-time information, such as done by AutoFDO Chen et al. [2016]. The latter has also been studied in the context of data-center applications, like BOLT. Even though there is some expected overlap in gains between AutoFDO and BOLT, since both tools perform layout, in this paper we show that the gains with FDO in general (not just AutoFDO) and BOLT can be complimentary and both tools can be used together to obtain maximum performance.
8 Conclusion
The complexity of data-center applications often results in large binaries that tend to exhibit poor CPU performance due to significant pressure on multiple important hardware structures, including caches, TLBs, and branch predictors. To tackle the challenge of improving performance of such applications, we created a post-link optimizer, called BOLT, which is built on top of the LLVM infrastructure. The main goal of BOLT is to reorganize the applications’ code to reduce the pressure that they impose on those important hardware structures. BOLT achieves this goal with a series of optimizations, with particular focus on code layout. A key insight of this paper is that a post-link optimizer is in a privileged position to perform these optimizations based on profiling, even beyond than what a compiler can achieve.
We tested our assumptions in Facebook data-center applications and obtained improvements ranging from 2% to 8%. Unlike profile-guided static compilers, BOLT does not need to retrofit profiling data back to source code, making the profile more accurate. Nevertheless, a post-link optimizer has fewer optimizations than a compiler. We show that the strengths of both strategies combine instead of purely overlapping, indicating that using both approaches leads to the highest efficiency for large, front-end bound applications. To show this, we measure the performance improvements on two open-source compilers, GCC and Clang, featuring large code bases dependent on the instruction cache performance. Overall, BOLT achieves 15% performance improvement for Clang on top of LTO and FDO.
We would like to thank Gabriel Poesia and Theodoros Kasampalis for their work on BOLT during their internships at Facebook. We would also like to thank Sergey Pupyrev for his work on improving the basic block layout algorithms used by BOLT.
References
- [1]
- Adams et al. [2014] Keith Adams, Jason Evans, Bertrand Maher, Guilherme Ottoni, Andrew Paroski, Brett Simmers, Edwin Smith, and Owen Yamauchi. 2014. The Hiphop Virtual Machine. In Proceedings of the ACM International Conference on Object Oriented Programming Systems Languages & Applications. 777–790.
- Bala et al. [2000] Vasanth Bala, Evelyn Duesterwald, and Sanjeev Banerjia. 2000. Dynamo: A Transparent Dynamic Optimization System. In Proceedings of the ACM SIGPLAN Conference on Programming Language Design and Implementation. ACM, 1–12.
- Bellard [2005] F. Bellard. 2005. QEMU, a fast and portable dynamic translator. In USENIX Annual Technical Conference.
- Bronson et al. [2013] Nathan Bronson, Zach Amsden, George Cabrera, Prasad Chakka, Peter Dimov, Hui Ding, Jack Ferris, Anthony Giardullo, Sachin Kulkarni, Harry Li, Mark Marchukov, Dmitri Petrov, Lovro Puzar, Yee Jiun Song, and Venkat Venkataramani. 2013. TAO: Facebook’s Distributed Data Store for the Social Graph. In Proceedings of the USENIX Conference on Annual Technical Conference. 49–60.
- Bruening et al. [2003] Derek Bruening, Timothy Garnett, and Saman Amarasinghe. 2003. An infrastructure for adaptive dynamic optimization. In Proceedings of the International Symposium on Code Generation and Optimization. IEEE, 265–275.
- Chen et al. [2016] Dehao Chen, David Xinliang Li, and Tipp Moseley. 2016. AutoFDO: Automatic Feedback-directed Optimization for Warehouse-scale Applications. In Proceedings of the International Symposium on Code Generation and Optimization. 12–23.
- Chen et al. [2013] Dehao Chen, Neil Vachharajani, Robert Hundt, Xinliang Li, Stephane Eranian, Wenguang Chen, and Weimin Zheng. 2013. Taming hardware event samples for precise and versatile feedback directed optimizations. IEEE Trans. Comput. 62, 2 (2013), 376–389.
- Cohn et al. [1997] Robert Cohn, D. Goodwin, and P. G. Lowney. 1997. Optimizing Alpha executables on Windows NT with Spike. Digital Technical Journal 9, 4 (1997), 3–20.
- Dehnert et al. [2003] James C. Dehnert, Brian K. Grant, John P. Banning, Richard Johnson, Thomas Kistler, Alexander Klaiber, and Jim Mattson. 2003. The Transmeta Code Morphing Software: Using Speculation, Recovery, and Adaptive Retranslation to Address Real-life Challenges. In Proceedings of the International Symposium on Code Generation and Optimization. 15–24.
- DWARF Debugging Standards Committee [2017] DWARF Debugging Standards Committee. 2017. DWARF Debugging Information Format version 5.
- Henis et al. [1999a] Ealan A Henis, Gadi Haber, Moshe Klausner, and Alex Warshavsky. 1999a. Feedback based post-link optimization for large subsystems. In Workshop on Feedback Directed Optimization. 13–20.
- Henis et al. [1999b] E. A. Henis, G. Haber, M. Klausner, and A. Warshavsky. 1999b. Feedback based postlink optimization for large subsystems. In Proceedings of the 2nd workshop on Feedback Directed Optimization. 13–20.
- Hölzle and Ungar [1994] Urs Hölzle and David Ungar. 1994. Optimizing Dynamically-dispatched Calls with Run-time Type Feedback. In Proceedings of the ACM Conference on Programming Language Design and Implementation. 326–336.
- Hundt et al. [2011] Robert Hundt, Easwaran Raman, Martin Thuresson, and Neil Vachharajani. 2011. MAO – An Extensible Micro-architectural Optimizer. In Proceedings of the 9th Annual IEEE/ACM International Symposium on Code Generation and Optimization. IEEE Computer Society, 1–10.
- Intel Corporation [2011] Intel Corporation. 2011. Intel® 64 and IA-32 Architectures Software Developer’s Manual. Number 325384-039US.
- Lattner and Adve [2004] Chris Lattner and Vikram Adve. 2004. LLVM: A Compilation Framework for Lifelong Program Analysis & Transformation. In Proceedings of the International Symposium on Code Generation and Optimization. 75–86.
- Levin [2007] Roy Levin. 2007. Complementing incomplete edge profile by applying minimum cost circulation algorithms.
- Li et al. [2010] Xinliang David Li, Raksit Ashok, and Robert Hundt. 2010. Lightweight Feedback-Directed Cross-Module Optimization. In Proceedings of the International Symposium on Code Generation and Optimization. 53–61.
-
LLVM
Community [2018]
LLVM Community.
2018.
The LLVM open-source code repositories.
Web site:
http://llvm.org/releases. - Luk et al. [2005] Chi-Keung Luk, Robert Cohn, Robert Muth, Harish Patil, Artur Klauser, Geoff Lowney, Steven Wallace, Vijay Janapa Reddi, and Kim Hazelwood. 2005. Pin: Building Customized Program Analysis Tools with Dynamic Instrumentation. In Proceedings of the 2005 ACM SIGPLAN Conference on Programming Language Design and Implementation. ACM, 190–200.
- Luk et al. [2004] C-K Luk, Robert Muth, Harish Patil, Robert Cohn, and Geoff Lowney. 2004. Ispike: a post-link optimizer for the Intel Itanium architecture. In Proceedings of the International Symposium on Code Generation and Optimization. IEEE, 15–26.
- Nethercote and Seward [2007] Nicholas Nethercote and Julian Seward. 2007. Valgrind: A Framework for Heavyweight Dynamic Binary Instrumentation. In Proceedings of the 28th ACM SIGPLAN Conference on Programming Language Design and Implementation. ACM, 89–100.
- Novillo [2014] Diego Novillo. 2014. SamplePGO: The Power of Profile Guided Optimizations Without the Usability Burden. In Proceedings of the 2014 LLVM Compiler Infrastructure in HPC. IEEE Press, 22–28.
- Ottoni [2018] Guilherme Ottoni. 2018. HHVM JIT: A Profile-guided, Region-based Compiler for PHP and Hack. In Proceedings of the 39th ACM SIGPLAN Conference on Programming Language Design and Implementation. ACM, 151–165.
- Ottoni and Maher [2017] Guilherme Ottoni and Bertrand Maher. 2017. Optimizing Function Placement for Large-scale Data-center Applications. In Proceedings of the International Symposium on Code Generation and Optimization. IEEE, 233–244.
- Pettis and Hansen [1990] Karl Pettis and Robert C. Hansen. 1990. Profile Guided Code Positioning. In Proceedings of the ACM Conference on Programming Language Design and Implementation. ACM, 16–27.
- Proxygen Team [2017] Proxygen Team. 2017. Proxygen: Facebook’s C++ HTTP Libraries. Web site: https://github.com/facebook/proxygen.
- Romer et al. [1997] Ted Romer, Geoff Voelker, Dennis Lee, Alec Wolman, Wayne Wong, Hank Levy, Brian Bershad, and Brad Chen. 1997. Instrumentation and optimization of Win32/Intel executables using Etch. In Proceedings of the USENIX Windows NT Workshop, Vol. 1997. 1–8.
- Wang et al. [2007] Cheng Wang, Shiliang Hu, Ho-seop Kim, Sreekumar R Nair, Mauricio Breternitz, Zhiwei Ying, and Youfeng Wu. 2007. StarDBT: an efficient multi-platform dynamic binary translation system. In Proceedings of the Asia-Pacific Conference on Advances in Computer Systems Architecture. Springer, 4–15.