Chemical Compositions of Field and Globular Cluster RR Lyrae Stars: I. NGC 3201111This paper includes data gathered with the 6.5 meter Magellan Telescopes located at Las Campanas Observatory, Chile.
Abstract
We present a detailed spectroscopic analysis of horizontal branch stars in the globular cluster NGC 3201. We collected optical (4580–5330 Å), high resolution (34,000), high signal-to-noise ratio (200) spectra for eleven RR Lyrae stars and one red horizontal branch star with the multifiber spectrograph M2FS at the 6.5m Magellan telescope at the Las Campanas Observatory. From measured equivalent widths we derived atmospheric parameters and abundance ratios for (Mg, Ca, Ti), iron peak (Sc, Cr, Ni, Zn) and s-process (Y) elements. We found that NGC 3201 is a homogeneous, mono-metallic ([Fe/H]=), -enhanced ([/Fe]=) cluster. The relative abundances of the iron peak and s-process elements were found to be consistent with solar values. In comparison with other large stellar samples, NGC 3201 RR Lyraes have similar chemical enrichment histories as do those of other old (t10 Gyr) Halo components (globular clusters, red giants, blue and red horizontal branch stars, RR Lyraes). We also provided a new average radial velocity estimate for NGC 3201 by using a template velocity curve to overcome the limit of single epoch measurements of variable stars: V km s-1 (=8 km s-1).
1 Introduction
Dating back to Baade (1958), RR Lyrae stars (RRL) have played a fundamental role as tracers of old (t10 Gyr) stellar populations. RRLs are ubiquitous, having been identified both in gas-poor and in gas-rich stellar systems. Moreover, they can be easily identified thanks to a particular coupling between pulsation period and shape/amplitude of their optical light curves. Therefore they have been extensively used to investigate the early formation and the spatial structure of the Galactic Bulge (Pietrukowicz et al., 2015) and of the Galactic Halo (Drake et al., 2013; Torrealba et al., 2015). The RRLs in globulars have been widely used not only to constrain the evolutionary properties of old, low-mass, central helium burning stars, but also to investigate the impact that the intrinsic parameters (metallicity) and the environment have on the topology of the instability strip and on their pulsation properties (Oosterhoff, 1939; van Albada & Baker, 1973; Caputo, 1997; Bono et al., 2007).
RRLs are also very good distance indicators. Dating back once again to Baade & Swope (1955) and to Sandage (1958) it was shown that RRLs have a well defined visual magnitude–metallicity relation. Their use as standard candles became even more compelling thanks to the empirical discovery by Longmore et al. (1986, 1990) that RRLs have near-infrared Period-Luminosity correlations. More recent empirical and theoretical evidence indicate that in the near infrared (NIR) they obey Period–Luminosity–Metallicity (PLZ) relations (Bono et al., 2003; Marconi et al., 2015; Braga et al., 2015; Neeley et al., 2017; Braga et al., 2018).
The RRLs have also played a crucial role in the investigation of the spatial distribution of old stellar populations in nearby dwarf galaxies (Magellanic Clouds: Soszyński et al. 2009; Carina: Coppola et al. 2013; Sculptor: Martínez-Vázquez et al. 2016a). HST optical photometry played a fundamental role in detecting and tracing RRLs in satellites of M31 (Clementini et al., 2001; Pritzl et al., 2002; Monelli et al., 2017), and in galaxies of the Sculptor group (Da Costa et al., 2010). The pulsation properties of RRLs in globulars, and in Local Group (d1 Mpc) and Local Volume (d10 Mpc) galaxies, can be adopted to constrain the early formation and evolution of the Galactic spheroid (Stetson et al., 2014; Fiorentino et al., 2015).
RRLs in globular clusters are especially useful for several reasons. First, the ages and the chemical compositions of many clusters are well known. In particular, the iron metallicities, and neutron capture elements have been studied extensively, (e.g, Carretta et al., 2009a). Second, the evolutionary status and the topology of the instability strip is also well established (Walker et al., 2017). The globulars hosting a sizable sample of RRLs allow us to investigate the regions of the instability strip in which variables pulsate either as first overtones (hotter) or as fundamentals (cooler). Moreover, we can also estimate the width in temperature of the region in which RRLs pulsate simultaneously in the first overtone and in the fundamental mode, i.e., the so-called mixed mode pulsators. Finally, evolved cluster RRLs can be more easily identified, since they attain luminosities that are systematically brighter than the zero-age horizontal branch (ZAHB) luminosity level.
Metallicities and detailed abundance ratios of individual stars are crucial not only to provide more accurate individual distance determinations, but also to trace the early chemical enrichment of old stellar populations (Monelli et al., 2012; Martínez-Vázquez et al., 2016b). Metallicities of field RRLs have been derived from the large and homogeneous SDSS DR8 sample of medium resolution spectra (Lee et al., 2011; Drake et al., 2013), using several different techniques, mostly based on photometric indices (Mateu et al., 2012) or on metallicity indicators like the Ca II K lines (, Preston 1959; Layden 1994). Recently, metallicities for field RRLs have been estimated using several spectroscopic indicators and collected at different pulsation phases.
High resolution spectroscopic analyses of field RRLs are currently limited to 140 stars (e.g., Clementini et al., 1995; Liu et al., 2013; Pancino et al., 2015; Chadid et al., 2017; Sneden et al., 2017; Andrievsky et al., 2018). These studies have lagged compared with those of other groups of variables stars (Classical Cepheids, Miras) for many reasons:
a) Pulsation periods of RRLs range from a few hours for first-overtone, RRc, pulsators to almost one day for fundamental, RRab, pulsators. This means that the exposure time to collect spectra can hardly be longer than 30–45 minutes to avoid velocity smearing of spectra. To acquire high resolution and S/N spectra typically requires using 4–8 m class telescopes, or co-adding spectra obtained over many pulsation cycles by smaller telescopes. This requires well-known pulsational timing to avoid overlap of different phases, and in turn different physical properties.
b) RRab stars experience several non-linear phenomena during their pulsation cycles. The formation and propagation of strong shocks across the rising-light branch cause line doubling and P Cygni profiles (Preston, 1959; Preston & Paczynski, 1964). During these pulsation phases especially the assumption of quasi-static atmospheres is no longer valid, since the line formation takes place in a medium affected by sharp temperature and density gradients (Bono et al., 1994).
c) Up to 50% of RRab stars exhibit a Blazhko effect (Kolenberg et al., 2010b; Benkő et al., 2014), i.e. a quasi-periodic (tens to hundreds of days) modulation of the lightcurve amplitude and period (Jurcsik et al., 2009; Kolenberg et al., 2010a). Many hypothesis have been formulated to explain the Blazhko effect. Recently, Buchler & Kolláth (2011) suggested that the modulation is the consequence of resonance between the fundamental and the ninth overtone pulsation modes, however, we still lack agreement on a convincing physical explanation.
d) The RRLs cover a very broad metallicity range. Current estimates suggest a range from [Fe/H] (Govea et al., 2014) to [Fe/H] 0.1 (Chadid et al., 2017)222We adopted the standard notation, [X/H]=A(X)-A☉(X), where A(X)=log(NX). Solar abundances refer to Asplund et al. (2009) within the text.. The identification and measurement of individual atomic lines requires high spectral resolution. Such lines are not plentiful in RRLs, which have temperatures Teff 60008000 K and surface gravities log g 2.50.5 (Bono & Stellingwerf, 1994; Marconi et al., 2015).
In this paper we report an abundance analysis on eleven RRLs and one red horizontal branch (RHB) star in the globular cluster NGC 3201, using high resolution optical spectra collected with M2FS at Magellan. We have derived [Fe/H] metallicities and abundance ratios [X/Fe] of -elements (Mg, Ca, Ti), iron peak elements (Sc, Cr, Ni, Zn) and one s-process element (Y). This GC has been widely investigated using giant branch (RGB, AGB) stars (e.g., Carretta et al., 2009a) and it is generally accepted to be a mono-metallic cluster ([Fe/H] ), but an extended analysis of its RRLs has not been previously done. The only RRL-based analysis of NGC 3201 was performed by Smith & Manduca (1983), who estimated iron abundances using the technique. Therefore, our main goal is to obtain a new independent abundance analysis for NGC 3201 based on RRLs and to compare it with results available in the literature for RGB and AGB stars. In Section 2 we describe the instrument and the data sample. In Section 3 we discuss the radial velocity analysis. Section 4 focuses on abundance determinations and comparison with other globular clusters and field stars. Finally, Section 5 summarizes the current results.
| ID | p (days) | HJDaa2450000+ | HJD0aa2450000+ | phase | type | V | Vamp | Reference | ||
|---|---|---|---|---|---|---|---|---|---|---|
| V3 | 10:17:54.47 | -46:25:25.4 | 0.59939921 | 7079.77870 | 4123.15325 | 0.65 | RRab | 14.90 | 0.67 | N,L03 |
| V6 | 10:17:26.09 | -46:27:02.3 | 0.52561240 | 7079.77870 | 6040.73538 | 0.82 | RRab | 14.74 | 0.93 | N,L03 |
| V14 | 10:17:22.42 | -46:22:31.5 | 0.50929203 | 7079.77870 | 6718.64605 | 0.09 | RRab | 14.95 | 1.12 | N |
| V26 | 10:17:58.09 | -46:27:01.8 | 0.56896113 | 7079.75386 | 6718.77606 | 0.45 | RRab | 14.90 | 0.92 | N |
| V37 | 10:17:30.69 | -46:25:55.7 | 0.57699328 | 7079.75386 | 4123.08217 | 0.27 | RRab | 14.78 | 0.78 | N |
| V38 | 10:17:31.42 | -46:25:41.1 | 0.50909990 | 7079.77870 | 6718.57488 | 0.49 | RRabbbBlazhko | 14.76 | 1.04 | N |
| V41 | 10:18:05.02 | -46:24:14.8 | 0.66532664 | 7079.75386 | 7961.19997 | 0.17 | RRab | 14.73 | 0.40 | ASN,N |
| V47 | 10:17:47.56 | -46:20:41.7 | 0.52086843 | 7079.75386 | 7960.97248 | 0.17 | RRab | 14.60 | 0.89 | ASN,L03 |
| V57 | 10:18:04.87 | -46:25:54.6 | 0.59343497 | 7079.77870 | 6718.65687 | 0.53 | RRab | 14.83 | 0.74 | N |
| V73 | 10:17:25.20 | -46:23:15.2 | 0.51995506 | 7079.75386 | 6718.84703 | 0.11 | RRab | 14.75 | 1.22 | N |
| V83 | 10:17:54.76 | -46:21:54.4 | 0.54520516 | 7079.77870 | 6718.79059 | 0.11 | RRab | 14.79 | 1.23 | N |
| 94180 | 10:17:46.54 | -46:27:17.3 | … | 7079.75386 | … | … | RHB | 13.86 | … | N |
2 Instrument and data sample
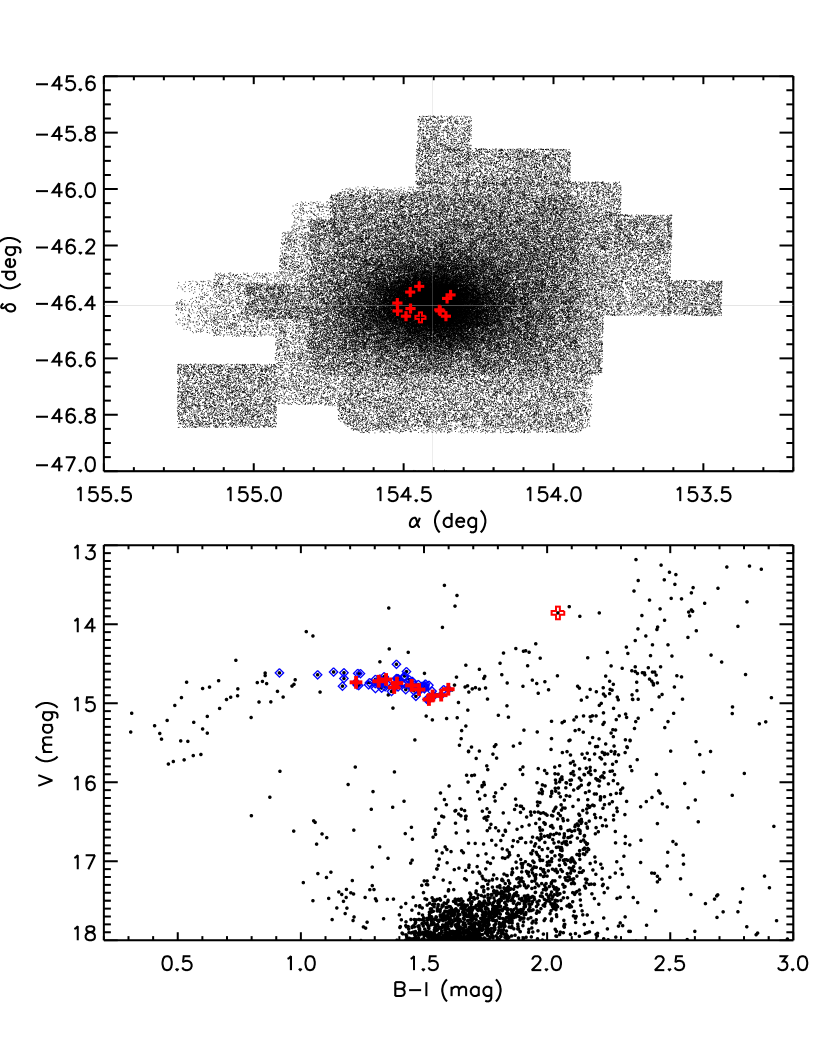
In February 2015, we collected spectra for eleven RRLs and one RHB star in the globular cluster NGC 3201 (Figure 1) using the Michigan/Magellan Fiber System (M2FS, Mateo et al. 2012) installed at the Magellan/Clay 6.5m telescope at the Las Campanas Observatory in Chile. The spectrograph configuration used an order-isolation filter to limit the spectral coverage to 4580–5330 Å in eleven overlapping echelle orders. A total of eight stars could be observed with one setup with each of the two camera/detector units, or 16 stars in all. The spectrograph entrance slit size was 95 , which yielded spectra with resolving power 34,000.
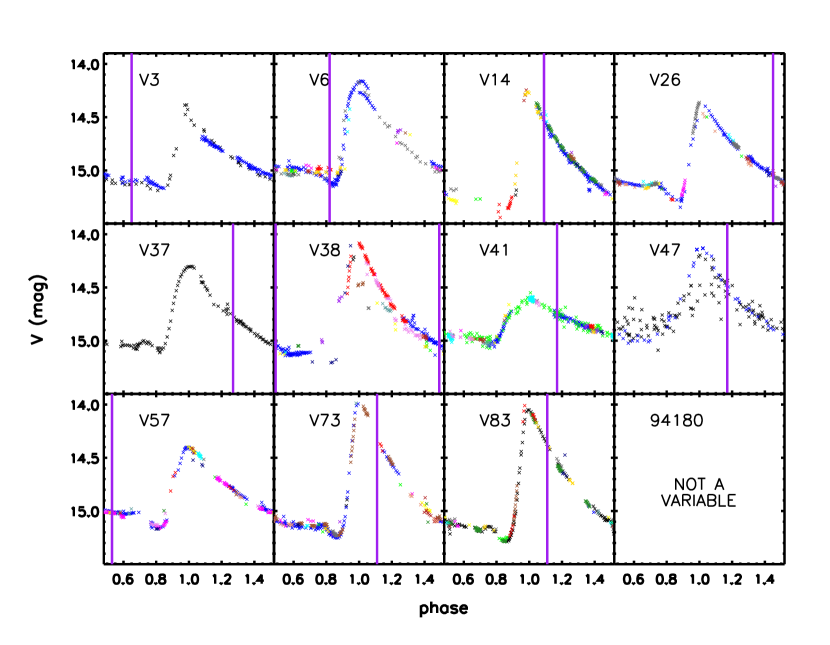
All the observed variables are RRab, including V38 which is also a Blazkho candidate (Layden & Sarajedini 2003, Neeley et al. in preparation). It is possible to deduce the nature of V38 from its characteristic lightcurve (Figure 2). Unfortunately, only for two stars (V41 and V47) is very recent photometry available by ASAS-SN (Shappee et al., 2014; Jayasinghe et al., 2018). The other variables have photometry from one to more than ten years older than our spectra, so that the phase determination could be affected by some inaccuracy. Average magnitudes and new estimated periods are listed in Table 1.
3 Radial Velocities
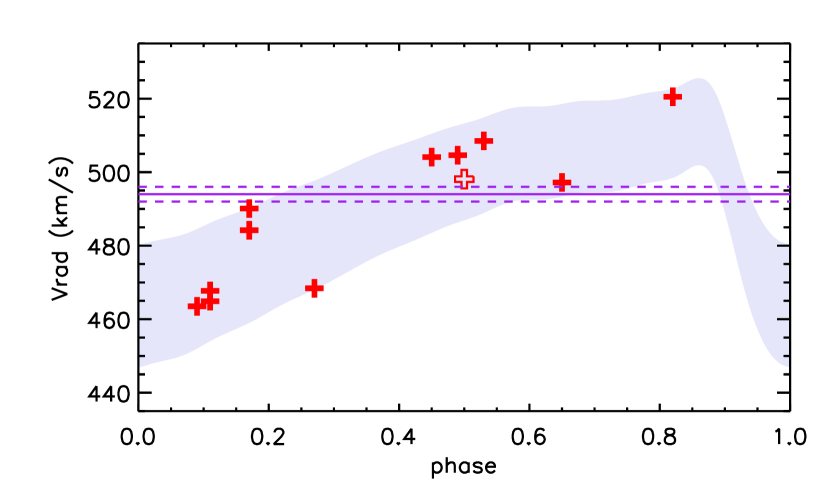
The radial velocities of the sample were estimated using the task fxcor in IRAF (Tody, 1986, 1993)333 IRAF is distributed by the National Optical Astronomy Observatories, which are operated by the Association of Universities for Research in Astronomy, Inc., under cooperative agreement with the National Science Foundation., by cross-correlation of the overall spectral range with a synthetic spectrum. The synthetic spectrum was generated with the MOOG driver synth (Sneden, 1973), with an “average RRL” parameters setting (Teff=6500 K, log g=2.5, =3.0 km s-1), and a metallicity comparable with the literature estimates for NGC 3201 ([Fe/H]=1.5). This computed spectrum was then smoothed to the M2FS resolution (R=34,000). An accurate NGC 3201 cluster radial velocity has been recently determined by Ferraro et al. (2018): 494.50.4 km s-1, using 454 non-variable stars. This very large value makes it a good indicator of cluster membership for individual stars. However, we are dealing with variable stars and so the instantaneous velocities (V, Table 2) are not good representative of the average cluster velocity. The mean velocity obtained from our single epoch measurements is 4896 km s-1. To correct for the pulsational velocities we reconstructed the velocity curve for each star over the entire pulsation cycle by using a template (Sesar, 2012). The first step was to select the template radial velocity among those available, which are based on hydrogen (Hα, Hβ, Hγ) or metallic lines. We chose the latter of these since our radial velocities are based on metallic lines. After that, we used equation 5 in Sesar (2012) to rescale the template to the appropriate amplitude of each star (Table 1, Figure 2). Using the epoch of maximum light displayed in Table 2, we have anchored the template radial velocity to the measured point and derived the systemic velocity as the integral average velocity along the pulsation cycle (Vγ, Table 2). Finally, we estimated the cluster radial velocity as 4942 km s-1, independent of phase, with a standard deviation of 8 km s-1. However, assumptions about the reconstruction of the velocity curves and errors in the estimate of the epoch of maximum light affect the template results. Figure 3 shows the instantaneous radial velocities for the 12 stars in our sample and an ensemble of the template velocity curves for the eleven RRLs (shaded area). The solid and dashed purple lines show the cluster average velocity with the errors on the mean. It is clear that a correct phasing of the observation is fundamental to obtain more precise results.
| ID | V | Vγ | T | log | [M/H] | |
|---|---|---|---|---|---|---|
| (km s-1) | (km s-1) | (K) | (cgs) | (km s-1) | (dex) | |
| V3 | 497.2 0.4 | 482 8 | 6400 100 | 2.5 0.2 | 3.6 0.2 | -1.4 0.1 |
| V6 | 520.5 0.8 | 497 8 | 6800 300 | 3.3 0.4 | 2.8 0.4 | -1.2 0.1 |
| V14 | 463.5 1.2 | 493 8 | 7500 300 | 3.1 0.4 | 3.0 0.4 | -1.5 0.1 |
| V26 | 504.1 0.3 | 497 8 | 6000 100 | 2.1 0.1 | 3.5 0.1 | -1.8 0.1 |
| V37 | 468.4 0.7 | 477 8 | 7200 300 | 2.5 0.2 | 2.6 0.4 | -1.5 0.1 |
| V38 | 504.6 0.4 | 494 8 | 6400 200 | 2.8 0.2 | 2.8 0.3 | -1.5 0.1 |
| V41 | 490.1 0.3 | 505 8 | 6350 100 | 2.3 0.1 | 3.0 0.1 | -1.5 0.1 |
| V47 | 484.2 0.4 | 503 8 | 6700 200 | 2.2 0.3 | 2.6 0.4 | -1.6 0.1 |
| V57 | 508.5 0.4 | 497 8 | 6500 150 | 3.0 0.2 | 3.5 0.3 | -1.4 0.1 |
| V73 | 467.7 0.8 | 495 8 | 7300 150 | 2.6 0.2 | 3.4 0.3 | -1.6 0.1 |
| V83 | 464.9 1.0 | 492 8 | 7300 150 | 2.7 0.2 | 2.8 0.2 | -1.5 0.1 |
| 94180 | 498.1 0.3 | 498 8 | 5600 150 | 2.9 0.3 | 2.2 0.3 | -1.3 0.1 |
4 Abundance analysis
Metallicies and relative abundances were derived from equivalent widths (EW) of selected atomic transitions in our spectra. We prepared the atomic line list selecting only the isolated, unblended lines. We then measured their EW by mean of a multi-gaussian fitting performed with pyEW by M. Adamow444 https://github.com/madamow/pyEW and visually inspected them. We discarded all the highly asymmetric lines and the ones too weak (EW10 mÅ) or too strong (EW180 mÅ). Weak lines could be confused within the noise and their measurement errors are too large, whereas strong lines are on the damping portion of the curve of growth and we expected larger errors associated with the retrieved abundances. We ended up with the line list in Table 3.
| Species | EP | log(gf) | Species | EP | log(gf) | Species | EP | log(gf) | |||||
|---|---|---|---|---|---|---|---|---|---|---|---|---|---|
| (Å) | (eV) | (dex) | (Å) | (eV) | (dex) | (Å) | (eV) | (dex) | |||||
| 4702.991 | Mg I | 4.346 | -0.44 | 4690.138 | Fe I | 3.684 | -1.68 | 5195.472 | Fe I | 4.217 | 0.02 | ||
| 5265.556 | Ca I | 2.521 | -0.26 | 4728.546 | Fe I | 3.651 | -1.28 | 5198.711 | Fe I | 2.221 | -2.09 | ||
| 4670.407 | Sc II | 1.357 | -0.58 | 4733.591 | Fe I | 1.484 | -2.99 | 5215.181 | Fe I | 3.263 | -0.86 | ||
| 5031.021 | Sc II | 1.357 | -0.40 | 4736.773 | Fe I | 3.209 | -0.67 | 5217.389 | Fe I | 3.209 | -1.07 | ||
| 5239.813 | Sc II | 1.455 | -0.77 | 4741.529 | Fe I | 2.829 | -2.00 | 5232.940 | Fe I | 2.938 | -0.19 | ||
| 5039.957 | Ti I | 0.021 | -1.08 | 4745.800 | Fe I | 3.651 | -1.25 | 5242.491 | Fe I | 3.632 | -0.84 | ||
| 5064.653 | Ti I | 0.048 | -0.94 | 4786.807 | Fe I | 3.015 | -1.59 | 5243.776 | Fe I | 4.253 | -1.15 | ||
| 5210.384 | Ti I | 0.048 | -0.82 | 4788.757 | Fe I | 3.234 | -1.81 | 5269.537 | Fe I | 0.858 | -1.33 | ||
| 4708.663 | Ti II | 1.236 | -2.35 | 4938.814 | Fe I | 2.873 | -1.08 | 5292.597 | Fe I | 4.987 | -0.03 | ||
| 4874.009 | Ti II | 3.092 | -0.86 | 4939.687 | Fe I | 0.858 | -3.25 | 5302.303 | Fe I | 3.281 | -0.73 | ||
| 4911.194 | Ti II | 3.121 | -0.64 | 4967.897 | Fe I | 4.188 | -0.53 | 5324.179 | Fe I | 3.211 | -0.11 | ||
| 5072.286 | Ti II | 3.121 | -1.02 | 4973.102 | Fe I | 3.960 | -0.69 | 4620.513 | Fe II | 2.828 | -3.19 | ||
| 5129.156 | Ti II | 1.890 | -1.34 | 4983.250 | Fe I | 4.151 | -0.11 | 4731.439 | Fe II | 2.891 | -3.10 | ||
| 5211.530 | Ti II | 2.588 | -1.41 | 5001.864 | Fe I | 3.882 | -0.01 | 4993.355 | Fe II | 2.807 | -3.70 | ||
| 4600.749 | Cr I | 1.003 | -1.25 | 5005.712 | Fe I | 3.884 | -0.12 | 5197.568 | Fe II | 3.230 | -2.05 | ||
| 4616.124 | Cr I | 0.982 | -1.19 | 5014.943 | Fe I | 3.940 | -0.18 | 5234.624 | Fe II | 3.221 | -2.21 | ||
| 4626.173 | Cr I | 0.968 | -1.33 | 5022.236 | Fe I | 3.984 | -0.33 | 5264.801 | Fe II | 3.230 | -3.23 | ||
| 4646.162 | Cr I | 1.029 | -0.74 | 5044.211 | Fe I | 2.849 | -2.15 | 5284.092 | Fe II | 2.891 | -3.20 | ||
| 4651.291 | Cr I | 0.982 | -1.46 | 5049.819 | Fe I | 2.277 | -1.35 | 4648.652 | Ni I | 3.417 | -0.09 | ||
| 4652.157 | Cr I | 1.003 | -1.04 | 5074.748 | Fe I | 4.217 | -0.20 | 4866.271 | Ni I | 3.536 | -0.22 | ||
| 5296.691 | Cr I | 0.982 | -1.36 | 5083.339 | Fe I | 0.957 | -2.84 | 5035.362 | Ni I | 3.633 | 0.29 | ||
| 4616.629 | Cr II | 4.069 | -1.29 | 5090.773 | Fe I | 4.253 | -0.40 | 5081.107 | Ni I | 3.844 | 0.30 | ||
| 4634.073 | Cr II | 4.069 | -0.98 | 5123.720 | Fe I | 1.010 | -3.06 | 5084.089 | Ni I | 3.676 | 0.03 | ||
| 5237.329 | Cr II | 4.070 | -1.16 | 5127.360 | Fe I | 0.914 | -3.25 | 5099.927 | Ni I | 3.676 | -0.10 | ||
| 5308.408 | Cr II | 4.068 | -1.81 | 5131.468 | Fe I | 2.221 | -2.52 | 5115.389 | Ni I | 3.831 | -0.11 | ||
| 5313.563 | Cr II | 4.070 | -1.65 | 5133.689 | Fe I | 4.175 | 0.36 | 5176.559 | Ni I | 3.895 | -0.44 | ||
| 4598.117 | Fe I | 3.281 | -1.57 | 5141.739 | Fe I | 2.422 | -2.15 | 4722.153 | Zn I | 4.030 | -0.33 | ||
| 4602.000 | Fe I | 1.607 | -3.13 | 5150.840 | Fe I | 0.989 | -3.04 | 4810.528 | Zn I | 4.078 | -0.14 | ||
| 4602.941 | Fe I | 1.484 | -2.21 | 5151.911 | Fe I | 1.010 | -3.32 | 4883.684 | Y II | 1.083 | 0.07 | ||
| 4619.288 | Fe I | 3.600 | -1.06 | 5159.058 | Fe I | 4.280 | -0.82 | 4900.110 | Y II | 1.032 | -0.09 | ||
| 4625.045 | Fe I | 3.239 | -1.27 | 5162.273 | Fe I | 4.175 | 0.02 | 5087.420 | Y II | 1.083 | -0.17 | ||
| 4678.846 | Fe I | 3.600 | -0.68 | 5194.942 | Fe I | 1.556 | -2.02 | 5200.413 | Y II | 0.992 | -0.57 |
We used the LTE line analysis code MOOG (Sneden, 1973), implemented in the Python wrapper pyMOOGi555 https://github.com/madamow/pymoogi (Adamow, 2017), and a grid of -enhanced models from Castelli & Kurucz (2003)666 http://kurucz.harvard.edu/grids.html to estimate the atmospheric parameters (Teff, log g, ) and the abundances for the sample spectra. The entire analysis mainly concentrated on Fe I and Fe II lines to estimate the proper parameters; the final set for each star is given in Table 2. We searched for the spectroscopically defined parameters set following a standard approach. An example is shown in Figure 4.
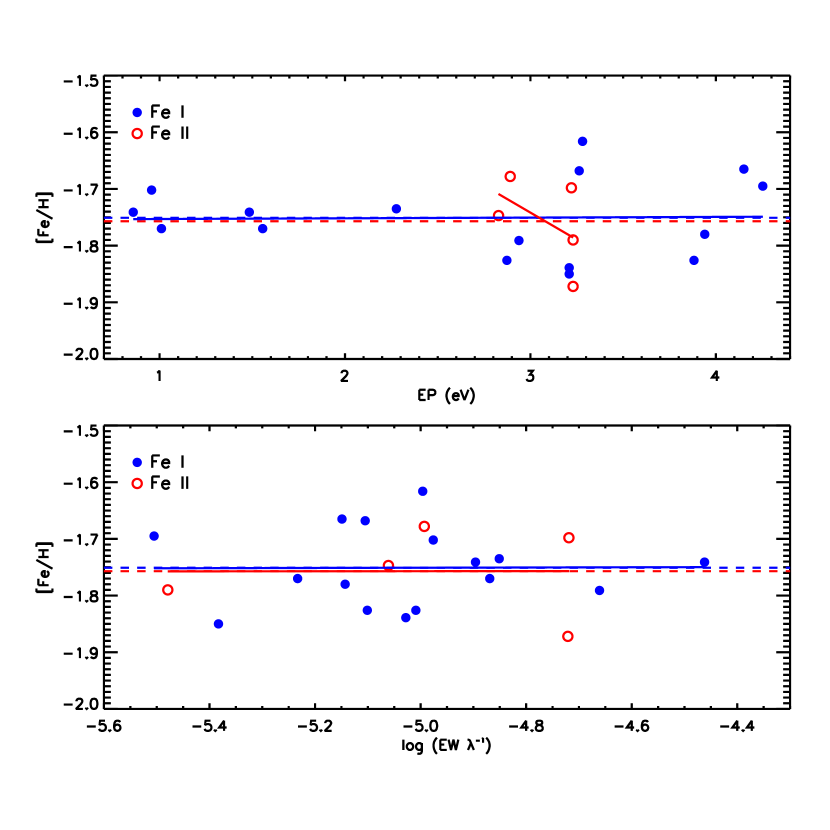
i) The effective temperature is estimated in such a way that abundances from individual lines do not show dependence on the excitation potential (EP, top panel of the figure).
ii) The microturbulence is estimated limiting the dependence of the individual line abundances on the reduced equivalent width ((EW ), bottom panel of the figure).
iii) The surface gravity is estimated assuming the balance between the ionization states, minimizing the differences between neutral and ionized species.
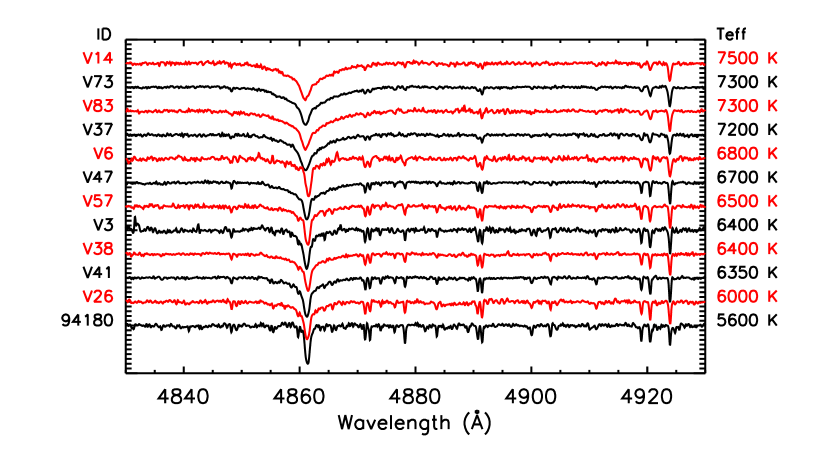
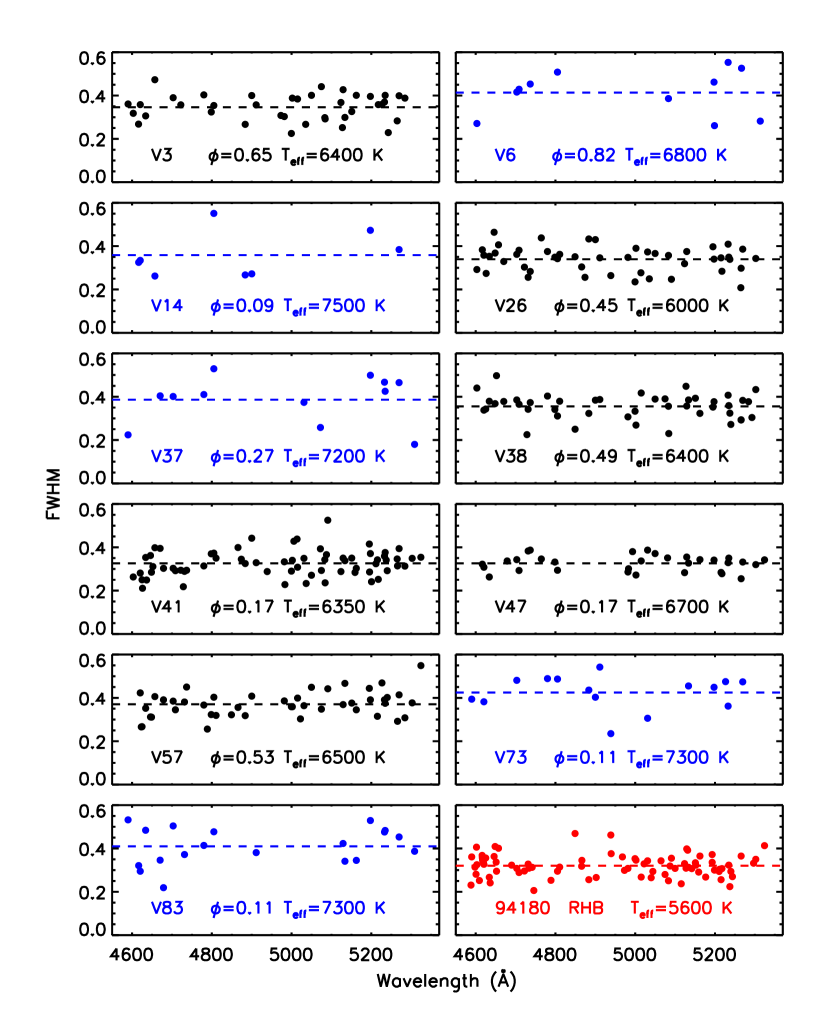
The EW analysis is bolstered by two other exercises with our spectra. In Figure 5 we show a montage of the spectra in the wavelength region 4830–4930 Å, ordering the stars by their derived temperatures. The dependence on Teff appears: the warmer stars have weaker atomic line absorptions and stronger 4861 Å H lines. In Figure 6 we show the FWHM values for all the measured atomic lines of each star, highlighting with blue color the five RR Lyraes with highest derived Teff values. The mean FWHM values range from 0.33 to 0.43 Å, larger than that which would be generated by a combination of spectrograph, thermal, and microturbulent broadening. We attribute this extra width to a combination of macroturbulent and possible rotational broadening. Upper limits to axial rotation of RRab field stars is estimated to be 5 km s-1 (Preston et al., 2018), These stars, in comparison with the six cooler RR Lyraes, have three common characteristics: far fewer measurable lines ( 13 and 46); larger FWHM values ( 0.40 and 0.35); and phases closer to maximum light ( 0.08, 0.41);
Some variation on the EW procedure was applied for V14. Only one Fe I line is observed in its spectrum, so that it is impossible to estimate the effective temperature as described above. However, a visual inspection of its spectrum clearly shows that the few observable lines are weaker than the counterparts in the other stars, suggesting that this star is the hottest one in the sample. Based on this visual evidence we estimated Teff 7500 K for V14.
We also call attention to star 94180777The star is identified as 94180 in our catalogue of NGC 3201 stars, provided by P. B. Stetson (private communication). SIMBAD online catalogue identifies it as NGC 3201 CWFD 3-327. See Table 1 for more details., the NGC 3201 RHB star observed along with the RR Lyrae sample. Our Fe EW analysis clearly indicated a temperature (Teff = 5600 K) much cooler than the red edge of the RR Lyrae instability strip. Inspection of Figure 5 confirms the EW analysis. This star has the deepest atomic lines, and its H line has weak-to-absent damping wings. The FWHM data for 94180 (Figure 6) are in accord: this star has the largest number of measured lines (81) and the smallest measured line widths ( 0.32) of all of our stars.
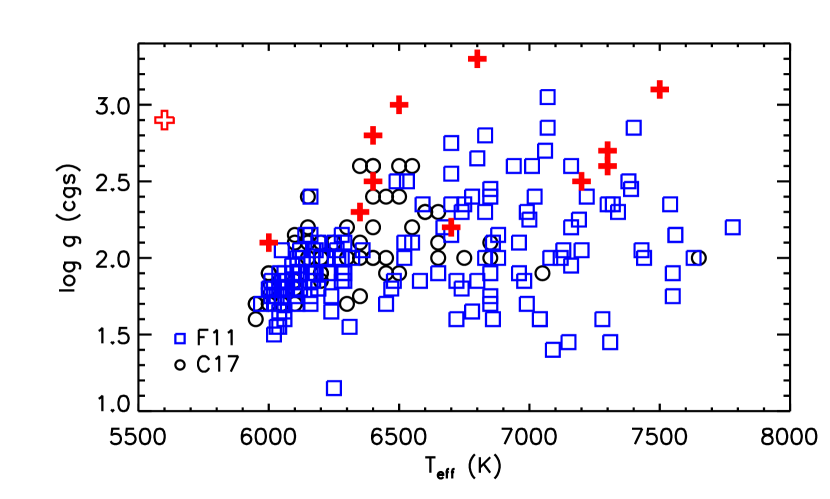
Finally, in Figure 7 we compare estimated effective temperatures and surface gravities of our sample with those from a couple of literature spectroscopic studies of field RR Lyrae stars. Our RRLs appear to have systematically higher gravities than the field RRLs, suggesting the latter to be slightly more evolved than the cluster stars. Moreover, the difference between the RRLs and the RHB star is evident.
We estimated the internal errors in iron abundances associated with changes in the model parameters by varying effective temperature, surface gravity and microturbulence in the line analysis of V41, selected as a representative of the entire cluster. Variations in steps of T=100 K, log =0.3, =0.5 km s-1 were applied, considering them as independent parameters. Results are shown in Table 4. Effective temperature and surface gravity are the main sources of error for Fe I and Fe II abundances, respectively, whereas the impact of microturbulence is on average a factor of two smaller. The total error associated with the parameters (last column in Table 4) is then computed by adding in quadrature the individual errors on the intrinsic parameters. The final estimated Fe I and Fe II abundance uncertainties due to model atmosphere uncertainties are about 0.01 dex for each species.
| Species | Teff | log g | ||
|---|---|---|---|---|
| (100 K) | (0.3 dex) | (0.5 km s-1) | ||
| [FeI/H] | 0.07 | 0.01 | 0.04 | 0.08 |
| [FeII/H] | 0.02 | 0.10 | 0.06 | 0.12 |
A comprehensive abundance analysis cannot leave possible NLTE corrections out of consideration. Several works are available in recent literature dealing with NLTE in RRL stars (Wallerstein & Huang, 2010; Hansen et al., 2011; Andrievsky et al., 2018), but the analysis is far to be complete. Indeed, not all the elements we are dealing with have already been studied. NLTE corrections can affect the abundances up to 0.5 dex (Hansen et al., 2011) but they are strongly dependent on temperature and the details of the calculations. Additionally, the M2FS wavelength coverage limits the number of useful transitions available to make a serious study of NLTE effects. For these reasons, we decided to take into account only LTE effects, obtaining reasonable metallicities and abundance ratios compared with RGB stars (see next sections).
4.1 Iron Metallicity
We estimated the average iron abundance of NGC 3201 to be [Fe/H] = , with a dispersion = 0.14 dex. Table 5 lists the individual iron abundances for the current sample with the intrinsic errors quantifying the line to line variability. Data listed in this table indicate that our mean [Fe/H] estimate is compatible with a homogeneous, mono-metallic cluster. Note that we are dealing with variable stars and once uncertainties in the intrinsic parameters are taken into account, the mono-metallicity of the cluster is further supported.
| ID | [FeI/H] | n | [FeII/H] | n | [Fe/H] | |||
|---|---|---|---|---|---|---|---|---|
| V3 | -1.37 | 0.05 | 16 | -1.36 | 0.03 | 5 | -1.37 | 0.03 |
| V6 | -1.18 | 0.04 | 3 | -1.22 | 1 | -1.19 | 0.03 | |
| V14 | -1.57 | 1 | -1.50 | 0.16 | 2 | -1.53 | 0.09 | |
| V26 | -1.75 | 0.02 | 16 | -1.76 | 0.03 | 5 | -1.75 | 0.02 |
| V37 | -1.49 | 0.06 | 2 | -1.52 | 0.04 | 2 | -1.51 | 0.03 |
| V38 | -1.48 | 0.04 | 18 | -1.49 | 0.04 | 5 | -1.48 | 0.03 |
| V41 | -1.50 | 0.03 | 28 | -1.48 | 0.04 | 6 | -1.50 | 0.03 |
| V47 | -1.60 | 0.03 | 15 | -1.59 | 0.08 | 5 | -1.60 | 0.03 |
| V57 | -1.35 | 0.04 | 20 | -1.36 | 0.05 | 5 | -1.35 | 0.03 |
| V73 | -1.55 | 0.03 | 4 | -1.55 | 0.10 | 2 | -1.55 | 0.03 |
| V83 | -1.48 | 0.08 | 5 | -1.41 | 0.10 | 4 | -1.45 | 0.06 |
| 94180 | -1.33 | 0.03 | 37 | -1.32 | 0.07 | 3 | -1.33 | 0.03 |
| NGC 3201 | -1.47 | 0.04 | -1.46 | 0.04 | -1.47 | 0.04 | ||
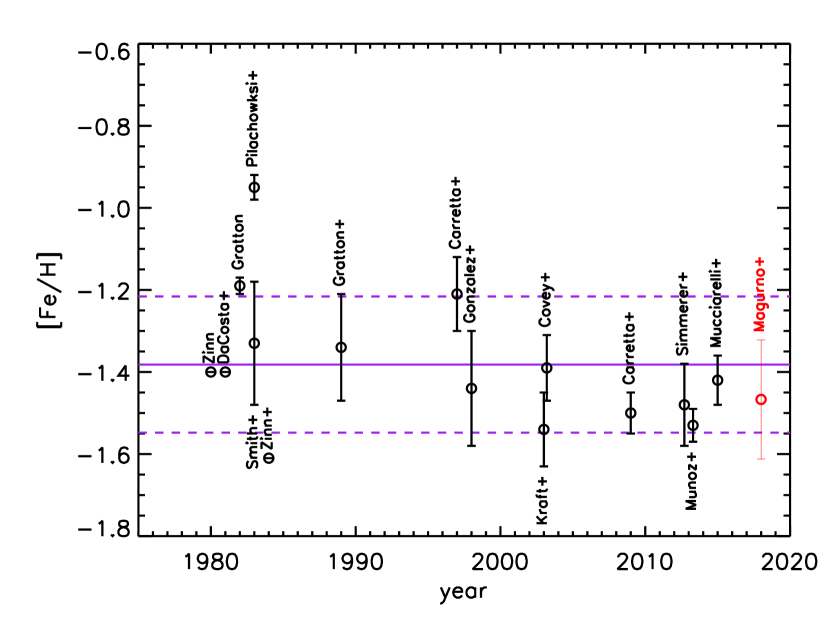
NGC 3201 has been at the cross-road of several spectroscopic investigations in the recent literature (see Table 6 for a detailed list). Figure 8 shows several published iron abundance determinations for NGC 3201, and error bars display the standard deviations () of the different samples. The solid and dashed purple lines show the average and 1 dispersion of the entire sample, compared with our result. The data plotted in the figure show that the bulk of the iron abundances for NGC 3201 do agree within 1.
| [Fe/H] | n | ReferenceaaScaled to Asplund et al. (2009). | ||
|---|---|---|---|---|
| -1.40 | 0.06 | … | … | Zinn (1980) |
| -1.40 | 0.2 | … | 26 | Da Costa et al. (1981) |
| -1.19 | 0.05 | 0.02 | 2 | Gratton (1982) |
| -0.95 | 0.2 | 0.03 | 4 | Pilachowski et al. (1983) |
| -1.33 | 0.05 | 0.15 | 9 | Smith & Manduca (1983) |
| -1.61 | 0.12 | … | … | Zinn & West (1984) |
| -1.34 | 0.05 | 0.13 | 3 | Gratton & Ortolani (1989) |
| -1.21 | 0.05 | 0.09 | 3 | Carretta & Gratton (1997) |
| -1.44 | 0.03 | 0.14 | 18 | Gonzalez & Wallerstein (1998) |
| -1.39 | 0.06 | 0.08 | 5 | Covey et al. (2003) |
| -1.54 | 0.10 | 0.09 | 13 | Kraft & Ivans (2003) |
| -1.50 | 0.02 | 0.05 | 162 | Carretta et al. (2009a) |
| -1.53 | 0.01 | 0.04 | 8 | Muñoz et al. (2013) |
| -1.48 | 0.02 | 0.1 | 26 | Simmerer et al. (2013) |
| -1.42 | 0.02 | 0.06 | 21 | Mucciarelli et al. (2015) |
In particular, the most recent (ten years) estimates further suggest that NGC 3201 is a canonical metal-intermediate globular. Indeed, the average abundance for these recent works is [Fe/H] = , . Differences between the authors reflect their different approaches:
a) The sample sizes vary by two orders of magnitude, from 2 (Gratton, 1982) to 162 (Carretta et al., 2009a) stars, so that the final abundance might not be representative of the entire cluster in some cases.
b) Different techniques are used to estimate the atmospheric parameters. Photometric or spectroscopic estimates of effective temperature and surface gravity are used, based on differential colors or on line intensities. Different techniques can lead to different results even on the same data sample.
c) The cluster metallicity is estimated with different methods, using either spectroscopic or photometric techniques (: Smith & Manduca 1983; : Zinn & West 1984; EW: Gonzalez & Wallerstein 1998).
Most studies generally agree on the average NGC 3201 metallicity, but the possible existence of an intrinsic [Fe/H] spread within the cluster is not settled. The definition of spread can vary among the authors, so here we define as spread the standard deviation of the sample. Smith & Manduca (1983), Kraft & Ivans (2003) and Muñoz et al. (2013) found no evidence of variation in the iron content of the cluster. Carretta et al. (2009a) analysed the largest sample of stars (162) in NGC 3201, and also found an internal metallicity spread of only 0.05 dex. On the other hand, Gonzalez & Wallerstein (1998) and Simmerer et al. (2013) reported an internal [Fe/H] spread in NGC 3201 of 0.14 and 0.1 dex respectively, with a difference as large as 0.4 dex between the highest and the lowest metallicities of the cluster members. Their abundance analyses were based on large samples of cluster members (18 and 26 stars). However, different authors using the same spectra obtained different conclusions about the metallicity spread in NGC 3201. Covey et al. (2003) analysed a sub-sample of the Gonzalez & Wallerstein (1998) spectra, supporting a spread in iron of 0.14 dex when estimating the effective temperatures using spectroscopic diagnostics. However, the spread in iron decreased to 0.08 dex when Teff values were estimated with photometric diagnostics. A similar result was also obtained by Mucciarelli et al. (2015) using the Simmerer et al. (2013) spectra. Covey et al. and Mucciarelli et al. suggested that the spread in iron abundance shows up in spectroscopic analyses that do not properly take account for non-LTE effects.
The star-to-star scatter derived in our LTE analysis of NGC 3201 RR Lyrae stars is small, 0.14, and is in accord with prior publications that assert that this cluster is mono-metallic.
4.2 -elements: Mg, Ca, Ti
The restricted wavelength coverage of our M2FS spectra limited the number of transitions for true -elements to one each for Mg I and Ca I (Tables 3 and 7), not allowing a detailed analysis of these two elements. Although Ti is not a “pure” -element, because its dominant isotope is 48Ti instead of 44Ti, we included it in this group because its abundance at low metallicity usually mimics those of other -elements. We measured up to 17 Ti I and Ti II lines per spectrum in the best cases, so Ti abundances are the most precise among the three . The mean estimated abundances are: [Mg/Fe]=0.130.05, [Ca/Fe]=0.150.07 and [Ti/Fe]=0.460.04 (Table 7).
| ID | [Mg/Fe] | n | [Ca/Fe] | n | [Ti/Fe] | n | [/Fe] | ||
|---|---|---|---|---|---|---|---|---|---|
| V3 | 0.09 | 1 | 0.34 | 0.07 | 10 | ||||
| V6 | -0.09 | 1 | -0.13 | 1 | 0.61 | 0.18 | 2 | 0.25 | 0.27 |
| V14 | 0.76 | 0.12 | 2 | ||||||
| V26 | 0.20 | 1 | 0.27 | 1 | 0.43 | 0.04 | 13 | 0.40 | 0.10 |
| V37 | 0.15 | 1 | 0.35 | 0.08 | 4 | ||||
| V38 | 0.24 | 1 | 0.14 | 1 | 0.35 | 0.03 | 9 | 0.32 | 0.06 |
| V41 | 0.09 | 1 | 0.22 | 1 | 0.39 | 0.03 | 16 | 0.37 | 0.09 |
| V47 | 0.31 | 1 | 0.11 | 1 | 0.26 | 0.02 | 7 | 0.25 | 0.04 |
| V57 | 0.13 | 1 | 0.01 | 1 | 0.60 | 0.04 | 12 | 0.54 | 0.13 |
| V73 | 0.30 | 1 | 0.49 | 0.04 | 5 | ||||
| V83 | 0.22 | 1 | 0.49 | 0.11 | 5 | ||||
| 94180 | -0.19 | 1 | 0.45 | 1 | 0.46 | 0.08 | 17 | 0.43 | 0.20 |
| NGC 3201 | 0.13 0.05 | 0.15 0.07 | 0.46 | 0.04 | 0.37 | 0.04 | |||
To further investigate the -element abundances of NGC 3201 in the context of Galactic globulars, Figure 9 shows the comparison with measurements available in the literature (Pritzl et al. 2005; Carretta et al. 2009b, 2010, re-scaled to the solar abundances of Asplund et al. 2009). We performed a linear fit over the individual -element abundances versus the iron content, in the range of metal–intermediate globulars ( [Fe/H] ), to define the dispersion of the sample in the neighbourhood of NGC 3201. In the context of Galactic globulars, Ti abundance agrees quite well within the dispersion (0.10 dex), whereas Mg and Ca, that have respectively the highest (0.13 dex) and the lowest (0.06 dex) dispersion, are located in the lower envelope of the observed abundance distribution, but still within 1.
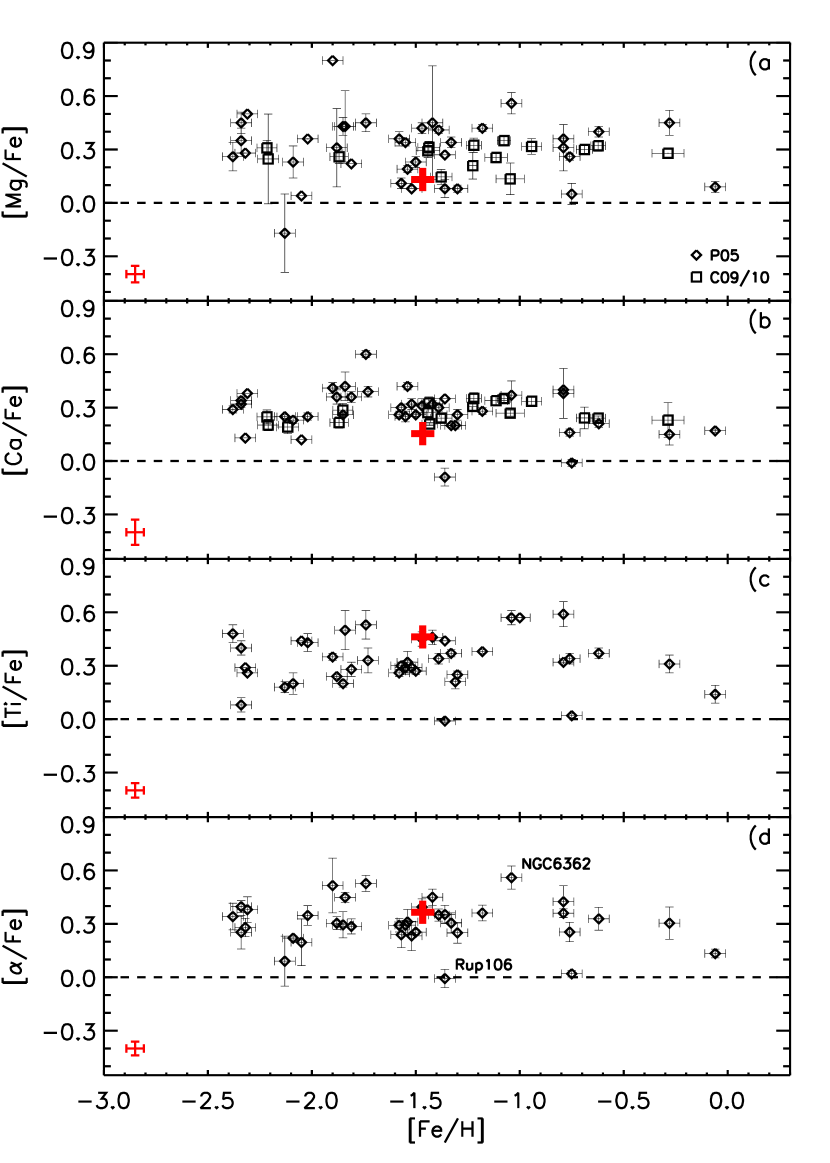
The total abundance of -elements (panel d in Figure 9) was estimated as the biweight mean of the abundances, with respect to iron, for the three individual elements. Biweight is a resistant and robust estimator of location, more insensitive to outliers than a simple mean or median thanks to an iterative process (more details in Beers et al. 1990). To perform a solid comparison with similar estimates available in the literature we only included the sample stars for which we were able to measure the three quoted -elements. We ended up with seven stars and we found [/Fe]=0.370.04 (see Table 7). On the other hand, if we estimate the biweight mean of the -elements either as Ca+Ti or as Mg+Ti we end up with [/Fe]=0.400.04 and [/Fe]=0.390.03, respectively, thus suggesting very similar enhancements. The comparison of the mean -element abundance based on three elements is well in agreement with similar abundances for Galactic globular clusters available in the literature (see Figure 9). Indeed, the mean -element abundances for metal–intermediate globulars ( [Fe/H] ) range from 0.23 (NGC 6205/M13, NGC 6254/M10) to 0.45 dex (NGC 1904/M79), with a dispersion of 0.06 dex888We neglected the two extreme clusters Rup 106 ([Fe/H]=, [/Fe]0) and NGC 6362 ([Fe/H]=, [/Fe]0.56). Solid evidence based on metallicity distribution and on the absolute age suggest that the former one was accreted (Villanova et al., 2013). The -elements abundance of the latter is only based on two stars (Gratton, 1987). However, more recent estimates based on a larger sample (Massari et al., 2017) suggest [Fe/H]= and [/Fe]=0.37 for NGC 6362, similar to the other metal-intermediate globulars..
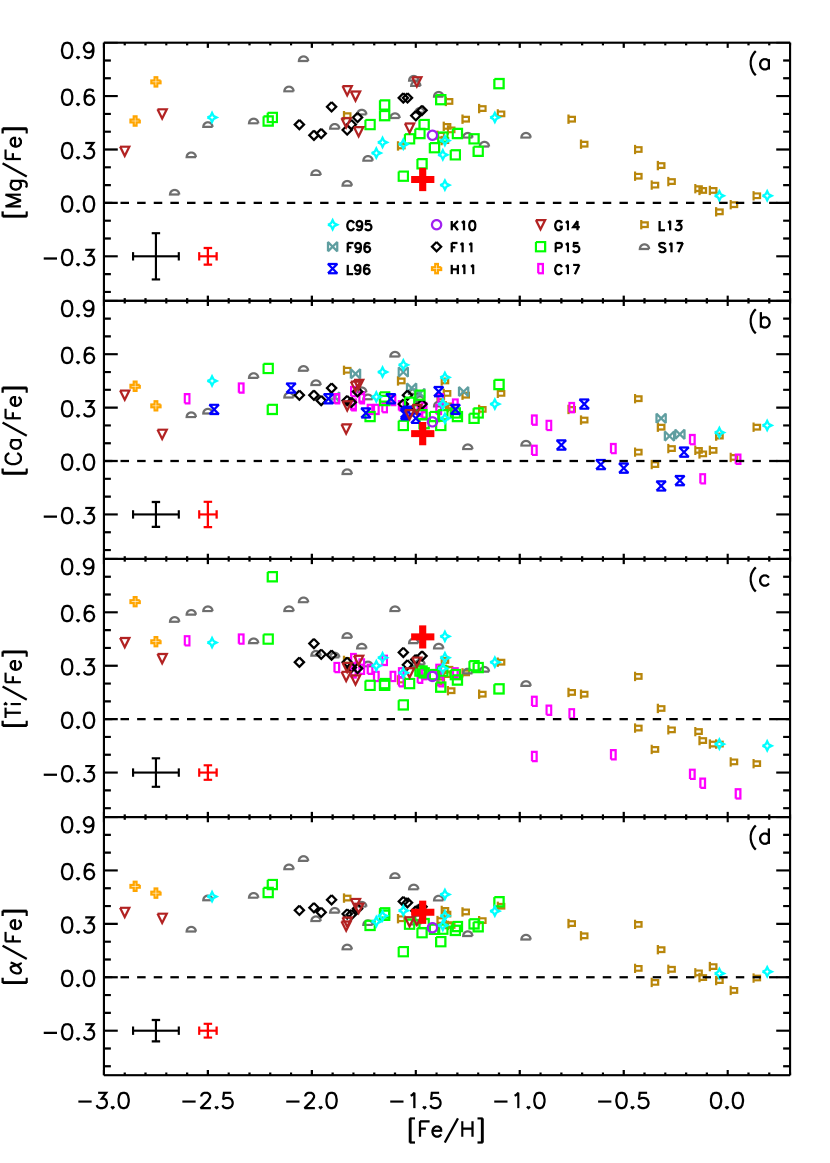
To further investigate the possible differences between field and cluster RR Lyrae we compared the current -elements abundances with similar ones for field RR Lyrae. Figure 10 shows the comparison with 147 field RRLs (96 objects) for which the abundances are based on high resolution spectra. They are marked with different symbols and colors and they have been re-scaled to the same solar abundances (Asplund et al., 2009). We selected the stars in common among the different spectroscopic samples to estimate the standard deviation in iron and -element abundances as representative of the individual star errors (see the black error bars plotted in the bottom left corners of the figure). The range in iron abundance covered by field RRLs is similar to the globular iron abundances, with a slight overdensity of stars in the metal-intermediate range ( [Fe/H] ). We found that Mg is confirmed to have the highest dispersion (0.14 dex). As for globulars, our results for NGC 3201 show a limited enhancement of Mg compared with RRLs of similar iron content. The other two -elements (Ca, Ti) have smaller standard deviations, both 0.08 dex. The Ca abundance is once again slightly under-enhanced, but within the intrinsic dispersion. On the other hand, the Ti abundance of RRLs in NGC 3201 seems to be, at fixed iron content, over-enhanced when compared with field RRLs. The under– and over– enhancements of Mg–Ca and Ti mostly balance each other when considering the [/Fe] ratios, so that NGC 3201 is in agreement with field RRLs of similar iron content, as showed in the panel d) of Figure 10.
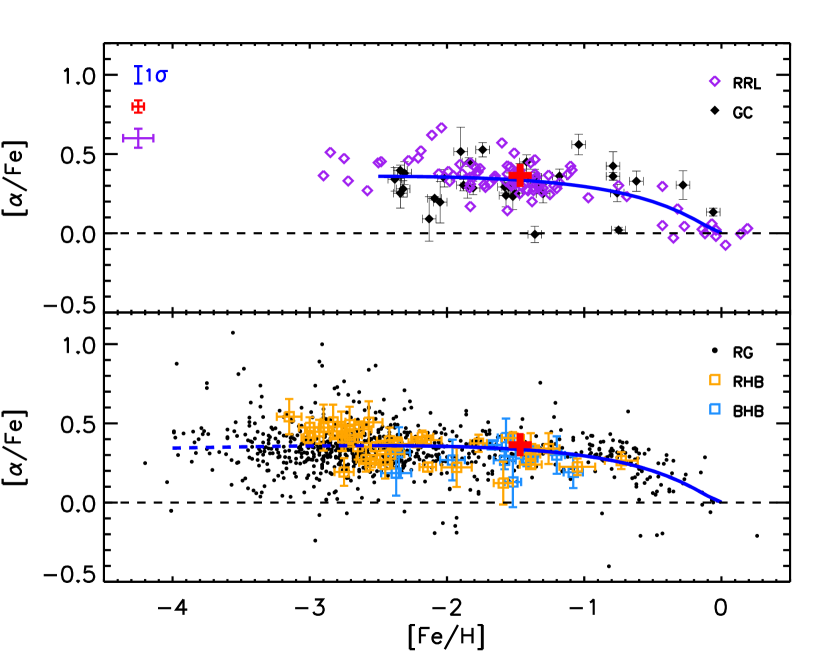
To constrain on a more quantitative basis the comparison between field and cluster RR Lyrae with field Halo stars we performed an analytical fit of [/Fe] vs [Fe/H] for both field RRLs and Galactic globulars. Note that, for these two sub-samples, we have solid reasons to believe that their age is similar and 10 Gyrs. The fit was performed over the range in metallicity [Fe/H] , since the sampling of the more metal-poor regime is limited. We adopted a log-normal distribution and we found
| (1) |
with
| (2) |
where (scale height), representing the [/Fe] abundance for very metal poor ([Fe/H]2) stars, (asymmetry)=, [Fe/H]0= and =8.98116. The top panel of Figure 11 shows the analytical fit (blue line), together with the quoted sub-samples. The bottom panel of the same figure shows the comparison of the quoted analytical fit, extrapolated down to [Fe/H]=4 (dashed blue line), with the mean [/Fe] abundance for NGC 3201 (red cross), the kinematically selected field Halo giants (black dots) collected by Frebel (2010) and field Halo blue (blue squares, BHB) and red (orange squares, RHB) HB stars collected by For & Sneden (2010). Interestingly enough, the different samples do agree within 1, thus suggesting a very similar chemical enrichment history even though they cover different ranges in iron content and in Galactocentric distances. This finding further supports a common old (t 10 Gyr) age for field RG and HB stars.
4.3 Iron peak elements: Sc, Cr, Ni, Zn
Iron peak elements are defined as those with Z=21–30. We measured spectral lines of four iron peak elements: Sc, Cr, Ni, Zn (see Table 8 for details). Chromium is the most represented element in our sample, since it was measured in eleven out of twelve stars, with up to ten lines in the RHB star. The other three elements (Sc, Ni, Zn) were observed in only a half of the current sample with a limited number of lines. Our derived mean abundances are [Sc/Fe]=, [Cr/Fe]=, [Ni/Fe]= and [Zn/Fe]=.
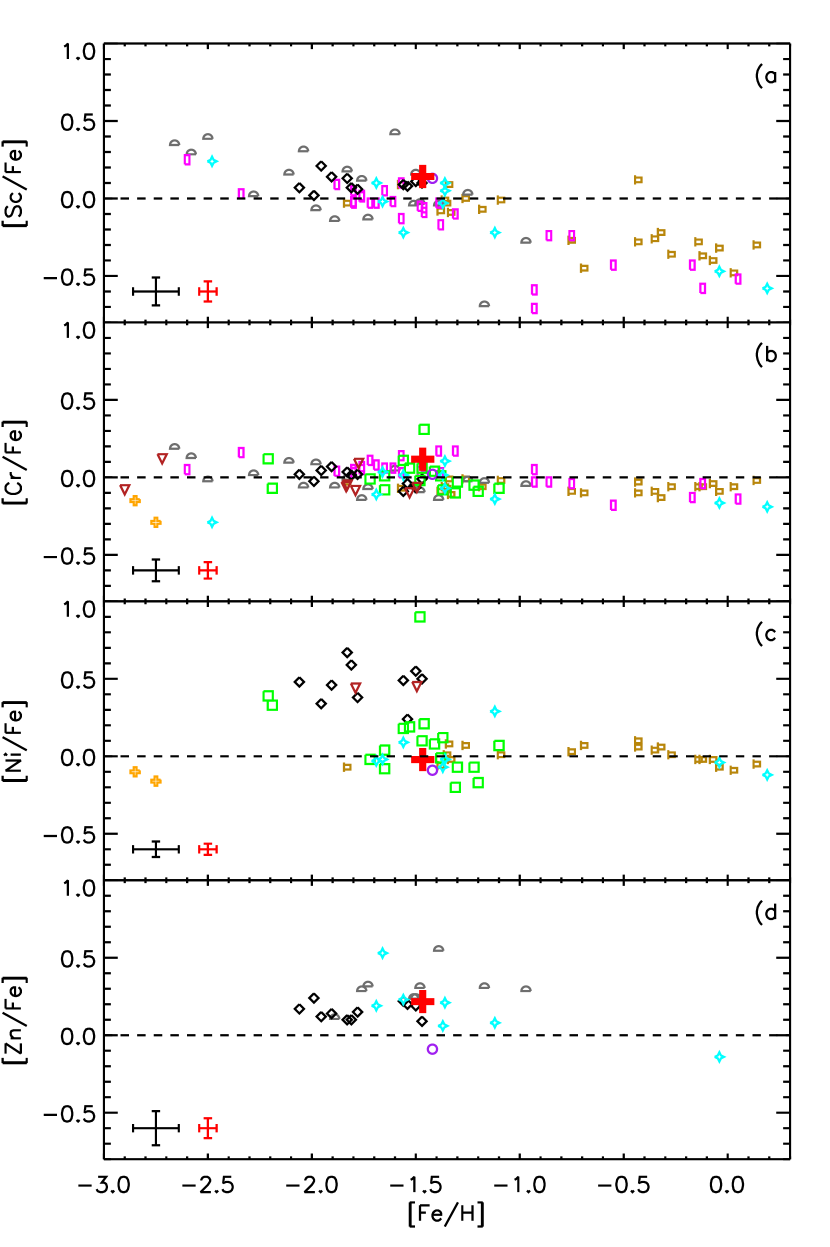
Figure 12 shows these abundances and those for field Halo RRLs. The Fe-group abundance ratios in NGC 3201 generally agree with those of the other RRLs. Nickel abundances deserve some comment. Our [Ni/Fe] values agree with most of the previous studies, but the abundances by For et al. (2011) and by Govea et al. (2014) appear to be enhanced by 0.5 dex. For et al. (2011) noted that the phase to phase scatter in Ni abundances, for which they only measured a couple of lines, should be treated with caution. This scatter can be seen in their Figures 23 and 26. Govea et al. (2014) measured only one Ni line and in a single phase for each star, so their estimates have larger uncertainties. We conclude that our Fe-group abundances are in agreement with other stellar samples in this metallicity regime.
| ID | [Sc/Fe] | n | [Cr/Fe] | n | [Ni/Fe] | n | [Zn/Fe] | n | ||||
|---|---|---|---|---|---|---|---|---|---|---|---|---|
| V3 | 0.06 | 0.14 | 3 | -0.04 | 0.11 | 2 | 0.42 | 1 | ||||
| V6 | 0.47 | 1 | ||||||||||
| V14 | 0.27 | 1 | ||||||||||
| V26 | 0.20 | 0.02 | 2 | 0.19 | 0.02 | 5 | -0.06 | 0.12 | 2 | 0.35 | 0.08 | 2 |
| V37 | 0.12 | 0.00 | 2 | 0.20 | 1 | |||||||
| V38 | -0.04 | 0.16 | 2 | -0.05 | 0.11 | 3 | -0.10 | 0.07 | 2 | 0.19 | 1 | |
| V41 | 0.15 | 0.11 | 3 | 0.00 | 0.02 | 5 | -0.11 | 0.09 | 2 | 0.23 | 0.06 | 2 |
| V47 | 0.05 | 1 | -0.15 | 0.10 | 2 | 0.17 | 1 | |||||
| V57 | 0.21 | 0.10 | 2 | 0.02 | 0.02 | 2 | 0.04 | 1 | 0.13 | 1 | ||
| V73 | -0.17 | 1 | ||||||||||
| V83 | 0.53 | 1 | 0.25 | 0.13 | 3 | |||||||
| 94180 | 0.23 | 0.04 | 2 | 0.04 | 0.05 | 9 | -0.04 | 0.04 | 5 | -0.02 | 0.12 | 2 |
| NGC 3201 | 0.14 | 0.06 | 0.12 | 0.05 | -0.02 | 0.04 | 0.22 | 0.06 | ||||
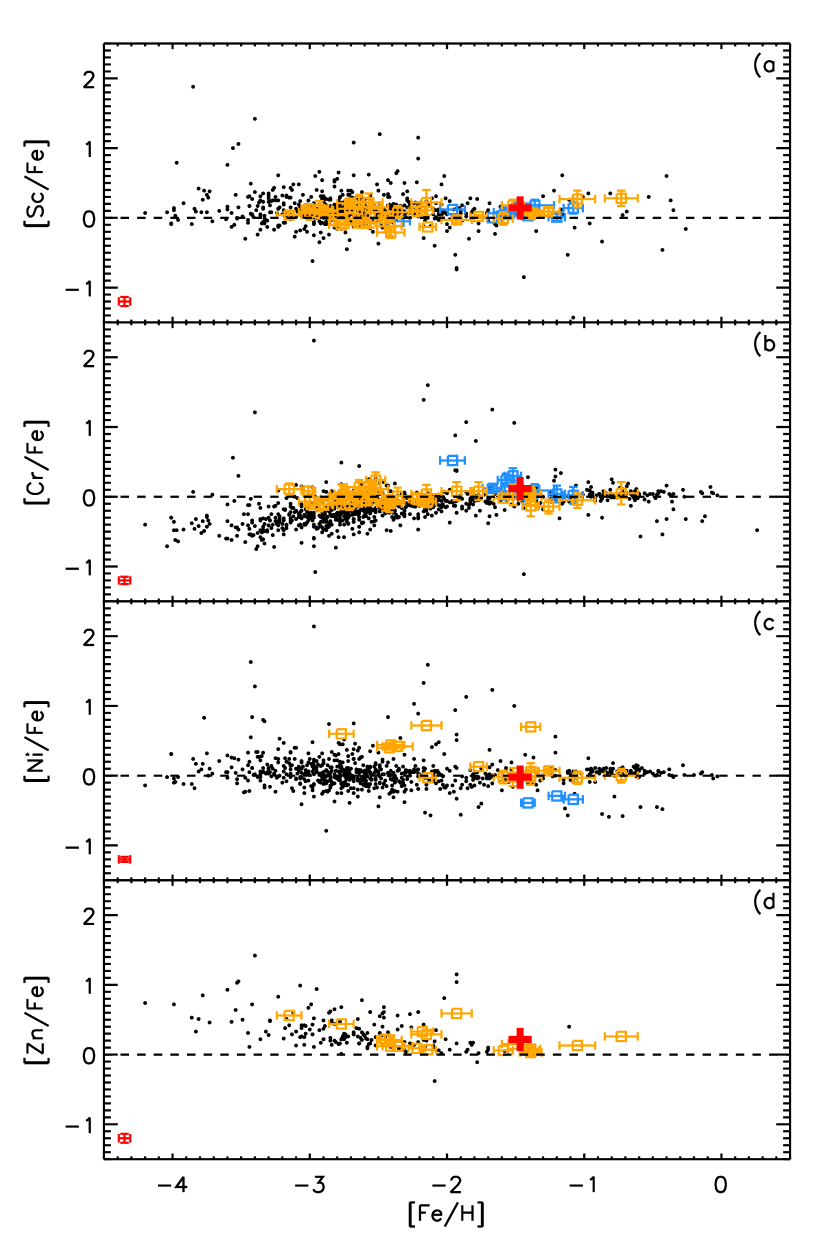
In Figure 13 we show our Fe-group abundances and those of field Halo giants collected by Frebel (2010) and Halo RHB–BHB stars by For & Sneden (2010). All the elements in NGC 3201 are in good agreement with other stars in the intermediate metallicity regime. This suggests once again that field Halo RGs, field HBs (RHB, RRL, BHB) and globular clusters share similar chemical enrichments.
4.4 s-process element: Yttrium
The slow neutron-capture process (-process), in which timescales for capture of free neutrons are longer than timescales of -decays, has dominated the production of yttrium in solar-system material. However, the -process fractional dominance over the -process (rapid neutron-capture) that produced solar Y is still an open question. Simmerer et al. (2004) estimated a fraction of 72%, whereas Arlandini et al. (1999) estimated much higher values of 92–100%.
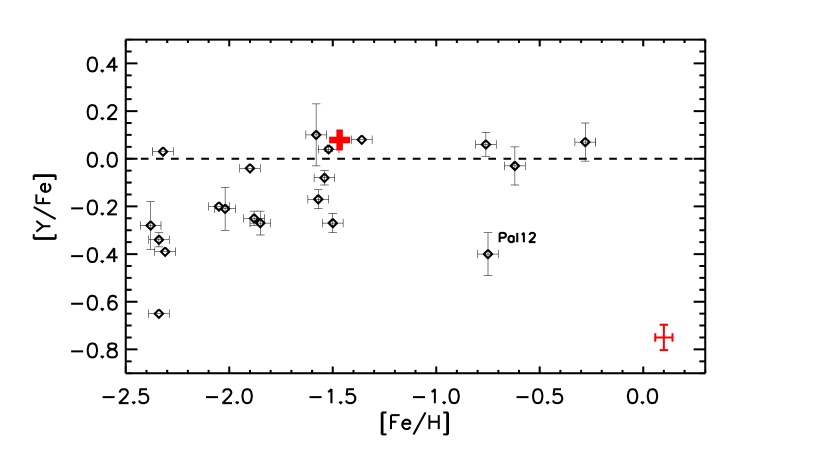
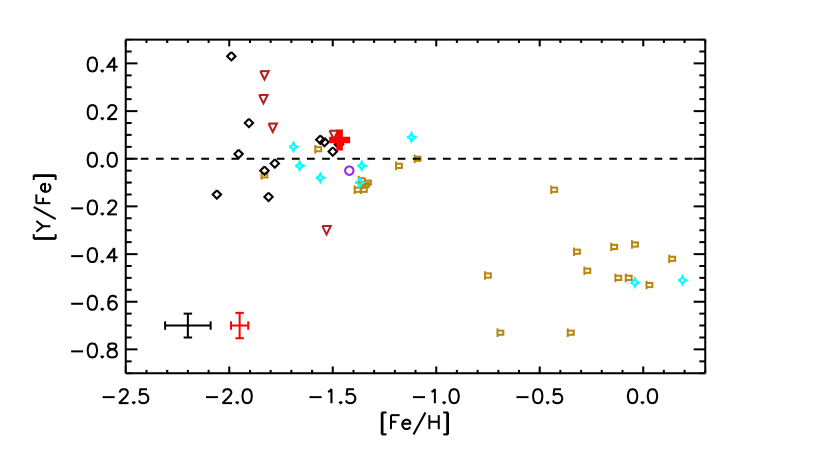
Within the M2FS spectral range, we identified five potentially useful Y II lines, and measured up to four EWs in nine out of our twelve stars (see Table 9). From these we estimated an average abundance for NGC 3201 of [Y/Fe]=0.080.05. Figure 14 shows the comparison of this result and average Y abundances of other Galactic globulars (Pritzl et al., 2005). The cluster-to-cluster scatter in [Y/Fe] appears to be large, but this could simply reflect study-to-study differences in the Pritzl et al. (2005) compilation. Relatively metal rich clusters show a small dispersion and an average [Y/Fe] abundance close to solar, with the exception of the outer Halo cluster Pal 12. The peculiarity of this cluster is not surprising, since there are photometric and spectroscopic reasons to believe that Pal 12 is an accreted cluster (Musella et al., 2018, and references therein). Clusters with [Fe/H] 1.8 often exhibit sub-solar [Y/Fe] values, but the scatter is still large. Field Halo RRLs yield similar [Y/Fe] results in the metal-intermediate ( [Fe/H] ) regime (Figure 15). Comparison of the data for globular clusters and field stars shows mostly that a future study is needed to bring coherence to [Y/Fe] abundance trends with metallicity.
| ID | [Y/Fe] | n | |
|---|---|---|---|
| V3 | -0.01 | 0.15 | 2 |
| V6 | |||
| V14 | 0.28 | 0.10 | 2 |
| V26 | 0.24 | 0.01 | 2 |
| V37 | |||
| V38 | -0.14 | 0.09 | 2 |
| V41 | 0.04 | 0.06 | 4 |
| V47 | -0.17 | 0.07 | 2 |
| V57 | 0.15 | 0.11 | 2 |
| V73 | 0.15 | 0.04 | 2 |
| V83 | |||
| 94180 | 0.17 | 0.14 | 3 |
| NGC 3201 | 0.08 | 0.05 | |
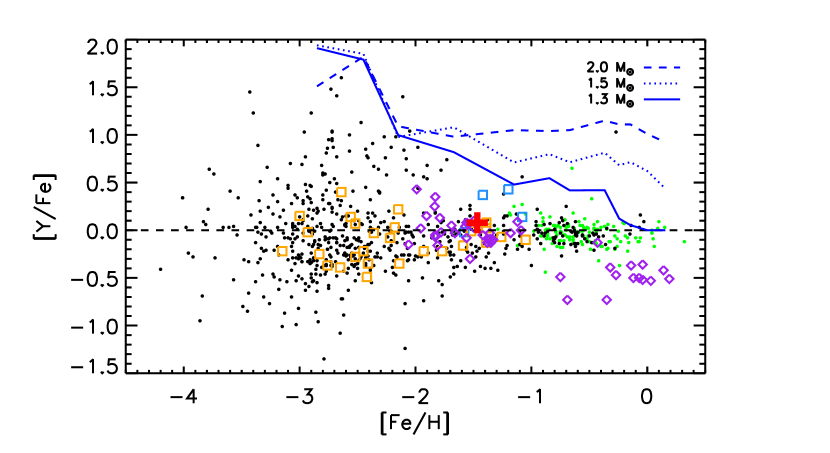
Of special interest is the behavior of [Y/Fe] in the metal-rich ([Fe/H] ) regime. Field RRLs shows a severe depletion of Y ([Y/Fe]=; Figure 15), but ones in clusters do not (Figure 14). The metal-rich RRLs mainly come from the dataset collected by Liu et al. (2013), with the exception of two stars provided by Clementini et al. (1995). The two stars by Clementini et al. are also in the dataset by Liu et al., with very similar derived abundances, excluding the possibility of systematics in one of the two samples. Considerations about their radial velocities suggest that these RRLs are candidate members of the Galactic disk, not the Halo (Liu et al. 2013). To further investigate RRLs in the metal-rich regime, we compared their abundances with Halo stars. In Figure 16 we plot [Y/Fe] ratios versus metallicity for various samples of stars. In the metal-poor domain ([Fe/H] ), the field RRLs show agreement, on average, with other field Halo stars, namely RG and HB stars. On the contrary, the metal rich ([Fe/H]) tail of RRLs is clearly depleted in Y when compared with slightly more metal-poor ([Fe/H]) field Halo stars and with Disk dwarfs of similar metallicities (Reddy et al., 2006). These results, coupled with the radial velocity considerations by Liu et al. (2013), suggest that they may be candidate Bulge members.
In Figure 16 we also include [Y/Fe] predicted trends from evolutionary prescriptions based on Asymptotic Giant Branch models available on the FRUITY999 http://fruity.oa-teramo.inaf.it/ database (Cristallo et al., 2011, 2015). Blue lines in the figure show predicted values for three different stellar masses (see labelled values). Unfortunately, for masses 1.1 M⊙, as the RRLs have, the accounted models are not available because they do not experience the third dredge up and, therefore, do not show a significant chemical enrichment of the environment. However, the theoretical predictions for the less massive available stars show a rapid decrease in Y abundance for [Fe/H], suggesting that we are moving in the right direction.
5 Conclusion and final remarks
We performed the first high resolution, high SNR, large spectroscopic investigation of RRLs in NGC 3201. Our independent analysis confirmed many previous results on the cluster using non-variable stars. Our derived average metallicity of the cluster, [Fe/H]=, is in general accord with recent studies, and we confirm that NGC 3201 is a homogeneous, mono-metallic cluster.
A limited dispersion was also observed for three different groups of elements: the light -elements Mg–Ca–Ti, the iron peak elements Sc–Cr–Ni–Zn and the s-process element Y. The -elements were found to be enhanced with respect to the Sun, as expected for old (t10 Gyr) stellar structures, with abundances comparable to other known globular clusters and field stars of similar metallicity. In particular, the agreement was found not only with HB stars (RHB, RRL, BHB) as the ones in our sample, but in general with variable and non-variable field Halo stars. We found [Mg/Fe]=0.130.05, [Ca/Fe]=0.150.07 and [Ti/Fe]=0.460.04. The same homogeneity was observed for the iron peak and s-process elements, whose abundance ratios are close to solar and similar to other metal-intermediate ( [Fe/H] ) globulars and field Halo stars. These results suggests similar enrichment histories for all the analysed Halo components with similar metallicity to NGC 3201.
The cluster radial velocity was estimated as 49428 km s-1, where the two errors are the error on the mean and the standard deviation, respectively. The use of a template to obtain a radial velocity curve from a single epoch velocity measurement of a RRL star is a very promising approach. However, to obtain more precise results it is necessary a good photometric dataset, almost coeval to the spectroscopic data. The goodness of this approach is further supported by the homogeneity of the average template velocities of the RRLs in our sample and the non-variable star instantaneous velocity.
The results obtained with this work on NGC 3201 strongly supports the capabilities of M2FS at Magellan as a high quality instrument for abundance investigations, even in crowded fields such as a globular cluster. This work on NGC 3201 is opening the path to a forthcoming analysis on the more complex Globular cluster Cen, which is known to have an intrinsic metallicity spread, for which we already collected M2FS spectra of 140 RRLs.
| ID | [Fe/H] | [Mg/Fe] | [Ca/Fe] | [Ti/Fe] | Reference |
|---|---|---|---|---|---|
| AA Aql | -0.32 | 0.21 | 0.19 | 0.06 | L13 |
| AE Dra | -1.46 | 0.44 | 0.21 | 0.26 | P15 |
| AN Ser | 0.05 | 0.01 | -0.42 | C17 | |
| AO Peg | -1.26 | 0.47 | 0.37 | 0.26 | L13 |
| AR Per | -0.23 | -0.11 | L96 | ||
| AR Per | -0.28 | 0.14 | F96 | ||
| AR Per | -0.29 | A18 | |||
| AS Vir | -1.57 | 0.31 | 0.21 | C17 |
| ID | [Sc/Fe] | [Cr/Fe] | [Ni/Fe] | [Zn/Fe] | [Y/Fe] | Reference |
|---|---|---|---|---|---|---|
| AA Aql | -0.22 | -0.13 | 0.06 | -0.39 | L13 | |
| AE Dra | 0.31 | 0.21 | P15 | |||
| AN Ser | -0.52 | -0.14 | C17 | |||
| AO Peg | 0.00 | -0.01 | 0.07 | L13 | ||
| AS Vir | -0.13 | 0.14 | C17 | |||
| AS Vir | 0.06 | 0.02 | 0.38 | 0.15 | -0.02 | F11 |
| ASAS J081933-2358.2 | -0.08 | G14 | ||||
| ASAS J085254-0300.3 | 0.17 | -0.05 | 0.25 | S17 |
References
- Adamow (2017) Adamow, M. M. 2017, in American Astronomical Society Meeting Abstracts, Vol. 230, American Astronomical Society Meeting Abstracts #230, 216.07
- Andrievsky et al. (2018) Andrievsky, S., Wallerstein, G., Korotin, S., et al. 2018, PASP, 130, 024201, doi: 10.1088/1538-3873/aa9783
- Arlandini et al. (1999) Arlandini, C., Käppeler, F., Wisshak, K., et al. 1999, ApJ, 525, 886, doi: 10.1086/307938
- Asplund et al. (2009) Asplund, M., Grevesse, N., Sauval, A. J., & Scott, P. 2009, ARA&A, 47, 481, doi: 10.1146/annurev.astro.46.060407.145222
- Baade (1958) Baade, W. 1958, AJ, 63, 207, doi: 10.1086/107726
- Baade & Swope (1955) Baade, W., & Swope, H. H. 1955, AJ, 60, 151, doi: 10.1086/107146
- Beers et al. (1990) Beers, T. C., Flynn, K., & Gebhardt, K. 1990, AJ, 100, 32, doi: 10.1086/115487
- Belmonte et al. (2017) Belmonte, M. T., Pickering, J. C., Ruffoni, M. P., et al. 2017, ApJ, 848, 125, doi: 10.3847/1538-4357/aa8cd3
- Benkő et al. (2014) Benkő, J. M., Plachy, E., Szabó, R., Molnár, L., & Kolláth, Z. 2014, ApJS, 213, 31, doi: 10.1088/0067-0049/213/2/31
- Bono et al. (2003) Bono, G., Caputo, F., Castellani, V., et al. 2003, MNRAS, 344, 1097, doi: 10.1046/j.1365-8711.2003.06878.x
- Bono et al. (2007) Bono, G., Caputo, F., & Di Criscienzo, M. 2007, A&A, 476, 779, doi: 10.1051/0004-6361:20078206
- Bono et al. (1994) Bono, G., Caputo, F., & Stellingwerf, R. F. 1994, ApJ, 432, L51, doi: 10.1086/187509
- Bono & Stellingwerf (1994) Bono, G., & Stellingwerf, R. F. 1994, ApJS, 93, 233, doi: 10.1086/192054
- Braga et al. (2015) Braga, V. F., Dall’Ora, M., Bono, G., et al. 2015, ApJ, 799, 165, doi: 10.1088/0004-637X/799/2/165
- Braga et al. (2018) Braga, V. F., Stetson, P. B., Bono, G., et al. 2018, AJ, 155, 137, doi: 10.3847/1538-3881/aaadab
- Buchler & Kolláth (2011) Buchler, J. R., & Kolláth, Z. 2011, ApJ, 731, 24, doi: 10.1088/0004-637X/731/1/24
- Caputo (1997) Caputo, F. 1997, MNRAS, 284, 994
- Carretta et al. (2009a) Carretta, E., Bragaglia, A., Gratton, R., D’Orazi, V., & Lucatello, S. 2009a, A&A, 508, 695, doi: 10.1051/0004-6361/200913003
- Carretta et al. (2009b) Carretta, E., Bragaglia, A., Gratton, R., & Lucatello, S. 2009b, A&A, 505, 139, doi: 10.1051/0004-6361/200912097
- Carretta et al. (2010) Carretta, E., Bragaglia, A., Gratton, R., et al. 2010, ApJ, 712, L21, doi: 10.1088/2041-8205/712/1/L21
- Carretta & Gratton (1997) Carretta, E., & Gratton, R. G. 1997, A&AS, 121, 95, doi: 10.1051/aas:1997116
- Castelli & Kurucz (2003) Castelli, F., & Kurucz, R. L. 2003, in IAU Symposium, Vol. 210, Modelling of Stellar Atmospheres, ed. N. Piskunov, W. W. Weiss, & D. F. Gray, A20
- Chadid et al. (2017) Chadid, M., Sneden, C., & Preston, G. W. 2017, ApJ, 835, 187, doi: 10.3847/1538-4357/835/2/187
- Clementini et al. (1995) Clementini, G., Carretta, E., Gratton, R., et al. 1995, AJ, 110, 2319, doi: 10.1086/117692
- Clementini et al. (2001) Clementini, G., Federici, L., Corsi, C., et al. 2001, ApJ, 559, L109, doi: 10.1086/323973
- Coppola et al. (2013) Coppola, G., Stetson, P. B., Marconi, M., et al. 2013, ApJ, 775, 6, doi: 10.1088/0004-637X/775/1/6
- Covey et al. (2003) Covey, K. R., Wallerstein, G., Gonzalez, G., Vanture, A. D., & Suntzeff, N. B. 2003, PASP, 115, 819, doi: 10.1086/376394
- Cristallo et al. (2015) Cristallo, S., Straniero, O., Piersanti, L., & Gobrecht, D. 2015, ApJS, 219, 40, doi: 10.1088/0067-0049/219/2/40
- Cristallo et al. (2011) Cristallo, S., Piersanti, L., Straniero, O., et al. 2011, ApJS, 197, 17, doi: 10.1088/0067-0049/197/2/17
- Da Costa et al. (1981) Da Costa, G. S., Frogel, J. A., & Cohen, J. G. 1981, ApJ, 248, 612, doi: 10.1086/159187
- Da Costa et al. (2010) Da Costa, G. S., Rejkuba, M., Jerjen, H., & Grebel, E. K. 2010, ApJ, 708, L121, doi: 10.1088/2041-8205/708/2/L121
- Den Hartog et al. (2014) Den Hartog, E. A., Ruffoni, M. P., Lawler, J. E., et al. 2014, ApJS, 215, 23, doi: 10.1088/0067-0049/215/2/23
- Drake et al. (2013) Drake, A. J., Catelan, M., Djorgovski, S. G., et al. 2013, ApJ, 763, 32, doi: 10.1088/0004-637X/763/1/32
- Fernley & Barnes (1996) Fernley, J., & Barnes, T. G. 1996, A&A, 312, 957
- Ferraro et al. (2018) Ferraro, F. R., Mucciarelli, A., Lanzoni, B., et al. 2018, ApJ, 860, 50, doi: 10.3847/1538-4357/aabe2f
- Fiorentino et al. (2015) Fiorentino, G., Bono, G., Monelli, M., et al. 2015, ApJ, 798, L12, doi: 10.1088/2041-8205/798/1/L12
- For & Sneden (2010) For, B.-Q., & Sneden, C. 2010, AJ, 140, 1694, doi: 10.1088/0004-6256/140/6/1694
- For et al. (2011) For, B.-Q., Sneden, C., & Preston, G. W. 2011, ApJS, 197, 29, doi: 10.1088/0067-0049/197/2/29
- Frebel (2010) Frebel, A. 2010, Astronomische Nachrichten, 331, 474, doi: 10.1002/asna.201011362
- Gonzalez & Wallerstein (1998) Gonzalez, G., & Wallerstein, G. 1998, AJ, 116, 765, doi: 10.1086/300476
- Govea et al. (2014) Govea, J., Gomez, T., Preston, G. W., & Sneden, C. 2014, ApJ, 782, 59, doi: 10.1088/0004-637X/782/2/59
- Gratton (1982) Gratton, R. G. 1982, A&A, 115, 171
- Gratton (1987) —. 1987, A&A, 179, 181
- Gratton & Ortolani (1989) Gratton, R. G., & Ortolani, S. 1989, A&A, 211, 41
- Hansen et al. (2011) Hansen, C. J., Nordström, B., Bonifacio, P., et al. 2011, A&A, 527, A65, doi: 10.1051/0004-6361/201015076
- Jayasinghe et al. (2018) Jayasinghe, T., Kochanek, C. S., Stanek, K. Z., et al. 2018, MNRAS, 477, 3145, doi: 10.1093/mnras/sty838
- Jurcsik et al. (2009) Jurcsik, J., Sódor, Á., Szeidl, B., et al. 2009, MNRAS, 400, 1006, doi: 10.1111/j.1365-2966.2009.15515.x
- Kolenberg et al. (2010a) Kolenberg, K., Fossati, L., Shulyak, D., et al. 2010a, A&A, 519, A64, doi: 10.1051/0004-6361/201014471
- Kolenberg et al. (2010b) Kolenberg, K., Szabó, R., Kurtz, D. W., et al. 2010b, ApJ, 713, L198, doi: 10.1088/2041-8205/713/2/L198
- Kraft & Ivans (2003) Kraft, R. P., & Ivans, I. I. 2003, PASP, 115, 143, doi: 10.1086/345914
- Kramida et al. (2018) Kramida, A., Yu. Ralchenko, Reader, J., & and NIST ASD Team. 2018, 5.5.3, NIST Atomic Spectra Database, [Online]. Available: https://physics.nist.gov/asd [2018, March 26]. National Institute of Standards and Technology, Gaithersburg, MD.
- Lambert et al. (1996) Lambert, D. L., Heath, J. E., Lemke, M., & Drake, J. 1996, ApJS, 103, 183, doi: 10.1086/192274
- Lawler et al. (2013) Lawler, J. E., Guzman, A., Wood, M. P., Sneden, C., & Cowan, J. J. 2013, ApJS, 205, 11, doi: 10.1088/0067-0049/205/2/11
- Lawler et al. (2017) Lawler, J. E., Sneden, C., Nave, G., et al. 2017, ApJS, 228, 10, doi: 10.3847/1538-4365/228/1/10
- Layden (1994) Layden, A. C. 1994, AJ, 108, 1016, doi: 10.1086/117132
- Layden & Sarajedini (2003) Layden, A. C., & Sarajedini, A. 2003, AJ, 125, 208, doi: 10.1086/344948
- Lee et al. (2011) Lee, Y. S., Beers, T. C., Allende Prieto, C., et al. 2011, AJ, 141, 90, doi: 10.1088/0004-6256/141/3/90
- Liu et al. (2013) Liu, S., Zhao, G., Chen, Y.-Q., Takeda, Y., & Honda, S. 2013, Research in Astronomy and Astrophysics, 13, 1307, doi: 10.1088/1674-4527/13/11/003
- Longmore et al. (1990) Longmore, A. J., Dixon, R., Skillen, I., Jameson, R. F., & Fernley, J. A. 1990, MNRAS, 247, 684
- Longmore et al. (1986) Longmore, A. J., Fernley, J. A., & Jameson, R. F. 1986, MNRAS, 220, 279, doi: 10.1093/mnras/220.2.279
- Marconi et al. (2015) Marconi, M., Coppola, G., Bono, G., et al. 2015, ApJ, 808, 50, doi: 10.1088/0004-637X/808/1/50
- Martínez-Vázquez et al. (2016a) Martínez-Vázquez, C. E., Stetson, P. B., Monelli, M., et al. 2016a, MNRAS, 462, 4349, doi: 10.1093/mnras/stw1895
- Martínez-Vázquez et al. (2016b) Martínez-Vázquez, C. E., Monelli, M., Gallart, C., et al. 2016b, MNRAS, 461, L41, doi: 10.1093/mnrasl/slw093
- Massari et al. (2017) Massari, D., Mucciarelli, A., Dalessandro, E., et al. 2017, MNRAS, 468, 1249, doi: 10.1093/mnras/stx549
- Mateo et al. (2012) Mateo, M., Bailey, J. I., Crane, J., et al. 2012, in Proc. SPIE, Vol. 8446, Ground-based and Airborne Instrumentation for Astronomy IV, 84464Y
- Mateu et al. (2012) Mateu, C., Vivas, A. K., Downes, J. J., et al. 2012, MNRAS, 427, 3374, doi: 10.1111/j.1365-2966.2012.21968.x
- Monelli et al. (2017) Monelli, M., Fiorentino, G., Bernard, E. J., et al. 2017, ApJ, 842, 60, doi: 10.3847/1538-4357/aa738d
- Monelli et al. (2012) Monelli, M., Bernard, E. J., Gallart, C., et al. 2012, MNRAS, 422, 89, doi: 10.1111/j.1365-2966.2012.20539.x
- Muñoz et al. (2013) Muñoz, C., Geisler, D., & Villanova, S. 2013, MNRAS, 433, 2006, doi: 10.1093/mnras/stt868
- Mucciarelli et al. (2015) Mucciarelli, A., Lapenna, E., Massari, D., Ferraro, F. R., & Lanzoni, B. 2015, ApJ, 801, 69, doi: 10.1088/0004-637X/801/1/69
- Musella et al. (2018) Musella, I., Di Criscienzo, M., Marconi, M., et al. 2018, MNRAS, 473, 3062, doi: 10.1093/mnras/stx2543
- Neeley et al. (2017) Neeley, J. R., Marengo, M., Bono, G., et al. 2017, ApJ, 841, 84, doi: 10.3847/1538-4357/aa713d
- O’Brian et al. (1991) O’Brian, T. R., Wickliffe, M. E., Lawler, J. E., Whaling, W., & Brault, J. W. 1991, Journal of the Optical Society of America B Optical Physics, 8, 1185, doi: 10.1364/JOSAB.8.001185
- Oosterhoff (1939) Oosterhoff, P. T. 1939, The Observatory, 62, 104
- Pancino et al. (2015) Pancino, E., Britavskiy, N., Romano, D., et al. 2015, MNRAS, 447, 2404, doi: 10.1093/mnras/stu2616
- Pietrukowicz et al. (2015) Pietrukowicz, P., Kozłowski, S., Skowron, J., et al. 2015, ApJ, 811, 113, doi: 10.1088/0004-637X/811/2/113
- Pilachowski et al. (1983) Pilachowski, C. A., Sneden, C., & Wallerstein, G. 1983, ApJS, 52, 241, doi: 10.1086/190867
- Preston (1959) Preston, G. W. 1959, ApJ, 130, 507, doi: 10.1086/146743
- Preston & Paczynski (1964) Preston, G. W., & Paczynski, B. 1964, ApJ, 140, 181, doi: 10.1086/147907
- Preston et al. (2018) Preston, G. W., Sneden, C., Chadid, M., Thompson, I. B., & Shectman, S. A. 2018, ApJ, Submitted
- Pritzl et al. (2002) Pritzl, B. J., Armandroff, T. E., Jacoby, G. H., & Da Costa, G. S. 2002, AJ, 124, 1464, doi: 10.1086/341823
- Pritzl et al. (2005) Pritzl, B. J., Venn, K. A., & Irwin, M. 2005, AJ, 130, 2140, doi: 10.1086/432911
- Reddy et al. (2006) Reddy, B. E., Lambert, D. L., & Allende Prieto, C. 2006, MNRAS, 367, 1329, doi: 10.1111/j.1365-2966.2006.10148.x
- Ruffoni et al. (2014) Ruffoni, M. P., Den Hartog, E. A., Lawler, J. E., et al. 2014, MNRAS, 441, 3127, doi: 10.1093/mnras/stu780
- Ryabchikova et al. (2015) Ryabchikova, T., Piskunov, N., Kurucz, R. L., et al. 2015, Phys. Scr, 90, 054005, doi: 10.1088/0031-8949/90/5/054005
- Sandage (1958) Sandage, A. 1958, Ricerche Astronomiche, 5, 41
- Sesar (2012) Sesar, B. 2012, AJ, 144, 114, doi: 10.1088/0004-6256/144/4/114
- Shappee et al. (2014) Shappee, B. J., Prieto, J. L., Grupe, D., et al. 2014, ApJ, 788, 48, doi: 10.1088/0004-637X/788/1/48
- Simmerer et al. (2013) Simmerer, J., Ivans, I. I., Filler, D., et al. 2013, ApJ, 764, L7, doi: 10.1088/2041-8205/764/1/L7
- Simmerer et al. (2004) Simmerer, J., Sneden, C., Cowan, J. J., et al. 2004, ApJ, 617, 1091, doi: 10.1086/424504
- Smith & Manduca (1983) Smith, H. A., & Manduca, A. 1983, AJ, 88, 982, doi: 10.1086/113383
- Sneden et al. (2017) Sneden, C., Preston, G. W., Chadid, M., & Adamów, M. 2017, ApJ, 848, 68, doi: 10.3847/1538-4357/aa8b10
- Sneden (1973) Sneden, C. A. 1973, PhD thesis, The University of Texas at Austin
- Sobeck et al. (2007) Sobeck, J. S., Lawler, J. E., & Sneden, C. 2007, ApJ, 667, 1267, doi: 10.1086/519987
- Soszyński et al. (2009) Soszyński, I., Udalski, A., Szymański, M. K., et al. 2009, Acta Astronomica, 59, 1. https://arxiv.org/abs/0903.2482
- Stetson et al. (2014) Stetson, P. B., Braga, V. F., Dall’Ora, M., et al. 2014, PASP, 126, 521, doi: 10.1086/677195
- Tody (1986) Tody, D. 1986, in Proc. SPIE, Vol. 627, Instrumentation in astronomy VI, ed. D. L. Crawford, 733
- Tody (1993) Tody, D. 1993, in Astronomical Society of the Pacific Conference Series, Vol. 52, Astronomical Data Analysis Software and Systems II, ed. R. J. Hanisch, R. J. V. Brissenden, & J. Barnes, 173
- Torrealba et al. (2015) Torrealba, G., Catelan, M., Drake, A. J., et al. 2015, MNRAS, 446, 2251, doi: 10.1093/mnras/stu2274
- van Albada & Baker (1973) van Albada, T. S., & Baker, N. 1973, ApJ, 185, 477, doi: 10.1086/152434
- Villanova et al. (2013) Villanova, S., Geisler, D., Carraro, G., Moni Bidin, C., & Muñoz, C. 2013, ApJ, 778, 186, doi: 10.1088/0004-637X/778/2/186
- Walker et al. (2017) Walker, A. R., Andreuzzi, G., Martínez-Vázquez, C. E., et al. 2017, AJ, 154, 8, doi: 10.3847/1538-3881/aa72f9
- Wallerstein & Huang (2010) Wallerstein, G., & Huang, W. 2010, Mem. Soc. Astron. Italiana, 81, 952. https://arxiv.org/abs/1004.2017
- Wood et al. (2013) Wood, M. P., Lawler, J. E., Sneden, C., & Cowan, J. J. 2013, ApJS, 208, 27, doi: 10.1088/0067-0049/208/2/27
- Wood et al. (2014) —. 2014, ApJS, 211, 20, doi: 10.1088/0067-0049/211/2/20
- Zinn (1980) Zinn, R. 1980, ApJS, 42, 19, doi: 10.1086/190643
- Zinn & West (1984) Zinn, R., & West, M. J. 1984, ApJS, 55, 45, doi: 10.1086/190947