The Frequency of Dwarf Galaxy Multiples at Low Redshift in SDSS vs. Cosmological Expectations
Abstract
We quantify the frequency of companions of low redshift (), dwarf galaxies ( M M M⊙) that are isolated from more massive galaxies in SDSS and compare against cosmological expectations using mock observations of the Illustris simulation. Dwarf multiples are defined as 2 or more dwarfs that have angular separations , projected separations r kpc and relative line-of-sight velocities km/s. While the mock catalogs predict a factor of 2 more isolated dwarfs than observed in SDSS, the mean number of observed companions per dwarf is , in good agreement with Illustris when accounting for SDSS sensitivity limits. Removing these limits in the mock catalogs predicts for future surveys (LSST, DESI), which will be complete to M M⊙. The 3D separations of mock dwarf multiples reveal a contamination fraction of 40% in observations from projection effects. Most isolated multiples are pairs; triples are rare and it is cosmologically improbable that bound groups of dwarfs with more than 3 members exist within the parameter range probed in this study. We find that 1% of LMC-analogs in the field have an SMC-analog companion. The fraction of dwarf “Major Pairs” (stellar mass ratio 1:4) steadily increases with decreasing Primary stellar mass, whereas the cosmological “Major Merger rate” (per Gyr) has the opposite behaviour. We conclude that cosmological simulations can be reliably used to constrain the fraction of dwarf mergers across cosmic time.
keywords:
galaxies: dwarf – galaxies: groups: general – (galaxies:) Magellanic Clouds1 Introduction
Low mass, dwarf galaxies (M M⊙) are the most common class of galaxy at all redshifts (Binggeli et al., 1998; Karachentsev et al., 2013), and yet, their pair/group fractions have not been quantified observationally and compared to cosmological expectations in a consistent manner. In contrast, the interaction frequency between massive galaxies is actively studied, both observationally (e.g., Zepf et al., 1989; Conselice et al., 2003; Bundy et al., 2004; Bell et al., 2006; Lin et al., 2008; Carlberg et al., 2000; Patton et al., 2002; Patton & Atfield, 2008; Lotz et al., 2011; Patton et al., 2016; Man et al., 2016; Mundy et al., 2017; Ventou et al., 2017; Mantha et al., 2018, etc.) and theoretically (Blumenthal et al., 1984; Lacey & Cole, 1993; Berrier et al., 2006; Maller et al., 2006; Guo & White, 2008; Hopkins et al., 2010; Rodriguez-Gomez et al., 2015, etc.). Consequently, little is known about the frequency of dwarf-dwarf galaxy interactions and their role in the evolution of low mass galaxies.
In this study, we quantify the fraction of dwarf galaxies with low mass companions at low redshift utilizing both observational data from the Sloan Digital Sky Survey (SDSS) and “mock” galaxy catalogs created using the Illustris-1 cosmological simulation, (Vogelsberger et al., 2014; Nelson et al., 2015). Our goal is to establish the reliability with which cosmological simulations can trace the hierarchical processes that are expected to influence the evolution of dwarf galaxies.
Environmental effects (the tidal field of a massive host, ram pressure stripping, etc.) are often presented as the dominant drivers of dwarf galaxy evolution. This is motivated by the fact that non-star forming, gas poor (quenched) dwarf galaxies are almost exclusively found in proximity to a massive host (Geha et al., 2012; Sánchez-Janssen et al., 2013; Stierwalt et al., 2015; Bradford et al., 2015). Satellite dwarf galaxies of the Local Group (van den Bergh et al., 2006; Grcevich & Putman, 2009; Spekkens et al., 2014) and the Local Volume (Weisz et al., 2011) all exhibit similar distance-morphology relationships. Consequently, the role of mergers or interactions between dwarfs prior to their capture as a satellite of a massive galaxy has been largely ignored. However, this picture is rapidly changing.
While environmental processes are clearly needed to quench dwarf galaxies (e.g., Peng et al., 2010), they are not the only factors governing the evolution of low mass galaxies. High-resolution dark matter simulations of Milky Way type halos reveal that 10% of surviving dwarf-mass satellites have experienced a major merger since z=1 (Deason et al., 2015) and that 10% of dwarfs host a satellite of at least 10% its mass at z=0 (Sales et al., 2013). Furthermore, 30-60% of all surviving dwarf satellites are expected to have been accreted as part of a low mass group (Wetzel et al., 2015). Cosmologically, the tidal pre-processing of dwarf galaxies in low mass multiples is not expected to be a rare phenomenon across cosmic time and presents an alternative pathway for galaxy evolution at the low mass end. However, these theoretical predictions have yet to be tested systematically against observations.
We are only just starting to understand the impact of galactic pre-processing on the star formation histories (SFHs) and baryon cycle (supply and removal of gas) of dwarf galaxies. Earlier studies have suggested that many star bursting dwarf galaxies have companions (Noeske et al., 2001). Recently, the TiNy Titans (TNT) Survey studied the star formation rates (SFRs) and gas content of dwarf galaxy multiples (pairs and groups with stellar masses of M M M⊙) identified at low redshift () in SDSS (TNT; Stierwalt et al., 2015) and in the Local Volume ( 30 Mpc, TNT-LV; Pearson et al., 2016). The TNT and TNT-LV surveys are designed to study the dwarf-dwarf merger sequence and its importance to the evolution of low mass galaxies. This paper represents the theoretical counterpart to these studies.
The TNT surveys have provided mounting evidence that interactions between low mass galaxies do impact the structure and SFHs of dwarf galaxies (e.g., Privon et al., 2017). In particular, Stierwalt et al. (2015) found that SFRs are elevated in dwarf pairs relative to their non-paired counterparts; dwarf-dwarf interactions appear to drive enhanced star formation. Furthermore, Pearson et al. (2016) illustrate that dwarf pairs in the Local Volume are often found with extended gaseous envelopes, compared to their non-paired counterparts, suggesting that the efficiency of gas removal can also be increased through dwarf-dwarf interactions. This is true for the Magellanic System, the closest example of a dwarf-dwarf interaction (Putman et al., 2003; Nidever et al., 2010; Besla et al., 2010, 2012, 2013; Diaz & Bekki, 2011; Guglielmo et al., 2014). Indeed, Marasco et al. (2016) use the EAGLE cosmological simulation (Schaye et al., 2015) to illustrate that satellite-satellite encounters may be more important than environmental effects (tidal/ram pressure stripping by the host) in the gaseous evolution of dwarf satellite galaxies.
With next generation photometric and spectroscopic instruments, such as LSST, DESI, WFIRST, etc., new detections of low mass (or low surface brightness) galaxies with companions are forthcoming. A glimpse of what lies ahead is highlighted by the recent discovery of seven isolated groups of dwarfs with 3-5 members in the TNT sample (Stierwalt et al., 2017). The newly discovered TNT groups provide us with a window into a process of hierarchical evolution that may have been much more common at high redshift. However, there is no existing framework to understand how these low redshift groups fit in the prevailing cosmological model.
The average satellite mass functions of dwarf galaxies have been quantified in cosmological simulations (Dooley et al., 2017) and compared to observations in SDSS (Sales et al., 2013). Here, we expand such methods to create mock catalogs of cosmological dwarf multiples (pairs/groups) in isolated environments, accounting for the sensitivity limits of SDSS and line-of-sight properties (projected separation and relative velocities; including peculiar motions) that control the observational definition of companionship. Our goal is to assess whether or not the observed and theoretical fraction of dwarf multiples agree within the redshift and mass ranges where they can be reasonably compared: stellar masses between M⊙ < M M⊙ at low redshift (Volume (100 Mpc)3; z 0.0252). Specifically, we aim to address the following questions:
-
1.
What is the observed fraction of dwarfs in a pair or group vs. cosmological expectations?
-
2.
What is the contamination fraction of dwarf multiples owing to projection effects?
-
3.
What do cosmological simulations predict for the frequency of dwarf multiples in the era of deep photometric surveys like LSST?
-
4.
What is the z0 fraction of dwarf “Major Pairs” (stellar mass ratio )?
-
5.
What is the observed frequency of Magellanic Cloud analogs in the field vs. cosmological expectations?
-
6.
Are the recently-discovered TNT dwarf groups (Stierwalt et al., 2017) consistent with cosmological expectations?
Through this analysis we will establish the reliability of such simulations as probes of hierarchical processes at low masses at z0, lending credibility to their usage as predictors of the frequency of dwarf-dwarf interactions and mergers across cosmic time.
In Section 2 we describe our methodology to assign properties to galaxies (stellar mass, redshifts, isolation) and define survey volumes in both SDSS and Illustris. In Section 3 we quantify number counts of all galaxies (dwarfs and massive galaxies) and isolated dwarfs. Results for the frequency of dwarf multiples in SDSS and Illustris and predictions for next generation surveys are summarized in Section 4. We discuss the dwarf “Major Pair” fraction, the frequency of Magellanic Cloud analogs and place the TNT groups of dwarfs in a cosmological context in Section 5. Finally, we conclude in Section 6.
2 Galaxy Catalogs
We define a “dwarf galaxy” as a galaxy with a stellar mass of M M M⊙. The upper mass limit corresponds to systems slightly more massive than the LMC (M M⊙; van der Marel et al., 2002). According to the Tully-Fisher relation, this definition generally excludes galaxies with rotation curves that peak at 100 km/s or larger (Lelli et al., 2014). For reference, the LMC’s rotation curve peaks at 90 km/s (van der Marel & Kallivayalil, 2014).
The lower mass limit corresponds to the stellar mass of the SMC (M M⊙; Stanimirovic et al., 2004; van der Marel et al., 2009). The completeness of the SDSS catalog drops rapidly with decreasing stellar mass as a function of redshift. Galaxies of stellar mass of M⊙ are the lowest mass galaxies that are complete in SDSS at the lowest redshift considered in this study (z=0.013; see Section 2.4).
Galaxies with stellar masses larger than M⊙ are referred to as “Massive Galaxies”. Dwarf multiples (pairs and groups) do not survive for very long as bound configurations about massive galaxies (e.g., Gonzalez & Padilla, 2016). We thus require our dwarf galaxy sample to be sufficiently isolated from such systems, as described in Section 2.3.
In the following, we describe how stellar masses are defined for all galaxies in both the observational and cosmological data sets. Note that the cosmological galaxy samples will be referred to as “mock” galaxy catalogs.
2.1 Observational Galaxy Catalog: SDSS
Following Stierwalt et al. (2015), our observational sample is drawn from the Legacy area of the SDSS Data Release 7 spectroscopic catalog (Abazajian et al., 2009). We utilize only the continuous footprint, which covers 7296 deg2 of the sky. Spectroscopic completeness of galaxies imaged is estimated at 88% for galaxies with (Patton & Atfield, 2008). Note that low surface brightness galaxies and very close pairs will be preferentially missed. We apply lower limits on the anglar separation between dwarf galaxies (r; i.e. projected distances of 15-25 kpc depending on the redshift) to avoid fiber collisions that can miss close pairs (Section 4.1).
We select galaxies from the SDSS value-added catalog of Simard et al. (2011), which is a reprocessing of the SDSS photometry using bulge-disk decomposition and an improved handling of de-blending in crowded systems, such as close galaxy pairs. Stellar masses and associated errors are taken from Mendel et al. (2014, hereafter M14). We use the Sersic ugriz total stellar mass fits of M14, as recommended in their Appendix B.2.1 (see also Patton et al., 2013).
We assume Gaussian errors and sample the M14 stellar mass errors randomly to generate 500 unique realizations of the entire stellar mass catalog, each with a different set of stellar masses allowed within the errors. All statistics presented in this study are computed as the mean and standard deviation over these 500111We have also repeated this study using 1000 unique realizations and found similar results within 1. realizations.
The M14 catalog is restricted to galaxies with , where is the extinction-corrected -band Petrosian magnitude from the SDSS database. As such, we supplement the SDSS Massive Galaxy sample with bright galaxies () identified in the NASA-Sloan Atlas (NSA) and adopt the associated stellar masses and redshifts quoted in the catalog222http://www.nsatlas.org/data. We do not randomly sample the stellar mass errors for the massive galaxy sample as we are not interested in the intrinsic properties of these galaxies.
Redshifts are adopted for dwarfs () from the SDSS data release 9 (DR9) spectroscopic catalog, which has an average redshift error of order . In contrast, the average redshift error in DR7 is , which is too large to meaningfully extract kinematic information for the dwarf multiples. The corresponding DR9 velocity errors are 4 km/s, computed at the average redshift of our sample (z 0.021).
We assign redshifts to each galaxy in the sample in a similar fashion to the assignment of stellar mass: we assume Gaussian errors that are randomly sampled to generate the 500 unique realizations of the catalog. As such redshift errors, although small, are accounted for in the determination of both the relative velocities and positions of dwarf multiples.
There is 98.9% overlap between galaxies identified in the Simard et al. (2011) catalogs and those in DR9 (for z0.05). However, because we are using stellar masses from M14, who adopt DR7 redshifts, we further require that the difference between the DR7 and DR9 redshifts corresponds to a velocity difference less than 100 km/s. With this requirement, there is a 97.5% overlap between the DR9 and M14 catalogs. The remaining 2.5% of the sample are assigned DR7 redshifts and errors. A velocity error of 100 km/s corresponds to a stellar mass error of 0.06 dex at z=0.005 and 0.01 dex at z=0.0252. This is well below the average mass error in M14 of 0.1 dex. Moreover, the average redshift difference between our galaxy samples in DR7 and DR9 corresponds to a velocity difference of 15 km/s. This error is much lower than the velocity constraints that we later apply to define dwarf multiples ( = 150 km/s; see Section 4.1).
2.2 Mock Galaxy Catalog: Illustris & Abundance Matching
We utilize data from the Illustris Project (Vogelsberger et al., 2014): an N-body and hydrodynamic simulation spanning a cosmological volume of (106.5 Mpc)3 to derive “mock” galaxy catalogs, which will be the basis for comparison to expectations from CDM theory.
In this analysis, we use the highest resolution hydrodynamic Illustris-1 (hereafter Illustris Hydro) version of the simulation suite, which simulates the growth of structure from z=127 to z=0. We have tested all of our results using the dark matter-only Illustris-1-Dark simulation, and find very good agreement (see Appendix A).
The Illustris Project adopts cosmological parameters consistent with WMAP-9 (Hinshaw et al., 2013): =0.2726, =0.0456, =0.7274, , and .
For this study we will not use stellar masses that result from the explicit star formation prescription adopted in Illustris Hydro. There are large uncertainties in the star formation prescriptions appropriate for low mass galaxies, which can strongly affect the evolution of low mass systems. In particular, it has been found that stellar masses of dwarfs in Illustris Hydro are too high compared to observations (Genel et al., 2014). Different subgrid prescriptions for the physics of the ISM are adopted by many teams and no consensus has yet been reached by the community. Instead, we derive all statistics using only the dark matter component of subhaloes identified in Illustris Hydro. We assign stellar masses via abundance matching utilizing the global baryonic fraction to convert the dark matter component to a total subhalo mass.
We utilize Illustris Hydro in this analysis because the growth of dark matter subhaloes is known to be affected by baryonic processes, such as feedback (e.g. Wetzel et al., 2016). As a result, many low mass subhaloes that exist in Illustris-Dark-1 can be destroyed at early times in Illustris Hydro (Chua et al., 2017).
Dark matter haloes and their associated substructures (or subhaloes) are identified in Illustris Hydro using the SUBFIND halo-finding routine (Springel et al., 2001; Dolag et al., 2009). Theoretical dwarf and massive galaxy analog samples are then selected from the publicly available SUBFIND subhalo group catalogs generated at the z=0 snapshot of the simulations. Illustris Hydro reaches a dark matter particle mass resolution of mDM = M⊙ per particle. We place a lower limit of MDM = M⊙, ensuring that all haloes are well-resolved into 790 particles. This mass is also roughly the dynamical mass of the SMC within 3 kpc (Harris & Zaritsky, 2006).
2.2.1 Assigning Stellar Mass to the Mock Galaxy Catalog
We assume that the stellar mass associated with a given subhalo is a function of the maximum dark matter mass a subhalo has ever attained (see, e.g. Boylan-Kolchin et al., 2011). Hydrodynamic, cosmological simulations have supported this assertion, finding that halo mass grows in unison with stellar mass (Wellons & Torrey, 2017). We utilize the abundance matching relations in Moster et al. (2013) to assign a stellar mass to each subhalo, as outlined below.
We first identify the maximal dark matter mass ever achieved by each subhalo over its cosmic history () using merger trees created with the recently developed SUBLINK code (Rodriguez-Gomez et al., 2015). Because we are searching for dwarf subhalos in close proximity to each other, their dark matter distributions are likely truncated by tidal effects, making mass assignment via abundance matching less reliable if we choose their final descendent dark matter masses.
In addition, we require subhaloes to be separated by at least 5 times the gravitational softening length, which helps to assign reliable halo masses to merging systems. Similar methods have been applied to select Magellanic Cloud analogues in the Millennium-II simulation (Boylan-Kolchin et al., 2011).
A stellar mass is then assigned to a subhalo using the z=0 Moster et al. (2013) relations (their equations 11-14), and the maximal total subhalo mass, . To account for the scatter in the halo mass-stellar mass relation, we assume Gaussian errors using the 1 errors for each parameter, as listed in table 1 of Moster et al. (2013), to randomly assign each subhalo a stellar mass. This procedure of assigning stellar mass is repeated every time we select a set of mock galaxies (see Section 2.4).
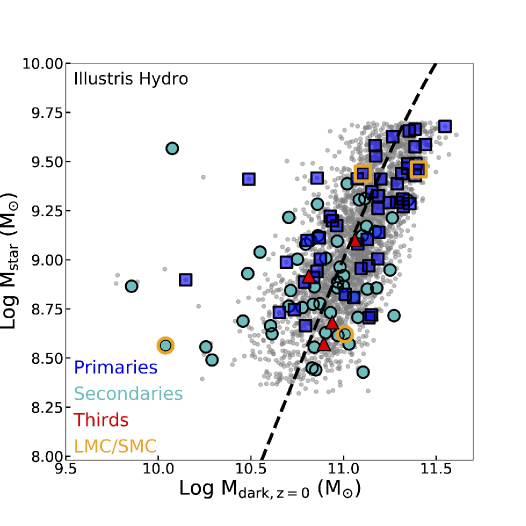
The resulting halo-stellar mass pairing will scatter about the mean abundance matching relation; see Fig. 1, where the dashed black line illustrates the mean relation from Moster et al. (2013). For a halo of mass 1011 M⊙, abundance matching yields a mean stellar mass of (M = 9.0 0.3. Uncertainties on stellar mass for the mock catalog are thus roughly a factor 3-4 larger than those in the M14 catalog.
Note that there are a number of cases in Fig. 1 where the derived stellar mass is larger than the scatter about the abundance matching relations at z=0 (points to the far left). This is because , which was used to assign the stellar mass, is larger than . In each of these cases the dwarf subhalo has a companion dwarf in close proximity r kpc. However, in some cases the dwarf companion is at smaller angular separations than 55 and so we do not count it as part of a multiple (marked as grey points instead). Because the dwarf subhalos are close together, their individual dark matter masses are ill-defined: either tides have stripped the outer halo, or the halos overlap sufficiently that most of the mass is assigned to the companion, causing the dark matter mass to decrease substantially at z=0 relative to their maximal halo mass. This is the reason the maximal halo mass is utilized to assign stellar mass.
2.2.2 Assigning Redshifts to the Mock Galaxy Catalog
In this section, we describe how redshifts and line of sight velocities are assigned to our mock dwarfs. This methodology is complementary to the studies of Snyder et al. (2017) and Behroozi et al. (2015), who utilize the Illustris and Bolshoi simulations, respectively, to create mock galaxy catalogs and quantify the pair fraction of massive galaxies at higher redshift in comparison to observations.
Here, redshifts are assigned to mock dwarfs using the 3D distance and of each subhalo in the simulation volume with respect to an observer placed randomly in the box. The redshift is computed as a combination of the redshift from the Hubble Flow, , and the peculiar motion of the subhalo () along the observer’s line-of-sight (red or blue shift). The observed redshift for the mock galaxy is thus
| (1) |
where can be positive or negative. is determined by first computing the 3D distance of the mock galaxy to the observer (DLOS). Then we assign the cosmological redshift using a look-up table of comoving distances at a given redshift, :
| (2) |
where is the luminosity distance computed at a given redshift, , using the Illustris cosmology. The cosmological redshift of the mock galaxy, , is defined where .
2.3 Selection of Isolated Dwarf Galaxies
Low mass galaxy groups are unlikely to survive as a bound configuration when in proximity to a massive galaxy (Gonzalez & Padilla, 2016). The tidal field of the host can disrupt groups of dwarfs after even one pericentric passage. This explains the rarity of LMC+SMC binaries about Milky Way type hosts as determined by both observational (Liu et al., 2011; Robotham et al., 2012) and cosmological surveys (Boylan-Kolchin et al., 2011; Busha et al., 2011; Gonzalez et al., 2013) and by numerical simulations of the LMC+SMC binary evolution (Besla et al., 2012; Kallivayalil et al., 2013). There are indications that the number of dwarf galaxy pairs may be higher in the Local Group (Fattahi et al., 2010). However, the number density of dwarfs increases substantially in the presence of massive galaxies, increasing the likelihood of chance projections mimicking true multiples.
An isolation criterion also affords us the best comparison sample between the observations and simulation data as environmental effects can suppress star formation. This can cause extreme discrepancies between halo-stellar mass correlations and makes dwarfs redder in color and thus harder to detect in surveys like the SDSS.
We define a dwarf galaxy to be isolated if no Massive Galaxy (M M⊙) can be identified that satisfies both of the following criteria:
-
1.
A relative line of sight velocity 1000 km/s. Patton et al. (2000) demonstrated that associations with massive galaxies at lower velocity separations are unlikely to be random.
-
2.
Tidal Index, . Following Karachentsev et al. (2013), we define the Tidal Index as,
(3) where Mstar is the stellar mass of a given massive galaxy in units of M⊙ and is the projected separation between the Massive Galaxy and the dwarf (see also Karachentsev et al., 2004). Geha et al. (2012) find that quenched dwarf galaxies are not identified at separations larger than 1.5 Mpc from an L* galaxy (M M⊙). This corresponds to .
This isolation criteria is applied to both the observed and mock galaxy catalogs, as described below. The projected relative velocities () between each dwarf and each Massive Galaxy are computed as:
| (4) |
where is the speed of light, is the redshift of the dwarf, is the redshift of the Massive Galaxy and .
Projected separations (rp) are determined from the angular separation (; in radians) between each dwarf and each Massive Galaxy and the angular diameter distance :
| (5) |
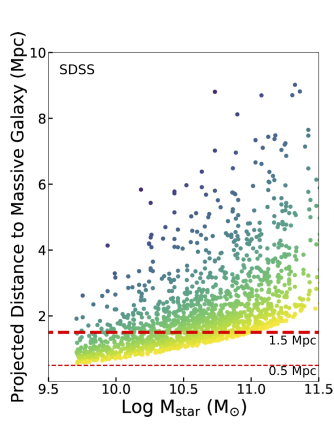
To ensure that dwarf galaxies located at the SDSS survey boundaries are properly tested for isolation, the observational “Massive Galaxy” catalog is supplemented with galaxies from the NSA catalog that reside outside the SDSS continuous survey footprint. A dwarf galaxy is considered non-isolated and removed from the sample if at least one Massive Galaxy satisfies the above criteria. For each isolated dwarf we record the Massive Galaxy with the largest Tidal Index that also satisfies km/s. The stellar mass of these closest hosts and their projected separation to each isolated dwarf is plotted in Fig. 2 (SDSS results are on the left).
For the mock galaxy sample, the Isolation Criteria are applied as follows:
-
1.
Mock Massive Galaxies are identified within a physical, cubic volume of (20 Mpc)3 centered on each mock dwarf.
-
2.
If this volume extends beyond the boundaries of the simulation, the periodic nature of the simulation is exploited to create a new (20 Mpc)3 volume centered on the mock dwarf to ensure that dwarfs at the simulation boundaries can be properly tested for isolation.
-
3.
The 3D position vector of each mock dwarf and Massive Galaxy from the observer location is translated into spherical coordinates, assuming the observer is located at coordinate (0,0,0) in a Cartesian system.
-
4.
The angular separation between the mock dwarf and each mock Massive Galaxy in the (20 Mpc)3 volume is computed and used to determine the projected separation as described above. This allows us to compute the Tidal Index .
-
5.
Relative velocities are computed using mock redshifts that account for the peculiar motion of the mock galaxies along the line of sight (eqn. 4).
-
6.
If any mock Massive Galaxy is found to satisfy both criteria, the mock dwarf is removed from the sample.
-
7.
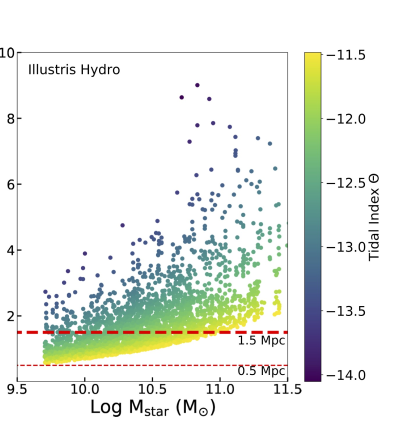
If no mock Massive Galaxies are found to satisfy both criteria, then the mock dwarf stays in the sample and the separation from the mock Massive Galaxy with the largest Tidal Index and km/s is recorded to double check that isolation is satisfied (see right panel of Fig. 2).
This set of Isolation Criteria ensures that all dwarfs are more than 1.5 Mpc from an L* type galaxy (Fig. 2; thick red dashed line). In practice, these criteria also ensure that none of our dwarfs have a Massive Galaxy within 500 kpc ( Fig. 2; thin red dashed line).
2.4 Redshift Limits and Survey Volume
We define the volume of our survey using redshift limits of 0.013z0.0252. The survey volume is limited by: 1) the size of the Illustris volume of (106.5 Mpc)3, which corresponds to a maximal redshift of z=0.0252; 2) efforts to circumvent bias from cosmic variance; and 3) the sensitivity limits of SDSS, as explained below.
2.4.1 SDSS Sensitivity Limits & Catalog Volume
The sensitivity limits of the SDSS catalog are outlined in M14. The catalog is not complete for dwarf galaxies in our redshift range (or for larger redshifts than considered here). The observability of dwarfs thus varies with redshift as a function of color and stellar mass.
M14 define a fitting function that describes the minimum stellar mass observable for galaxies of a given color at a given redshift:
| (6) |
We adopt fitting parameters (,,):
| (7) |
These parameters correspond to the stellar mass completeness limit for all galaxies bluer than the green valley, as defined by M14. Note that because our sample is low redshift, we chose =0 (vs. in Mendel et al., 2014) neglecting any redshift dependence in the fitting function.
These parameters best encompass our desired dwarf sample, which are expected to be blue or green in color as galaxies with stellar masses between M⊙ are found to be typically gas rich and star forming in the field (Geha et al., 2012; Bradford et al., 2015). Furthermore, the average restframe color for the isolated TNT dwarf pairs in Stierwalt et al. (2015) is 0.267, with a maximum value of 0.557. In other words, all of the dwarf pairs found in TNT are either blue or green, but none are red.
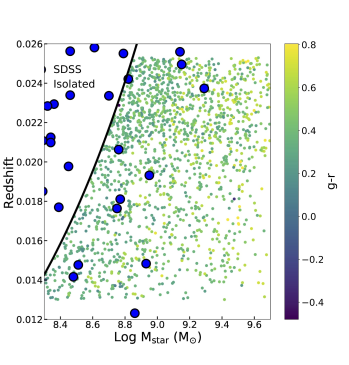
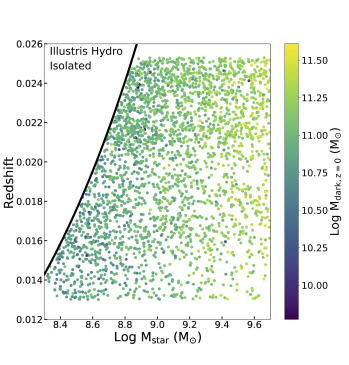
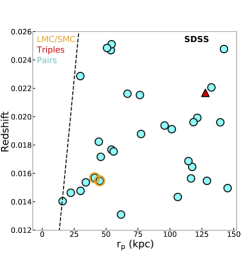
In Fig. 3 (left) all dwarf galaxies in the M14 catalog that satisfy our redshift and sensitivity limits are plotted as a function of mass and redshift. Points are color-coded by the dwarf galaxy’s restframe value. The black solid line illustrates the fitting function from Eqn. 6. The sample drops off rapidly with redshift towards the low mass end, but blue galaxies are observable over a larger mass range. The resulting average color for the sample of isolated SDSS dwarfs we consider in this study is 0.41.
There are 28 dwarfs (14 pairs) in the Isolated TNT sample that are in the redshift range of our survey (blue circles in the left panel of Fig. 3). However, given the adopted sensitivity limits, roughly 10 of the Isolated TNT sample (and only 2 pairs) in this redshift range overlap with our catalog. Many TNT pairs are missed because the secondary falls below the observability limit. This means that by applying the listed sensitivity floor we can only get a lower limit on the fraction of dwarf multiples. In Section 4.5, we remove these sensitivity limits but keep a mass floor of M⊙, which would recover 18 out of the 28 isolated TNT dwarfs (but only 8 out of 14 complete pairs).
The fact that the TNT pairs have members at masses below our sensitivity limits (black line in Fig. 3) strongly indicates that the dwarf multiple fraction determined in this study will significantly underestimate the true dwarf multiple fraction if the definition of “dwarf” were extended to lower masses. Our goal in this study is to compute the dwarf multiple fraction using parameters that can be reasonably reproduced by both observations and theory.
2.4.2 Illustris Simulation & Mock Catalog Volume
To create the mock catalog, sight lines are drawn through the Illustris simulation volume starting from a random location in the full (106.5 Mpc)3 simulation volume and using a random viewing perspective. Because the simulation boundary conditions are periodic, the full volume can be recreated regardless of the chosen starting location or viewing orientation. Note we could exploit the periodic boundary conditions to expand the volume to larger redshifts (e.g. Snyder et al., 2017). However, the sensitivity limits of SDSS at larger redshift (Fig. 3) imply that the dwarf statistics would not increase appreciably.
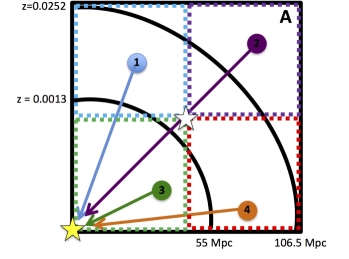
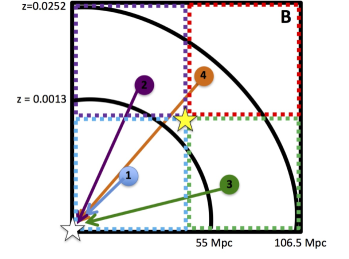
As indicated in Fig. 4, an ‘observer’ is placed at a randomly-selected starting location with a randomly-chosen viewing direction. The 3D distance is computed between the observer and each subhalo as well as the velocity of each subhalo along the line-of-sight to the observer ().
Only those subhaloes with redshifts within the specified redshift limits are included in the analysis. This process is repeated 500 times, adopting a new observer location and viewing perspective each time (e.g. Schematic B in Fig. 4). All statistics presented in this study for the ‘mock’ galaxy catalogues are averaged over the 500 different realizations of the survey volume.
We have adopted a lower redshift limit of z0.013, which corresponds to a comoving distance of 55 Mpc. This was chosen so that only half of the entire simulation volume is utilized for the selection of galaxies for a given combination of observer location and viewing perspective. As a result, we can sample a different volume each time the mock galaxy catalog is generated. This allows us to address biases in our statistics introduced by cosmic variance and sampling bias. We are sampling different survey volumes that are affected by different large scale structures, rather than sampling the same volume repeatedly.
With redshift limits of 0.013 0.0252 the corresponding volume for our observational sample in SDSS is (95 Mpc)3. For the Illustris simulations, this redshift range corresponds to a volume of (81 Mpc)3, a factor of 1.4 times smaller than the observational volume and a factor of 2 smaller than the total simulation volume. In other words, the adopted mock survey volume covers 1/8th of the sky (0.5 steradians), while SDSS covered 18% of the sky, which yields a ratio of 1.4. This survey volume is significantly smaller than that sampled by the TNT survey (0.005 z 0.07; Stierwalt et al., 2015), but affords us the fairest comparison between the SDSS catalog and the Illustris simulation volume.
The mock catalog generation includes peculiar motions when determining the redshift and is thus consistent with the measurement of observational redshifts, as it is the sum of the Hubble flow and the peculiar velocity. Note that peculiar motions may cause us to assign companions to dwarfs that are actually at much larger 3D separations. This should affect both the mock and observed galaxy catalogs (see Section 4.1).
At this point, the mock galaxy sample is complete at all stellar masses within the mock survey volume. However, as described in the previous section, SDSS sensitivity limits imply a strongly increasing incompleteness as a function of increasing redshift and decreasing stellar mass (Fig. 3; left). To ensure the mock and observed dwarf galaxy catalogs are comparable, we apply the same sensitivity limits, as a function of redshift and stellar mass, to both the observed and mock galaxy catalogs, as described by Eqn. 6. As a result, the mock catalogs will be similarly incomplete as a function of stellar mass (see right panel of Fig. 3).
3 Results: Galaxy Counts within the Observational and Mock Survey Volumes
3.1 Total Galaxy Counts: Massive Galaxies & Dwarfs
Baryonic effects (stellar feedback, reionization) can dramatically affect galaxy counts at the low mass end (Chua et al., 2017; Sawala et al., 2013; Cui et al., 2012; Kravtsov et al., 2010). Here we compare galaxy counts within our survey volume (0.013 0.0252) for massive galaxies (M M⊙) to ensure the observational and ‘mock’ galaxy catalogs yield consistent results in a mass regime where baryonic effects should not play a significant role (i.e. a mass regime where the stellar-halo mass relations are well calibrated Genel et al., 2014). We then extend this analysis to the dwarf galaxy regime.
For the ‘mock’ galaxy catalogs we quote statistics averaged over 500 sightlines that randomly sample the Illustris Hydro simulation volume, as described in the previous section and by Fig. 4. For the SDSS dwarf galaxy counts, we have randomly sampled the stellar mass and redshift error space assuming Gaussian errors from M14 and SDSS DR9, respectively, to generate 500 versions of the dwarf galaxy catalog. Galaxy counts are computed as the mean over these catalog realizations and the quoted errors are the standard deviations. Results are summarized in Table 1.
Note that we have not generated multiple versions of the massive galaxy catalog (M M⊙) as the SDSS DR9 survey is complete with respect to stellar mass for such galaxies over the redshift range considered. Given the small standard deviation in dwarf galaxy counts, this omission is not expected to significantly affect the galaxy counts of massive galaxies listed here. Also, as described in Section 2.1, we supplement the observed catalog with massive galaxies identified in the NSA catalog.
All values are the mean number counts and standard deviations computed over 500 realizations of the respective catalogs. Columns 2 and 4) SDSS values account for a spectroscopic completeness of 88%. Note that the stellar masses for the SDSS massive galaxies are not randomly sampled, and so the number count and density are listed without uncertainties. Columns 3 and 5) and refer to the number density of Massive and dwarf galaxies, respectively.
| Catalog | # Massive Galaxies | (Mpc)-3 | # Dwarf Galaxies | (Mpc)-3 | Volume (Mpc)3 |
|---|---|---|---|---|---|
| SDSS | 6,944 | 0.010 | 7860 35 | 0.010 | 7.78 |
| Illustris Hydro | 4,810 741 | 0.009 0.001 | 9,165 1,607 | 0.0170.003 |
From Table 1, the number densities for Massive Galaxies are consistent between observations and theory, as expected as the feedback prescriptions adopted in Illustris are calibrated such that the stellar-halo mass relation agrees with the observed number counts of Massive Galaxies (Vogelsberger et al., 2014). The difference in the total number counts reflects the factor of 1.4 larger volume of the SDSS footprint vs. the Illustris volume.
The dwarf number densities are more discrepant, but still agree within 2. On average there appear to be more mock dwarfs than in SDSS, which is likely a manifestation of the missing satellite problem. Many of these dwarf subhaloes are in proximity to a massive host, and would likely be quenched by environmental processes, and therefore unobservable at low masses given our optimistic cuts in color for the observability of dwarfs in SDSS (see Fig. 3). In the next section we apply an isolation criterion to identify dwarfs that would still be star forming and thus bluer in color in order to provide a fair comparison between the observations and the simulation data.
3.2 Isolated Dwarf Galaxy Counts
In this section the properties (number counts, mass distributions) of mock and observed dwarfs that are isolated from Massive Galaxies are quantified and compared for consistency. Recall, the distribution of isolated SDSS dwarfs are plotted as a function of redshift in the left panel of Fig. 3, with mock catalog results on the right.
Properties of the isolated dwarfs are summarized in Table 2. As expected, the number density of isolated dwarfs is much lower than that of non-isolated dwarfs in the observed and both mock galaxy samples (factor of 3 and 2, respectively). However, the mean number density of dwarfs in the mock catalog is still a factor of 2 larger than that observed in SDSS. Note that the results do still agree within 2 and the minimum density of mock isolated dwarfs identified across all 500 realizations of the Illustris volume is 0.003 (Mpc)-3, in agreement with the observed value. Despite the higher number density of dwarfs in the mock catalogs the mean stellar mass of isolated dwarfs is consistent with observations; all catalogs yield (MM = .
All values are the mean and standard deviation computed using 500 realizations of the respective catalog. Columns 2 and 3) SDSS DR9 observed counts are listed accounting for a spectroscopic completeness of 88%. Column 3) refers to the number density of isolated dwarfs in the survey volume, following criteria listed in Section 2.3.
| Catalog | # Isolated Dwarfs | (Mpc)-3 |
|---|---|---|
| SDSS | 1,909 15 | 0.00245 0.00002 |
| Illustris Hydro | 2,829 422 | 0.0051 0.0008 |
On average, there is a factor of 2 more mock dwarfs than observed in SDSS in a given volume (Table 2). There are a number of possible explanations for this discrepancy, e.g.:
-
1.
There are more low surface brightness dwarf galaxies for the same stellar mass that are not currently observable given the sensitivity of SDSS (Klypin et al., 2015; Blanton et al., 2005). Their detection might be possible with new observing strategies (Greco et al., 2017; Danieli et al., 2018) or when surveys like LSST come online.
-
2.
Environmental effects are not the only explanation for the subhalo overabundance problem. Wetzel et al. (2016) have shown that different choices in star formation and feedback prescriptions can help remedy the problem. We do not explicitly account for the stellar mass formed in the simulation and thus do not account for this effect. However, while we are only exploring a factor of 10 in mass, it is not clear that such processes would similarly affect mass growth across this dwarf mass regime (Di Cintio et al., 2014).
-
3.
Reionization may hinder early stellar mass growth, reducing the number of observable low mass galaxies across the mass range probed (e.g. Wyithe & Loeb, 2006). However, it is unclear how well this would work at LMC mass ranges.
-
4.
There are fewer massive hosts at cluster mass scales (M M⊙) in the Illustris volume than in our selected SDSS volume (which is 1.4 times larger). In fact there are no systems at this stellar mass scale in our mock Massive Galaxy catalogs, but there are 3 in our SDSS Massive Galaxy Catalog. The Isolation Criteria will thus remove more dwarfs in the observed catalog than in the mock catalog.
These 4 possibilities may be testable in next generation versions of cosmological simulations - particularly ones with larger volumes and different baryonic physics (e.g. Illustris-TNG, Springel et al., 2017). It remains a challenge to explain how these processes would uniformly affect the number density across the mass range probed in this study.
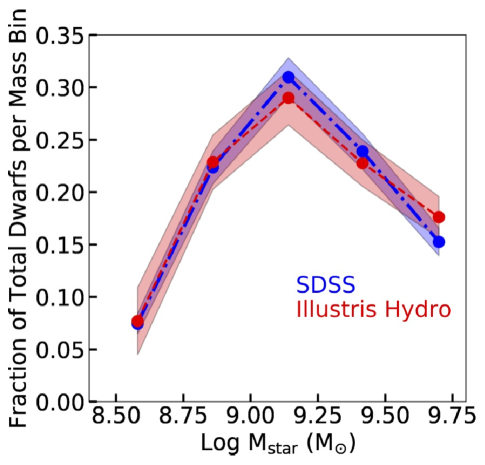
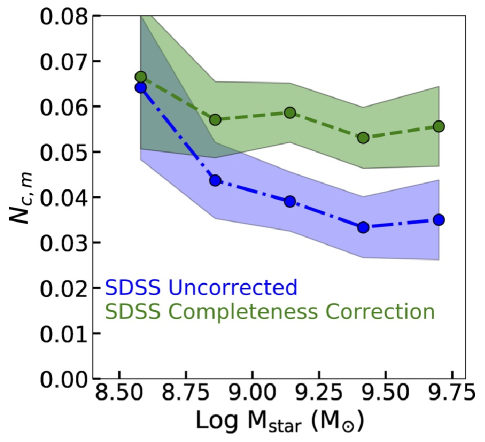
In Fig. 5 the fraction of mock and observed isolated dwarf galaxies is plotted for 5 equally spaced mass bins. Thus, although the total number of dwarf galaxies in the mock catalogs is higher than observed, the fraction of dwarfs per mass bin shows very good agreement. Since we are concerned with the ratio of dwarfs with companions relative to the total dwarf population, we expect that such ratios will be physically meaningful.
If the solution to the discrepancy between theory and observations is missing low surface brightness galaxies, Fig. 5 suggests, perhaps surprisingly, that a similar fraction of low surface brightness dwarfs are missing across all mass bins.
4 Results: Frequency of Dwarf Multiples and Predictions for Next Generation Surveys
In the following sections we quantify the frequency of isolated dwarf multiples, where all galaxy members have stellar masses from M M M⊙ and none are in proximity to a Massive Galaxy (M M⊙).
In Section 4.1, we define our selection criteria for dwarf multiples. In Section 4.2, the mean number of companions per dwarf galaxy () is computed for all catalogs and calibrated for projection effects (multiples with 3D separations less than 300 kpc) using the cosmological catalogs. This is further quantified as a function of dwarf mass, in Section 4.3. In Section 4.4, we compute the frequency of dwarf pairs vs. triples or higher order multiples for dwarf galaxies in the adopted mass range. Finally, in Section 4.5 we calibrate the SDSS results for completeness using the mock catalogs in order to make predictions for future surveys that will be complete to stellar masses as low as 2 M⊙ out to 100 Mpc.
4.1 Identification of Isolated Dwarf Multiples
We seek to identify dwarf galaxies with close companions that have separations and relative velocities that are plausible for tidally-interacting, bound systems of this mass scale. Informed by results from the TNT surveys and numerical simulations of the Magellanic Clouds, dwarfs are deemed associated if they have a relative line-of-sight velocity less than 150 km/s, angular separation and a projected separation r150 kpc. SDSS fiber collisions reduce the number of detectable companions at angular separations , which corresponds to projected separations of 15-25 kpc over the redshift range probed in this study.
In Illustris the gravitational forces exerted by dark matter particles are softened on a comoving scale of kpc. We are thus unable to resolve subhaloes that are separated by less than roughly 5 softening lengths, corresponding to a separation of roughly 11 kpc at z=0. In practice there are very few dwarf pairs that are identified with physical separations less than 15 kpc - this is likely due to SUBFIND’s inability to distinguish haloes separated by such small distances (see, e.g. Rodriguez-Gomez et al., 2015). Since the projected separation is always smaller than the 3D separation, by applying a limit of 55 on the angular separation, we ensure 3D separations large enough to avoid this issue.
The projected separation upper limit is roughly for the most massive dwarf subhaloes in the mock catalog ( M⊙; see Fig. 1). Furthermore, Stierwalt et al. (2015) found that SFRs in dwarf galaxy pairs are elevated relative to non-paired dwarfs even at separations of 120 kpc. An upper limit of 150 kpc will thus ensure that all plausibly interacting dwarfs are identified.
The upper limit on the line of sight velocity corresponds to the escape speed of our most massive dwarfs at a distance of 150 kpc. The selection criteria thus ensures that bound dwarf pairs will be captured even at large separations. For reference, the 3D velocity difference between the Magellanic Clouds is 130 km/s (Kallivayalil et al., 2013) and their 3D separation is 23 kpc; our criteria would allow for the selection of such analogues.
Note that these criteria differ from those adopted by the TNT survey (Stierwalt et al., 2015), where dwarf pairs were selected to have separations less than 50 kpc and relative velocities less than 300 km/s (although the majority of the sample have velocities less than 150 km/s). We adopt a larger separation limit because of the issues with close separations outlined above. We also adopt a lower relative velocity limit in order to minimize the frequency of chance projections.
4.1.1 Selection of Physical and Projected Dwarf Multiples
Using the defined SDSS and mock, isolated dwarf galaxy catalogs, “Projected” dwarf multiples are identified using the following steps based on their projected separations and relative line-of-sight velocities.
-
1.
All isolated dwarf galaxies are rank-ordered by stellar mass.
-
2.
Starting with the most massive dwarf, the projected separation and line-of-sight velocity difference are computed between that dwarf and every other dwarf in the isolated catalogs.
-
3.
All other dwarf galaxies located with angular separations , projected separations of r kpc, and km/s of the given dwarf are stored as companions. The angular separation limit is applied to all catalogs to avoid incompleteness owing to fiber collisions in SDSS and create a similarly constrained mock catalog.
-
4.
The above steps are repeated for the next most massive dwarf.
All steps are repeated for 500 realizations of the SDSS and Illustris Hydro catalogs. The resulting catalog of multiples will be referred to as “SDSS” and “Illustris Hydro Projected” in subsequent plots.
In Section 3.2, it was shown that the number density of isolated mock dwarfs is roughly a factor of two larger than that observed (Table 2). While the relative fraction of isolated dwarfs is consistent between theory and observations (Fig. 5), it is possible that the higher density of dwarfs will result in a larger frequency of dwarf multiples if they are selected based on projected properties alone.
To address this issue we consider a second method for identifying mock dwarf multiples with small 3D separations. Before step 2 in the methodology outlined above, an additional step is introduced. Starting with the most massive dwarf, we first identify all isolated mock dwarf galaxies located within a 3D sphere 300 kpc in radius centered on the target mock dwarf and then proceed to step 3. This ensures that the contamination fraction from projection effects will be minimized. In contrast, the Illustris Hydro Projected sample may contain mock dwarfs separated by much larger 3D distances that appear to be in close proximity owing to projection effects. This process is repeated for 500 realizations of the dwarf mock catalog to create a sample that will be referred to as “Illustris Hydro Physical” in subsequent plots.
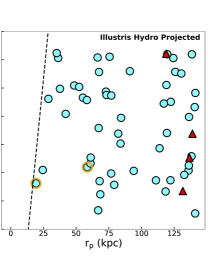
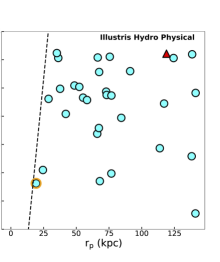
Examples of the resulting distribution of dwarf multiples for the three catalogs (SDSS, Illustris Hydro Projected, Illustris Hydro Projected) are plotted in Fig. 6.
This figure illustrates the projected separation between each member of the multiple and the primary (most massive) dwarf galaxy member (excluding the primary itself). Results are plotted for one representative realization of each catalog. The solid line indicates the observational limitations in resolving close pairs owing to SDSS fiber collisions. Since we have enforced a minimum angular separations of 55, no multiples lie to the left of the solid line. When a 3D separation of 300 kpc is enforced (Physical criteria; right panel in Fig. 6), most triples at wide separations are no longer identified. In contrast, multiples with separation less than 50 kpc are found to be robust against projection effects. The TNT dwarf pairs were all chosen to have separations less than 50 kpc; this study indicates that the TNT dwarf pairs are likely to be true pairs.
By repeating this process over multiple realizations of each catalog, we will compute average statistics for the frequency of dwarf multiples, the number of members, stellar mass distributions, and kinematic properties.
4.2 Mean Number of Companions per Dwarf Galaxy ()
Following Patton et al. (2000), we define as the mean number of companions per galaxy. is the total number of isolated dwarf companions (i.e. the sum of all pairs, triples, etc., that satisfy the criteria for multiples defined in Section 4.1), divided by the total number of isolated dwarf galaxies in each catalog.
is computed for all isolated dwarf galaxy multiples in each realization of the SDSS and mock catalogs (Illustris Hydro Projected and Illustris Hydro Physical). The results are then averaged over all 500 realizations of each catalog. The resulting mean and standard deviation for each catalog are summarized in Table 3.
Agreement is best seen between the SDSS and Illustris Hydro Projected catalogs (agreement is within 1). In Section 2.3 concerns were raised that because the number density of mock dwarfs is too high relative to observations, the frequency of mock projected pairs would also be too high. However, we have shown here that the fraction of multiples is not overproduced, just as the fraction of dwarfs per mass bin is also in agreement between observations and theory (Fig. 5).
When the Physical selection criteria are applied to the mock catalog, Table 3 and Fig. 7 illustrate that the average decreases by 40%. In other words, 40% of SDSS multiples may have 3D separations larger than 300 kpc, despite their apparent proximity in projection. McConnachie et al. (2008) find a similar contamination fraction when identifying massive, compact galaxy groups in the Millennium simulation. This contamination fraction is also consistent with the study of Wilcots & Prescott (2004), who found that a significant fraction of nearby dwarf galaxies with a projected dwarf companion show no strong signs of tidal disturbance in their outer HI structure.
We utilize the theoretical contamination fraction to calibrate the SDSS for projection effects (see also Patton & Atfield, 2008), resulting in the prediction that = 0.024 for the mean number of companions per dwarf with physical separations less than 300 kpc (see Table 3).
Column 2) Method for defining multiples (see Section 4.1.1). Column 3) The mean and standard deviation computed by averaging over 500 realizations of each catalog. The Last Row) indicates the expected mean fractional number of Physical companions in the SDSS sample. The SDSS is corrected for contaminants owing to projection effects using the fractional difference between the Physical and Projected results of the Illustris Hydro mock galaxy catalog.
| Catalog | Method | |
|---|---|---|
| SDSS | Projected | 0.039 0.003 |
| Illustris Hydro | Projected | 0.034 0.005 |
| Illustris Hydro | Physical | 0.021 0.003 |
| SDSS-Correction | Physical | 0.024 |
4.3 Mean Number of Companions per Dwarf per Mass Bin ()
Fig. 7 illustrates the mean number of companions per dwarf per stellar mass bin, (i.e. per stellar mass bin).
computed for the SDSS catalog (blue) decreases from the lowest mass bin towards higher masses. The mock catalogs show qualitatively the same behaviour, with the best agreement with SDSS seen in Illustris Hydro Projected.
Note that the higher fraction of companions indicated by the SDSS sample in the lowest mass bin may be a result of sensitivity limits being biased towards blue colors. Indeed, there are only 130 dwarfs in the SDSS sample in the lowest mass bin of Fig. 7. Stierwalt et al. (2015) showed that dwarfs in pairs have higher SFRs, and thus bluer colors on average (see also Fig. 3). This suggests that dwarf multiples are easier to identify at the low mass end than their non-interacting counterparts. Such observational bias would not be reflected in our mock dwarf selection criterion, where only limits on stellar mass, not color, were implemented.
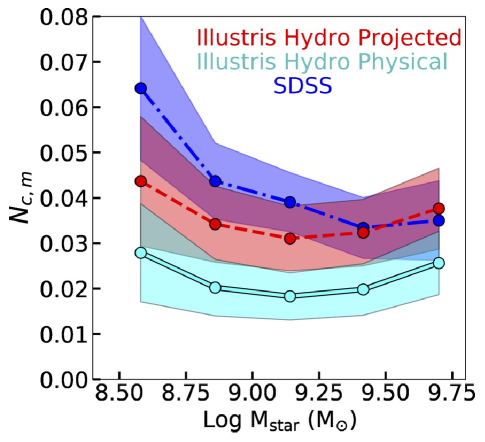
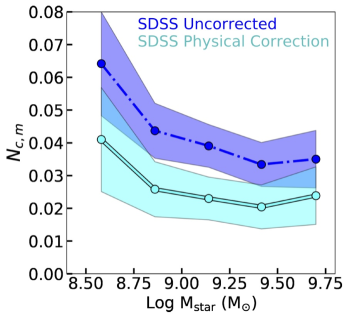
We use the fractional difference of between the Illustris Hydro Physical and Illustris Hydro Projected dwarf multiples in each mass bin to correct the SDSS results of Fig. 7 for projection effects. The result, plotted in Fig. 8, illustrates the predicted true , if contaminants owing to projection effects were removed.
4.4 Frequency of Pairs and Groups
We define N1 as the percentage of dwarfs with only one companion (a pair), N2 as having only two companions (a triple) and N3 as having 3 companions (a quad). In practice we do not find higher order multiples in the catalogs. Note that with this definition, a true triple system, for example, would be counted 3 times, as there are three dwarfs that each have two companions. Results for all catalogs are summarized in Table 4.
Roughly 3.2% of mock dwarfs in Illustris Hydro Projected are in a pair, meaning they have one companion within the stellar mass range afforded by our adopted sensitivity limits. This is within the 1 errors of the SDSS value of %. This means that out of a sample of 10,000 isolated dwarfs, 150 unique pairs should exist in the mock sample and 175 in SDSS.
However, when mock dwarf multiples are required to have 3D separations kpc (Illustris Hydro Physical) the fraction of mock pairs drops by 40%. In other words, out of a sample of 10,000 isolated dwarfs, while there should be 175 projected pairs in SDSS, only 105 are cosmologically expected to have physical separations less than 300 kpc.
We find that very few dwarfs are found in a triple using any selection criteria in any catalog (%). Again, taking a sample of 10,000 isolated dwarfs, this fraction implies that at most 20 dwarfs have two companions, yielding 20/3 7 unique projected triples.
In the Illustris Hydro Physical catalog of multiples, not all sightlines through the simulation volume yield triples. Only 70% of the 500 realizations of the Illustris Hydro volume yield any triples. Given the rarity of such configurations it is unsurprising that they are not identified in every realization of the catalogs. Results quoted in Table 4 are averaged over only sightlines where triples were identified.
Columns 3, 4 and 5) indicates percentage of pairs, triples and quads. Note that very few sightlines through the Illustris volume host mock quads (only 2-7% of the 500 realizations of the simulation volume). The same is true for mock triples in Illustris Hydro Physical (50% of volume realizations host a triple). But mock triples are identified in 466 of 500 sightlines Illustris Hydro Projected and 475 of 500 realizations of the SDSS catalog. Quoted is the fraction of mock dwarfs in such configurations averaged over all 500 catalog realizations, regardless of whether a quad or triple was identified. The Last Row) indicates, for a sample of 10,000 isolated dwarfs, the number of expected unique Projected pairs, triples and quads, based on the largest percentage listed in the rows above (see text in Section 4).
| Catalog | Method | |||
|---|---|---|---|---|
| SDSS | Projected | 3.5 0.3 | 0.21 0.08 | none |
| Illustris Hydro | Projected | 3.2 0.5 | 0.10 0.08 | 0.004 0.003 |
| Illustris Hydro | Physical | 2.0 0.4 | 0.08 0.06 | 0.06 0.03 |
| 10,000 Dwarfs | Projected, Max | 160 Pairs | 3 Triples | 1 Quad |
Even fewer realizations of the mock catalogs (7% in Illustris Hydro Projected and 2% in Illustris Hydro Physical) yield dwarfs with 3 companions (quads). It is thus reasonable that none are identified in SDSS. Of those 2-7% of realizations, we find only 0.06% of mock dwarfs with 3 companions. As such, for a sample of 10,000 isolated dwarfs, it is cosmologically expected that, at best, one may find one quad within our adopted mass constraints. Given that similar statistics are found using the Physical criteria, if a quad is identified under the same criteria as that adopted here, it is likely to be real.
We conclude that groups with more than 3 dwarf galaxy members ( M M M⊙) with angular separations , projected separations r 150 kpc, and relative velocities 150 km/s are very rare (%) both cosmologically and observationally at low redshift (z 0.025).
4.5 Predictions for Next Generation Surveys: Dwarf Multiples with M M⊙
We create predictions for future photometric and spectroscopic surveys that are expected to be complete to stellar masses as low as M M⊙ within a (100 Mpc)3 volume, such as LSST, DESI, etc. We do this by calibrating the SDSS multiples for completeness and projection effects using “complete” versions of the mock catalogs.
We remove the observational sensitivity limits (Fig. 3) in the mock dwarf selection criteria. Instead, we select all dwarfs with stellar masses M M⊙ in Illustris Hydro (where stellar mass is determined as in Section 2.2.1). Note that the SDSS catalog is left unchanged. The new mock catalog is called Illustris Hydro Complete.
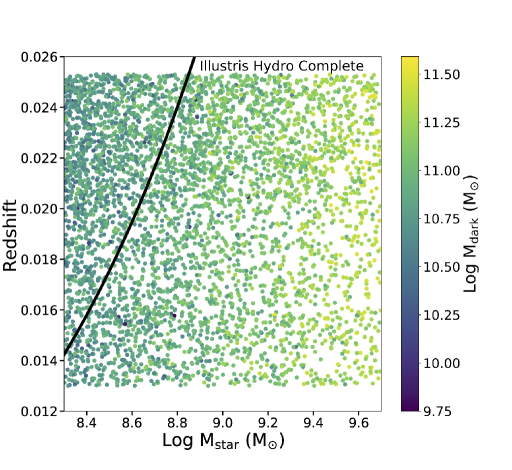
Fig. 9 illustrates the distribution of stellar mass for the mock isolated dwarfs in the Illustris Hydro Complete catalog as a function of redshift. Mock dwarfs are color coded by their halo mass at z=0. Plotted is one representative realization of the simulation volume.
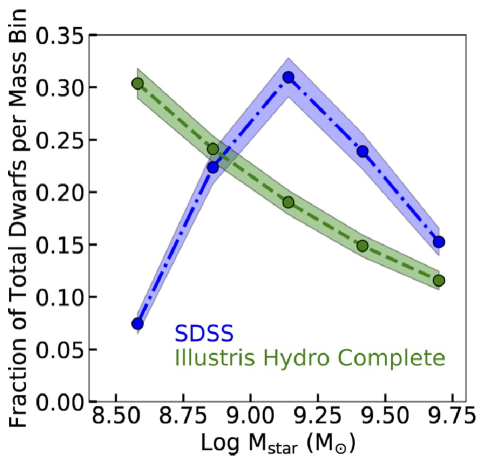
Fig. 10 illustrates the corresponding fraction of dwarfs per stellar mass bin for Illustris Hydro Complete and the original SDSS results (where observational sensitivity limits are still enforced). The mock dwarf fraction increases towards lower masses, as expected.
We use the Illustris Hydro Complete catalog to compute the average number of companions per mock dwarf galaxy () using the same Projected and Physical criteria listed in Section 4.1.1. Results are listed in Table 5, averaged over all 500 realizations of each catalog. The fraction of mock dwarfs with companions has predictably increased in each mock catalog. A discrepancy remains between the Illustris Hydro Complete Projected and Illustris Hydro Complete Physical catalogs, again indicating contamination from projection effects.
We calibrate the SDSS dwarf catalog to account for survey incompleteness using the fractional difference between the Illustris Hydro Projected and Illustris Hydro Complete Projected results (denoted as ). The difference in (Table 5/Table 3) for the mock Projected catalog is 1.4. This increases predictions for a complete observational survey to 0.06 (last row of Table 5).
If we further include a correction for projection effects, we expect the number of multiples to decrease by 40% (e.g. Fig. 8), yielding .
Same as Table 3 except that a stellar mass floor of M M⊙ has been applied to the mock catalogs. The SDSS result is unchanged and is listed for reference. Column 4) indicates the fractional difference in between each complete catalog and their incomplete counterpart from Table 3. The Last Row is the expected for projected multiples in SDSS if it were complete to M M⊙.
| Catalog | Method | ||
|---|---|---|---|
| SDSS | Projected | 0.039 0.003 | N/A |
| Illustris Hydro Complete | Projected | 0.048 0.005 | 1.4 |
| Illustris Hydro Complete | Physical | 0.032 0.004 | 1.5 |
| SDSS-Complete Correction | Projected | 0.06 | 1.4 |
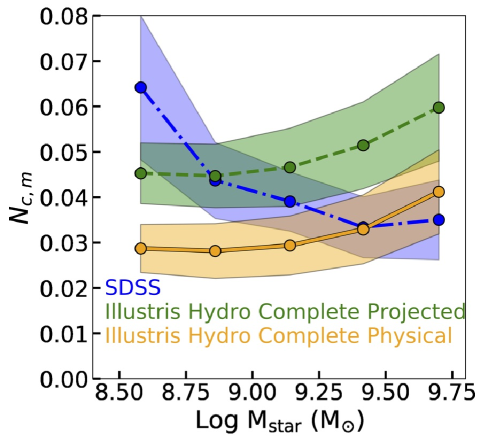
Fig. 11 plots the mean number of companions per mass bin, , using both the Illustris Hydro Complete Physical and Illustris Hydro Complete Projected catalogs. This is similar to Fig. 7, but now using the complete mock catalogs. The SDSS results (blue) are unchanged, reflecting the original sensitivity limits of the survey. In both mock catalogs, increases for the most massive dwarf bins and decreases for low mass bins. This is because the number of mock dwarfs in the lowest mass bins has increased substantially (Fig. 10). This result supports the hypothesis that the upturn in the SDSS results at low mass bins is likely a result of survey incompleteness.
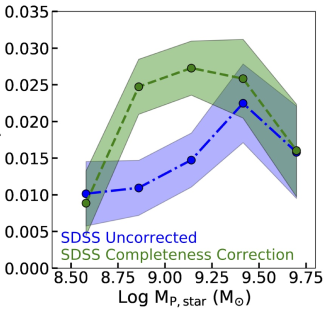
We now calibrate the SDSS results to predict for future observational surveys that will be complete to low masses. We compute the fractional change in between the Illustris Hydro Projected catalogs without the sensitivity limits (Fig. 11) and with them (Fig. 7) in each mass bin. In Fig. 12 we utilize this fractional change to correct the SDSS for completeness (green; dashed).
The SDSS Completeness Correction (green; dashed) results for are relatively flat across all mass bins at an average value of 0.06. This is the prediction for the mean number of companions per dwarf galaxy in future surveys that are complete to stellar masses of M⊙ over a (100 Mpc)3 volume.
5 Discussion
In the following, we use the SDSS and mock dwarf-multiple catalogs to connect with existing studies of dwarf-dwarf interactions in the literature. We first quantify the frequency of “Major Pairs” compared to studies of the “Major Merger” rate of dwarf galaxies (Section 5.1). We next quantify the observed and cosmologically expected frequency of analogues of the Magellanic Clouds in the field, comparing our results to the known frequency of such analogues near Milky Way-type hosts (Section 5.2). Finally we place the recently discovered set of 7 projected dwarf groups from the TiNy Titans (TNT) survey (Stierwalt et al., 2017) within the context of our study (Section 5.3).
5.1 “Major Pair” Fraction, MM
Galaxy interactions are more destructive as the mass ratio of the interacting systems increases. We define destructive “Major Pairs” as dwarf galaxy pairs with stellar mass ratios of MM. S,star refers to stellar mass of the 2nd most massive member (Secondary) and P,star to that of the most massive member (Primary).
Fig. 13 illustrates the cumulative probability distribution of stellar mass ratios of dwarf pairs identified in the SDSS and Illustris Hydro Physical catalogs. Results for the Illustris Hydro Projected catalog are similar; the stellar mass ratio distribution is unaffected by projection effects. We find that, within our adopted stellar mass and sensitivity limits, 70-85% of dwarf pairs identified in all catalogs are “Major Pairs”.
The large fraction of high mass ratio encounters is partly a result of our sensitivity and mass limits. Results for the Illustris Hydro Physical Complete catalog is plotted in Fig. 13, where the sensitivity limits are dropped (as in Section 4.5). Now 60-70% of dwarf pairs are “Major Pairs”. This fraction is certain to decrease as the mass limits of our surveys are lowered. As such, the stellar mass ratio distribution should not be confused/compared with a “complete” mass ratio distribution (e.g. Figs. 6 and 7 from Rodriguez-Gomez et al. (2015), bottom panels).
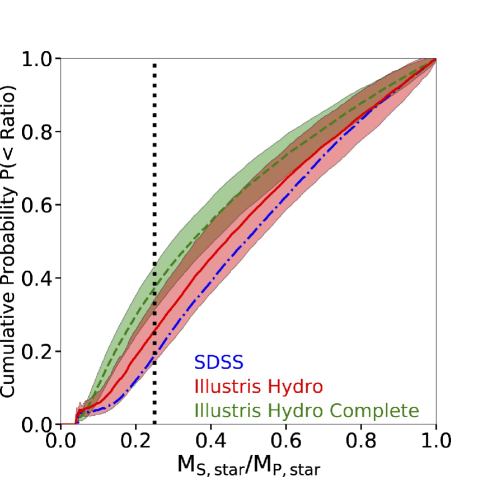
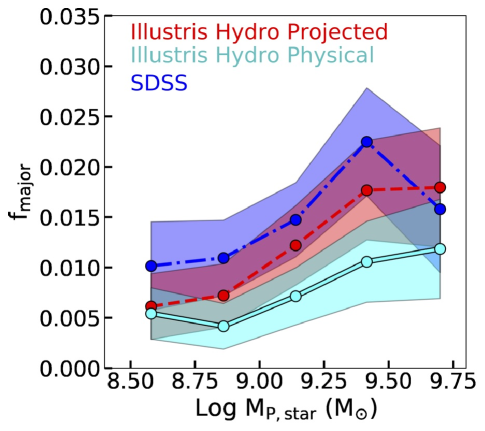
Fig. 14 plots fmajor, the number of all dwarf Primaries in a given stellar mass bin that have a Secondary dwarf galaxy companion with a stellar mass ratio of MM, normalized by the total number of dwarfs in the bin. Good agreement is found between the SDSS and Illustris Hydro Projected catalogs: the “Major Pair” fraction peaks at high Primary masses at a value of and steadily declines towards lower Primary masses, reaching a value of . The Illustris Hydro Physical catalog shows the same qualitative behaviour, but with lower values.
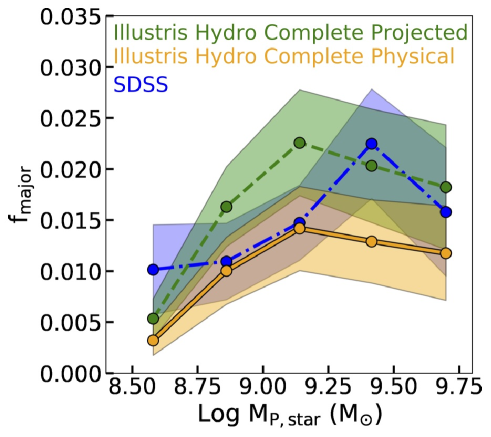
In Fig. 15 we assess how much incompleteness has affected our results using the Illustris Hydro Complete Projected and Physical catalogs, where sensitivity limits are removed and only a stellar mass floor of M⊙ is enforced (see Section 4.5). Both complete mock catalogs show the same qualitative behaviour. The complete mock “Major Pair” fraction stays roughly flat between Primary stellar masses (Mstar) = 9.1-9.4 M⊙ at an average value of for Illustris Hydro Complete Projected and for Illustris Hydro Complete Physical. This result is robust, as all catalogs are roughly complete at those masses.
Note that the sharp drop off at lower stellar mass bins is a direct result of the lower stellar mass limit, and is not physical.
We utilize these results to calibrate the SDSS “Major Pair” fraction for completeness using the fractional change in the Illustris Hydro Projected “Major Pair” fraction with (Fig. 14) and without (Fig. 15) the SDSS sensitivity limits. The result is plotted in the right panel of Fig. 15: the “Major Pair” fraction is cosmologically expected to continuously increase towards lower Primary stellar masses (within Log M). At lower Primary masses, the fraction levels off at 0.027, but this leveling off likely due to the lower stellar mass limits. This behaviour is qualitatively similar to that found by Casteels et al. (2014), who defined “Major Mergers” based on galaxy pair separation and asymmetry in the GAMA survey (Driver et al., 2009, 2011). Note, however that their study accounts for dwarfs in all environments, whereas we focus only on isolated systems.
Sales et al. (2013) find that the average satellite abundance is largely independent of Primary mass for galaxies with M M⊙). Here, we find that that the frequency of isolated “Major Pairs” appears to be a strong function of Primary stellar mass. But this apparent conflict is not surprising, given the rarity of “Major Pair” configurations.
Rodriguez-Gomez et al. (2015) derived the galaxy-galaxy “Major Merger” rate using merger histories computed with the SUBLINK code and the Illustris Hydro simulation. This is distinct from our method, as they count coalesced systems, whereas we identify dwarf pairs as distinct subhaloes333Note that deriving a “Major Merger” rate using our pair fractions is difficult as the orbital timescales of interacting dwarfs are unknown. From studies of the Magellanic Clouds (stellar mass ratio MS,star/MP,star = 0.1) the time of coalescence can be very long ( 6 Gyr, Pearson et al., 2018; Besla et al., 2016, see also,). We defer calculations of merger rates to a future study where we will study the kinematics of our dwarf multiples and orbital timescales in detail.. Rodriguez-Gomez et al. (2015) find that the “Major Merger” rate steadily declines with decreasing Primary stellar mass, whereas we find the opposite behaviour for “Major Pairs” at z0. This suggests that the galaxy merger timescale is both a function of redshift (Snyder et al., 2017) and galaxy mass, even at dwarf mass scales (see also Kitzbichler et al., 2008; Conselice et al., 2006). Note that we consider only isolated “Major Pairs”, whereas Rodriguez-Gomez et al. (2015) measure the “global Major Merger” rate, regardless of environment. It is plausible that environmental effects (e.g. the tidal field of the host) could impact the merger rate of dwarf pairs after capture by a more massive host.
Regardless, our result indicates that long-term, repetitive dwarf-dwarf interactions may play an important role in the SFHs, the origin of starbursts and gas removal processes in isolated dwarf galaxies. Because dwarf galaxies in the field have significant gas fractions (, Bradford et al., 2015; Geha et al., 2012), tidal interactions between dwarfs are more likely to remove gas than stars. The creation of extended, long-lived gas tidal structures around dwarf pairs will affect the nature of their circumgalactic medium and impact their baryon cycles, both in isolation and after accretion into a more massive environment (Pearson et al., 2018).
5.2 The Frequency of Isolated LMC & SMC Analogs
The closest example of dwarf-dwarf galactic pre-processing at work is the Magellanic System. The interacting dwarf pair, the Large Magellanic Cloud (LMC) and Small Magellanic Cloud (SMC), are enveloped by a massive ( M⊙; Fox et al., 2014) complex of gas called the Magellanic Stream, Bridge and Leading Arm (Mathewson et al., 1974; Putman et al., 2003; Nidever et al., 2010). This extended gaseous complex is primarily created by the tidal interaction between the two dwarfs (Besla et al., 2010; Diaz & Bekki, 2011; Besla et al., 2012, 2013; Guglielmo et al., 2014; Pardy et al., 2018). Furthermore, orbital solutions indicate that the Clouds are recent interlopers to our Galaxy (Kallivayalil et al., 2013; Besla et al., 2007). This implies that the Magellanic Clouds must have been a relatively isolated, interacting galaxy pair prior to their capture by the Milky Way. This study is designed to determine whether such isolated dwarf pair configurations are expected cosmologically.
The frequency of analogs of the Magellanic Clouds about massive hosts has been quantified in both cosmological simulations and SDSS, finding good agreement. Roughly, 40% of Milky Way analogs in both cosmological simulations and SDSS host an LMC-type galaxy (Boylan-Kolchin et al., 2011; Busha et al., 2011; Tollerud et al., 2011; Patel et al., 2017; Robotham et al., 2012). On the other hand, it is rare (2-5%) to find both an LMC and SMC analog in proximity to a massive host (Liu et al., 2011; Boylan-Kolchin et al., 2011; Busha et al., 2011; Robotham et al., 2012; Gonzalez et al., 2013). The observational statistics become minuscule if one further requires a Milky Way-LMC-SMC analog with clear signs of interaction between the two satellites or that the LMC/SMC analogs also be in close proximity to each other (James & Ivory, 2011; Paudel & Sengupta, 2017). However, the cosmologically expected frequency of LMC-SMC analogs (mass, separation, relative velocity) in the field is unknown.
From Fig. 13, we find that Primaries with companions of stellar mass ratios of 1:5 represent of each catalog of dwarf multiples. We refine this analysis to identify LMC-SMC analogs with similar separations, stellar masses, and mass ratio as the real system. LMC analogs are defined as dwarfs with stellar masses of M M M⊙. On average we find dwarfs satisfying these criteria in Illustris Hydro. The standard deviation results from a combination of scatter in the abundance matching relations and variations in the number of dwarfs in different realizations of the simulation volume.
We define SMC analogs as those dwarfs with stellar mass ratios of 1:15 LMC:SMC 1:5 and projected separations of r kpc to an LMC analog. Separation limits are motivated by Besla et al. (2012), who find a best fitting orbit for the LMC/SMC with apocenters reaching such distances. Examples of the properties for LMC/SMC analogs in one realization of the SDSS and mock catalogs are plotted in Figures 1 and 6 where LMC/SMC analogs are marked by symbols with orange outlines.
For all samples, LMC analogs that host SMC analogs have, on average, present day dark matter subhalo masses a factor of times more massive than those that do not, in agreement with the recent study by Shao et al. (2018). This result supports high mass models for the total dark matter mass of the LMC when it first entered the Milky Way (Besla et al., 2012; Peñarrubia et al., 2016, Garavito-Camargo, et al. in prep).
We further find that of LMC mass galaxies in the field host an SMC-like companion in both SDSS and Illustris Hydro Projected (averaged over 500 realizations of the catalogs). This result is confirmed in Illustris Hydro Physical, indicating that pairs selected with r kpc are robust to projection effects. Removing the observational sensitivity limits doubles the frequency of LMC/SMC analogs, but overall we find them to be very rare in the field (cosmologically and observationally). Of order 1% of LMC analogs are expected to be found with an SMC-mass companion in a catalog that is complete to SMC masses of M⊙.
Robotham et al. (2012) utilized the GAMA Survey to explore the frequency of LMC/SMC analogs as a function of environment. They found that 4.8% of galaxies with have a companion in this magnitude range within a projected separation of 100 kpc and velocity separation of 100 km/s (46 out of 1929 galaxies). This is higher than what we find here, but their results consider a wider range of environments. These authors find a higher probability of finding LMC/SMC analogs in proximity of a Local Group analog (within 1 Mpc). Indeed, half (27) of such pairs are within 1 Mpc of an L* galaxy and would fail our isolation criteria, where all dwarfs are at least 1.5 Mpc away from an L* type system. This reconciles our statistics with the GAMA study (% of GAMA LMC/SMC analogs would pass our isolation criteria).
While we find that LMC/SMC configurations are rare today, it is possible that they have been more frequent at earlier times. The good agreement between the mock catalogs and SDSS indicate that cosmological simulations are reasonable tools to explore the kinematics and frequency of such configurations across cosmic time, an analysis that we defer to a later study.
5.3 The TNT Dwarf Groups in a Cosmological Context
The TiNy Titans (TNT) survey of dwarf galaxy pairs identified in SDSS at low redshift () showed that the SFRs of dwarf pairs increase with decreasing pair separation. This suggests that coalescence is not required to induce a burst of star formation. Moreover, the secondary galaxy was typically the pair member undergoing the starburst. Together, these results strongly suggest that the average dwarf galaxy multiple fractions () that we have determined in previous sections, are important to understanding the drivers of starbursts in dwarf galaxies.
Lee et al. (2009) find that 6% of dwarfs within an 11 Mpc volume of the Milky Way are currently star bursting. In Section 4.5, we found that a comparable fraction (4%) of isolated dwarfs in SDSS should have a dwarf galaxy companion with angular separations , projected separations r kpc, physical separations kpc, and a relative velocity difference of 150 km/s.
Recently, Stierwalt et al. (2017) (hereafter S17) identified 7 isolated groups of dwarfs with 3 members or more at low redshift, including a group with 5 members. All dwarf groups are identified to have projected separations less than 80 kpc and most have separations greater than 15 kpc. Furthermore, most dwarf members have velocities relative to the Primary that are less 200 km/s. These properties are comparable to our selection criteria for the SDSS and Illustris Hydro Projected catalogs of dwarf multiples.
In Section 4.4 we found it highly improbable to find groups of 4 members or more at low redshift. At first glance these results seem at odds with S17. However, the dwarf stellar mass range explored in S17 extends to lower masses than we consider in this study. This coupled with our restrictive velocity cut of 150 km/s reduces 4 of the dwarf groups in S17 to dwarf pairs and makes 3 companionless. As such, the findings from S17 are consistent with our study, where we find that dwarfs within our mass range are more likely to be in pairs, rather than larger multiples.
Unfortunately, because of the mass limits adopted in our study (motivated by the observational sensitivity limits of the SDSS survey and mass resolution limits of the simulations), we cannot state with certainty that the S17 groups containing dwarfs with masses below (Mstar) =8.3 are consistent with cosmological expectations. Our results do suggest that high speed members (V 150 km/s) of quads or quints in the dwarf mass range explored in this study are likely projected contaminants. However, if quads are identified to satisfy the position and velocity (V 150 km/s) constraints of this study, the agreement between the frequency of quad identification in Illustris Hydro Projected and Illustris Hydro Physical (see Section 4) do suggest that they are not chance alignments.
6 Conclusions
The frequency of companions to isolated dwarf galaxies (Mstar = - M⊙) at low redshift () is quantified in the SDSS Legacy spectroscopic catalog (M14) and compared against cosmological expectations using mock catalogs constructed using the Illustris-1 hydrodynamic cosmological simulation (Illustris Hydro). We have chosen stellar mass and redshift ranges where the cosmological and observed catalogs can be reasonably compared, accounting for both the resolution of the simulation and the sensitivity limits of SDSS.
We define dwarf galaxies to be isolated if no Massive Galaxy (MM⊙) can be identified with both a relative velocity of km/s and a Tidal Index (Karachentsev et al., 2013).
Overall we find good agreement between SDSS and cosmological expectations for the fraction of dwarf multiples (pairs/groups) in isolated environments. Our main results are summarized in the following.
-
•
There are more dwarfs in the field in the cosmological simulations relative to SDSS. We confirm results from Klypin et al. (2015) that the abundance of mock dwarf galaxies in the field is higher than observed. Using Illustris Hydro, we find densities 2.0 times higher than in SDSS (Table 2). This overabundance of field dwarfs (where environmental effects are negligible) may indicate that many low-surface brightness dwarfs are currently missing from the SDSS spectroscopic catalog (Danieli et al., 2018; Greco et al., 2017), or may be reconciled with improved subgrid physics models (Wetzel et al., 2016) and the inclusion of reionization. Regardless, the solution must be consistent across the dwarf stellar mass range, as a similar fraction of dwarfs are missing in each mass bin, which may be challenging.
-
•
The fraction of isolated dwarfs as a function of stellar mass in SDSS agrees with cosmological expectations, (see Fig. 5). We thus focus our study on the fraction of dwarfs found in a multiple (pairs, triples, quads, etc.).
-
•
The mean number of companions per isolated dwarf is . We identify dwarf companions based on the following Projected criteria: 1) an angular separations of and a projected separation of r kpc; and 2) a relative line of sight velocity of km/s. Following the methodology of Patton et al. (2000) and applying these Projected criteria, we find the mean number of low mass companions per dwarf to be in SDSS, which agrees within 1 of the cosmological catalog ( 0.0340.005 for Illustris Hydro Projected). These fractions are certain to be higher if lower stellar mass companions were considered in this study.
-
•
40% of isolated dwarf multiples are false associations owing to projection effects. To assess the degree of contamination from projected pairs with large 3D separations, we add a requirement that all companions have a 3D separation of 300 kpc (Illustris Hydro Physical). This reduces by 40%, indicating a significant contamination fraction exists when selecting dwarf pairs based on projected properties. We calibrate the SDSS findings for contamination from such projection effects, finding a true average fractional number of physical companions per dwarf to be .
-
•
The majority of isolated dwarf multiples in our mass range are Pairs. Triples are rare and higher order multiples are cosmologically improbable within our adopted redshift, mass, separation and relative velocity limits. Less than % of mock or observed isolated dwarfs are found in a triple. Most mock triples in our mass range contain projected contaminants; most high order multiples are no longer identified when dwarf companions are required to have 3D separations 300 kpc Illustris Hydro Physical.
-
•
The recently discovered TNT groups (S17) are reconcilable with cosmological expectations. Our results do not conflict with the recent discovery of 7 high order dwarf multiples by the TNT group (S17), as most members of those groups would not satisfy our selection criteria, either owing to their low stellar mass or high relative speed, which reduce the groups to pairs or single dwarfs according to our selection criteria.
-
•
We predict the average number of companions per isolated dwarf to be in future surveys that are complete to M M⊙. We remove sensitivity limits to construct mock galaxy catalogs, applying instead a stellar mass floor of M M⊙. This increases the fraction of multiples by a factor of in Illustris Projected Hydro (). We utilize this result to calibrate the observed fraction of dwarf multiples in SDSS for future surveys, finding an expected average fraction of Projected companions per dwarf of . This value is expected to be roughly constant across the entire dwarf mass range explored in this study. Testing these predictions will require a spectroscopic complement to deep photometric imaging surveys (e.g the combination of both LSST and DESI).
-
•
% of isolated LMC analogs have an SMC-like companion. For surveys complete to M M⊙ (i.e., the stellar mass of the SMC) out to 100 Mpc, the cosmological catalogs indicate that 1% of LMC mass analogs are expected to have an SMC-like companion (stellar mass ratio of 1:5-1:15 and r kpc). This is in agreement with the SDSS catalogs and results from the GAMA survey (Robotham et al., 2012). We conclude that analogs of the LMC and SMC pair are rare in the field at low z.
-
•
The fraction of isolated “Major Pairs” increases with decreasing stellar mass in the dwarf regime. We find good agreement between the fraction of “Major Pairs”, dwarf pairs with stellar mass ratios , in SDSS and Illustris Hydro Projected (Fig. 14). Correcting the SDSS catalog for completeness, the “Major Pair” fraction increases with decreasing stellar mass, from 0.015 at LMC masses to 0.027 at lower masses. This is the opposite behaviour of the cosmological “Major Merger” rate, defined by the coalescence of two galaxies identified by the extracted merger trees for each decendent halo (Rodriguez-Gomez et al., 2015). This suggests that the merger timescales for dwarfs are not only redshift-dependent (Snyder et al., 2017) but also mass-dependent.
The good agreement between observations and cosmological expectations for the fraction of dwarf multiples at z=0 indicates that we can reasonably utilize the kinematic properties of cosmological dwarfs multiples to understand their dynamical state and merger timescales across cosmic time.
Acknowledgements
We thank Marla Geha, Greg Snyder and Nicolas Garavito-Camargo for useful conversations that have facilitated this work. We also thank the Illustris collaboration for making their subhalo catalogs and merger trees publicly available.
G.B. acknowledges that this material is based on work supported by the National Science Foundation under grant AST 1714979. N.K. is supported by NSF CAREER award 1455260. D.R.P. acknowledges the support of the Natural Sciences and Engineering Research Council of Canada (NSERC).
The analysis in this study was carried out using the the El Gato cluster at the University of Arizona, which is funded by the National Science Foundation through Grant No. 1228509.
This work has also used catalogs from the NASA Sloan Atlas and the SDSS. Funding for the NASA Sloan Atlas has been provided by the NASA Astrophysics Data Analysis Program (08-ADP08-0072) and the NSF (AST- 1211644).
Funding for SDSS-III has been provided by the Alfred P. Sloan Foundation, the Participating Institutions, the National Science Foundation, and the U.S. Department of Energy Office of Science. The SDSS-III web site is http://www.sdss3.org/.
SDSS-III is managed by the Astrophysical Research Consortium for the Participating Institutions of the SDSS-III Collaboration including the University of Arizona, the Brazilian Participation Group, Brookhaven National Laboratory, Carnegie Mellon University, University of Florida, the French Participation Group, the German Participation Group, Harvard University, the Instituto de Astrofisica de Canarias, the Michigan State/Notre Dame/JINA Participation Group, Johns Hopkins University, Lawrence Berkeley National Laboratory, Max Planck Institute for Astrophysics, Max Planck Institute for Extraterrestrial Physics, New Mexico State University, New York University, Ohio State University, Pennsylvania State University, University of Portsmouth, Princeton University, the Spanish Participation Group, University of Tokyo, University of Utah, Vanderbilt University, University of Virginia, University of Washington, and Yale University.
Appendix A Comparison with Illustris-Dark-1
Throughout this study we have utilized the Illustris Hydro simulation. Here we show that our results are consistent using the dark matter only version of the simulation, Illustris-Dark-1.
We follow the same methodology as outlined in Section 2.2.1 to assign a stellar mass to each subhalo in the simulation. The number density of isolated mock dwarfs in Illustris-Dark-1 is , in good agreement with Illustris Hydro (see Table 2).
In the left panel of Fig. 16, we plot the mean number of companions per dwarf per stellar mass bin () for the SDSS catalog, Illustris Hydro Projected catalog and its dark matter only counterpart, marked as Illustris Dark Projected. This figure is comparable to Fig. 7. Note that the dwarf multiples are selected using only the Projected selection criteria of Section 4.1.1. The mock catalogs agree within 1, but the Illustris Dark Projected results are consistently higher. The average for the entire sample of multiples in Illustris Dark Projected is , in good agreement with the Illustris Hydro Projected catalog (Table 3). Results for multiples selected using the Physical selection criteria show similar agreement.
The right panel of Fig. 16 shows the “Major Pair” fraction per Primary stellar mass bin for the same catalogs. Again, results agree within 1 and both mock catalogs exhibits the same behaviour as a function of stellar mass. We conclude that the results presented in this study using Illustris Hydro are robust to baryonic effects, which might destroy subhalos or change their kinematics.
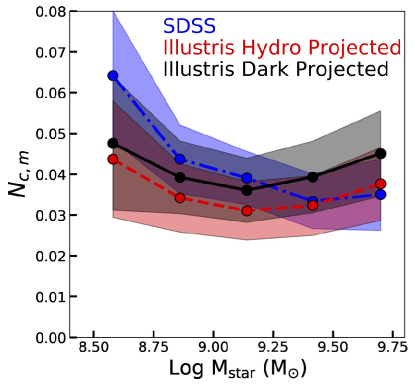
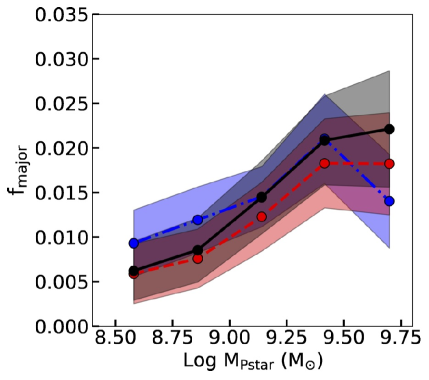
References
- Abazajian et al. (2009) Abazajian, K.N., et al. 2009, ApJS, 192, 543
- Bell et al. (2006) Bell, E.F., Phleps, S., Somerville, R.S., Wolf, C., Borch, A., & Meisenheimer, K. 2006, ApJ, 652, 270
- Behroozi et al. (2015) Behroozi, P.S., Zhu, G., Ferguson, H.C., Hearin, A.P., Lotz, J., Silk, J., Kassin, S., Lu, Y., Croton, D., Somerville, R.S., & Watson, D.F. 2015, MNRAS, 450, 1546
- Berrier et al. (2006) Berrier, J.C., Bullock, J.S., Barton, E.J., Guenther, H.D., Zentner, A.R., & Wechsler, R.H. 2006, ApJ, 652, 56
- Besla et al. (2007) Besla, G., Kallivayalil, N., Hernquist, L., Robertson, B., Cox, T.J., van der Marel, R.P., & Alcock, C. 2007, ApJ, 668, 949
- Besla et al. (2010) Besla, G., Kallivayalil, N., Hernquist, L., van der Marel, R.P., Cox, T.J., & Keres̃, D. 2010, ApJ, 721, 97
- Besla et al. (2012) Besla, G., Kallivayalil, N., Hernquist, L., van der Marel, R.P., Cox, T.J., & Keres̃, D. 2012, MNRAS, 421, 2109
- Besla et al. (2013) Besla, G., Hernquist, L. & Loeb, A. 2013, MNRAS, 428, 2342
- Besla et al. (2016) Besla, G., Martínez-Delgado, D., van der Marel, R. P., Beletsky, Y., Seibert, M., Schlafly, E. F., Grebel, E. K. & Neyer, F., ApJ, 825, 20
- Binggeli et al. (1998) Binggeli, B., Sandage, A., & Tammann, G. A. 1988, ARAA, 26, 509
- Blanton et al. (2005) Blanton, M.R., Lupton, R. H., Schlegel, D. J., et al. 2005, ApJ, 631, 208
- Blumenthal et al. (1984) Blumenthal, G.R., Faber, S.M., Primack, J.R. & Rees, M.J. 1984, Nature, 311, 517
- Boylan-Kolchin et al. (2011) Boylan-Kolchn, M., Besla, G., & Hernquist, L. 2011, MNRAS, 414, 1560
- Bradford et al. (2015) Bradford, J., Geha, M.C., & Blanton, M.R. 2015, ApJ, 809, 146
- Bundy et al. (2004) Bundy, K., Fukugita, M., Ellis, R.S., Kodama, T., & Conselice, C.J., 2004, ApJ601, L123
- Busha et al. (2011) Busha M. T., Marshall P. J., Wechsler R. H., Klypin A., & Primack J., 2011, ApJ, 743, 40
- Carlberg et al. (2000) Carlberg, R.G., Cohen, J.G., Patton, D.R., Blandford, R., Hogg, D.W., Yee, H.K.C., Morris, S.L., Lin, H., Hall, P.B., Sawicki, M., Wirth, G.D., Cowie, L.L., Hu, E. & Songaila, A. 2000, ApJ, 532, L1-L4
- Casteels et al. (2014) Casteels, K.R.V., et al. 2014, MNRAS, 445, 1157
- Chua et al. (2017) Chua, K. T. E., Pillepich, A., Rodriguez-Gomez, V., Vogelsberger, M., Bird, S., & Hernquist, L. 2017, MNRAS, 472, 4343
- Conselice et al. (2003) Conselice, C.J., Bershady, M.A., Dickinson, M., & Papovich, C. 2003, AJ, 126, 1183
- Conselice et al. (2006) Conselice, C.J. ApJ, 638, 686
- Cui et al. (2012) Cui, W., Borgani, S., Dolag, K., Murante, G. & Tornatore, L. 2012, MNRAS, 423, 2279
- Danieli et al. (2018) Danieli,S., van Dokkum, P. & Conroy, C. 2018, ApJ, 856, 69
- de Vaucouleurs & Freeman (1972) de Vaucouleurs, G., & Freeman, K. C. 1972, Vistas Astron., 14, 163
- Deason et al. (2015) Deason, A.J., Wetzel, A.R., Garrison-Kimmel, S. & Belokurov, V. 2015, MNRAS, 453, 3568
- Di Cintio et al. (2014) Di Cintio, A., Brook, C.B., Dutton, A.A., Macciò, A.V., Stinson, G.S., & Knebe, A. 2014, MNRAS, 441, 2986
- Diaz & Bekki (2011) Diaz, J., & Bekki, K. 2011, MNRAS, 413, 2015
- Dolag et al. (2009) Dolag, K., Borgani, S., Murante, G., & Springel, V. 2009, MNRAS, 399, 497
- Dooley et al. (2017) Dooley, G. A., Peter, A. H. G., Carlin, J. L., Frebel, A., Bechtol, K., & Willman, B. 2017, MNRAS, 472, 1060
- Driver et al. (2009) Driver, S.P. et al. 2009, Astronomy & Geophysics, 50, 5.12
- Driver et al. (2011) Driver, S.P. et al. 2011, MNRAS, 413, 971
- Emerick et al. (2016) Emerick, A., Mac Low, M-M, Grcevich, J. & Gatto, A. 2016, ApJ, 826, 148
- Fillingham et al. (2016) Fillingham, S.P., Cooper, M.C., Pace, A.B., Boylan-Kolchin, M., Bullock, J.S., Garrison-Kimmel, S., & Wheeler, C. 2016, MNRAS, 463, 1916
- Fattahi et al. (2010) Fattahi,A., Navarro, J.F., Starkenburg, E., Barber, C.R., & McConnachi, A.W. MNRAS, 431, 73
- Fox et al. (2014) Fox, A. et al. 2014, ApJ, 787, 147
- Geha et al. (2006) Geha, M., Blanton, M.R., Masjedi, M., & West, A.A. 2006, ApJ, 653, 240
- Geha et al. (2012) Geha, M., Blanton, M.R., Yan, R., & Tinker, J.L. 2012,ApJ, 757, 85
- Genel et al. (2014) Genel, S., Vogelsberger, M., Springel, V., Sijacki, D., Nelson, D., Snyder, G., Rodriguez-Gomez, V., Torrey, P., & Hernquist, L. 2014, MNRAS, 445, 175
- Gonzalez et al. (2013) Gonzalez R. E., Kravtsov A. V., & Gnedin N. Y., 2013, ApJ, 770, 96 ´
- Gonzalez & Padilla (2016) Gonzalez R. E., & Padilla, N.D. 2016, ApJ, 829, 58
- Grcevich & Putman (2009) Grcevich, J. & Putman, M.E. 2009, ApJ, 696, 385-395
- Greco et al. (2017) Greco, J. P., Greene, J. E., Strauss, M. A., MacArthur, L. A., Flowers, X., Goulding, A. D., Huang, S., Kim, J. H., Komiyama, Y., Leauthaud, A., Leisman, L., Lupton, R. H., Sifón, C., Wang, S.-Y. 2017, arXiv 1709:04474
- Guglielmo et al. (2014) Guglielmo M., Lewis G. F., & Bland-Hawthorn J., 2014, MNRAS, 444, 1759
- Guo & White (2008) Guo, Q. & White, S. 2008, MNRAS, 384, 2
- Harris & Zaritsky (2006) Harris J., & Zaritsky D., 2006, AJ, 131, 2514
- Hinshaw et al. (2013) Hinshaw, G. et al. 2013, ApJS, 208, 19
- Hopkins et al. (2010) Hopkins, P.F., Croton, D., Bundy, K., Khochfar, S., van den Bosch, F., Somerville, R.S., Wetzel, A., Keres̃, D., Hernquist, L., Stewart, K., Younger, J.D., Genel, S., & Ma, C.-P. 2010, ApJ, 724, 915
- Hunter (2007) Hunter, J. D. 2007, Computing in Science Engineering, 9, 90
- James & Ivory (2011) James P. A., & Ivory C. F., 2011, MNRAS, 411, 495
- Kallivayalil et al. (2013) Kallivayalil, N., van der Marel, R. P., Besla, G., Anderson, J., & Alcock, C., 2013, ApJ, 764, 161
- Karachentsev et al. (2004) Karachentsev, I. D., Karachentseva, V, E., Huchtmeier, W. K. & Makarov, D. I. 2004, AJ, 127, 2031
- Karachentsev et al. (2013) Karachentsev, I. D., Makarov, D. I., & Kaisina, E. I. 2013, AJ, 145, 101
- Kitzbichler et al. (2008) Kitzbichler, M. G. & White, S. D. M. MNRAS, 391, 1489
- Klypin et al. (2015) Klypin, A., Karachentsev, I., Makarov, D., & Nasonova, O. 2015, MNRAS, 454, 1798
- Kravtsov et al. (2010) Kravtsov, A.V. 2010, AdAst, 2010, 1
- Lacey & Cole (1993) Lacey, C., & Cole, S. 1993, MNRAS262, 627
- Lee et al. (2009) Lee, J.C., Kennicutt, R.C., Funes, S.J.J.G., Sakai, S., & Akiyama, S., 2009, ApJ, 692, 1305
- Lelli et al. (2014) Lelli, F., Fraternali, F., & Verheijen, M. 2014, A&A, 563, 27
- Lin et al. (2008) Lin, L., Patton, D.R., Koo, D.C., Casteels, K., Conselice, C., Faber, S.M., Lotz, J., Willmer, C.N.A., Hsieh, B.C., Chiueh, T., Newman, J.A., Novak, G.S., Weiner, B.J., & Cooper, M.C. 2008, ApJ, 681, 232
- Liu et al. (2011) Liu L., Gerke B. F., Wechsler R. H., Behroozi P. S., & Busha M. T., 2011, ApJ, 733, 62
- Lotz et al. (2011) Lotz, J., Johnsson, P., Cox, T.J., Croton, D., Primack, J.R., Somerville, R.S., & Stewart, K. 2011, ApJ, 742, 103
- Maller et al. (2006) Maller, A. H., Katz, N., Keres̃, D., Davé, R. & Weinberg, D. H. 2006, 647, 763
- Man et al. (2016) Man, A.W.S., Zirm, A. W., & Toft, S. 2016, ApJ, 830, 89
- Mantha et al. (2018) Mantha, K.B., et al. 2018, MNRAS, 475, 1549
- Mundy et al. (2017) Mundy, C. J., Conselice, C. J., Duncan, K. J., Almaini, O., Häußler, B., & Hartley, W. G. 2017, MNRAS, 470, 3507
- Marasco et al. (2016) Marasco, A., Crain, R.A., Schaye, J., Bahe, Y.M., van der Hulst, T., Theuns, T., & Bower, R.G. 2016, MNRAS, 461, 2630
- Mathewson et al. (1974) Mathewson, D.S., Cleary, M.N., & Murray, J.D. 1974, ApJ, 190, 291
- McConnachie et al. (2008) McConnachie, A. W., Ellison, S. L., Patton, D. R. 2008, MNRAS, 387, 1281
- Mendel et al. (2014) Mendel, J. T., Simard, L., Palmer, M., Ellison, S. L., & Patton, D. R. 2014, ApJS, 210, 3
- Moster et al. (2013) Moster, B.P., Naab, T., & White, D.M. 2013, MNRAS, 428, 3121
- Nelson et al. (2015) Nelson D. et al., 2015, Astron. Comput., 13, 12
- Nidever et al. (2010) Nidever, D.L., Majewski, S.R., Burton, W.B., & Nigra, L. 2010,ApJ, 723, 1618
- Noeske et al. (2001) Noeske, K.G., Iglesias-Páramo, J., Vílchez, J. M., Papaderos, P., & Fricke, K. J. 2001, A&A, 371, 806
- Odewahn et al. (1994) Odewahn S. C. 1994, AJ, 107, 1320
- Patel et al. (2017) Patel E., Besla G., & Sohn S. T., 2017, MNRAS, 464, 3825
- Patton et al. (2000) Patton, D. R., Carlberg, R. G., Marzke, R. O., Pritchet, C. J., da Costa, L. N., & Pellegrini, P. S. 2000, ApJ, 536, 153
- Patton et al. (2002) Patton, D.R., Pritchett, C.J., Carlberg, R.G., Marzke, R.O., Yee, H.K.C., Hall, P.B., Lin, H., Morris, S.L., Sawicki, M., Shepherd, C.W., & Wirth, G.D. 2002, ApJ, 565, 208
- Patton & Atfield (2008) Patton, D. R., & Atfield, J. E. 2008, ApJ, 685, 235
- Patton et al. (2013) Patton, D.R., Torrey, P., Ellison, S.L., Mendel, J.T. & Scudder, J.M. 2013, MNRAS, 433, L59
- Patton et al. (2016) Patton, D. R., Qamar, F. D., Ellison, S. L., Bluck, A. F. L., Simard, L., Mendel, J. T., Moreno, J., & Torrey, P.. 2016, MNRAS, 461, 2589
- Pardy et al. (2018) Pardy, S. A., D’Onghia, E., & Fox, A. J. 2018, arXiv 1802.01600
- Perez & Granger (2007) Perez, F., & Granger, B. E. 2007, Computing in Science Engineering, 9, 21
- Paudel & Sengupta (2017) Paudel, S. & Sengupta, C. 2017, ApJ, 849, 28
- Pearson et al. (2016) Pearson, S., Besla, G., Putman, M.E., Lutz, K.A., Fernandez, X., Stierwalt, S., Patton, D.R., Kim, J., Kallivayalil, N., Johnson, K., & Sun, E.-C. 2016, MNRAS, 459, 1827
- Pearson et al. (2018) Pearson, S., Privon, G., Besla, G., Putman, M.E., Martínez-Delgado, D., Johnston, K.V., Gabany, R.J., Patton, D.R. & Kallivayalil, N., 2018 arXiv 1807.03791
- Peng et al. (2010) Peng,Y.-J., et al. 2010, ApJ, 721, 193
- Peñarrubia et al. (2016) Peñarrubia, J., Gómez, F. A., Besla, G., Erkal, D. & Ma, Y.-Z. 2016, MNRAS, 456, 54
- Putman et al. (2003) Putman M. E., Staveley-Smith L., Freeman K. C., Gibson B. K., & Barnes, D. G., 2003, ApJ, 586, 170
- Privon et al. (2017) Privon, G. C., Stierwalt, S., Patton, D. R., Besla, G., Pearson, S., Putman, M., Johnson, K. E., Kallivayalil, N., Liss, S., & Titans, TiNy. 2017, MNRAS, 468, 885
- Robotham et al. (2012) Robotham, A.S.G., et al. 2012, MNRAS, 424, 1448
- Rodriguez-Gomez et al. (2015) Rodriguez-Gomez V. et al., 2015, MNRAS, 449, 49
- Rodriguez-Gomez et al. (2017) Rodriguez-Gomez V. et al., 2017, MNRAS, 467, 3083
- Salem et al. (2015) Salem, M., Besla, G., Bryan, G., Putman, M., van der Marel, R.P., & Tonnesen, S. 2015, ApJ, 815, 77
- Sales et al. (2013) Sales, L., Wang, W., White, S.D.M. & Navarro, J.F. 2013, MNRAS, 428, 573
- Sánchez-Janssen et al. (2013) Sánchez-Janssen, R, Amorín, R., García-Vargas, M., Gomes, J. M., Huertas-Company, M., Jiménez-Esteban, F., Mollá, M., Papaderos, P., Pérez-Montero, E., Rodrigo, C., Sánchez Almeida, J., & Solano, E. 2013, A&A, 554, 20.
- Sawala et al. (2013) Sawala, T. Frenk, C. S., Crain, R. A., Jenkins, A., Schaye, J., Theuns, T., & Zavala, J. 2013, MNRAS, 431, 1366
- Schaye et al. (2015) Schaye, J. et al. 2015, MNRAS, 446, 521
- Shao et al. (2018) Shao, S., Cautun, M., Deason, A.J., & Frenk, C.S. 2018, arXiv 1803.07269
- Simard et al. (2011) Simard, L., Mendel, J. T., Patton, D. R., Ellison, S. L., & McConnachie, A. W. 2011, ApJS, 196, 11
- Snyder et al. (2017) Snyder, G. F., Lotz, J. M., Rodriguez-Gomez, V., Guimarães, R. d. S., Torrey, P., & Hernquist, L. 2017, MNRAS, 468, 207
- Spekkens et al. (2014) Spekkens, K., Urbancic, N., Mason, B. S., Willman, B., & Aguirre, J. E. 2014, ApJ, 795, 5
- Springel et al. (2001) Springel V., White S. D. M., Tormen G., & Kauffmann G., 2001, MNRAS, 328, 726
- Springel et al. (2017) Springel, V., Pakmor, R., Pillepich, A., Weinberger, R., Nelson, D., Hernquist, L., Vogelsberger, M., Genel, S., Torrey, P., Marinacci, F., & Naiman, J. 2017, MNRAS, 475, 676
- Stanimirovic et al. (2004) Stanimirovic S., Staveley-Smith L., & Jones P. A., 2004, ApJ, 604, 176
- Stierwalt et al. (2015) Stierwalt, S., Besla, G., Patton, D., Johnson, K., Kallivayalil, N., Putman, M., Privon, G. & Ross, G. 2015, ApJ, 805, 2
- Stierwalt et al. (2017) Stierwalt, S., Liss, S. E., Johnson, K. E., Patton, D. R., Privon, G. C., Besla, G., Kallivayalil, N., & Putman, M. 2017, Nat. Astronomy, 1, 25 [S17]
- Tollerud et al. (2011) Tollerud E. J., Boylan-Kolchin M., Barton E. J., Bullock J. S., & Trinh C. Q., 2011, ApJ, 738, 102
- Tully et al. (2006) Tully, R. B, Rizzi, L., Dolphin, A. E., Karachentsev, I. D., Karachentseva, V. E., Makarov, D. I., Makarova, L., Sakai, S., & Shaya, E. J. 2006, AJ, 132, 729
- van den Bergh et al. (2006) van den Bergh, S. 2006, AJ, 132, 1571
- van der Marel et al. (2009) van der Marel R. P., Kallivayalil N.,& Besla G., 2009, in van Loon J. T., Oliveira J. M., eds, Proc. IAU Symp. 256, The Magellanic System: Stars, Gas and Galaxies. Cambridge Univ. Press, Cambridge, p. 81
- van der Marel et al. (2002) van der Marel R. P., Alves D. R., Hardy E., & Suntzeff N. B., 2002, AJ, 124, 2639
- van der Marel & Kallivayalil (2014) van der Marel R. P., & Kallivayalil N., 2014, ApJ, 781, 121
- van der Walt et al. (2011) van der Walt, S., Colbert, S. C., & Varoquaux, G. 2011, Computing in Science Engineering, 13, 22
- Ventou et al. (2017) Ventou, E., Contini, T., Bouché, N., Epinat, B., Brinchmann, J., Bacon, R., Inami, H., Lam, D., Drake, A., Garel, T., Michel-Dansac, L., Pello, R., Steinmetz, M., Weilbacher, P. M., Wisotzki, L., & Carollo, M. 2017, A&A, 608, A9
- Vogelsberger et al. (2014) Vogelsberger M. et al., 2014, Nature, 509, 177
- Weisz et al. (2011) Weisz, D., Dalcanton, J.J., Williams, B.F., Gilbert, K.M., Skillman, E.D., Seth, A.C., Dolphin, A.E., McQuinn, K.B.W, Gogarten, S.M., Holtzman, J, Rosema, K., Cole, A., Karachentsev, I.D., & Zaritsky, D. 2011, ApJ, 739, 5
- Wellons & Torrey (2017) Wellons, S. & Torrey, P. 2017, MNRAS, 467, 3887
- Wetzel et al. (2015) Wetzel, A.R., Deason, A.J., & Garrison-Kimmel, S. 2015, ApJ, 807, 49
- Wetzel et al. (2016) Wetzel, A.R., Hopkins, P. F., Kim, J.-h., Faucher-Giguère, C.-A., Keres̃, D., & Quataert, E. 2016, ApJ, 827, 23
- Wilcots & Prescott (2004) Wilcots, E.M. & Prescott, M.K. 2004, AJ, 127, 1900
- Wyithe & Loeb (2006) Wyithe, J.S.B. & Loeb, A. 2006, Nature, 441, 322
- Zepf et al. (1989) Zepf, S.E., & Koo, D.C. 1989, ApJ, 337, 34