2018/03/03\Accepted2018/07/17
galaxies: active — galaxies: nuclei — galaxies: Seyfert — galaxies: kinematics and dynamics — galaxies: individual (IRAS 04576+0912)
A 100-pc Scale, Fast and Dense Outflow in Narrow-Line Seyfert 1 Galaxy IRAS 04576+0912
Abstract
We report the initial result of an adaptive-optics assisted, optical integral-field-unit observation on IRAS 04576+0912, the nearest () active galactic nucleus with a prominent blueshift/tail in [O III] emission from a sample of such objects that we have collected from the literature. We aim at addressing the putative quasar-mode feedback process with Subaru/Kyoto 3D IIAO188. The optical waveband (6400–7500Å) enables us to measure the gas density via the [S II] doublets, in contrast to earlier Near-IR studies. Since the fast [O III] outflow happens only around rapidly growing central black holes, this object is suitable for investigating the black hole-galaxy coevolution. The obtained data cube exhibits blue tail in the [S II] emission at many lenslets. By fitting the spectrum with the high excess flux at the [S II] blue tail, we find the fast (860 km/s), dense (3000/cc), wide-angle and offset outflow in central 100-pc scales. Although the large opening angle and the high gas outflow-to-accretion ratio may favour the feedback hypothesis, the inferred kinetic power injection rate of this ionized gas outflow seems insufficient to influence the whole host galaxy. A conventional assumption of a low density must have overestimated the feedback process.
1 Introduction
Various investigations on the evolution of galaxies and massive black holes (BHs) indicate a strong outflow, driven by the radiation from the accretion disk of active galactic nuclei (AGNs) (e.g., Silk & Rees 1998). It is required to self-regulate star formation of host galaxies and to hamper producing too massive galaxies (“quasar-mode feedback”; e.g., Schawinski et al. 2007). There are many evidences for outflows from AGNs, observed as C IV bluetail, [O III] blueshift, broad and narrow absorption lines (BALs and NALs), X-ray and many other lines (e.g., Sulentic et al. 2007; Zamanov et al. 2002). Winds from quasars may have played a major role in the BH-galaxy coevolution (e.g., Wyithe & Loeb 2003; Di Matteo et al. 2005).
However, a similarly numerous works indicate that the AGN feedback is not efficient enough (Gabor et al. 2014; Balmaverde et al. 2016; Carniani et al. 2016; Villar-Martin et al. 2016).
Due to the lack of density indicators or sufficient spatial resolution in earlier observations, basic questions on the putative quasar-mode feedback, such as if there is really the quasar-mode feedback, if it is powerful enough to quench star formation, or if every AGN launches the feedback, are still unclear.
We then carried out an adaptive-optics (AO) assisted, optical integral-field-unit (IFU) observations for nearby AGNs that are plausible candidates in the act of feedback. Our targets are selected from objects that evidently show blueshifted components in [O III] emission in conventional long-slit spectroscopic data.
Optical wave-band we chose (6400–7500Å) enables us to measure the gas density via the flux ratio of the [S II]6716, 6731Å doublet emission lines (Osterbrock & Ferland 2006). AO-IFUs other than Kyoto 3D II work only at Near-IR band, and hence previous AO-IFU studies assumed the density (e.g., Storchi-Bergmann et al. 2009; Mazzalay et al. 2013), resulting in large uncertainties in the mass outflow rate and the kinetic power etc of the feedback process.
We use Kyoto 3D II with AO188 mounted on Subaru telescope (Sugai et al. 2010; Matsubayashi et al. 2016). Long-slit spectroscopic data for AGN outflows (e.g., broad wings of emission lines, BALs and NALs) have uncertainties in the geometry and the covering factor, and thus to what degree the outflow influences the interstellar medium (ISM) is unclear. Previous optical IFU observations were not implemented with AO (e.g., Barbosa et al. 2009; Cresci et al. 2015; Lena et al. 2015). The AO assistance is critical for both mapping the outflow with a high spatial sampling (Husemann et al. 2016) and substantial reduction of the major noise source (i.e., broad lines and continuum emission).
In this Letter, we report the initial result of our observation for the nearest AGN with prominent [O III] blueshift from a sample of such objects that we have collected from the literature. In the next section, we briefly describe the selection for our target. Then, observational setups and data reduction are shortly summarised. In §4, we present the results on the 100 pc scale, fast and dense outflow. Finally, we make a summary of this study and discussion in §5. We adopt the standard CDM cosmology, with , and km s-1 Mpc-1.
2 Target Selection
We regard that targets selected from [O III] blueshifting samples are desirable to examine the putative AGN feedback process. This selection ensures that the outflow takes place in the narrow-line region (NLR), overflowing beyond the gravitational potential well of the central BH (1 pc for a BH). Outflow in the broad line region (at 0.01 pc from the center; observed in C IV, X-ray or BALs) is not sure whether it overflows to the galactic scale (kpc) or it is to fall back again.
Our targets are narrow-line Seyfert 1 galaxies (NLS1s), harbouring rapidly growing massive BHs (Kawaguchi 2003; Kawaguchi et al. 2004). The [O III] blueshift (with velocity up to 1000 km/s) occurs only at the phase with high accretion rates onto central BHs (namely, mostly in NLS1s; Aoki, Kawaguchi & Ohta 2005; Marziani et al. 2003; Boroson 2005; Komossa et al. 2008). If the AGN feedback process is really efficient, we will then unveil the BH-galaxy coevolution in the early stage of BH growth. The outflow velocity depends on neither the radio power nor radio loudness (Aoki et al. 2005), indicating that the outflow is not powered by small-scale jets.
AGNs with prominent blueshifts in [O III] emission lines are summarised by Aoki et al. (2005) and Komossa et al. (2008). To ensure the highest spatial resolution in physical scale, we chose the nearest one among the objects with measured/expected NLR size larger than 1” in the two literatures. The nearest object, IRAS 04576+0912 at redshift of 0.039 (§ 4.4), is a SBa galaxy (Ohta et al. 2007). The field-of-view (FoV) and the spatial sampling of Kyoto 3D II ( and ) corresponds to 2.41.9 kpc and 65 pc, respectively. Its optical spectrum (Véron-Cetty et al. 2001) shows the blueshift in [O III]4959, 5007Å and [N II]6584Å emission lines, by 300 km/s (Aoki et al. 2005) from the velocity that matches with the Balmer lines.
The FWHMs of H and H emission lines are 1100 km/s and 1210–1220 km/s, respectively (Véron-Cetty et al. 2001). The estimated BH mass, the bolometric luminosity and the Eddington ratio are , 6.2 1044 erg/s and 1.15, respectively (Aoki et al. 2005). In a diagram of the BH mass versus the optical luminosity (Kawaguchi 2003), IRAS 04576 is a typical NLS1 and its accretion rate onto the central BH is estimated to be 0.8 /yr.
3 Observation and Data Reduction
On the night of 24 September 2015, we observed IRAS 04576 and the spectrophotometric standard star (BD+21 607) with Subaru/Kyoto 3D II+AO188 in laser guide star (LGS) mode. Unfortunately, we could use only a half of the FoV due to a temporal detector trouble. We took 7 frames, with 1200 sec exposure time for each frame. We used the nearby star, 17” apart from the center to NE with mag, as the tip-tilt guide star. During the exposures, the image size (FWHM) of the guide star was about 0.”35–0.”45. The spectral resolution is 1200, and the wavelength coverage is 6400–7500 Å.
Data reduction is carried out using custom made IRAF scripts (Sugai et al. 2010) adapted for the newly installed deep depletion CCD (Mitsuda et al. 2016). The reduction process includes bias subtraction, spectrum extraction, flat fielding. Cosmic-rays were removed using L.A.Cosmic (van Dokkum 2001). After wavelength calibration, sky subtraction was performed referring the sky aperture spectra. Kyoto 3D II simultaneously obtains the spectra of the object and the sky away from the object field. Flux was calibrated using the standard star. Atmospheric absorption features were corrected using the normalized spectrum of the standard star because it is an early type (F2) star. After converting to the heliocentric velocity, the 7 frames are combined. Then, spectral fitting throughout this study is carried out by our own python code.
4 Line Fitting and the Results
Before fitting the narrow emission lines, we fix the two issues that affect their measurements, in the next subsection.
4.1 Laser-Induced Sky Emission and Broad Emission Line
The LGS laser excites atmospheric molecules, enhancing their sky emissions via the Raman scattering (Vogt et al. 2017). The enhancement is weaker at the science FoV than the sky field, since the secondary mirror tends to hide the former from the scattered light. As a result of sky subtraction, an artificial ”absorption” line, at Å (between H and [N II] 6583Å lines) due to N2 molecules in our case, appears in each science spectrum. We fit the sky spectrum with a Gaussian, and determined the wavelength and the width.
A Fabry-Perot, narrowband engineering observation in February 2015 showed that the ”absorption” depth is constant for the whole science FoV. By fitting the spectra at the north-east and the west ends, showing the clearest ”absorption” (with the negative flux density at the corresponding wavelengths), we derive the mean depth of the ”absorption”, and use it for all the analysis hereafter.
Next, we fix the shape of the broad H emission line. Since the intrinsic size of the broad line region is about 0.01 pc ( the angular size of 1 lenslet) and the apparent spatial extent is due to the point-spread-function (PSF) smearing, the line profile should be common among lenslets. We examine which function, among single Gaussian, double Gaussian and single Lorentzian, can successfully fit the broad line simultaneously in different spatial regions (four regions in middle left panel of Fig. 1). We find the double Gaussian most successful. Of the two components of the double Gaussian, the narrower and higher one has the central wavelength and the FWHM of 6817.96 Å and 1306 km/s, while the broader and lower one has 6814.41 Å and 2579 km/s, respectively. The peak ratio between the second over the first of 0.49 is fixed for the entire FoV.
4.2 Fit with Single Narrow-Line Component
For the 615 lenslets that have large enough flux at line-free wavelengths compared with the sky spectrum, we fit each spectrum at 6600–7200 Å by a combination of a linear continuum, a broad H emission line (§ 4.1) and a single Gaussian velocity component of narrow emission lines with a common line-width composed of H, [N II]6548, 6583Å and [S II]6716, 6731Å. The line ratio of [N II] is fixed so that the 6548Å/6583Å flux ratio is 0.34. In figure 1, maps of various line flux, flux ratio and the velocity are shown.
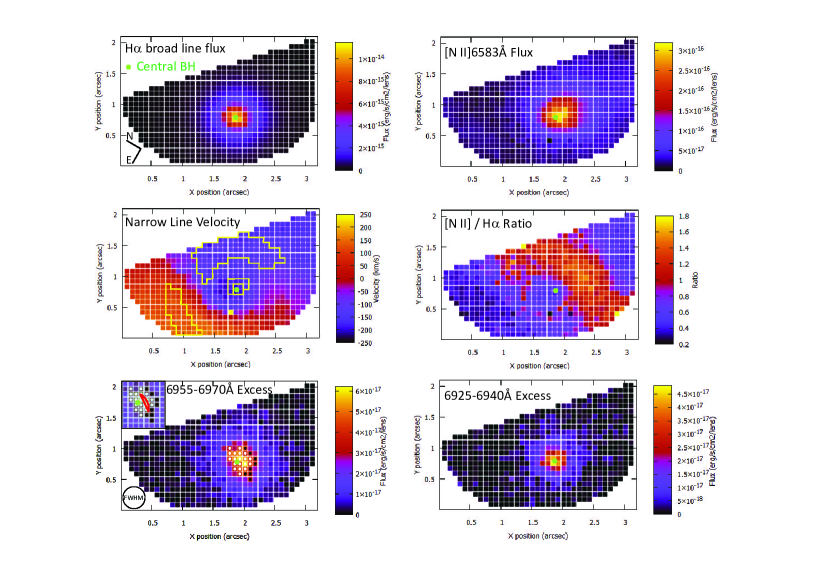
The flux map of the broad H line represents the PSF during our observation, and turns out a round shape (top left in Fig. 1). By fitting the map, we obtain the central position and the radial profile, which is well described by a Moffat profile with the FWHM of 0.”37. The PSF FWHM is similar to the image size of the guide star. These indicate successful fitting. The central position indicates the position of the BH.
The [N II]6583Å flux map (upper right) shows an elongation toward the west from the central BH. Maps for the velocity of narrow emission lines (middle left) and the [N II]/H flux ratio (middle right) are also asymmetric in kpc-scales. The overall velocity map shows blueshifts on west and redshifts on the east sides of the BH, indicating a galactic rotation with an axis inclined to the north direction. Alternatively, the velocity gradient may imply the double-sided outflowing NLR. Careful decomposition into the galactic rotation and the NLR kinematics will be needed. The [N II]/H flux ratio is larger than at the west of the nucleus, strongly suggesting the AGN origin for the ionization (e.g., Kauffmann et al. 2003). Around the nucleus and 1” to the west, the ratio is relatively lower, but still larger than the border value between AGN- and star formation-origins ( 0.5). At 1”–1.”5 northeast of the nucleus, the ratio is even smaller down to 0.3, indicating that there is a star forming region.
4.3 Outflowing Region
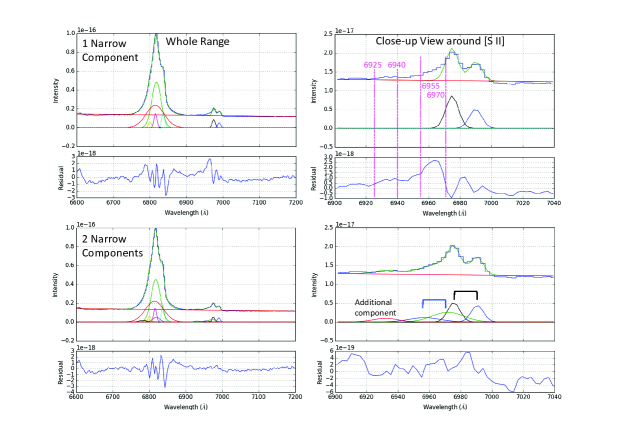
When fitting the 615 spectra, it turned out that many lenslets show blue tail in [S II] emission lines (figure 2), indicating an outflowing component of [S II] emission.
To identify the outflowing region, we calculate the excess flux of the observed data over the model (§ 4.2) at 6955–6970Å. Bottom-left panel in figure 1 shows the excess flux map, where we overdraw 27 (white and black) circles if the excess flux is larger than the half of the maximum excess flux (i.e., larger than erg/s/cm-2/lens). Black circles mean the 8 lenslets with the broad line flux smaller than a certain threshold. We found that the distribution of the white and black circles are not located symmetrically around the central BH: it is mainly distributed at the west of the BH. The fact that the outflowing region is offset from the center implies that we are not observing the outflow from the pole-on view.
Moreover, the area with the excess flux larger than the half of its peak looks elongated, and the elongation is nearly perpendicular to the radial direction from the center. The width is comparable to the PSF FWHM, while the length is about 1.4 times the FWHM. Taking account of the image smearing by the PSF, the distribution indicates that the outflowing region is intrinsically narrow (with a length of times the FWHM; the inset of bottom-left panel). The excess flux region offsets from the BH by 0.”15 (120 pc projected distance), implying a short-duration (rather than a continuous) outflow. From the estimated length (1FWHM) and the offset, we estimate the half-opening angle to be []. The inferred angle indicates that the outflow is not jet-like (nor spherical). Since a narrow jet-like geometry would have difficulty to push out or disturb the ISM of its host galaxy in a large volume, the wide-angle estimated above is likely in favour of the AGN feedback hypothesis.
There is a small bump in the spectrum at around 6930 Å (Fig. 2). To investigate its origin, we show the excess flux map at 6925–6940Å as well (bottom right panel). The distribution turns out similar to that of the broad H emission. Namely, this spectral feature is not associated with the region responsible for the [S II] blue tail. Instead, this bump seems due to either [S II] line(s) emitted by another outflowing component with a higher velocity near the BH, highly redshifting H emission from a blob in the broad line region, or something else (e.g., He IÅ). The flux of this bump is consistent with the Case B, He IÅ recombination at the broad-line region having the solar abundance, the temperature of K and the electron density of cm-3 (Osterbrock & Ferland 2006), if all (or almost all) the \atomHe are \atomHe+ ions.
Solving its origin is beyond the scope of this study. This component, together with the broad H wing, could influence measuring the outflowing gas. In the next subsection, we thus preferentially use the spectra at the lenslets far from the center (indicated by black circles in the bottom left panel in Fig. 1).
4.4 Velocity and Density of the Outflowing Gas
To derive the velocity and the density of the outflowing gas, we use the mean spectrum of the 8 lenslets where the excess flux is large and the contamination of the broad line is small. If we fit the spectrum with a single velocity component for narrow lines, the clear blue tail in [S II] emission remains (upper panels in Fig. 2). Moreover, the flux ratio of [S II] emission lines is 1.7, exceeding the allowed range (0.44–1.45; e.g., Sanders et al. 2016). These issues indicate that the fitting is not appropriate.
Therefore, we fit the mean spectrum with additional velocity component for narrow emission lines (H, [N II] and [S II]). Similar to the preexisting narrow line component, the width and the velocity are tied too within this second component. Here, we also add a component at 6930Å, for which the wavelength and the gaussian width are fixed at the lenslet with the strongest 6925–6940Å excess flux (shown by yellow in bottom right panel in Fig. 1). As the result (Table 4.4), the blue tail is well described by the second narrow component (lower panels in Fig. 2). This component is about 810 km/s blueshifted from the brighter component at these lenslets, which is relatively blueshifted with respect to the whole FoV (middle left panel of Fig. 1). Since the systemic velocity of this object in literature varies by hundreds km/s, we here define the systemic velocity as the mean velocity of the narrow lines at the north-east and west sides 1” apart from the center. The blueshift velocity of the outflowing component relative to the systemic velocity is about 860 km/s, fast enough compared with the escape velocity at NLRs (500km/s).
If the gas density is low (/cc), the [S II] flux ratio (6717Å/6731Å) is about 1.4–1.45. When the density exceeds /cc, the [S II] flux ratio becomes 0.44–0.5 (e.g., Sanders et al. 2016). By the 2-component fit, we estimate the brighter component has the density of about 300/cc, similar to a typical density in NLRs of AGNs. On the other hand, the outflowing component is very dense, 3000/cc.
Fit with Two Narrow Components. Brighter Component [S II]6731 central wavelength [Å] 6990.630.10 FWHM [km/s] 392.314.4 Flux density (6716 Å)a 5.160.82 Flux density (6731 Å)a 4.430.60 Flux ratio (6716/6731) 1.170.24 Gas density [cm-3] 300 (20–800) Blueshifted Component [S II]6731 central wavelength [Å] 6971.91.4 FWHM [km/s] 1004168 Flux density (6716 Å)a 1.110.48 Flux density (6731 Å)a 2.600.64 Flux ratio (6716/6731) 0.430.21 Gas density [cm-3] 3000 Narrow H Flux [erg/s/cm2/lens] (5.01.5) {tabnote} a Peak intensity in the unit of [erg/s/cm2/Å/lens].
Albeit large uncertainties, the [N II]6583/H and [S II]6716+6731/H flux ratios of the outflowing component ( and , respectively) indicate the non-stellar origin for its ionization (e.g., Kewley et al. 2006).
Assuming Case B recombination at 104 K with the solar abundance, the ionized gas mass is in principle estimated from the H luminosity and the electron density , as (Carniani et al. 2015; Nesvadba et al. 2017). Since the gas density affects estimating the gas mass inversely, a conventional assumption for the density of 100/cc must have led overestimations in the gas mass, the outflow rate, the kinetic power injection etc for the feedback process. The flux of H narrow line of the outflowing component is quite uncertain, since it is veiled by the strong broad line. Taking the fitting results at face value, and assuming that the 8 lenslets contain the 10% of the total (all the 27 lenslets plus surrounding lenslets leaked via the image smearing) flux of H narrow line in the outflowing gas, we estimate the outflowing gas mass to be . Given that the radial extension of the outflowing region is much smaller than the PSF FWHM (0.”37), we presume that it is 0.10.”37 (i.e., 29 pc). Assuming that the line-of-sight velocity (860 km/s) is (§ 4.3) times the outflow velocity (i.e., 1200 km/s), this region is likely launched from the center 0.13 Myr ago for a duration of 2.3104 yr (i.e., 29pc/1200km/s; ). Then, the gas outflow rate, , is estimated to be /yr ( 90% of the current gas accretion rate; § 2).
Similarly, the kinetic power and the momentum contained in the outflowing gas lead to estimations for the kinetic energy injection rate ( erg/s) and the momentum flux ( g cm/s), where is the line-of-sight velocity dispersion of the blueshifted line. The ratio of the kinetic energy injection rate over the bolometric luminosity is low ( 0.07%), similar to high- AGNs (Kakkad et al. 2016). The momentum flux is comparable to the radiation momentum received by the outflowing region with a solid angle subtended at the nucleus of ( 0.18 4), where is the speed of light.
5 Summary and Discussions
We observe the nearest () AGN with prominent blueshift/tail in [O III] emission from a sample of such objects that we have collected from the literature, to examine the putative AGN feedback process on its host galaxy, by utilising the unique capability of Subaru, optical IFU with AO assistance (Kyoto 3D II with AO188). The optical waveband enables us to observe the density-sensitive [S II] doublets, with which we can measure the gas density via the flux ratio. Through the spectral fitting for the 615 lenslets, over 3.”1 (2.4 kpc) of IRAS 04576+0912, we obtain the kpc-scale structures in velocity, flux and ionization sources. Many lenslets turn out to exhibit blue tail in the [S II] emission. Through the location and the distribution of the lenslets with the high excess flux at the corresponding wavelengths, and fitting results for their mean spectrum, we found the fast (860 km/s blueshift), dense ( 3000/cc), wide-angle (with the half-opening angle of ) and offset outflow in 100-pc scales. In short, a gas outflow with a rate of 90% of the accretion rate was launched 0.13 Myr ago (over 2.3104 yr). The large opening angle and the high gas outflow-to-accretion ratio may favour the AGN feedback hypothesis, although the outflow seems not to be spherical nor continuous. The inferred kinetic power injection rate ( 0.07% of ) of this ionized gas outflow seems insufficient to influence the whole host galaxy. A conventional assumption of a low gas density, 100/cc, must have overestimated the feedback process.
Outflow launched by AGNs with high accretion rates may be commonly fast and dense. AO-assisted NIR IFU observations on NGC 1068, which is a type-2 analogue of NLS1s (Kawaguchi 2003), reveal the outflow kinematics in the central 100pc-scales (Müller-Sánchez et al. 2011). Ozaki (2009) showed that the outflowing clumps (with gas densities of 105/cc) with a variety of column densities are likely accelerated by radiation from the center.
We leave further analysis, including maps for other line ratios and the narrow-line width (as a tracer for ISM disturbance) as well as the decomposition between the galactic rotation and the NLR outflow, for a next paper. Three-dimensional kinematical modelling to reproduce these maps will follow.
This work is based on data collected at Subaru Telescope, which is operated by the National Astronomical Observatory of Japan. We are grateful to the staff of the Subaru Telescope, and the anonymous referee, Masayuki Akiyama and Xiaoyang Chen for helpful comments. TK is supported by JSPS KAKENHI (17K05389).
References
- [Aoki et al.(2005)] Aoki, K., Kawaguchi, T., & Ohta, K. 2005, ApJ, 618, 601
- [Balmaverde et al.(2016)] Balmaverde, B., Marconi, A., Brusa, M., et al. 2016, A&A, 585, A148
- [Barbosa et al.(2009)] Barbosa, F. K. B., Storchi-Bergmann, T., Cid Fernandes, R., Winge, C., & Schmitt, H. 2009, MNRAS, 396, 2
- [Boroson(2005)] Boroson, T. 2005, AJ, 130, 381
- [Carniani et al.(2015)] Carniani, S., Marconi, A., Maiolino, R., et al. 2015, A&A, 580, A102
- [Carniani et al.(2016)] Carniani, S., Marconi, A., Maiolino, R., et al. 2016, A&A, 591, A28
- [Cresci et al.(2015)] Cresci, G., Marconi, A., Zibetti, S., et al. 2015, A&A, 582, A63
- [Di Matteo et al.(2005)] Di Matteo, T., Springel, V., & Hernquist, L. 2005, Nature, 433, 604
- [Gabor & Bournaud(2014)] Gabor, J. M., & Bournaud, F. 2014, MNRAS, 441, 1615
- [Husemann et al.(2016)] Husemann, B., Scharwächter, J., Bennert, V. N., et al. 2016, A&A, 594, A44
- [Kakkad et al.(2016)] Kakkad, D., Mainieri, V., Padovani, P., et al. 2016, A&A, 592, A148
- [Kauffmann et al.(2003)] Kauffmann, G., Heckman, T. M., Tremonti, C., et al. 2003, MNRAS, 346, 1055
- [Kawaguchi(2003)] Kawaguchi, T. 2003, ApJ, 593, 69
- [Kawaguchi et al.(2004)] Kawaguchi, T., Aoki, K., Ohta, K., & Collin, S. 2004, A&A, 420, L23
- [Kewley et al.(2006)] Kewley, L. J., Groves, B., Kauffmann, G., & Heckman, T. 2006, MNRAS, 372, 961
- [Komossa et al.(2008)] Komossa, S., Xu, D., Zhou, H., Storchi-Bergmann, T., & Binette, L. 2008, ApJ, 680, 926-938
- [Lena et al.(2015)] Lena, D., Robinson, A., Storchi-Bergman, T., et al. 2015, ApJ, 806, 84
- [Marziani et al.(2003)] Marziani, P., Zamanov, R. K., Sulentic, J. W., & Calvani, M. 2003, MNRAS, 345, 1133
- [Matsubayashi et al.(2016)] Matsubayashi, K., Sugai, H., Shimono, A., et al. 2016, PASP, 128, 095003
- [Mazzalay et al.(2013)] Mazzalay, X., Rodríguez-Ardila, A., Komossa, S., & McGregor, P. J. 2013, MNRAS, 430, 2411
- [Mitsuda et al.(2016)] Mitsuda, K., Hashiba, Y., Minowa, Y., et al. 2016, Proc. SPIE, 9908, 99082M
- [Müller-Sánchez et al.(2011)] Müller-Sánchez, F., Prieto, M. A., Hicks, E. K. S., et al. 2011, ApJ, 739, 69
- [Nesvadba et al.(2017)] Nesvadba, N. P. H., De Breuck, C., Lehnert, M. D., Best, P. N., & Collet, C. 2017, A&A, 599, A123
- [Osterbrock & Ferland(2006)] Osterbrock, D. E., & Ferland, G. J. 2006, Astrophysics of gaseous nebulae and active galactic nuclei, 2nd. ed.University Science Books
- [Ozaki(2009)] Ozaki, S. 2009, PASJ, 61, 259
- [Sanders et al.(2016)] Sanders, R. L., Shapley, A. E., Kriek, M., et al. 2016, ApJ, 816, 23
- [Schawinski et al.(2007)] Schawinski, K., Thomas, D., Sarzi, M., et al. 2007, MNRAS, 382, 1415
- [Silk & Rees(1998)] Silk, J., & Rees, M. J. 1998, A&A, 331, L1
- [Storchi-Bergmann et al.(2009)] Storchi-Bergmann, T., McGregor, P. J., Riffel, R. A., et al. 2009, MNRAS, 394, 1148
- [Sugai et al.(2010)] Sugai, H., Hattori, T., Kawai, A., et al. 2010, PASP, 122, 103
- [Sulentic et al.(2007)] Sulentic, J. W., Bachev, R., Marziani, P., Negrete, C. A., & Dultzin, D. 2007, ApJ, 666, 757
- [van Dokkum(2001)] van Dokkum, P. G. 2001, PASP, 113, 1420
- [Véron-Cetty et al.(2001)] Véron-Cetty, M.-P., Véron, P., & Gonçalves, A. C. 2001, A&A, 372, 730
- [Villar-Martín et al.(2016)] Villar-Martín, M., Arribas, S., Emonts, B., et al. 2016, MNRAS, 460, 130
- [Vogt et al.(2017)] Vogt, F. P. A., Bonaccini Calia, D., Hackenberg, W., et al. 2017, Physical Review X, 7, 021044
- [Wyithe & Loeb(2003)] Wyithe, J. S. B., & Loeb, A. 2003, ApJ, 595, 614
- [Zamanov et al.(2002)] Zamanov, R., Marziani, P., Sulentic, J. W., et al. 2002, ApJ, 576, L9