Discovery of two bright DO-type white dwarfs ††thanks: Based on observations collected at the German-Spanish Astronomical Center, Calar Alto, jointly operated by the Max-Planck-Institut für Astronomie Heidelberg and the Instituto de Astrofísica de Andalucía (CSIC). ††thanks: Based on observations made with the William Herschel Telescope and the Isaac Newton Telescope operated on the island of La Palma by the Isaac Newton Group of Telescopes in the Spanish Observatorio del Roque de los Muchachos of the Instituto de Astrofísica de Canarias.
Abstract
We discovered two bright DO-type white dwarfs, GALEX J053628.3+544854 (J0536+5448) and GALEX 231128.0+292935(J2311+2929), which rank among the eight brightest DO-type white dwarfs known. Our non-LTE model atmosphere analysis reveals effective temperatures and surface gravities of and for J0536+5448 and and for J2311+2929. The latter shows a significant amount of carbon in its atmosphere (, by mass), while for J0536+5448 we could derive only an upper limit of . Furthermore, we calculated spectroscopic distances for the two stars and found a good agreement with the distances derived from the Gaia parallaxes.
keywords:
stars: white dwarfs – stars: atmospheres – stars: abundances1 Introduction
About every fifth intermediate mass star will turn into a star with a H-deficient atmosphere in its late stage of stellar evolution.
There are various scenarios that can produce H-deficient stars, such as (very) late thermal pulses ( e.g., Iben et al. 1983; Althaus
et al. 2005),
the merger of two white dwarfs (Zhang &
Jeffery 2012a, b), or the late hot flasher scenario (Miller Bertolami et al. 2008).
Once these H-deficient stars enter the white dwarf cooling sequence, their atmospheres are dominated by He. The earliest type of these
He-dominated white dwarfs corresponds to the DO spectral type. These stars have effective temperatures () between and K,
with the hot DO white dwarfs showing strong He II lines, whereas in the spectra of cool DO white dwarfs He I lines can also be seen
(Sion 2011).
DO-type white dwarfs cover a huge luminosity interval from up to times the solar luminosity, when they have just entered the white
dwarf cooling sequence, down to only 0.1 when reaching to the DB-spectroscopic region. This evolutionary phase is quite short-lived
( million years, Althaus et al. 2009), thus less than 100 DO white dwarfs are currently known.
The detection of more of these stars is important for the construction of a reliable hot end of the white dwarf luminosity function (WDLF).
Its hot end suffers form low number statistics, i.e., the high luminosity bins (, corresponding to
white dwarfs with K) of the hot WDLF of Krzesiński
et al. (2009) contain only one to 29 objects each. Since the shape of the
WDLF quantitatively reflects the cooling behaviour of the white dwarf population as a whole, it is an excellent tool for constraining
the properties of particles emitted by the white dwarfs. The cooling process of hot and luminous white dwarfs is dominated by the radiation
of neutrinos, thus, the shape of the hot end of the WDLF strongly constrains the magnetic dipole moment of the neutrino Miller
Bertolami (2014).
Moreover, it offers the opportunity to check for the possible existence of the axion, a proposed but not yet detected type of weakly interacting
particles (Miller Bertolami et al. 2014).
DO-type white dwarfs with are found to display high abundances of trans-iron elements (Hoyer et al. 2017, 2018). Therefore, high resolution ultra-violet (UV) spectra of DO white dwarfs, in which a wealth of metal lines can be detected, enables us to
study the chemical evolution of these stars and to put constraints on possible progenitors and progeny. Furthermore, hot white dwarfs
serve as stellar laboratories to derive atomic data for highly ionized species of trans-iron elements (Rauch et al. 2012, 2014b, 2014a, 2015a, 2015b, 2016; Rauch
et al. 2017a; Rauch et al. 2017b).
Last but not least, hot white white dwarfs have recently found a new use in the fundamental physics community. They potentially
allow us to directly observe variations in fundamental constants, i.e., the fine structure constant , at locations of high
gravitational potential. Such a variation manifests itself as shifts in the observed wavelengths of absorption lines, when compared to laboratory
wavelengths. This effect is larger for metals with more protons (higher atomic number) and higher ionization energy. Thus, Fe V and
Ni V that can be found in high-resolution UV spectra of hot white dwarfs are particularly well suited for this purpose
(Berengut
et al. 2013; Preval
et al. 2015; Bainbridge
et al. 2017).
The Hubble Space Telescope (HST) is currently the only telescope that can be used to obtain UV spectra for the above mentioned proposes.
Thus, bright white dwarfs ( mag) are a requisite to gain a high signal to noise (S/N), high-resolution UV spectrum, necessary to
resolve the weak metal lines in hot white dwarfs.
In this letter we report the discovery of two such bright DO white dwarfs, GALEX J053628.3+544854 and
GALEX 231128.0+292935 (hereafter J0536+5448 and J2311+2929). Since most of the DO white dwarfs have been discovered within the
Solan Digital Sky Survey, the majority of DO type white dwarfs are significantly fainter (mean V magnitude is mag). The
two stars presented here have V magnitudes of (J0536+5448) and (J2311+2929, Henden et al. 2016) and therefore
they rank among the eight brightest DO-type white dwarfs known. The only six DO white dwarf brighter than those two are HZ 21,
HS 0111+0012, RE 0503289, PG 0109+111, PG 0038+199, and PG 1034+001.
2 Spectroscopic observations
We observed J0536+5448 and J2311+2929 during surveys exploring candidate sdB stars for the Kepler mission, selected from the GALEX survey.
In August 2010 J0536+5448 was observed twice at the William Herschel Telescope using the Intermediate dispersion Spectrograph
and Imaging System (ISIS) with the R600B grating (), covering the wavelength range . J0536+5448 was again observed at the Isaac Newton Telescope (INT) February 2011 using the Intermediate Dispersion
Spectrograph (IDS) with the R400B grating () covering the wavelength range of .
J2311+2929 was observed with the same set-up at the INT in July 2013. Based on these spectra we assigned the spectral type DO.
To obtain high S/N spectra suitable for a precise spectral analysis, we performed spectroscopic follow-up in October/November 2014
at the Calar Alto m telescope (ProgID H14-3.5-022) using the TWIN spectrograph and a slit width of 1.2 acrsec.
We used the grating No. T08 for the blue channel and No. T04 for the red channel (dispersion 72 nm, covering the
wavelength range ). The resolution of the spectra is .
We obtained four spectra of J0536+5448 and seven spectra of J2311+2929 with exposure times of 20 minutes to
achieve a S/N . The spectra were taken in three consecutive nights. After each spectrum, we required ThAr wavelength calibration.
The data reduction was done by using IRAF111IRAF is distributed by the National Optical Astronomy Observatory, which is operated
by the Associated Universities for Research in Astronomy, Inc., under cooperative agreement with the National Science Foundation..
We did not perform flux calibration to our data.
The co-added TWIN spectrum of J0536+5448 reaches a S/N (interpreted as mean/standard deviation, measured in the
region ) of 120 and displays He II Å, He I Å.
The co-added TWIN spectrum of J2311+2929 reaches a S/N of 200 and additionally shows lines of He I Å and
C IV Å. To check for radial velocity variations, we measured the radial velocities of the
identified lines by fitting a set of mathematical functions (Gaussians, Lorentzians, and polynomials) to the identified spectral
lines using SPAS (Spectrum Plotting and Analysing Suite, Hirsch 2009). None of the two stars displays any radial
velocity variations larger than km/s, corresponding to the standard deviation of the individually measured radial
velocities.
3 Spectral analysis
3.1 Effective temperatures and surface gravities
We derived the effective temperatures and surface gravities of the two stars by means of a minimization technique with
SPAS, which is based on the FITSB2 routine (Napiwotzki 1999). The fit is based on the co-added TWIN spectra of the two stars
and the model grid of Reindl
et al. (2014), which was calculated with the Tübingen non-LTE Model-Atmosphere Package
(TMAP, Werner et al. 2003; Werner
et al. 2012; Rauch &
Deetjen 2003). To account for the spectral resolution of the TWIN observations,
the synthetic spectra were convolved with Gaussians (Å). We fitted the He II Å,
He I Å, and for J2311+2929 additionally He I Å. For J0536+5448 we derived
and , and for J2311+2929 we found and . The errors represent the
statistical one sigma uncertainty on and the three sigma uncertainty on .
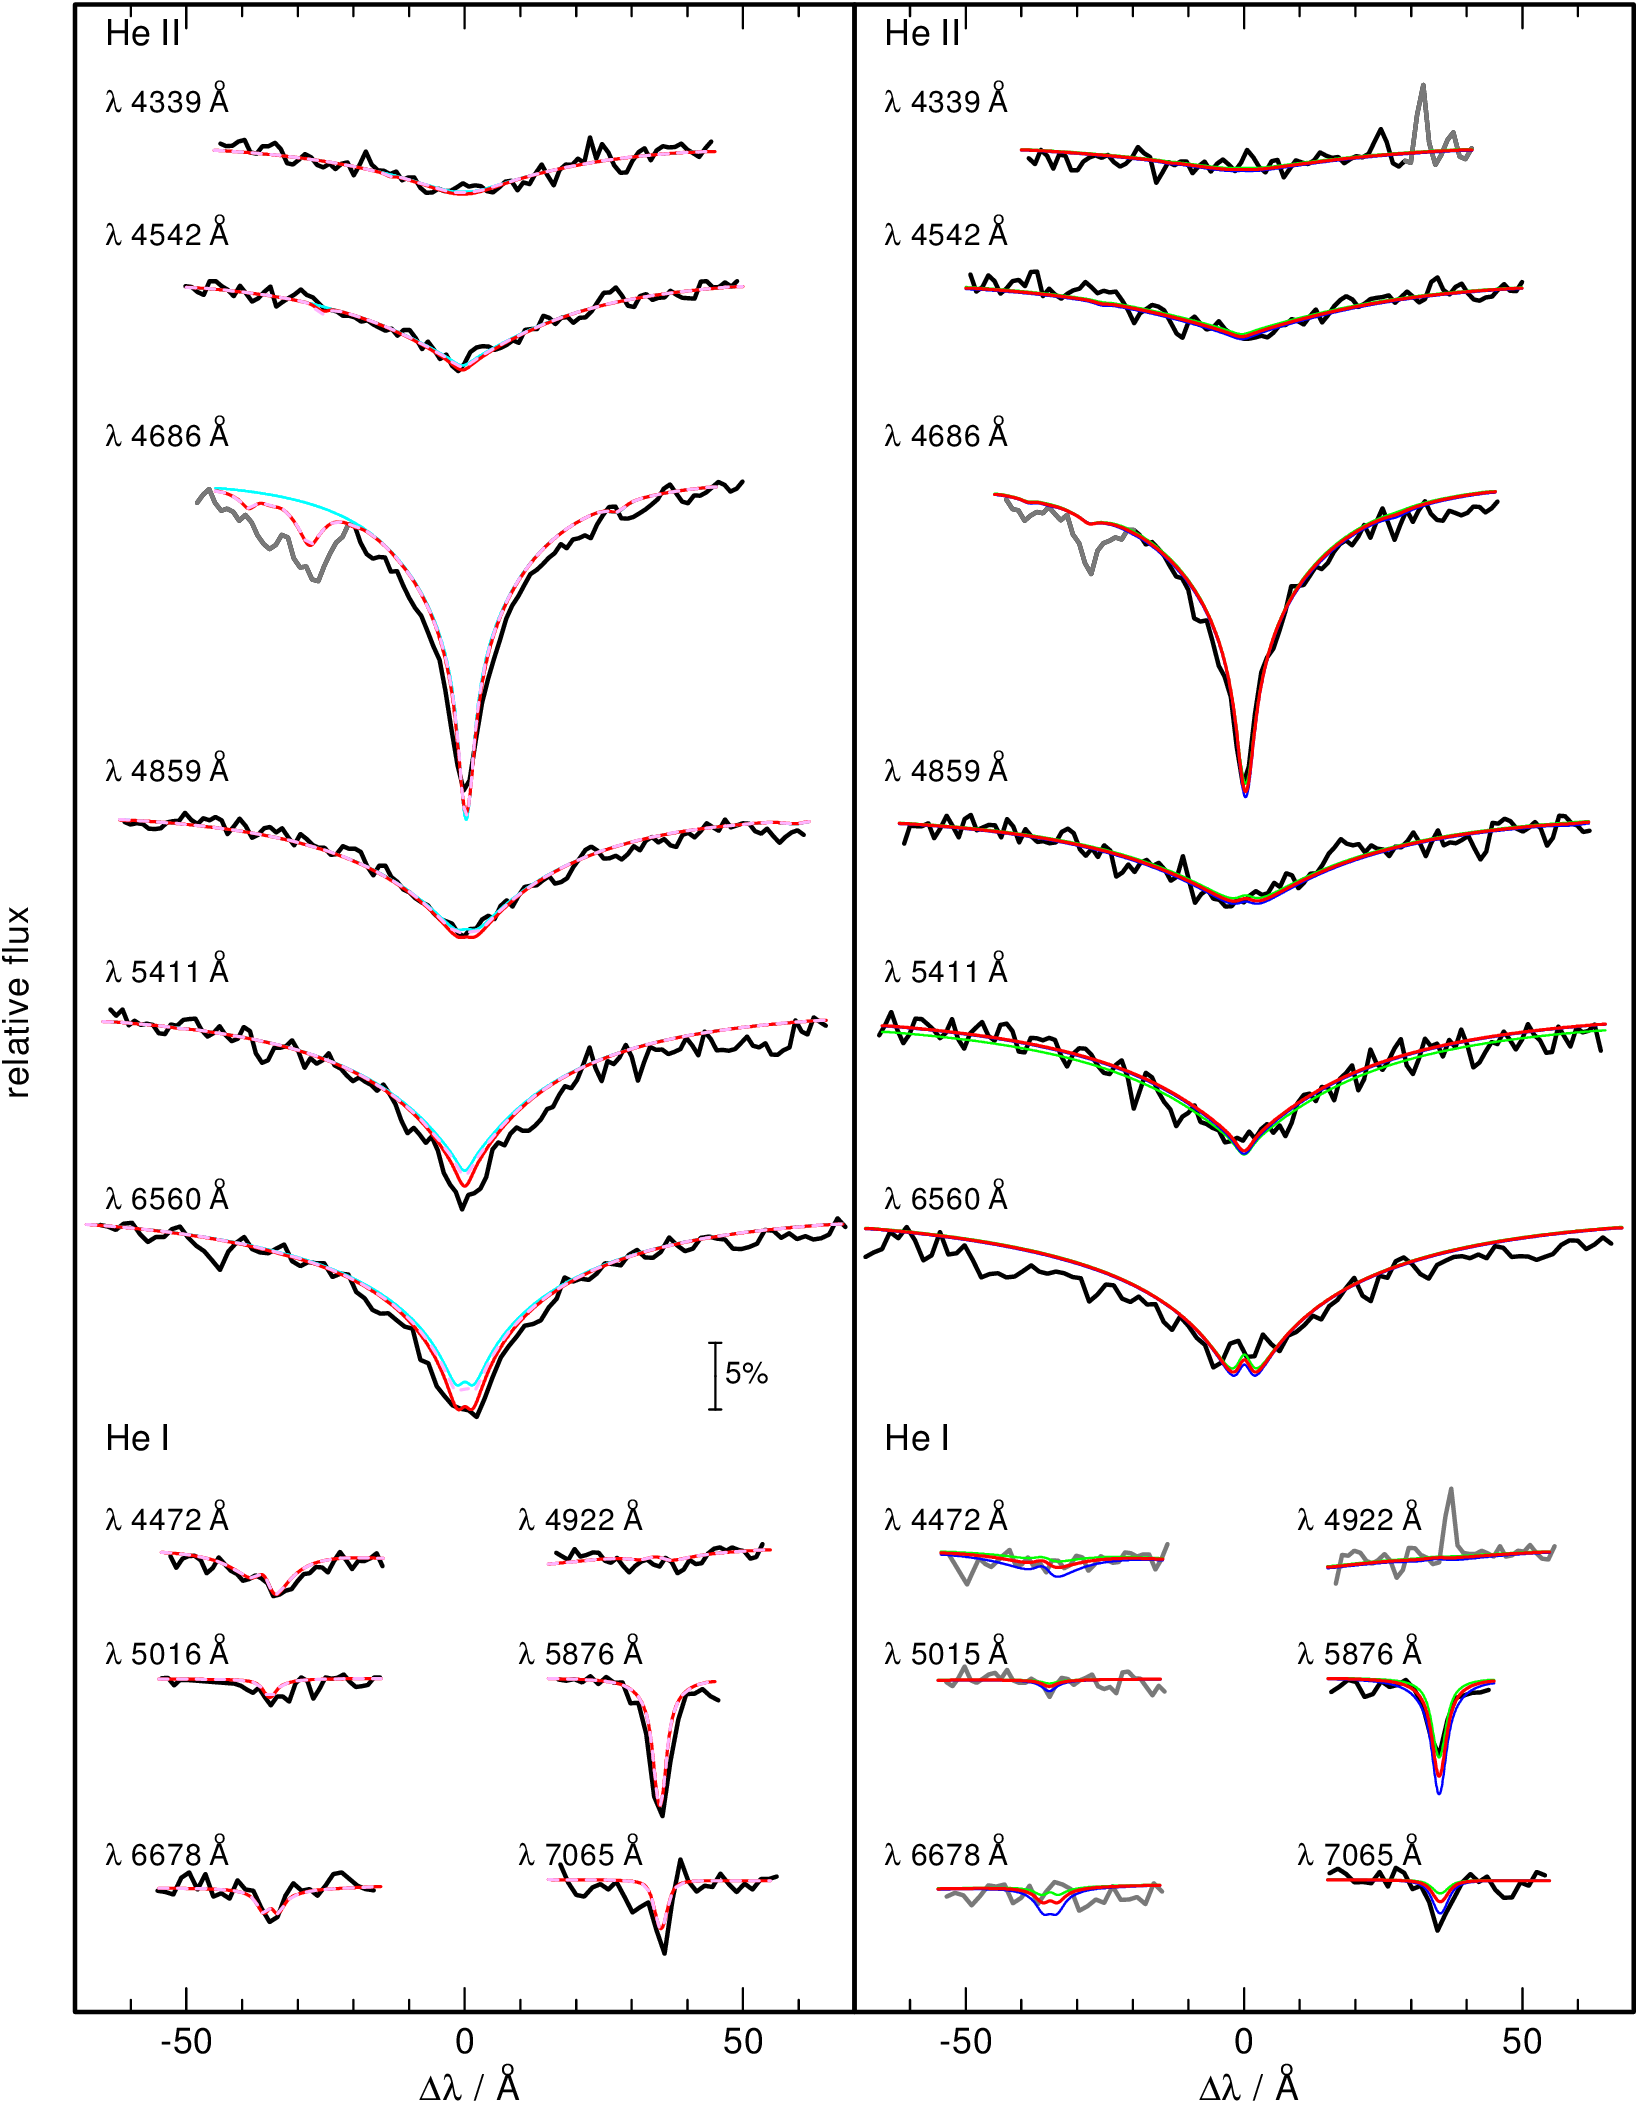
In Fig. 1 we show the fits to the He lines of the co-added TWIN spectra of the two stars. For J0536+5448 (left panel of Fig. 1),
the He II lines are nicely reproduced by the best fit model (red), but the theoretical He I Å is too shallow and
the He I Å too deep. We also show in this figure the models which are 4600 K (error from the fit) hotter (green)
and 4600 K cooler (blue). While the cooler model reproduces best the He I Å, the hotter one matches
He I Å. For J2311+2929 (left panel of Fig. 1), the He I lines are reproduced well, but the line cores of
He II Å are too shallow in the pure He model (light blue).
As a next step, we calculated TMAP model grids, which also include opacities of C, N, and O. The statistics of our model atoms used for
the model atmosphere calculations are summarized in Table 1.
The addition of C in the models does not affect the theoretical He I and He II (see also Reindl
et al. 2014). We also
demonstrate this in left panel of Fig. 1, where a HeC model (dashed pink) is compared to the pure He model (light blue), both
with and . Comparing these models to our HeCNO models, we find that the line cores of
He II Å become deeper for increasing abundances of N and O. In case of J2311+2929 this indeed solves the problem of the observed
too deep He II Å lines (red line in the left panel of Fig. 1 represents the HeCNO model). We then repeated
the fit for J2311+2929 based on the HeCNO models. We found that is not affected by the inclusion of CNO (the derived is
mainly a result of the strengths of the He I lines, which are not affected by the inclusion of CNO) and that the derived surface gravity
increases only by 0.03 dex. We will therefore adopt in following, one sigma errors on and three sigma errors on .
3.2 Carbon
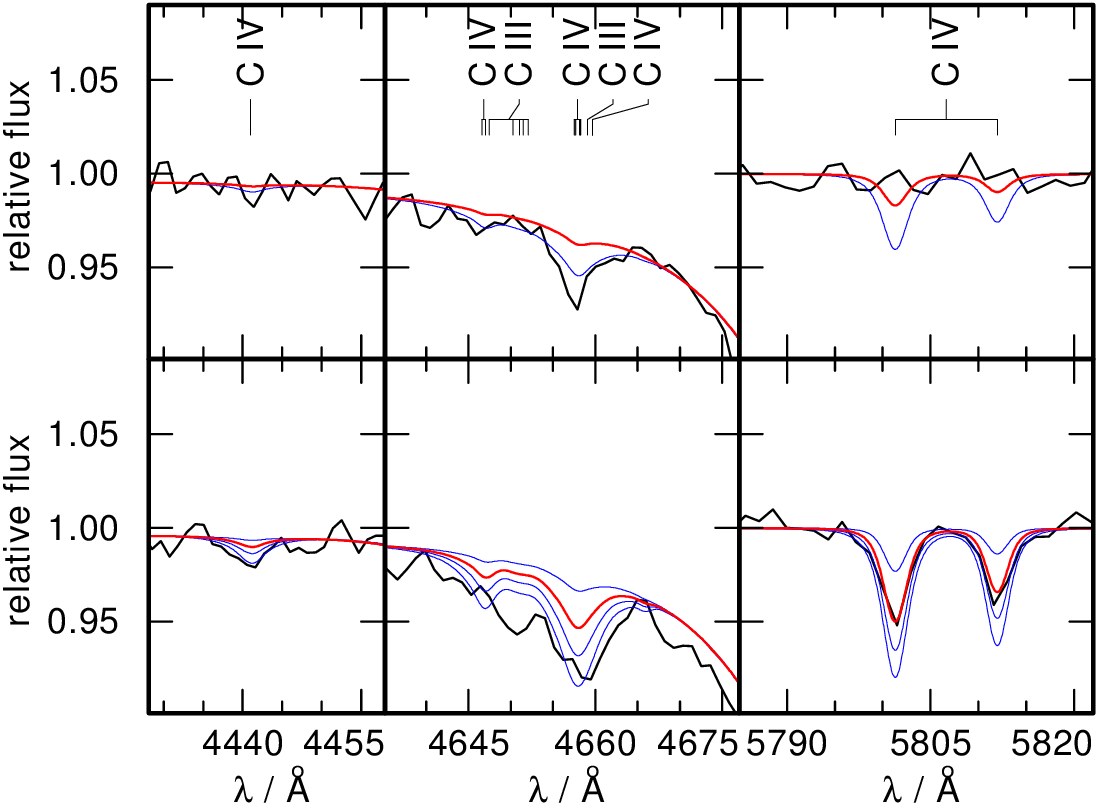
For J2311+2929 the observed C IV Å lines are well reproduced for (mass fraction), but not the absorption at
, which suggest (Fig. 2. Our models predict also C IV Å. There is small
absorption at this wavelength in the spectrum of J2311+2929, which however lies within the noise level of the spectrum, leaving the
identification of this line uncertain. J0536+5448 does not show C IV Å suggesting . The TWIN spectrum of this
star, however, does show an absorption in the region, which could be due to C IV Å and suggests
. The IDS spectra of both stars are to noisy to allow the identification of C IV Å, but both show the
absorption at , too.
This problem cannot be overcome with different combinations of and . An increase of or a decrease affects, however, C IV Å and C IV Å in the same manner. For example, if is increased by
5000 K, or decreased by 0.5 dex, this has a similar effect on those C lines as an increase of the abundance by 0.001.
A decrease of by 5000 K, decreases the line strengths of all the C IV lines only minimally
(the line strength of C III Å increases slightly in the cooler model for J2311+2929). Thus, a lower can also not
account for the discrepancy of C abundance derived from the different C IV lines.
We emphasize that both the C IV Å complex as well as the C IV Å lines form at a similar
part of the atmosphere (, where is column mass that is measured from the outer boundary of the model atmospheres.),
which means that it is unlikely that this problem could be solved by the inclusion of further metal opacities that would impact
the temperature structure of the model atmosphere. So far, this problem has not been reported in the analysis of any other DO-type
white dwarf. However, for some PG 1159 also only a poor simultaneous fit of the C IV Å and the C IV Å
lines is achieved. Similar to J0536+5448, the spectrum of the PG 1159 star HS 1517+7403 does show strong C IV Å lines while
C IV Å cannot be detected (Fig. 5 of Dreizler &
Heber 1998). Another example is PG 0122+200 for which Werner &
Rauch (2014)
could not precisely reproduce the observed central emission of C IV Å. Thus, an inaccuracy in the atomic
data could be origin of this problem.
Another possible solution is a blend with a ultra-high excitation (uhe) absorption line, i.e., O VIII Å. This line is seen in
about every tenth DO-type white dwarf (Werner et al. 1995; Dreizler et al. 1995; Werner
et al. 2014; Reindl
et al. 2014), which are commonly
refereed to as hot-wind white dwarfs. The reason for the occurrence of these lines is not understood, but a photospheric origin can
be excluded. On the other hand, the spectra of the hot wind white dwarfs are always accompanied by too broad and deep
He II lines, which is not the case for our two stars. Also, should the (additional) line absorption around C IV Å
stem from an uhe line it would be the first time that only this uhe line is observed.
3.3 Nitrogen and Oxygen
In our HeCNO models N IV Å is the strongest of all nitrogen lines, followed by N IV Å. In the hotter models () for J0536+5448, also the N V Å doublet becomes slightly apparent. However, none of these lines are observed in the spectra. We derive an upper limit of for both stars. The strongest oxygen lines in our models are O III Å followed by O IV Å. Those lines are not visible in the spectra of our stars. We determine an upper limit of for both stars. We summarize the atmospheric parameters of the two stars in Table 2.
| Ion | NLTE levels | Lines | |
|---|---|---|---|
| He | i | 29 | 69 |
| ii | 20 | 190 | |
| iii | 1 | ||
| C | ii | 16 | 37 |
| iii | 67 | 101 | |
| iv | 54 | 295 | |
| v | 1 | 0 | |
| N | iii | 13 | 24 |
| iv | 16 | 30 | |
| v | 14 | 35 | |
| vi | 1 | 0 | |
| O | iii | 11 | 9 |
| iv | 18 | 39 | |
| v | 17 | 25 | |
| vi | 14 | 33 | |
| vii | 1 | 0 |
| J0536+5448 | J2311+2929 | |
|---|---|---|
| [K] | ||
| [cm s-2] | ||
4 Masses, radii, and distances
J0536+5448 and J2311+2929 are included in Gaia data release 2 (Gaia
Collaboration et al. 2016; Gaia Collaboration
et al. 2018) and they have parallaxes of
and , respectively.
An additional systematic error of the parallax due to uncertainties on the parallax zero-point and spatial correlations,
of 0.1 mas is recommended by the Gaia team (see also Zinn et al. 2018). The resulting distances and height above
or below the Galactic plane, , are listed in Table 3.
By calculating the spectroscopic distance, we can now check for the consistency with the derived atmospheric parameters of the two
stars. For that we firstly calculated absolute synthetic band magnitude, , according to Holberg &
Bergeron (2006)
using
where is the radius of the star, the Eddington flux of our model spectrum, and is the
relative filter response modified for atmospheric transmission (Cohen et al. 2003). The spectroscopic distance can then be
calculated via , where is the observed band magnitude after corrected for
extinction. The reddening of the stars was determined as follows. We obtained GALEX and magnitudes from
Bianchi
et al. (2014), 2MASS and magnitudes from Lawrence
et al. (2013), , , , , and magnitudes for J2311+2929 from
Ahn
et al. (2012), , , , , , and magnitudes for J0536+5448 from Chambers
et al. (2016) and Cutri & et
al. (2014),
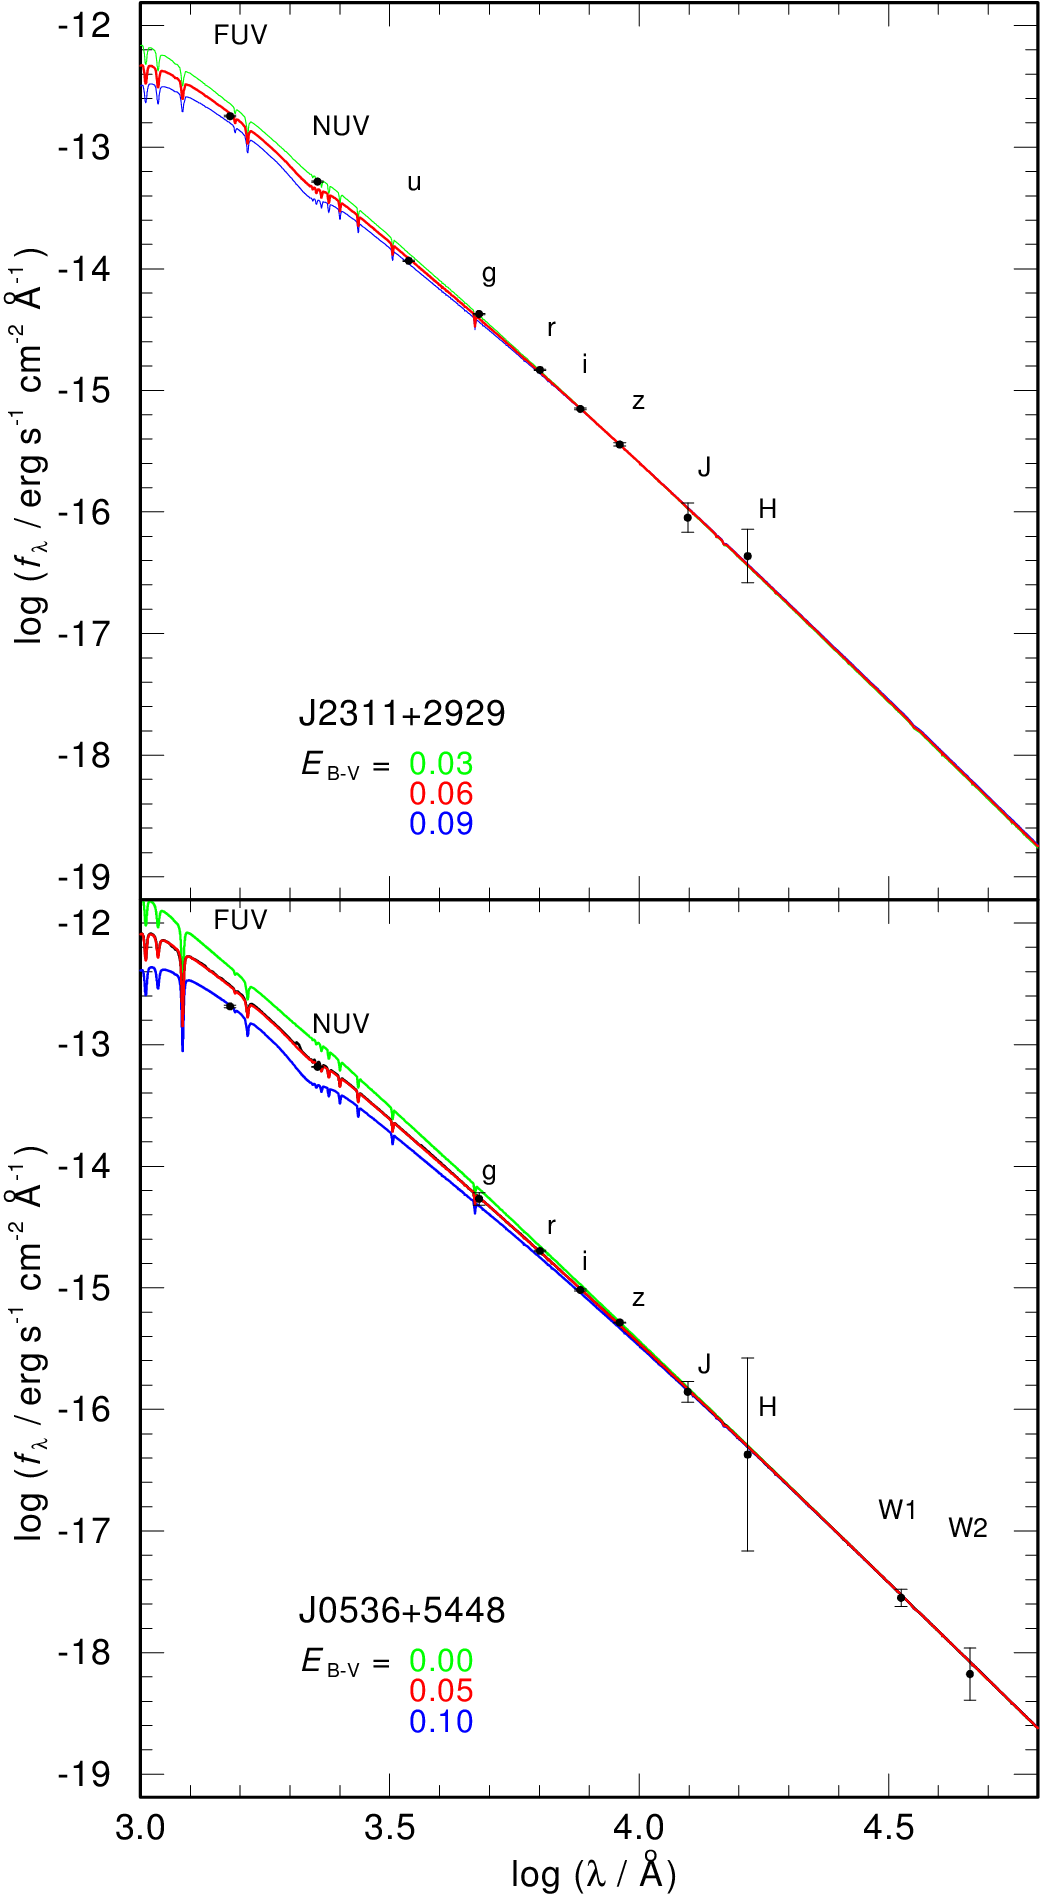
and converted them into fluxes. Next, we normalized our best fit model atmosphere flux to the band flux for J0536+5448 and to the
band flux for J2311+2929. Using the reddening law of Fitzpatrick (1999) we then applied different values of to the
model spectrum until a good agreement with the multi-band photometry was achived (Fig. 3). For J2311+2929 we found and . At the Gaia distances the Bayestar17 3D dust map
(Green
et al. 2014, 2018) gives for J2311+2929 and for J0536+5448.
These values agree within the error limits, but for J0536+5448 can be excluded, else the observed UV magnitudes
cannot be reproduced.
To calculate the error on the , the uncertainties of the stellar radius and the Eddington flux need to be considered.
The uncertainty of the latter depends on , , as well as the metal content of the model. In principle, a higher ,
lower , and higher metal content (flux is redistributed from the UV towards longer wavelengths) leads to a higher value
of .
The metal content of our stars is unknown, but to estimate the effect of metals on the Eddington flux in the band we obtained
the model spectrum of the most metal-rich DO-type white dwarf RE 0503-289 from the German Astrophysical Virtual Observatory service
TheoSSA222http://dc.zah.uni-heidelberg.de/theossa/q/web/form. Comparing the filter-weighted, integrated -band
fluxes of a pure He model with the one including metals (C, N, O, Si, P, S, Ca, Fe, Ni, Ge, Kr, Sn, Xe, Zn, and Ba), we find that the
V-band flux would be underestimated by 4%. Masses and radii of DO-type white dwarfs were obtained from very late thermal pulse
evolutionary tracks from Althaus et al. (2009, Fig. 4). The uncertainty of the radius of the star is determined
by the errors on and . The lack of the knowledge of the envelope mass adds an additional error of
about 5%.
The derived spectroscopic distances are listed in Table 2 and agree well with the Gaia distances. This
confirms the reliability of our spectral analysis and the theoretical evolutionary calculations. In turn, we can now also calculate the
radii of the two DO white dwarfs from the Gaia parallaxes, and using the mass-radius relationship of (Althaus et al. 2009) also
determine their masses. The results are listed in Table 3. Note that the larger errors for J0536+5448 on the radii and
masses derived from the Gaia data result from the larger uncertainty on and .
| J0536+5448 | J2311+2929 | |||
|---|---|---|---|---|
| Spec. | Gaia | Spec. | Gaia | |
| [pc] | ||||
| [pc] | ||||
| [] | ||||
| [] | ||||
5 Summary and conclusions
We reported about the discovery of two bright DO-type white dwarfs, J0536+5448 and J2311+2929, which rank among the eight brightest
DO-type white dwarfs known. We performed a non-LTE spectral analysis of these two objects to derive their effective
temperatures, surface gravities, C abundances (upper limit for J0536+5448), and upper limits for N and O.
For J2311+2929 the observed line cores of He II Å are too deep when compared to the best fit pure He model.
We could solve this problem by including CNO in our model atmosphere calculations. In J0536+5448 this problem is not apparent,
likely because this star has lower metal content. We found a discrepancy of C abundance derived from C IV Å
and C IV Å, as the latter two lines suggest a 0.002-0.003 lower C abundance. An inaccuracy of the atomic
data or a blend with an uhe line or another hitherto unknown line could be possible reasons. No lines of N and O could be
detected, which demonstrates that low resolution optical spectra are not suited to detect and derive abundances of those
elements. The atmospheric parameter of the two stars are summarized in Table 2.
Furthermore, we have determined the reddening and spectroscopic distances of the two stars. We found that our derived
values for agree within the error limits with those from the Bayestar17 3D dust map. We also find an a good
agreement of the spectroscopic distances, masses, and radii with those derived from Gaia parallaxes
(Table 3). This confirms the reliability of our spectral analysis with the statistical one sigma
uncertainty on and a three sigma error on .
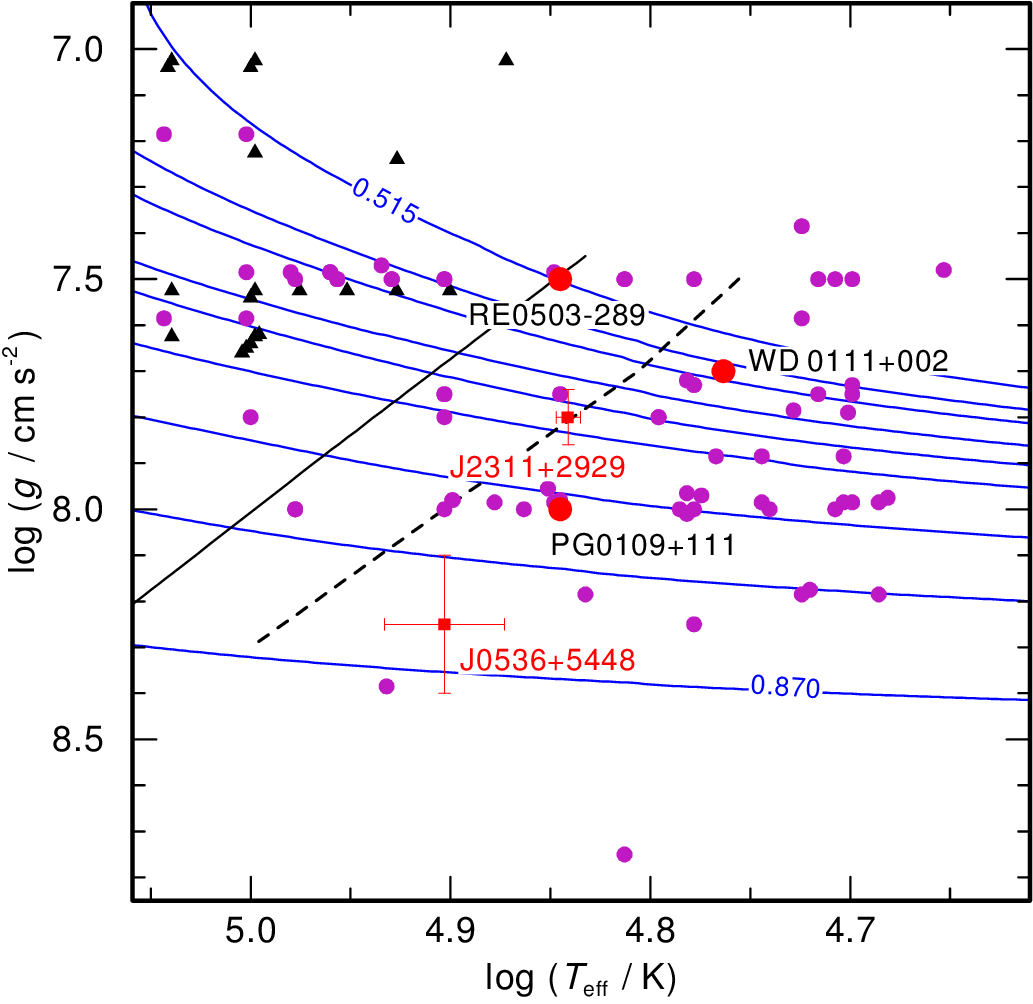
In Fig. 4 we show the locations of the newly discovered DO white dwarfs in the log – plane
compared to very late thermal pulse evolutionary tracks of Althaus et al. (2009). The black lines indicate when the
initial C abundance has dropped by a factor of two (solid line) and a factor of ten (dashed line) as predicted by
Unglaub &
Bues (2000). This explain why J2311+2929 still shows some C and J0536+5448 does not. Figure. 4 also shows the
locations of the three DO white dwarfs, RE 0503-298, WD 0111+002 and PG 0109+111, studied by
Hoyer et al. (2017, 2018). These stars are located close to the positions of our two bright DO white dwarfs,
therefore it seems likely that J0536+5448 and J2311+2929 display high abundances of trans-iron elements, too. Both stars are very bright
in the UV (Fig. 3, thus, they are excellent objects for follow-up observations in the ultra-violet
to search for trans-iron group elements.
Another interesting point that becomes obvious from Fig. 4, is that J0536+5448 ranks amongst the most massive DO
white dwarfs. Comparing the mass obtained form the Gaia parallax with the spectroscopic mass, we obtain a mass range of
. Because the theoretical variation of the fine structure constant with gravity is expected to
increase with the compactness () of an object, the detection of Fe V and Ni V lines in the spectrum of J0536+5448 would
be especially interesting. We note that the compactness of J0536+5448 could exceed the ones in the sample of Bainbridge
et al. (2017)
by a factor of , suggesting that if exhibits a gravitational dependence the effect could be notably larger than
the previous measurements. For example, if we assume for demonstrational purposes that the result from Berengut
et al. (2013) for
Fe V is correct and can be generalised to J0536+5448 then the variation of the fine structure constant could be as large as
. This is times larger the Berengut
et al. (2013) estimate for G191B2B using Fe V
(). A successful detection of such a variation would be the first direct measurement of a
gravitational field effect on a bare constant of nature.
Acknowledgements
NR is supported by a research fellowship of the Royal Commission for the Exhibition of 1851. SG acknowledges funding by the Heisenberg program of the Deutsche Forschungsgemeinschaft under grant GE 2506/8-1. This research has made use of NASA’s Astrophysics Data System, the VizieR catalogue access tool and the SIMBAD data base operated at CDS, Strasbourg, France. The TheoSSA service (http://dc.g-vo.org/theossa) and TMAD service ((http://astro.uni-tuebingen.de/~TMAD/) used to retrieve theoretical spectra and model atoms for this paper were constructed as part of the activities of the German Astrophysical Virtual Observatory. This work has made use of data from the European Space Agency (ESA) mission Gaia (https://www.cosmos.esa.int/gaia), processed by the Gaia Data Processing and Analysis Consortium (DPAC, https://www.cosmos.esa.int/web/gaia/dpac/consortium). Funding for the DPAC has been provided by national institutions, in particular the institutions participating in the Gaia Multilateral Agreement.
References
- Ahn et al. (2012) Ahn C. P., et al., 2012, ApJS, 203, 21
- Althaus et al. (2005) Althaus L. G., Serenelli A. M., Panei J. A., Córsico A. H., García-Berro E., Scóccola C. G., 2005, A&A, 435, 631
- Althaus et al. (2009) Althaus L. G., Panei J. A., Miller Bertolami M. M., García-Berro E., Córsico A. H., Romero A. D., Kepler S. O., Rohrmann R. D., 2009, ApJ, 704, 1605
- Bainbridge et al. (2017) Bainbridge M., et al., 2017, Universe, 3, 32
- Berengut et al. (2013) Berengut J. C., Flambaum V. V., Ong A., Webb J. K., Barrow J. D., Barstow M. A., Preval S. P., Holberg J. B., 2013, Physical Review Letters, 111, 010801
- Bianchi et al. (2014) Bianchi L., Conti A., Shiao B., 2014, VizieR Online Data Catalog, 2335, 0
- Chambers et al. (2016) Chambers K. C., et al., 2016, preprint, (arXiv:1612.05560)
- Cohen et al. (2003) Cohen M., Megeath S. T., Hammersley P. L., Martín-Luis F., Stauffer J., 2003, AJ, 125, 2645
- Cutri & et al. (2014) Cutri R. M., et al. 2014, VizieR Online Data Catalog, 2328, 0
- Dreizler & Heber (1998) Dreizler S., Heber U., 1998, A&A, 334, 618
- Dreizler & Werner (1996) Dreizler S., Werner K., 1996, A&A, 314, 217
- Dreizler et al. (1995) Dreizler S., Heber U., Napiwotzki R., Hagen H. J., 1995, A&A, 303, L53
- Fitzpatrick (1999) Fitzpatrick E. L., 1999, PASP, 111, 63
- Gaia Collaboration et al. (2016) Gaia Collaboration et al., 2016, A&A, 595, A1
- Gaia Collaboration et al. (2018) Gaia Collaboration Brown A. G. A., Vallenari A., Prusti T., de Bruijne J. H. J., Babusiaux C., Bailer-Jones C. A. L., 2018, preprint, (arXiv:1804.09365)
- Gianninas et al. (2010) Gianninas A., Bergeron P., Dupuis J., Ruiz M. T., 2010, ApJ, 720, 581
- Green et al. (2014) Green G. M., et al., 2014, ApJ, 783, 114
- Green et al. (2018) Green G. M., et al., 2018, preprint, (arXiv:1801.03555)
- Henden et al. (2016) Henden A. A., Templeton M., Terrell D., Smith T. C., Levine S., Welch D., 2016, VizieR Online Data Catalog, 2336
- Hirsch (2009) Hirsch H. A., 2009, PhD thesis, University Erlangen-Nürnberg
- Holberg & Bergeron (2006) Holberg J. B., Bergeron P., 2006, AJ, 132, 1221
- Hoyer et al. (2017) Hoyer D., Rauch T., Werner K., Kruk J. W., Quinet P., 2017, A&A, 598
- Hoyer et al. (2018) Hoyer D., Rauch. T., Werner K., Kruk J. W., 2018, preprint, (arXiv:1801.02414)
- Hügelmeyer et al. (2006) Hügelmeyer S. D., Dreizler S., Homeier D., Krzesiński J., Werner K., Nitta A., Kleinman S. J., 2006, A&A, 454, 617
- Iben et al. (1983) Iben Jr. I., Kaler J. B., Truran J. W., Renzini A., 1983, ApJ, 264, 605
- Krzesiński et al. (2009) Krzesiński J., Kleinman S. J., Nitta A., Hügelmeyer S., Dreizler S., Liebert J., Harris H., 2009, A&A, 508, 339
- Lawrence et al. (2013) Lawrence A., et al., 2013, VizieR Online Data Catalog, 2319, 0
- Miller Bertolami (2014) Miller Bertolami M. M., 2014, A&A, 562, A123
- Miller Bertolami et al. (2008) Miller Bertolami M. M., Althaus L. G., Unglaub K., Weiss A., 2008, A&A, 491, 253
- Miller Bertolami et al. (2014) Miller Bertolami M. M., Melendez B. E., Althaus L. G., Isern J., 2014, ArXiv e-prints 1406.7712,
- Napiwotzki (1999) Napiwotzki R., 1999, A&A, 350, 101
- Preval et al. (2015) Preval S. P., Barstow M. A., Holberg J. B., Barrow J., Berengut J., Webb J., Dougan D., Hu J., 2015, in Dufour P., Bergeron P., Fontaine G., eds, Astronomical Society of the Pacific Conference Series Vol. 493, 19th European Workshop on White Dwarfs. p. 415 (arXiv:1410.0809)
- Rauch & Deetjen (2003) Rauch T., Deetjen J. L., 2003, in Hubeny I., Mihalas D., Werner K., eds, Astronomical Society of the Pacific Conference Series Vol. 288, Stellar Atmosphere Modeling. p. 103 (arXiv:astro-ph/0403239)
- Rauch et al. (2012) Rauch T., Werner K., Biémont É., Quinet P., Kruk J. W., 2012, A&A, 546, A55
- Rauch et al. (2014a) Rauch T., Werner K., Quinet P., Kruk J. W., 2014a, A&A, 564, A41
- Rauch et al. (2014b) Rauch T., Werner K., Quinet P., Kruk J. W., 2014b, A&A, 566, A10
- Rauch et al. (2015a) Rauch T., Werner K., Quinet P., Kruk J. W., 2015a, A&A, 577, A6
- Rauch et al. (2015b) Rauch T., Hoyer D., Quinet P., Gallardo M., Raineri M., 2015b, A&A, 577, A88
- Rauch et al. (2016) Rauch T., Quinet P., Hoyer D., Werner K., Demleitner M., Kruk J. W., 2016, A&A, 587, A39
- Rauch et al. (2017a) Rauch T., Gamrath S., Quinet P., Löbling L., Hoyer D., Werner K., Kruk J. W., Demleitner M., 2017a, A&A, 599, A142
- Rauch et al. (2017b) Rauch T., Quinet P., Knörzer M., Hoyer D., Werner K., Kruk J. W., Demleitner M., 2017b, A&A, 606, A105
- Reindl et al. (2014) Reindl N., Rauch T., Werner K., Kepler S. O., Gänsicke B. T., Gentile Fusillo N. P., 2014, A&A, 572, A117
- Schuh et al. (2008) Schuh S., et al., 2008, Astronomische Nachrichten, 329, 376
- Sion (2011) Sion E. M., 2011, Hot White Dwarfs. WILEY-VCH, p. 1
- Unglaub & Bues (2000) Unglaub K., Bues I., 2000, A&A, 359, 1042
- Werner & Herwig (2006) Werner K., Herwig F., 2006, PASP, 118, 183
- Werner & Rauch (2014) Werner K., Rauch T., 2014, A&A, 569, A99
- Werner et al. (1995) Werner K., Dreizler S., Heber U., Rauch T., Wisotzki L., Hagen H.-J., 1995, A&A, 293, L75
- Werner et al. (2003) Werner K., Deetjen J. L., Dreizler S., Nagel T., Rauch T., Schuh S. L., 2003, in Hubeny I., Mihalas D., Werner K., eds, Astronomical Society of the Pacific Conference Series Vol. 288, Stellar Atmosphere Modeling. p. 31 (arXiv:astro-ph/0209535)
- Werner et al. (2012) Werner K., Dreizler S., Rauch T., 2012, TMAP: Tübingen NLTE Model-Atmosphere Package, Astrophysics Source Code Library (ascl:1212.015)
- Werner et al. (2014) Werner K., Rauch T., Kepler S. O., 2014, A&A, 564, A53
- Zhang & Jeffery (2012a) Zhang X., Jeffery C. S., 2012a, MNRAS, 419, 452
- Zhang & Jeffery (2012b) Zhang X., Jeffery C. S., 2012b, MNRAS, 426, L81
- Zinn et al. (2018) Zinn J. C., Pinsonneault M. H., Huber D., Stello D., 2018, preprint, (arXiv:1805.02650)