Stimulated excitation of an optical cavity
by a multi-bunch electron beam
via coherent diffraction radiation process
Abstract
With a low emittance and short-bunch electron beam at a high repetition rate realized by a superconducting linac, stimulated excitation of an optical cavity at the terahertz spectrum range has been shown. The electron beam passed through small holes in the cavity mirrors without being destroyed. A sharp resonance structure which indicated wide-band stimulated emission via coherent diffraction radiation was observed while scanning the round-trip length of the cavity.
pacs:
41.60.Cr, 41.60.Dk, 42.60.Da, 07.57.Hm, 29.27.BdIntroduction
Light sources have played important roles in progress of science in various fields. The technologies of light sources are most immature in the terahertz range, which is usually defined from 0.3 to 3 THz. Coherent emission of electromagnetic radiation from a short-bunch electron beam in an electron linac can be used as a terahertz radiation source. With an energy-recovery linac (ERL) scheme Ben-Zvi (2016) which realizes a high average current beam in a linac layout by recycling the beam energy, a high power terahertz source can be realized Carr et al. (2002); G.A.Krafft (2004); Shevchenko et al. (2012). Conventionally, the coherent synchrotron radiation (CSR) has been considered as the radiation mechanism, including the layout of a bending magnet or an undulator. On the other hand, various other mechanisms can also be used, including transition radiation and diffraction radiation. One advantage of these over the synchrotron radiation is the simple geometry located in a straight pass. Another feature is the spatial mode of the radiation, which are radiated in a higher-order transverse mode with radial polarization. Coherent transition radiation (CTR) is emitted when a short-bunch electron beam hits a metal target. CTR is widely used for electron beam diagnostics of accelerators Kung et al. (1994); Murokh et al. (1998). However, it cannot be used as a high power source because it destroys the electron beam. Coherent diffraction radiation (CDR) Potylitsyn (1998) is a similar radiation mechanism as CTR. Radiation is emitted when an electron beam non-destructively passes near the target.
Here, we consider an optical cavity system which stacks the coherent radiation emitted in the cavity, in other words, the beam excites the optical cavity. When the cavity is excited at resonance, an electron bunch coherently emits radiation in the electromagnetic field that already exists in the cavity. This results in extracting more radiated power from the electron bunch than a simple setup that is not based on a cavity. This mechanism is called stimulated radiation. Such a system has been proposed for applications in a high-flux X-ray production Shimada and Hajima (2010); Shimada et al. (2013).
The principle of stimulated radiation has been tested by CTR Lihn et al. (1996) and CSR Shibata (1997, 2004a, 2004b) in destructive layouts. In these experiments, by measuring the radiation power while scanning the round-trip length of the optical cavities, one can observe sharp resonance peaks due to stimulated radiation. A test in CDR layout has been performed with a limited number of bunches Aryshev et al. (2014).
The advantage of CDR layout is its availability in a high power accelerator. A superconducting linac that can produce a short-bunch beam at high repetition rate in a continuous operational mode fits this advantage. We report an experiment performed at a modern superconducting linac constructed as a test facility of ERL Akemoto et al. (2018). The low emittance beam produced by the photocathode injector can realize the CDR layout which requires the beam pass through a small aperture. The sub-ps short bunch beam generated in bunch compression mode Honda et al. (2017) emits coherent radiation in the terahertz range. We present a result showing evidence of stimulated radiation produced in an optical cavity by a multi-bunch beam passing through the cavity. To the best of our knowledge, this is the first experiment to clearly show a stimulated radiation signal in the terahertz range with a CDR layout.
Principle
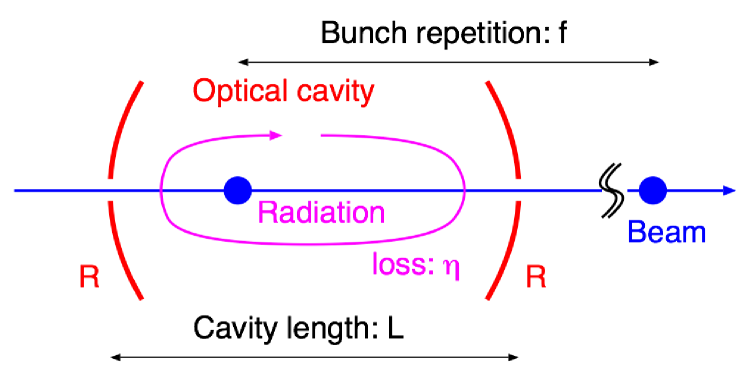
We consider a situation shown in Figure 1. An optical cavity formed by two concave mirrors with a small hole in the center is installed in a straight pass of an electron beam. The cavity length is the distance between the mirrors. And it is designed so as to match the round-trip time to the bunch repetition rate . For simplicity, we limit our discussion to a symmetric case, i.e., the two mirrors have the same curvature and the system has cylindrical symmetry.
The eigenmodes of the cavity couple with the beam via the electric field along the beam trajectory. Since the fundamental transverse mode of the cavity does not have a longitudinal field at the center, it cannot be excited in this layout. On the other hand, the odd higher-order transverse modes can be excited. For example, the transverse electric field of the 1-st-order mode is written as follows Siegman (1986):
| (1) |
where is the beam direction and is the transverse distance from the beam axis. The transverse beam size is described as , where and are the beam waist and the Rayleigh length, respectively. They are related by , where is the radiation wavelength, , and . is known as the Gouy phase, which depends on the order of the transverse mode, where for the 1-st-order mode. The longitudinal field of the mode can be obtained from the general relation Scully and Zubairy (1991), . The beam moves at the speed of light along the axis and encounters a longitudinal field of
| (2) |
The excitation energy in the cavity mode can be calculated from the well-known relation describing the coupling between the beam and cavity: Chao et al. (2013);
| (3) |
where is the bunch charge. is the energy stored in the cavity corresponding to the electric field . The integration should be done along the beam trajectory within the cavity. Since the cavity length is fixed based on the bunch repetition rate, the only free parameter is the curvature radius of the mirrors . The eigenmode size can be changed by selecting the appropriate value of . From the calculation above, the maximum beam coupling is realized at , which is the so-called confocal cavity design.
In the case of multi-bunch excitation, the signal of each bunch stacks as a coherent amplitude addition. The amplitude after the -th bunch becomes , where is the power loss and is the phase shift over a single round-trip, respectively. can be changed by finely changing in a scale within the wavelength. The power enhancement gain after an infinite number of bunches can be obtained as
| (4) |
The enhancement gain at resonance is . High radiation power is extracted at a lower cavity loss.
The optical cavity has many longitudinal modes that correspond to frequencies that are integer multiples of the round-trip frequency. In general, the Gouy phase for each longitudinal mode is different, and hence, the resonance condition is different for each mode. Shift of the resonance condition for the -th longitudinal mode is given as
| (5) |
In the special confocal cavity design, becomes an integer multiple of for all , resulting in all longitudinal modes being excited simultaneously. Under a similar consideration, it can be shown that all odd ordered transverse modes are also excited under the same condition. This mechanism can be described as a picture of the carrier-envelope phase (CEP) of the pulse traveling back-and-forth in the optical cavity. The confocal cavity is a special case with zero-CEP shift, and hence, it can coherently add broad spectral signals in a multi-bunch beam.
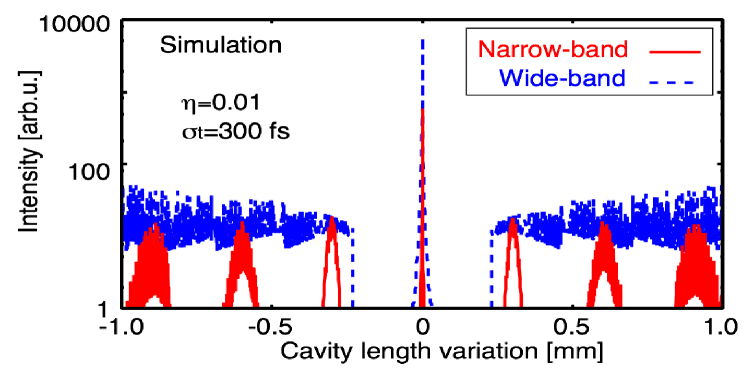
In the experimental case, we finely scan while measuring the excited power in the cavity under a given beam repetition rate. Figure 2 shows a calculation example. The cavity loss is . This calculation was performed by including the effects of the bunch spectrum, assuming an RMS bunch length of 300 fs. A sharp resonance peak is observed when the resonance conditions are satisfied for all modes, which we call perfect synchronization. The width of the resonance is referred to as the finesse , which is defined as the ratio between the half-wavelength and the fullwidth-half-maximum of the resonance peak. The finesse is determined only by the cavity loss as .
Experimental Setup
We performed an experiment at cERL Akemoto et al. (2018) in KEK. This experiment was performed at the burst operation of energy non-recovery mode. In the burst operation, the electron beam emission at the gun was time-gated by a photo-cathode laser system, while all the RF systems in the accelerator cavities were operated in CW. The beam condition in this experiment was as follows; The beam energy was 17.8 MeV, the bunch charge was set to be 1.2 pC, and the macro-pulse duration was 1 s, which contains 1300 bunches at 1.3 GHz repetition. The beam was operated in bunch compression mode Honda et al. (2017). A bunch length shorter than 300 fs was realized in the straight section where our experimental setup was installed. The normalized beam emittance in the straight section was measured to be 1.4 mmmrad. The electron beam optics were adjusted to focus the beam at the location using two quadrupole magnets placed at 1.58 m and 4.78 m upstream of the cavity. The RMS beam size in the horizontal and vertical planes were measured to be 250 m and 60 m, respectively.
Figure 3 shows the layout of the optical cavity system. Two identical gold-coated copper mirrors were used as cavity mirrors. The cavity was designed to satisfy the confocal condition. Both the curvature radius of the mirror and the cavity length were 115 mm, which corresponds to a bunch repetition of 1.3 GHz. The thickness of the mirrors was 10 mm, the diameter of the mirrors was 50 mm, and the diameter of the holes at the center was 3 mm. The eigenmode size is calculated to be mm on the mirror at 0.5 THz. The relative alignment of the mirrors had 50 m precision using angular adjusters of the mirror holders referring mechanical measurements. In order to scan the cavity length, the downstream mirror was mounted on a piezo stage, which can be controlled up to 1 nm precision within a 20 mm range. The entire cavity structure was mounted on a manipulator so that the structure could be removed from the beam axis in the vacuum chamber.
A scintillator screen can be inserted at the center of the cavity in order to tune the electron beam size and position in the cavity. To detect local beam loss in the cavity, beam loss monitors Takai et al. (2014) were installed near the CDR cavity.
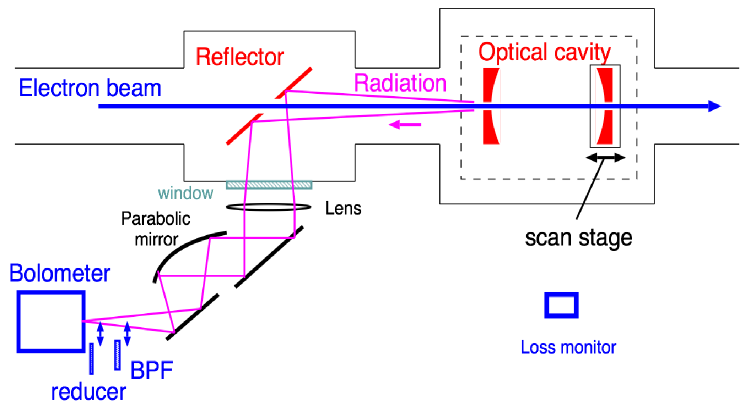
A fraction of the radiation power inside the cavity was emitted through the holes in both directions. Only emission in the upstream direction was measured. The radiation was reflected along the transverse direction by a reflector installed in a separate chamber 309 mm upstream of the cavity. The reflector was a gold-coated flat stainless steel plate mirror angled 45 degrees with respect to the beam line. It has an elliptical hole, which appeares as a 10 mm diameter circular aperture from the perspective of the electron beam. The radiation was transmitted to air through a sapphire window.
The radiation extracted from the vacuum chamber was first collimated by a lens. Then, it was focused by a parabolic mirror. At the focal point, a liquid-helium cooled Si bolometer (Infrared Laboratories, Inc.) was used as the terahertz radiation detector. We prepared a band-pass filter with 0.5 THz center frequency and 10 % bandwidth (fullwidth half-maximum), and this filter was inserted in front of the detector.
Experimental Result
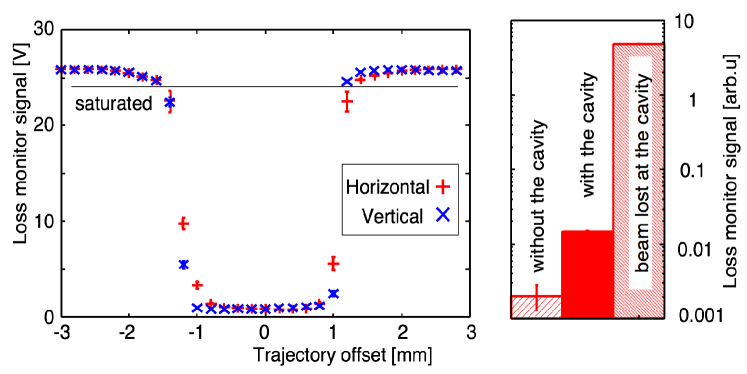
Referring to the signal at the beam loss monitors, the local beam trajectory at the cavity was scanned. Figure 4 shows the loss monitor signal as a function of the beam position offset. It shows that the beam trajectory was well optimized to be at the center of the holes with apploximately 1 mm clearance. A quantitative estimation of the beam loss was performed by comparing the loss monitor signal in three cases: without the cavity, when beam passes through the cavity, and when the beam hits at the cavity. The fraction of beam loss at the cavity was estimated to be 2500 ppm.
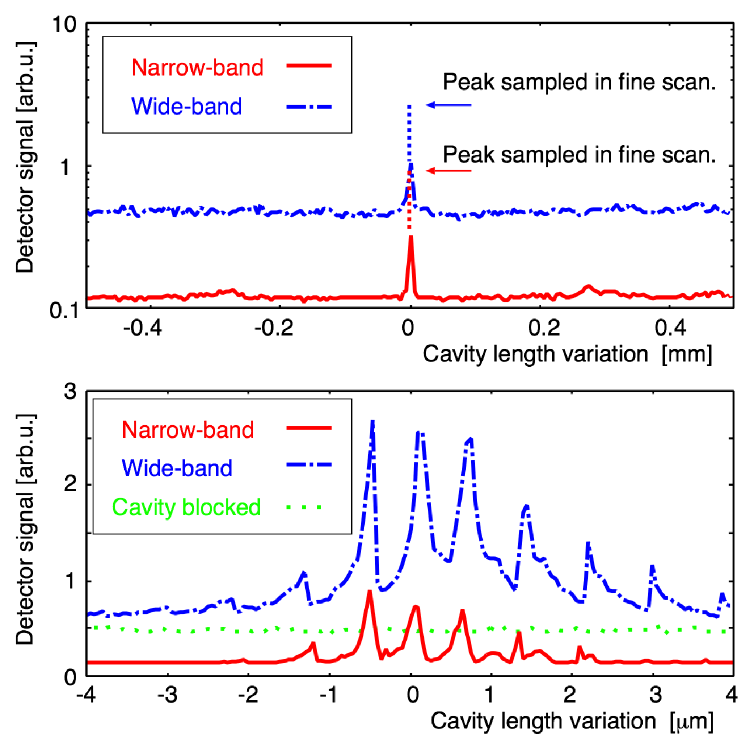
The cavity length was scanned while measuring the bolometer signal. Figure 5 shows the results from narrow-band and wide-band measurements, corresponding to the measurements taken with and without the 0.5 THz band-pass filter, respectively. A sharp peak was observed, indicating the cavity was excited at resonance. In the narrow-band measurement, small peaks were repeatedly observed with 0.3 mm separation along the cavity length, which corresponds to a half-wavelength of a 0.5 THz wave. A precise scan around the peak was performed to determine the profile of the resonance peak, It turned out that the peak was split into fine structures. The width of a single peak was measured to be 150 nm. The overall shape of the peak looks similar for both wide-band and narrow-band measurements. Figure 5 (bottom) also shows wide-band measurement data when the screen monitor was inserted in the cavity for blocking the cavity resonance. We confirmed that the resonance peaks disappeared in this case. Even in this blocked condition, the bolometer detected some background signal, which is treated as a baseline signal that is independent of cavity length.
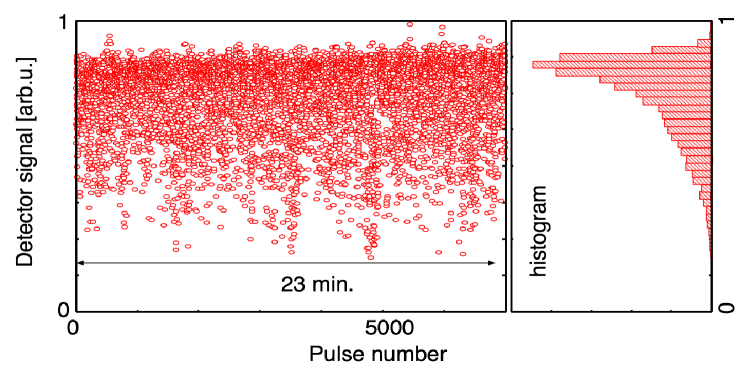
In order to evaluate the stability of the system, long-term data was taken with the cavity length fixed at one of the peaks. Figure 6 shows the bolometer signal from 7000 continuous beam pulses, which corresponds to 23 minutes of operation. Although shot-by-shot fluctuations were observed, the cavity tended to remain at resonance. 74 % of the data were higher than 75 % of the maximum.
Discussion
The appearance of the resonance structure in the cavity scan proves that stimulated emission occurs in the cavity. Resonance occurs at the perfect synchronization between the radiation round-trip rate in the cavity and the bunch repetition rate.
From the fine-structured peak width, the measured finesse was estimated to be 1000. The observed finesse is more than one order of magnitude higher than past stimulated radiation experiments Lihn et al. (1996); Shibata (1997); Aryshev et al. (2014).
Comparing the wide-band and narrow-band measurement results, the width of the peaks looks almost the same. This means that the resonance condition coincides through the wide spectrum of the longitudinal modes. This confirms that the optical cavity is designed to have a zero-CEP shift as expected.
The fine structures of the peaks are not what we originally expected. We guess each peak corresponds to higher-order transverse modes in the cavity. These transverse modes should be degenerate if the cylindrical symmetry of the cavity was perfect. The relative mirror misalignment sensitively affects the cylindrical symmetry of the eigenmodes, and it can split the resonance conditions.
A baseline offset of about 1/5 of the peak was observed. We guess that the origin of the baseline originates from backward emission of diffracted radiation at the outside surface of the upstream cavity mirror.
The beam loss in the cavity was estimated to be 2500 ppm. However, compared with the beam size and the clearance of the mirror aperture, the loss should be much lower under the assumption of a simple Gaussian distribution. There might exist a non-Gaussian beam halo in the electron beam Tanaka et al. (2018). By removing the beam halo using collimators located at the upstream part of the accelerator, we expect to be able to reduce the beam loss Akagi et al. (2016); Obina et al. , and the system might be compatible with the CW high current operation Alarcon et al. (2013).
Conclusion
A scheme based on the CDR is attractive as a unique accelerator-based light source in the terahertz spectral range. This scheme may be compatible with a high power accelerator, such as ERL, because it does not destroy the electron beam. The stimulated radiation mechanism can be considered in order to greatly enhance the extraction efficiency of radiation from the electron beam,
We performed an experiment to show the stimulated radiation process with the CDR layout. An optical cavity with a small beam hole was installed along the straight beam pass of an ERL test accelerator, which could provide a low emittance and short-bunch beam with a high repetition rate. A sharp resonance peak was observed during the cavity length scan, indicated stimulated radiation occurs at the perfect synchronization. Thanks to the CEP-optimized design of an optical cavity, cavity modes in a wide-band spectrum were coherently excited simultaneously.
Acknowledgements.
We appreciate the cERL development team for their support in regard to the beam operation. This work was partially supported by JSPS KAKENHI Grant Number 16H05991 and 18H03473, and by Photon and Quantum Basic Research Coordinated Development Program from the Ministry of Education, Culture, Sports, Science and Technology, Japan.References
- Ben-Zvi (2016) I. Ben-Zvi, Supercond. Sci. Technol. 29, 103002 (2016).
- Carr et al. (2002) G. L. Carr et al., nature 420, 153 (2002).
- G.A.Krafft (2004) G.A.Krafft, Phys. Rev. ST-AB. 7, 060704 (2004).
- Shevchenko et al. (2012) O. Shevchenko et al., Proceedings of FEL2012 (2012).
- Kung et al. (1994) P. Kung et al., Phys. Rev. Lett. 73, 967 (1994).
- Murokh et al. (1998) A. Murokh et al., Nucl. Instrum. Meth. A 410, 452 (1998).
- Potylitsyn (1998) A. Potylitsyn, Nucl. Instrum. Meth. B 145, 169 (1998).
- Shimada and Hajima (2010) M. Shimada and R. Hajima, Phys. Rev. ST-AB. 13, 100701 (2010).
- Shimada et al. (2013) M. Shimada et al., Proceedings of IPAC2013 , 1598 (2013).
- Lihn et al. (1996) Lihn et al., Phys. Rev. Lett. 76, 4163 (1996).
- Shibata (1997) Shibata, Phys. Rev. Lett. 78, 2740 (1997).
- Shibata (2004a) Shibata, Nucl. Instrum. Meth. A 528, 162 (2004a).
- Shibata (2004b) Shibata, Nucl. Instrum. Meth. A 528, 157 (2004b).
- Aryshev et al. (2014) A. Aryshev et al., Nucl. Instrum. Meth. A 763, 424 (2014).
- Akemoto et al. (2018) M. Akemoto et al., Nucl. Instrum. Meth. A , 197 (2018).
- Honda et al. (2017) Y. Honda et al., Nucl. Instrum. Meth. A 875, 156 (2017).
- Siegman (1986) A. Siegman, University Science Books (1986).
- Scully and Zubairy (1991) M. O. Scully and M. S. Zubairy, Phys. Rev. A. 44, 2656 (1991).
- Chao et al. (2013) A. Chao et al., World Scientific (2013).
- Takai et al. (2014) R. Takai et al., Proceedings of IBIC2014 , 7 (2014).
- Tanaka et al. (2018) O. Tanaka et al., Phys. Rev. AB. 21, 024202 (2018).
- Akagi et al. (2016) T. Akagi et al., Phys. Rev. AB. 19, 114701 (2016).
- (23) T. Obina et al., .
- Alarcon et al. (2013) R. Alarcon et al., Phys. Rev. Lett. 111, 164801 (2013).