The Distance of the Dark Matter Deficient Galaxy NGC1052–DF2
Abstract
We recently inferred that the galaxy NGC1052–DF2 has little or no dark matter and a rich system of unusual globular clusters. We assumed that the galaxy is a satellite of the luminous elliptical galaxy NGC1052 at Mpc, on the basis of its surface brightness fluctuations (SBF) distance of Mpc, its radial velocity of km/s, and its projected position. Here we analyze the color-magnitude diagram (CMD) of NGC1052–DF2, following the suggestion by Trujillo et al. (2018) that the tip of the red giant branch (TRGB) can be detected in currently available HST data and the galaxy is at Mpc. Using fully populated galaxy models we show that the CMD is strongly influenced by blends. These blends produce a “phantom” TRGB times brighter than the true TRGB, which can lead to erroneous distance estimates times smaller than the actual distance. We compare NGC1052–DF2 to model images as well as other galaxies in our HST sample, and show that the large population of unblended RGB stars expected for distances of Mpc is not detected. We also provide a new distance measurement to NGC1052–DF2 that is free of calibration uncertainties, by anchoring it to a satellite of the megamaser host galaxy NGC4258. From a megamaser-TRGB-SBF distance ladder we obtain Mpc, consistent with our previous measurement and with the distance to the elliptical galaxy NGC1052.
Subject headings:
galaxies: evolution — galaxies: structure1. Introduction
We recently identified a galaxy with little or no dark matter (van Dokkum et al. 2018a, hereafter vD18a). NGC1052–DF2, originally discovered by Fosbury et al. (1978), is a quiescent, spheroidal “ultra diffuse” galaxy (UDG; van Dokkum et al. 2015) with an effective radius of kpc, a central surface brightness mag arcsec-2, and a stellar mass of M⊙. It has a remarkable population of globular clusters that rival Centauri in their luminosities, sizes, and ellipticities (van Dokkum et al. 2018b, hereafter vD18b). The globular cluster system has an average radial velocity of km s-1 and a velocity dispersion of km/s (see van Dokkum et al. 2018c). This dispersion is similar to that expected from the stellar mass alone ( km/s), and using generative Jeans modeling in a Bayesian framework Wasserman et al. (2018) derive a 90 % upper limit of M⊙, for a wide prior on the halo mass. Martin et al. (2018) find similar values for the velocity dispersion (somewhat depending on the assumptions), although they argue for weaker constraints on the total amount of dark matter that could be present.
Most of these aspects depend on the distance that is assumed for the galaxy. There is circumstantial evidence for a distance of Mpc: it is located only away from the luminous elliptical galaxy NGC1052, which has distance measurements ranging from 19.4 Mpc to 21.4 Mpc (Tonry et al. 2001; Blakeslee et al. 2002), and its radial velocity implies a distance of Mpc if it is at rest with respect to the Hubble flow. However, as noted in vD18a, the properties of the galaxy are less extreme if it is closer to us. In particular, the peak of the contamination-corrected globular cluster luminosity function would coincide with the canonical value for a distance of Mpc. The ratio of dark matter to luminous matter would also be closer to expectations (although still low). A distance of Mpc would imply a peculiar velocity of order km/s for the galaxy, but it is difficult to argue that this is less likely than having a population of extreme globular clusters and an unusually low dark matter content.

In vD18a we argued that we do not detect individual red giant branch (RGB) stars in NGC1052–DF2, and attributed this to the large distance of the galaxy. For distances Mpc, individual giants are undetected in single-orbit HST images but blend into surface brightness fluctuations (SBF) where the stellar density is high enough. Hence we used SBF in the inner parts of the galaxy to determine the distance to NGC1052–DF2, arriving at Mpc. Trujillo et al. (2018) (hereafter T18) suggest that individual RGB stars are detected in the HST imaging of NGC1052–DF2. They detect many compact objects, and identify a sharp increase in the number of detections below . Interpreting this ridge in the CMD as the TRGB, the distance they find is Mpc. They also cast doubt on the SBF distance that was derived in vD18, suggesting that calibration errors led to an overestimate of the distance.
In this Letter we analyze the CMD of NGC1052–DF2 and show that blends produce a “phantom” TRGB that is brighter than the true TRGB. We also derive a distance to NGC1052–DF2 that is independent of the absolute calibration of the SBF signal. This paper is a companion to a study of all 23 galaxies in our Cycle 24 HST program (Cohen et al. 2018, hereafter C18).

2. Modeling the Color-Magnitude Distribution
2.1. Observed CMD
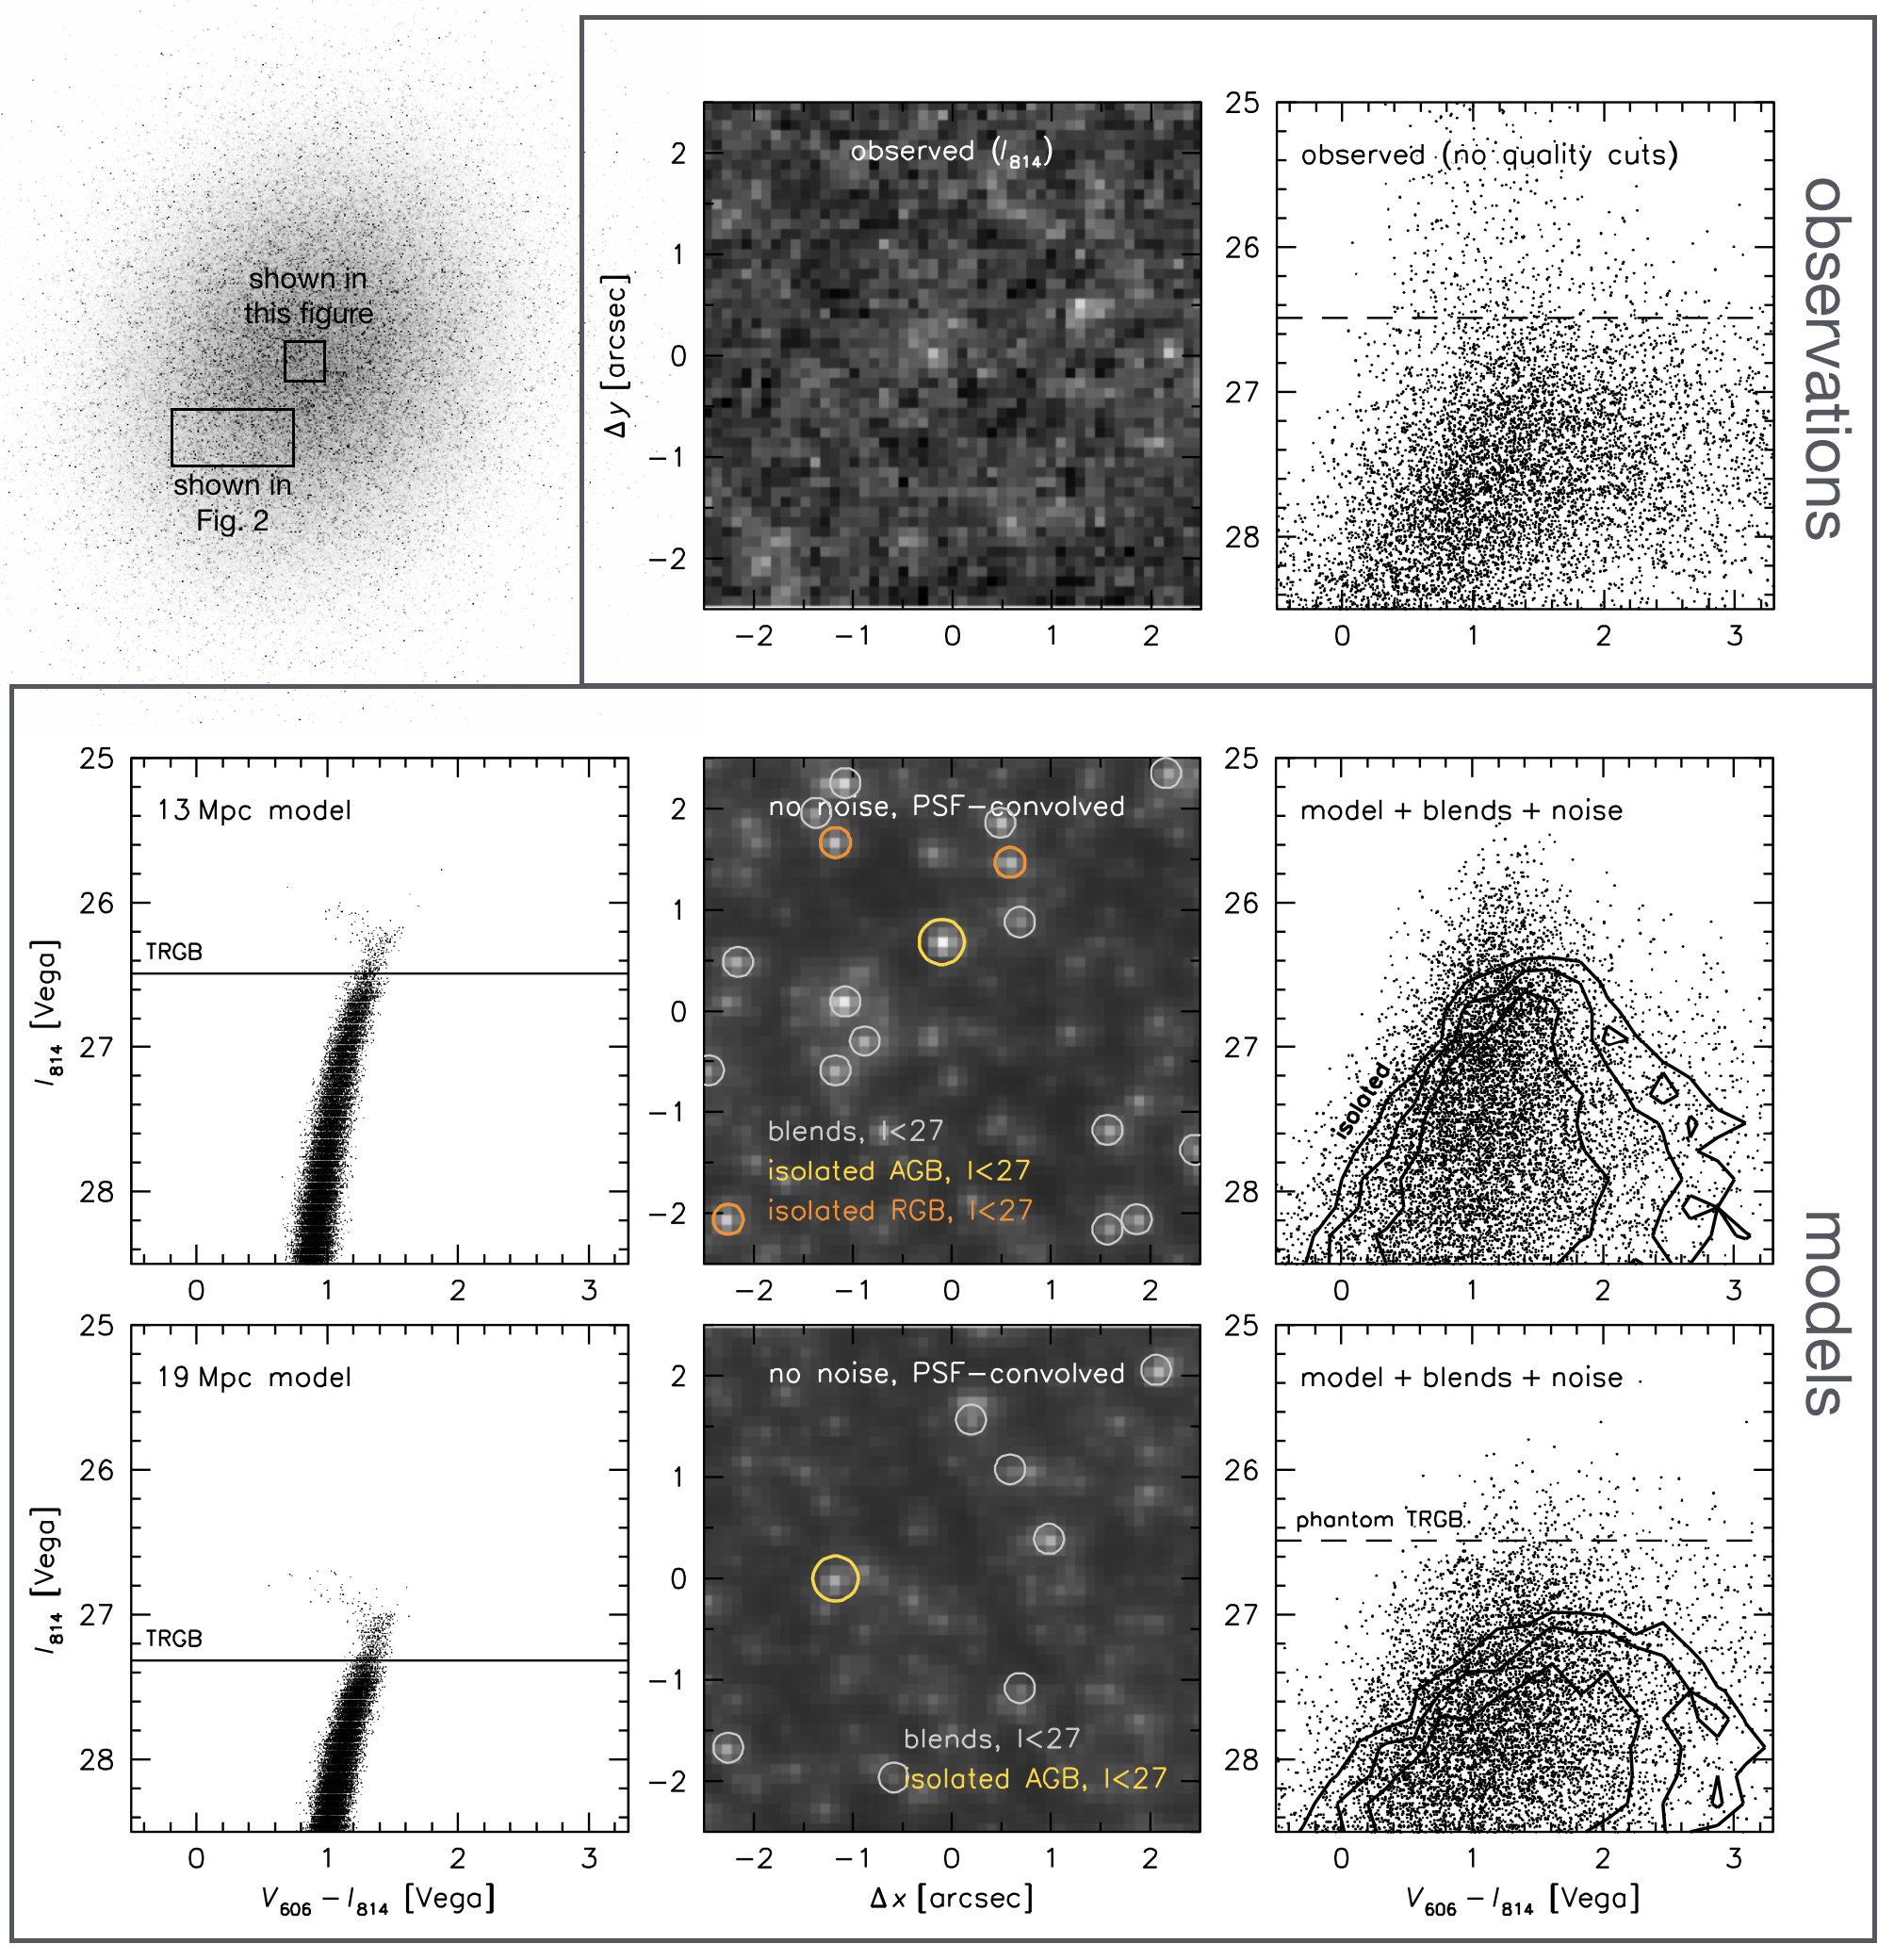
The “raw” distribution of detected sources in the CMD of NGC1052–DF2 is shown in the top right panel of Fig. 1. The photometric analysis was done using the ACS module of DOLPHOT, which itself is based on HSTPHOT (Dolphin 2000). DOLPHOT operates directly on the flc files. Our methodology is outlined in Danieli et al. (2017) and C18; we follow identical procedures to those established in Dalcanton et al. (2009) for crowded ACS photometry, as described in detail in the DOLPHOT manual.111http://americano.dolphinsim.com/dolphot/dolphotACS.pdf
DOLPHOT measures various parameters of the detected sources (such as their sharpness and degree of crowding) in order to remove spurious detections and blends (see, e.g., Fig. 2 in Müller, Rejkuba, & Jerjen 2018). The “raw” CMD shown in Fig. 1 includes all DOLPHOT detections within a radius of , before applying any of these quality cuts. DOLPHOT detects many sources in NGC1052–DF2: 1609 with . Furthermore, there is a conspicuous ridge in the CMD at , indicated with the dashed line. Interpreting this ridge as the TRGB would imply a distance of Mpc (T18, C18). but we demonstrate below that it is spurious.

2.2. Modeled CMDs at 13 Mpc and 19 Mpc
To understand the distribution of detections in the observed CMD we generated fully populated model galaxies with ArtPop. This code is described in detail in § 2 of Danieli, van Dokkum, & Conroy (2018). Briefly, ArtPop draws stars from the MIST isochrones (Dotter 2016; Choi et al. 2016) for a specified IMF and set of stellar population parameters, determines the brightness of the stars in particular filters for a chosen distance, and places them in an image according to a specified spatial distribution (parameterized by the position, effective radius, Sersic (1968) index, ellipticity, and position angle). The images are optionally convolved with an instrumental PSF. The NGC1052–DF2 models are constrained to reproduce its observed integrated color and 2D surface brightness distribution, while varying the distance. Specifically, the 19 Mpc model has an age of 10 Gyr, [Fe/H], and total magnitudes of , . Its stellar mass is M⊙ and the simulated image contains stars down to . The 13 Mpc model is very similar but has a stellar mass of M⊙. The CMDs of models at 13 Mpc and at 19 Mpc are shown in the left panels of Fig. 1. The photometry was perturbed slightly to limit overlap between the plotted points. For these distances the TRGB is at and respectively, according to the color-dependent calibration of Rizzi et al. (2007).
The central regions of the ArtPop images, convolved with the PSF, are shown in the middle column. Many compact objects are visible in the central and throughout the images. However, most of these are not isolated stars but blends. We identified blends by calculating the flux contribution by other stars with within a radius of . If this contribution exceeds 20 % the primary star and the contaminating stars are flagged as blends. The circles in the simulated images indicate unblended stars with , below (orange) and above (yellow) the TRGB. There are only four unblended stars in the central regions of the 13 Mpc model, and only one in the 19 Mpc model. This result is not sensitive to the precise definition of blends: in both models blends vastly outnumber isolated stars among the bright detections.
Next, we simulate the observed CMD by summing the fluxes of blended stars and adding photometric noise (determined using DOLPHOT’s artificial star photometry; see C18). The results are shown in the right panels of Fig. 1. The distribution of sources in the CMD shows marked differences between the 13 Mpc and 19 Mpc models: at 13 Mpc the basic outline of the giant branch is conserved as a fairly narrow, near-vertical plume of points, whereas at 19 Mpc the distribution is broad and red. The 19 Mpc model reproduces the qualitative features of the observed distribution in the CMD, including the ridge at . Stars near the ridge line are almost exclusively blends of stars just below the true TRGB, producing a mean boost to the flux of 0.6 mag. This is not a new result: it is well known that blends produce a “phantom” TRGB above the true tip, with the distance between the true and phantom TRGB a function of the stellar density (see, e.g., Fig. 4 in Bailin et al. 2011). Very approximately, the boost is a factor of , leading to a factor of error in the distance.
2.3. Analysis of Simulated Data
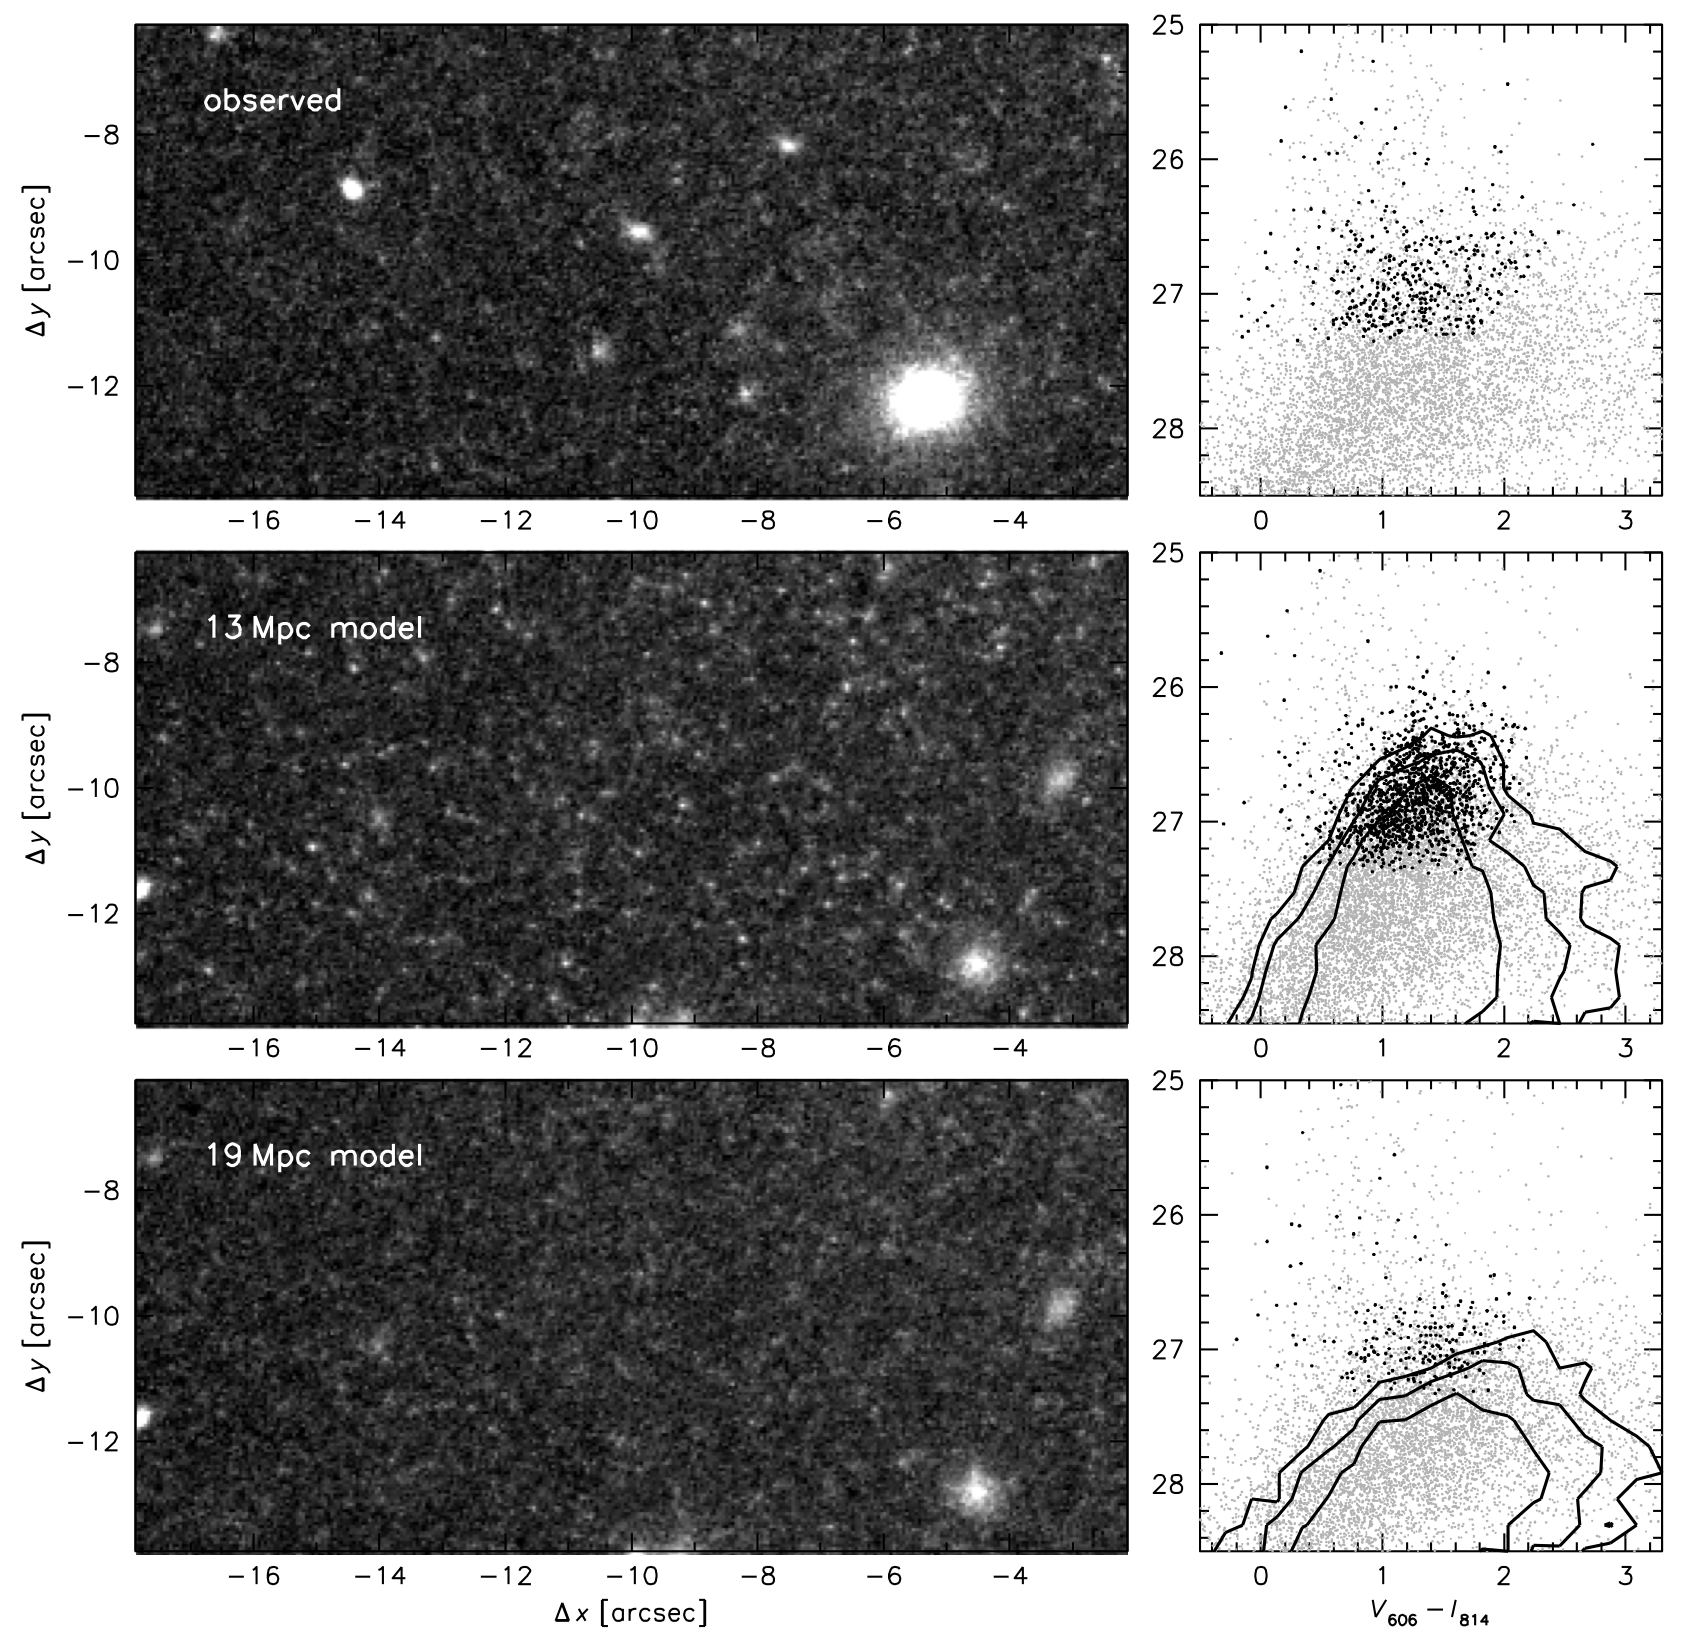
As noted above, in nearly all studies of the CMD detected objects are subjected to stringent quality cuts, in order to mitigate the effects of blends and spurious sources (see, e.g., Dalcanton et al. 2009; Radburn-Smith et al. 2011; McQuinn et al. 2017). We simulate these cuts, as well as the effects of background galaxies, image defects, and non-linear noise, by placing the ArtPop models in the NGC1052–DF2 ACS images and analyzing them in the same way as the actual data. The results are shown in Fig. 2. The qualitative difference between the 13 Mpc model and the 19 Mpc model is striking; as the data reach just below the TRGB for 13 Mpc the simulated image shows many individual stars, whereas they remain undetected for a distance of 19 Mpc. The comparison to the data is unequivocal: the 13 Mpc model can be ruled out. The CMDs demonstrate this same result. Using standard cuts222We use the crowding and sharpness cuts of Radburn-Smith et al. (2011) and the signal-to-noise ratio cuts of McQuinn et al. (2017). the vast majority of detected objects disappear in both the NGC1052–DF2 CMD and in the 19 Mpc model (1304 out of 1609 with ). Furthermore, the distribution of remaining sources in the 13 Mpc model closely follows the expected distribution of isolated stars.
3. Comparison to M96-DF11
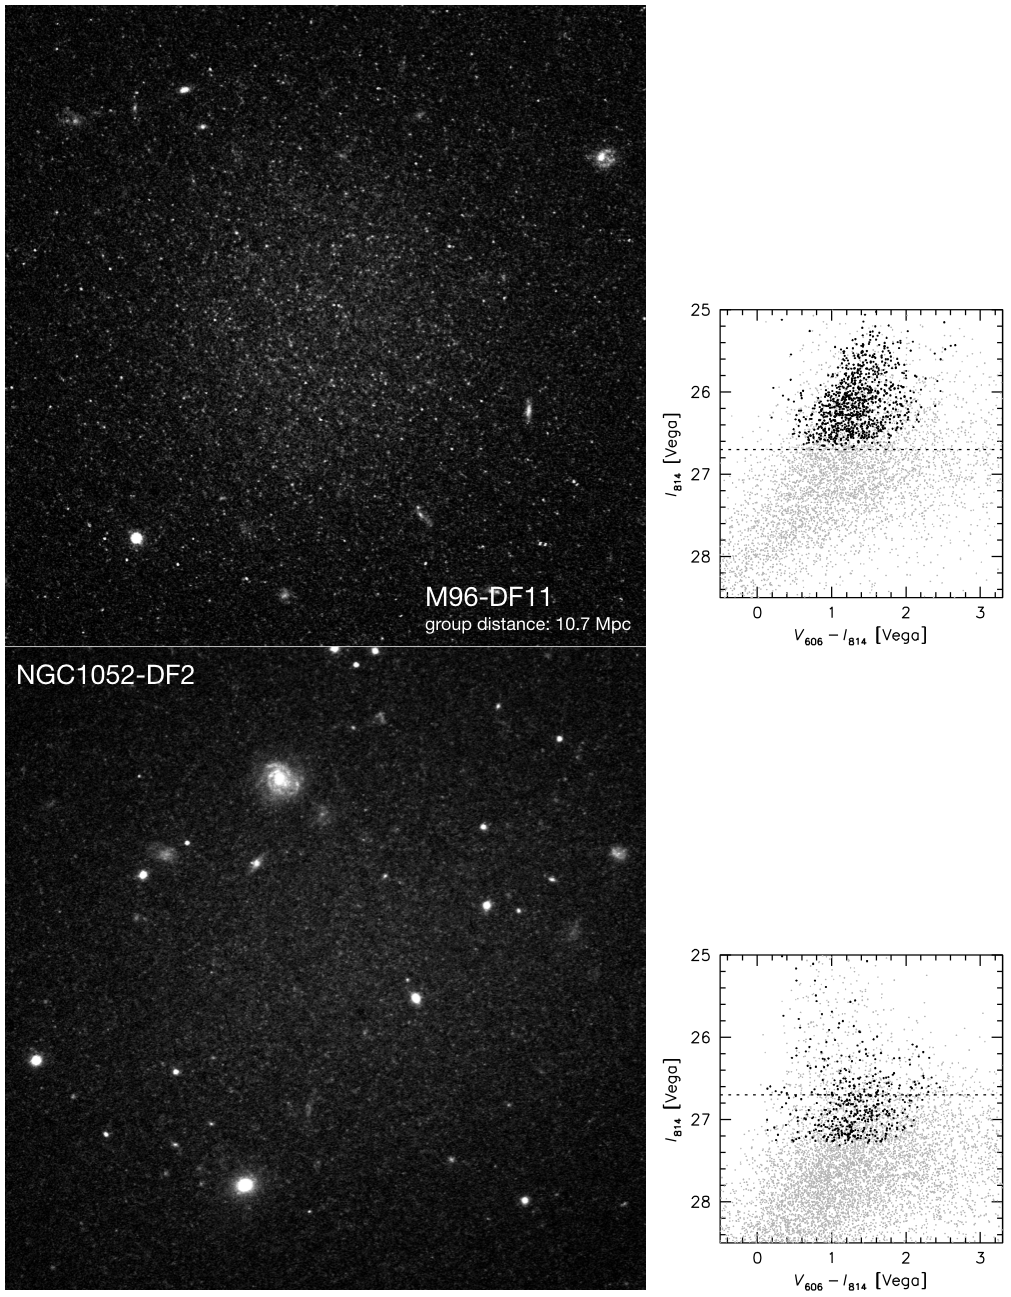
The analysis in § 2 uses models to interpret the data. Owing to our relatively large sample of low surface brightness objects (described in C18) we can also perform direct comparisons between HST images of similar-looking galaxies at different distances. In particular, we obtained single-orbit (split between and ) observations of 11 galaxies in the rich M96 group at 10.7 Mpc (see Tully, Courtois, & Sorce 2016, and below).333The M96 (Leo) group has an estimated spatial extent of 0.2 Mpc (Tully 2015), or 2 % of the distance, which means we can safely assume that all its members are at the same distance. The appearance of these galaxies is qualitatively different from that of NGC1052–DF2: they resolve into a myriad of well-detected RGB stars. We highlight M96-DF11 in Fig. 3, as this galaxy has very similar observed global properties as NGC1052–DF2: ( for NGC1052–DF2), (), (), (), and (). The resolved appearance of M96-DF11 and its CMD are dramatically different from NGC1052–DF2. Specifically, the number of detected stars with is higher (785 vs. 80). For a distance of 13 Mpc the equivalent limit is ; we find 247 sources in NGC1052–DF2 to that limit. Figures 2 and 3 demonstrate that we do not detect individual stars below the TRGB in NGC1052–DF2, ruling out distances as close as Mpc.


4. A Distance for NGC1052–DF2 Calibrated to H2O Megamasers
We have shown that the distribution of sources in the CMD is qualitatively consistent with the vD18a SBF value of Mpc, but it is hazardous to measure a quantitative distance from the blends and AGB stars that constitute the detections. Our SBF measurement has a small random uncertainty (see Fig. 8 in C18); however, details in the methodology can lead to systematic errors (Mei et al. 2005a; Blakeslee & Cantiello 2018), particularly for low surface brightness galaxies (Mieske, Hilker, & Infante 2003). Furthermore, the calibration that we use is an extrapolation of relations that were established for more metal rich galaxies (see Mei et al. 2005b; Blakeslee et al. 2010). In this Section we make use of our sample of HST-observed low luminosity galaxies (C18) to derive a distance to NGC1052–DF2 that is insensitive to the details of the measurement technique and does not rely on absolute stellar population calibrations.
4.1. Relative Distance Between NGC1052–DF2 and Dwarfs in the M96 Group
The galaxies in the M96 group play a pivotal role in our analysis, as the TRGB is unambiguously detected in the CMDs and the galaxies are sufficiently well-populated for an accurate measurement of the apparent SBF magnitude. In the left panel of Fig. 4 we show the apparent SBF magnitude as a function of the integrated color for the 11 galaxies and for NGC1052–DF2, with measurements taken from C18. As expected, there is a correlation, such that bluer galaxies have brighter SBF magnitudes. Six galaxies (including M96-DF11) have colors that are nearly identical to that of NGC1052–DF2. For each of the six we can obtain a measurement of the relative distance between NGC1052–DF2 and the M96 group without relying on an absolute calibration of the SBF magnitude. The average offset is mag, corresponding to a distance ratio of 1.76.
The broken line shows the extrapolation of the Blakeslee et al. (2010) relation that was used in vD18a and in C18, for the Cosmicflows distance of 10.7 Mpc to the M96 group (Tully et al. 2016). We do not use this relation in the present study but we note that it provides a satisfactory description of the data.
4.2. Absolute Distance to Dwarfs in the M96 Group, and to NGC1052–DF2
Next we determine the absolute distance to these six dwarfs. The black points in the right panel of Fig. 4 show their TRGB distances, taken from C18. The methodology that we use for the TRGB measurements is detailed in C18. Briefly, we use the logarithmic edge-detection of Méndez et al. (2002), and derive TRGB distances using the color-dependent calibration of Rizzi et al. (2007).
Although we verified that our methodology produces similar results as other methods (e.g., Makarov et al. 2006) when run on the same data, we do not use the TRGB distances directly as we cannot exclude the possibility that residual blending or other systematic effects influence our measurements. Instead, we make use of the fact that our sample includes a satellite galaxy of NGC4258, NGC4258-DF6. It is at a projected distance of 57 kpc and it has a well-determined TRGB distance of Mpc (random error only; see Fig. 7 in C18). NGC4258 has an exquisitely well-established absolute distance from the Keplerian rotation of its H2O megamasers: Mpc (Humphreys et al. 2013). We therefore apply a correction factor of to the TRGB distances of the six M96 dwarfs to bring them on the megamaser system (blue points in Fig. 4). The average maser-calibrated TRGB distance to these galaxies is Mpc, in excellent agreement with the canonical distance to the M96 group of Mpc (Tully et al. 2016).
Adopting a common distance of Mpc for the six galaxies, we use the difference between their SBF magnitude and that of NGC1052–DF2 to obtain six absolute distance estimates of NGC1052–DF2 (red points in Fig. 4). The average value, with propagated errors, is Mpc. The error includes a 3 % uncertainty due to the unknown distance between NGC4258-DF6 and NGC4258 itself (based on the extent of the M31 satellite system; see Conn et al. 2012), and an estimated 0.1 mag scatter in the absolute SBF magnitude at fixed color (see Blakeslee et al. 2010). This distance is insensitive to methodological details, and entirely free from stellar population-based absolute calibrations (although consistent with them).
5. Discussion
In this Letter we demonstrated that individual stars fainter than the tip of the giant branch are not detected in the current HST imaging of NGC1052–DF2 and determined an SBF distance to NGC1052–DF2 of Mpc that is independent of calibration uncertainties. We infer that the galaxy is probably a satellite of the massive elliptical galaxy NGC1052 at Mpc (Tonry et al. 2001; Blakeslee et al. 2002). This conclusion is supported by an independent analysis of the SBF signal by Blakeslee & Cantiello (2018), who find Mpc.
As noted in the Introduction and in T18 the unusual dark matter content and globular cluster population are more easily explained with a smaller distance, but the luminosity of the red giants “overrules” such indirect arguments. T18 emphasize that a smaller distance resolves both the unusual luminosities and the unusual sizes of the globular clusters in NGC1052–DF2, but we note here that these properties are probably coupled, with the characteristic luminosity and size of clusters possibly set in tandem by the large scale environment (Reina-Campos & Kruijssen 2017). Specifically, as discussed in vD18b, the same gas pressures were needed to form the globular clusters in NGC1052–DF2 and those in the Milky Way (e.g., Elmegreen & Efremov 1997).
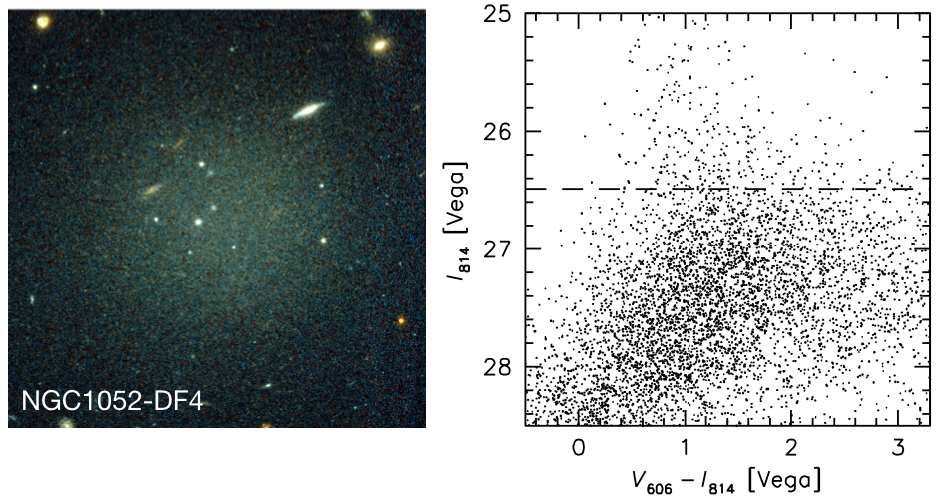
Finally, we emphasize that NGC1052–DF2 is not alone: it is one of several low surface brightness galaxies in the NGC1052 field that are all consistent with the same distance (see C18). They are all located near NGC1052 in the Dragonfly frame (see Fig. 1 in C18) and none of them have a detected red giant branch in our images. In Fig. 5 we show the brightest of these other galaxies, NGC1052-DF4. This galaxy has a similar morphology, size, and surface brightness as NGC1052–DF2. The SBF magnitudes (Fig. 4) and CMDs (Figs. 1 and 5) of the two galaxies are nearly identical. It is unlikely that all these galaxies are associated with the possible foreground spiral NGC1042, while there would be no galaxies of this apparent brightness that are actually associated with the rich NGC1052 group.
We conclude that the red giant population of NGC1052–DF2, analyzed here through the CMD and surface brightness fluctuations, implies a distance of Mpc. With significantly deeper HST data than are available now it should be possible to measure the TRGB in the outskirts of the galaxy, for a definitive distance with an accuracy of %.
References
- (1)
- (2) Bailin, J., Bell, E. F., Chappell, S. N., Radburn-Smith, D. J., & de Jong, R. S. 2011, ApJ, 736, 24
- (3)
- (4) Blakeslee, J. P., Cantiello, M. 2018, RNAAS, 2, 146
- (5)
- (6) Blakeslee, J. P., Cantiello, M., Mei, S., Côté, P., Barber DeGraaff, R., Ferrarese, L., Jordán, A., Peng, E. W., et al. 2010, ApJ, 724, 657
- (7)
- (8) Blakeslee, J. P., Lucey, J. R., Tonry, J. L., Hudson, M. J., Narayanan, V. K., & Barris, B. J. 2002, MNRAS, 330, 443
- (9)
- (10) Choi, J., Dotter, A., Conroy, C., Cantiello, M., Paxton, B., & Johnson, B. D. 2016, ApJ, 823, 102
- (11)
- (12) Cohen, Y., van Dokkum, P., Danieli, S., Mowla, L., Abraham, R., & et al., E. 2018, ApJ, submitted (arXiv:1807.06016)
- (13)
- (14) Conn, A. R., Ibata, R. A., Lewis, G. F., Parker, Q. A., Zucker, D. B., Martin, N. F., McConnachie, A. W., Irwin, M. J., et al. 2012, ApJ, 758, 11
- (15)
- (16) Dalcanton, J. J., Williams, B. F., Seth, A. C., Dolphin, A., Holtzman, J., Rosema, K., Skillman, E. D., Cole, A., et al. 2009, ApJS, 183, 67
- (17)
- (18) Danieli, S., van Dokkum, P., & Conroy, C. 2018, ApJ, 856, 69
- (19)
- (20) Danieli, S., van Dokkum, P., Merritt, A., Abraham, R., Zhang, J., Karachentsev, I. D., & Makarova, L. N. 2017, ApJ, 837, 136
- (21)
- (22) Dolphin, A. E. 2000, PASP, 112, 1383
- (23)
- (24) Dotter, A. 2016, ApJS, 222, 8
- (25)
- (26) Elmegreen, B. G., & Efremov, Y. N. 1997, ApJ, 480, 235
- (27)
- (28) Fosbury, R. A. E., Mebold, U., Goss, W. M., & Dopita, M. A. 1978, MNRAS, 183, 549
- (29)
- (30) Humphreys, E. M. L., Reid, M. J., Moran, J. M., Greenhill, L. J., & Argon, A. L. 2013, ApJ, 775, 13
- (31)
- (32) Makarov, D., Makarova, L., Rizzi, L., Tully, R. B., Dolphin, A. E., Sakai, S., & Shaya, E. J. 2006, AJ, 132, 2729
- (33)
- (34) Martin, N. F., Collins, M. L. M., Longeard, N., & Tollerud, E. 2018, ApJ, 859, L5
- (35)
- (36) McQuinn, K. B. W., Skillman, E. D., Dolphin, A. E., Berg, D., & Kennicutt, R. 2017, AJ, 154, 51
- (37)
- (38) Mei, S., Blakeslee, J. P., Tonry, J. L., Jordán, A., Peng, E. W., Côté, P., Ferrarese, L., Merritt, D., et al. 2005a, ApJS, 156, 113
- (39)
- (40) Mei, S., Blakeslee, J. P., Tonry, J. L., Jordán, A., Peng, E. W., Côté, P., Ferrarese, L., West, M. J., et al. 2005b, ApJ, 625, 121
- (41)
- (42) Méndez, B., Davis, M., Moustakas, J., Newman, J., Madore, B. F., & Freedman, W. L. 2002, AJ, 124, 213
- (43)
- (44) Mieske, S., Hilker, M., & Infante, L. 2003, A&A, 403, 43
- (45)
- (46) Müller, O., Rejkuba, M., & Jerjen, H. 2018, A&A, 615, 96
- (47)
- (48) Radburn-Smith, D. J., de Jong, R. S., Seth, A. C., Bailin, J., Bell, E. F., Brown, T. M., Bullock, J. S., Courteau, S., et al. 2011, ApJS, 195, 18
- (49)
- (50) Reina-Campos, M., & Kruijssen, J. M. D. 2017, MNRAS, 469, 1282
- (51)
- (52) Rizzi, L., Tully, R. B., Makarov, D., Makarova, L., Dolphin, A. E., Sakai, S., & Shaya, E. J. 2007, ApJ, 661, 815
- (53)
- (54) Sersic, J. L. 1968, Atlas de galaxias australes (Cordoba, Argentina: Observatorio Astronomico, 1968)
- (55)
- (56) Tonry, J. L., Dressler, A., Blakeslee, J. P., Ajhar, E. A., Fletcher, A. B., Luppino, G. A., Metzger, M. R., & Moore, C. B. 2001, ApJ, 546, 681
- (57)
- (58) Trujillo, I., Beasley, M. A., Borlaff, A., Carrasco, E. R., Di Cintio, A., Filho, M., Monelli, M., Montes, M., et al. 2018, MNRAS, submitted (arXiv:1806.10141)
- (59)
- (60) Tully, R. B. 2015, AJ, 149, 171
- (61)
- (62) Tully, R. B., Courtois, H. M., & Sorce, J. G. 2016, AJ, 152, 50
- (63)
- (64) van Dokkum, P., Danieli, S., Cohen, Y., Merritt, A., Romanowsky, A. J., Abraham, R., Brodie, J., Conroy, C., et al. 2018a, Nature, 555, 629
- (65)
- (66) van Dokkum, P., Cohen, Y., Danieli, S., Kruijssen, J. M. D., Romanowsky, A. J., Merritt, A., Abraham, R., Brodie, J., et al. 2018b, ApJ, 856, L30
- (67)
- (68) van Dokkum, P., Cohen, Y., Danieli, S., Romanowsky, A., Abraham, R., Brodie, J., Conroy, C., Kruijssen, J. M. D., et al. 2018c, Research Notes of the American Astronomical Society, 2, 54
- (69)
- (70) van Dokkum, P. G., Abraham, R., Merritt, A., Zhang, J., Geha, M., & Conroy, C. 2015, ApJ, 798, L45
- (71)
- (72) Wasserman, A., Romanowsky, A. J., Brodie, J., van Dokkum, P., Conroy, C., Abraham, R., Cohen, Y., & Danieli, S. 2018, ApJ, in press (arXiv:1807.07069)
- (73)