Ab-initio study of ABiO3 (=Ba, Sr, Ca) under high pressure
Abstract
Using ab-initio crystal structure prediction we study the high-pressure phase diagram of ABiO3 bismuthates (=Ba, Sr, Ca) in a pressure range up to 100 GPa. All compounds show a transition from the low-pressure perovskite structure to highly distorted, low-symmetry phases at high pressures (PD transition), and remain charge disproportionated and insulating up to the highest pressure studied. The PD transition at high pressures in bismuthates can be understood as a combined effect of steric arguments and of the strong tendency of bismuth to charge-disproportionation. In fact, distorted structures permit to achieve a very efficient atomic packing, and at the same time, to have Bi-O bonds of different lengths. The shift of the PD transition to higher pressures with increasing cation size within the ABiO3 series can be explained in terms of chemical pressure.
pacs:
62.50.-p, 71.20.Be, 71.30.+h, 71.45.LrI Introduction
The study of the competition between superconductivity and charge ordering phenomena has received a strong impulse from recent experiments on high-Tc cupratesChang et al. (2012) and transition metal dichalcogenides Kusmartseva et al. (2009), raising questions on their interplay and, more in general, on the role of critical fluctuations in quasi-two-dimensional systemsSnow et al. (2003); Castro Neto (2001).
However, the competition between superconductivity and charge density wave (CDW) ordering is not limited to two-dimensional systems, but has been observed in other systems with different dimensionality. A classical example is that of bismuthates with chemical formula ABiO3, where is an alkaline earth (Ba, Sr, or Ca). These compounds are charge-ordered insulators, but undergo an insulator-to-metal transition upon doping, reaching superconducting ’s as high as 34 KCava et al. (1988); Uchida et al. (1987); Kazakov et al. (1997); Khasanova et al. (2001).
The CDW is associated to the mixed-valence behavior of bismuth, which can acquire two formal oxidation states – Bi3+ and Bi5+ – which alternate on a perovskite lattice, giving rise to tilting and breathing distortions. The charge difference is significantly lower than 2e- due to the strong hybridization between Bi(s) and O(p) states. Based on this consideration an alternative picture has been proposed invoking the condensation of holes in lowest O band, resulting in the formation of Bi3+L2- + Bi3+, where L identifies the ligand holeFoyevtsova et al. (2015); Khazraie et al. (2018). These two pictures are not mutually exclusive and it is likely that both processes (charge ordering and ligand hole) contributes to the opening of the CDW gap. Upon doping, the distortion is gradually suppressed and the lattice returns to the ideal perovskite structureFranchini et al. (2009), which is metallic and superconducting.
Naively, one would expect that extreme pressures could be used to suppress the lattice distortion also in the undoped samples, and hence achieve a metallic, possibly superconducting state without the complications introduced by doping. However, as shown in our previous work on BaBiO3Smolyanyuk et al. (2017) and independently confirmed by a combined theoretical and experimental workMartoňák et al. (2017), high pressures do not stabilize an ideal perovskite structure, but a strongly distorted, amorphous-like structure, characterized by strong charge disorder and insulating behavior.
In this work, we investigate this phenomenon further, and address the effect of chemical pressure, studying the high-pressure phase diagram of the the whole family of ABiO3 compounds (=Ca, Sr, Ba) with methods for evolutionary ab-initio crystal structure prediction Oganov and Glass (2006); USP . The electronic spectra of all predicted phases are computed with hybrid Hartree-Fock/density functional theory (DFT) functional with the HSE (Heyd-Scuseria-Ernzerhof) exchange-correlation functionalHeyd et al. (2003), which has been demonstrated to accurately describe the CDW insulating state of BaBiO3Korotin et al. (2012); Yin et al. (2013); Franchini et al. (2009, 2010), while ordinary DFT describes BaBiO3 as a metal.
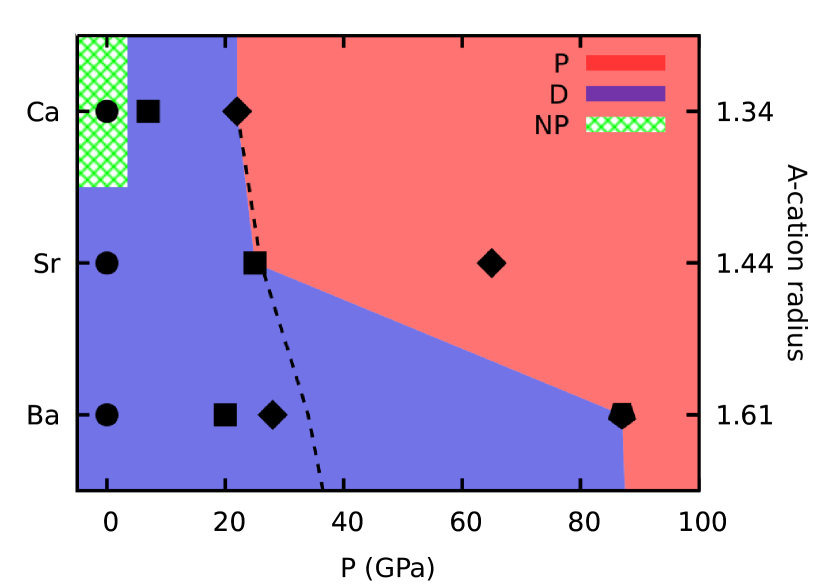
Our results show that the ordered CDW at low pressures and the increase charge disproportionation at high pressure, accompanied by larger structural distortions, are general features of the bismuthate phase diagram: in fact, as shown in Fig. 1, all compounds undergo a transition from a perovskite () to a strongly distorted () structure, and remain insulating up to 100 GPa. The occurrence of distorted structures is a consequence of a steric argument, combined with the tendency of bismuth to charge disproportionation.
This paper is organized as follows: in Section II we describe the results of our ab-initio calculations starting with our prediction for the high-pressure phase diagram in Subsection II.1, followed by the description of electronic properties of the most stable structures in Subsection II.2. The discussion on the perovskite-to-distorted transition (PD transition) follows in Section III. The main conclusions of this work are summarized in Section IV. Computational details are described at the end of the paper in Section V.
II Results
II.1 Phase Diagram
In Fig. 1 we show the phase diagram of ABiO3 in the pressure range from 0 to 100 GPa, predicted using ab-initio evolutionary crystal structure prediction methods. For Bismuthates, the use of an unbiased crystal structure prediction method is crucial, since the group-subgroup approachHoward and Stokes (2005); Balachandran and Rondinelli (2013); He and Franchini (2014); He et al. (2017) which is routinely used to predict structural transitions in perovskites is not able to capture the transition to the distorted structure – see Ref. Smolyanyuk et al., 2017 for details.
To generate the phase diagram in Fig. 1, a set of reference crystal structures were first obtained from evolutionary crystal structure prediction runs at 0, 50 and 100 GPa. The most promising structures from the pool of crystal structures obtained at these pressures are further relaxed at intermediate pressures at constant volume intervals, and interpolated with an analytical equation of state, which allowed us to determine the transition pressures accurately (see Sec. V for more details). The lowest-enthalpy structures at each pressure were then used to construct the final phase diagram.
We have plotted all ABiO3 compounds on the same figure (Fig. 1), with a common pressure axis; the compounds are equispaced along the vertical axis; starting with Ca, which has the smallest ionic radius, the size of the cation increases along the axis from Ca to Ba exerting an effective chemical pressure on the perovskite lattice (see Table 1 for corresponding ionic radii and unit cell volumes). Assuming that the most important parameter governing the structural transitions is the volume of the unit cell, and that this is mainly determined by the size of the cation, this means that the sequence of structural transitions seen in BaBiO3 should occur at lower pressures in SrBiO3 and even lower in CaBiO3.
In the figure, each transition is labeled by a symbol representing the rank of the structure in the transition series. The diagram is also divided into three regions, denoted with the letters P (perovskites), D (distorted) and NP (non-perovskite). The thick dashed line indicates the shift of perovskite-to-distorted transition pressure (PD transition), estimated from the simple cubic perovskite model, as explained in Section III.
We start from the low-pressure region. An empirical guess of the ambient pressure structure for each compound can be obtained from the Goldschmidt tolerance factor, which is based on the size mismatch between the cations. The tolerance factor for double perovskites is defined as: , where is the radius of the cation, is averaged ionic radius of bismuth and is radius of oxygen. The ideal value corresponds to a cubic perovskite structure; deviations from this ideal value indicate the amount of distortion needed to stabilize the atomic arrangement: the higher the deviation, the higher the distortion. Based on the value of , one would expect that at ambient pressure all ABiO3 compounds should be either monoclinic or orthorhombic perovskites with tilted oxygen octahedra, because Serrate et al. (2007) for all cations (see Table 1). Indeed, the tolerance factor correctly predicts the structure at ambient pressure for BaBiO3 and SrBiO3, which are known experimentallyCox and Sleight (1976); Kazakov et al. (1997). However, the structure obtained by our evolutionary algorithm predictions for CaBiO3 is trigonal, which apparently contradicts the argument based on the tolerance factor. Note, however, that in this case the value of is extremely small, and several exceptions to the tolerance factor argument are knownVasala and Karppinen (2015).
| R(A) (Å) | V (Å3/f.u.) | t | (Å) | (Å) | |
|---|---|---|---|---|---|
| CaBiO3 | 1.34 | 76.91 | 0.85 | 2.29 | 0.122 |
| SrBiO3 | 1.44 | 80.00 | 0.88 | 2.25 | 0.089 |
| BaBiO3 | 1.61 | 85.87 | 0.93 | 2.24 | 0.074 |
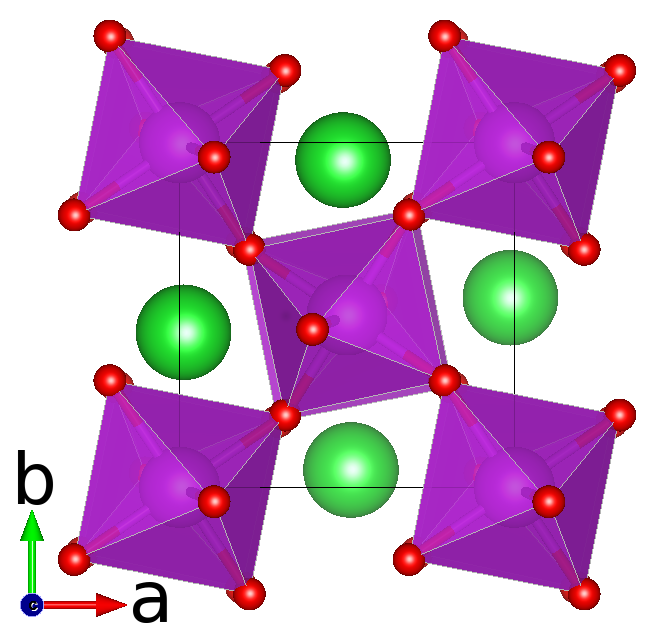
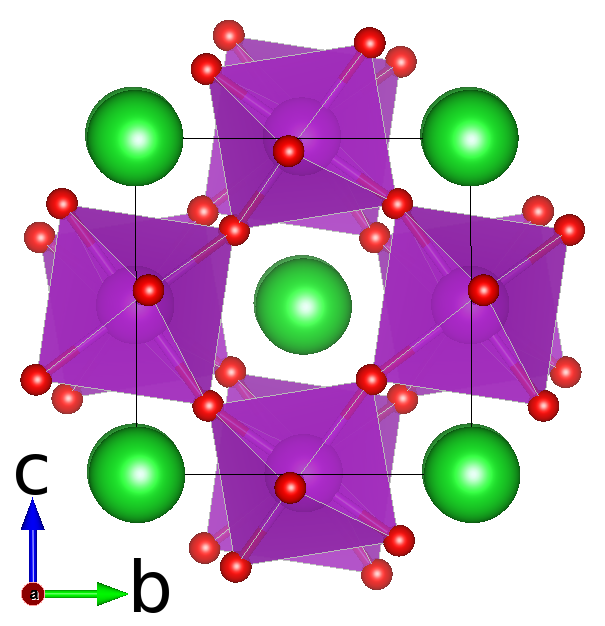
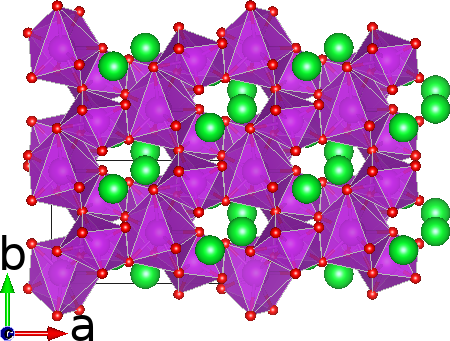
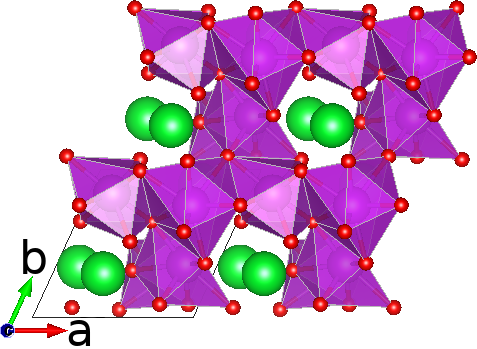
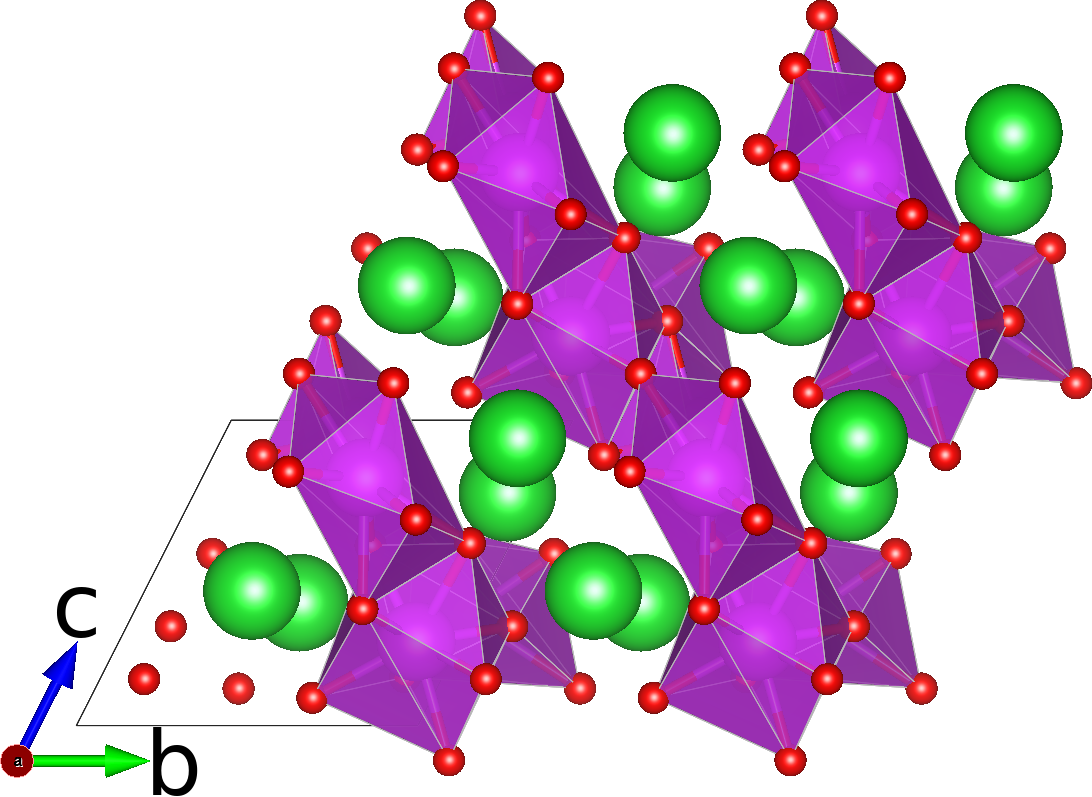
At ambient pressure BaBiO3 and SrBiO3 structures exhibit different monoclinic symmetries: C12m̄1 and P21/c respectively (see Fig. 2c and 2b). Both structures contain the characteristic perovskite building block formed by BiO6 octahedra and share a common parent structure – an ideal cubic perovskite with P3m̄3 symmetry. The two monoclinic structures can be obtained applying two different types of distortions to the parent structure: breathing (alternating the size of Bi-O octahedral environment) and tilting (rigid rotations of Bi-O octahedra). The difference between the two compounds is the different tilting pattern ( and for BaBiO3 and SrBiO3 in Glazer notationGlazer (1975), respectively) and the amount of breathing distortion (0.074 Å and 0.089 Å, see Table 1).
Upon increasing pressure we observe that all compounds undergo a series of structural transitions. The common feature is that all ABiO3 compounds undergo a transition to a highly distorted phase (D) beyond some critical pressure. By highly distorted phase we mean a structure that does not belong to the perovskite family, in the sense that a transition from the perovskite structure requires large atomic displacements and strong distortions of the original structural motifs, which cannot be decomposed into breathing and tilting distortionscom . Even though they do not exhibit the regular arrangement seen at ambient pressures, the Bi sites in the high-pressure distorted structures exhibit charge disproportionation and insulating behavior, as discussed in Sect. II.2.
Distorted structures in the bismuthates were predicted for the first time by us in BaBiO3Smolyanyuk et al. (2017), and later confirmed by Ref. Martoňák et al., 2017.
We now describe the phase diagrams of the individual compounds in detail; the corresponding structural files are provided in Supplementary Materials.
BaBiO3: The data for BaBiO3 presented in this work are taken from our previous work Smolyanyuk et al. (2017). We find that a first transition from the monoclinic I(P) (space group C12m̄1; see Fig. 2c) to triclinic II(P) structure occurs at 20 GPa. The II(P) structure is another form of perovskite structure with an additional octahedral tilting axis compared to the I(P) structure. The next transition is from the triclinic II(P) to a clustered monoclinic III(P) structure at about 28 GPa. This structure can be described as a perovskite with the stacking fault resulting in only half of the Bi atoms exhibiting an octahedral environment. Although it strongly deviates from the perovskite structure, we still assign it to the perovskite family (P). The last transition is from a clustered monoclinic to a distorted IV(D) (see Fig. 2f) structure at 87 GPa, which has no symmetry.
SrBiO3: The first transition is from a perovskite-like monoclinic I(P) (space group P121n1; see Fig. 2b) to a distorted II(D) structure at about 25 GPa (see Fig. 2e) and the second is from a distorted II(D) to another distorted structure III(D) at 65 GPa. These are two different distorted structures, but is difficult to give a clear description of the structural differences as the structures are too distorted to identify a clear pattern.
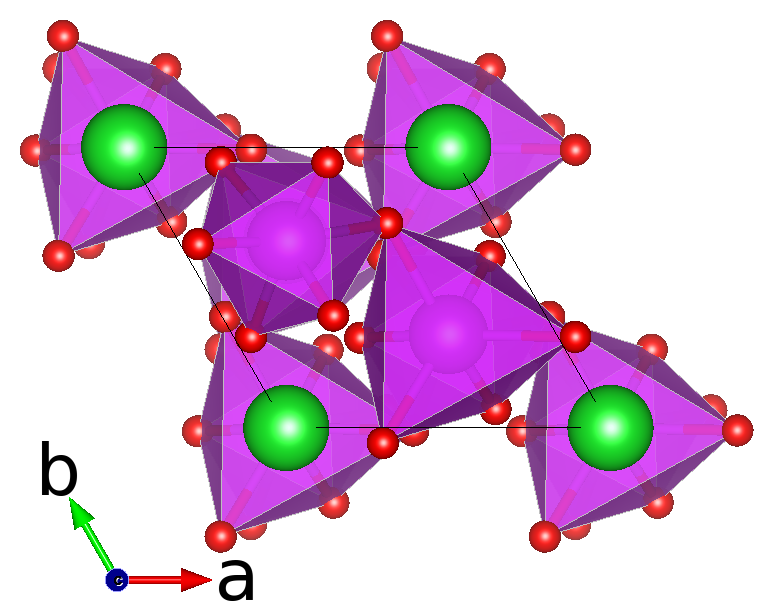
CaBiO3: There are no experimental crystal structure data for CaBiO3 at ambient pressure, but only a computational study suggesting a polar R3 structureHe et al. (2017). Indeed, CaBiO3 is unstable at ambient conditions but it is possible to stabilize it at high pressuresCBO (about 6 GPa), or upon doping, CaxK1-xO3, with Khasanova et al. (2001). According to our evolutionary predictions the structure at ambient pressure is trigonal (R3) and consists of “paired” distorted octahedra that share a common edge. We find that the Bi-Bi and Ca-Ca environment is no longer octahedral, as in perovskites, but tetrahedral. Therefore, in Fig. 1 this structure is classified as a non-perovskite structure (). Our structure is 12 meV/atom (17 meV/atom in HSE) lower in enthalpy than the perovskite structure proposed by He et al. in Ref. He et al., 2017 and based on the traditional group-subgroup symmetry analysisHoward and Stokes (2005).
The first structural transition is from the trigonal I(NP) (see Fig. 2a) to monoclinic II(P) structure at 7 GPa. In this case the Bi-Bi and Ca-Ca environment is distorted octahedral and the Bi-O octahedra are distorted too, with additional tilting. We therefore classify this structure as perovskite (P). The second transition is from the II(P) to a distorted III(D) (see Fig. 2d) structure with C1c1 symmetry at 22 GPa.
In summary, our study of the phase diagram of ABiO3 compounds shows that pressure does not stabilize more symmetric structures, as in other transition metals perovskites, but highly distorted ones, as we originally observed for BaBiO3Smolyanyuk et al. (2017). Furthermore, reducing the size of the cation shifts the transition from perovskite-like to distorted structures to a lower pressure, in agreement with considerations based on chemical pressure, i.e. with the idea that substituting a cation with a smaller one is equivalent to applying an external pressure. In the next sections, we will study in more detail the nature and origin of the PD transition and the electronic properties of the most relevant structures.
II.2 Electronic Structure
Fig. 3 shows the total and atom-projected density of states (DOS) for all ABiO3 compounds, at the transition pressure between the perovskite (P) and the distorted (D) structures, obtained with the HSE functional. For consistency, also for BaBiO3 we show the DOS for the perovskite and the distorted structures, at the transition pressure between the two, but we remind that in this region the stable structure is the clustered one. The aim of the figure is in fact to trace the origin of the PD transition, which is common to all ABiO3 compounds, while the clustered region is found only in BaBiO3.
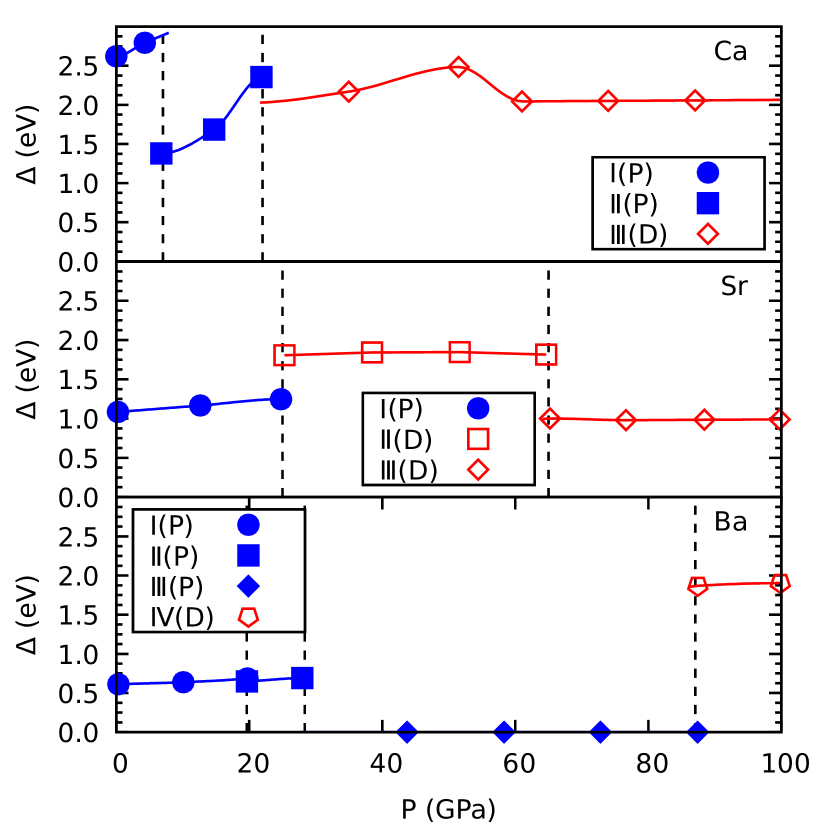
As it can be clearly seen, all structures are insulating, with a gap at ambient pressure: 0.6 eV for BaBiO3 (experimental measurements vary from 0.2 eVSleight et al. (1975) to 1.1 eVKunc et al. (1991)), 1.1 eV for SrBiO3 and 2.6 eV for CaBiO3. The increase of the gap with decreasing cation size is consistent with the larger breathing distortions predicted for the CaBiO3 structure (see Table 1). The behaviour of the gap as a function of pressure is shown in Fig. 4clu .
The mechanism leading to the opening of a gap in the perovskite structure has been discussed by several authors: charge disproportionation at the Bi site causes alternating breathing distortion of the ideal perovskite lattice, further stabilized by tilting distortion, and this opens a gap in the strongly hybridized Bi(s)-O(p) antibonding bandFranchini et al. (2010); Foyevtsova et al. (2015). This is evidenced by the partial DOS plots, which show a clear splitting and charge redistribution between Bi3+ and Bi5+ states, localized below and above the semiconducting gap. A similar situation is found in distorted phases, where it is still possible to identify inequivalent Bi3+– and Bi5+–like ions. One clearly sees that the two contributions to the DOS are well separated, with Bi5+ and Bi3+ states giving the dominant contribution to the electronic DOS above and below the gaps, respectively. In distorted SrBiO3 and BaBiO3 the two main peaks are further split into several sub-peaks, indicating a more complex pattern of charge disproportionation.
In typical transition metal perovskites the application of pressure leads to a continuous closing of the gapHe et al. (2012). However, for Bismuthates the situation is different: increasing pressure by chemical substitution makes the gap larger, due to the gradual narrowing of the Bi3+ and Bi5+ peaks associated with the upward shift and broadening of the occupied Oxygen band. Despite the larger degree of Bi-O hybridization the narrowing of the Bi3+ and Bi5+ peaks increases the bonding-antibonding repulsion, increases the bond- (see Table 1) and charge-disproportiation (see Fig. 5) and ultimately lead to a substantial increase of the gap size.
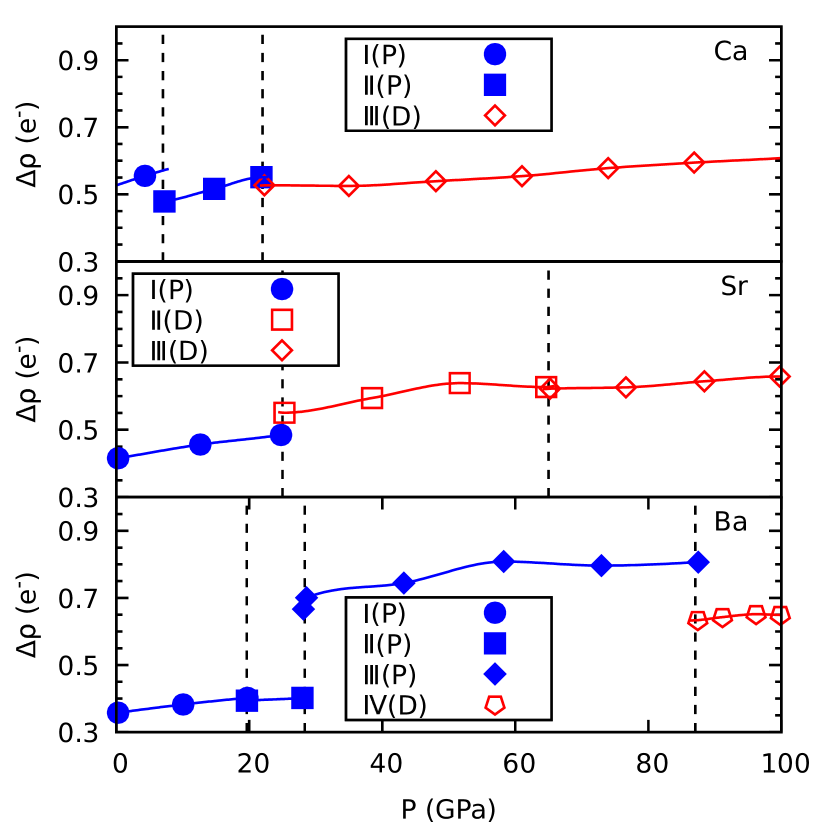
As already mentioned, the classification into Bi3+ and Bi5+ is clearly only indicative: due to the strong hybridization with oxygen the actual charge disproportionation between Bi sites is much smaller than two. In order to obtain a quantitative estimate, we performed a Bader charge analysisBader (1994); web ; Tang et al. (2009); bad , which is more accurate than the estimation based on the integration of the DOS, that we used in our previous worksSmolyanyuk et al. (2017); Franchini et al. (2009). Remarkably, we found that Bader charge analysis deliver charge differences between Bi3+ and Bi5+ ions 3-4 times larger. The results are shown in Fig. 5, where is a difference between the maximum and minimum charge located on bismuth atoms obtained in the Bader analysis. Each symbol in the figure represents a specific structure and its filling shows if the structure is perovskite-like – filled symbol – or distorted – empty symbol. The figure shows that the average charge difference is of /f.u., and slightly increases with pressure; apart from BaBiO3, where the presence of the clustered structure complicates the phase diagram, the transition from the perovskite to the distorted structure is relatively smooth, similarly to what we observed for the DOS.
Having clarified the reasons behind the robustness of the CDW gap upon pressure we move now to the analysis of the PD structural transition, which is done in the following section.
III Perovskite-to-Distorted Transition
The first obvious argument to explain the PD transition is a steric one, i.e. distorted structures, which are very compact, become favorable at high pressures, where the term becomes the dominant part of the total enthalpy. In fact, at the transition pressures between perovskite and distorted structures, the volumes of the distorted structures are on average smaller than those of the perovskite ones.
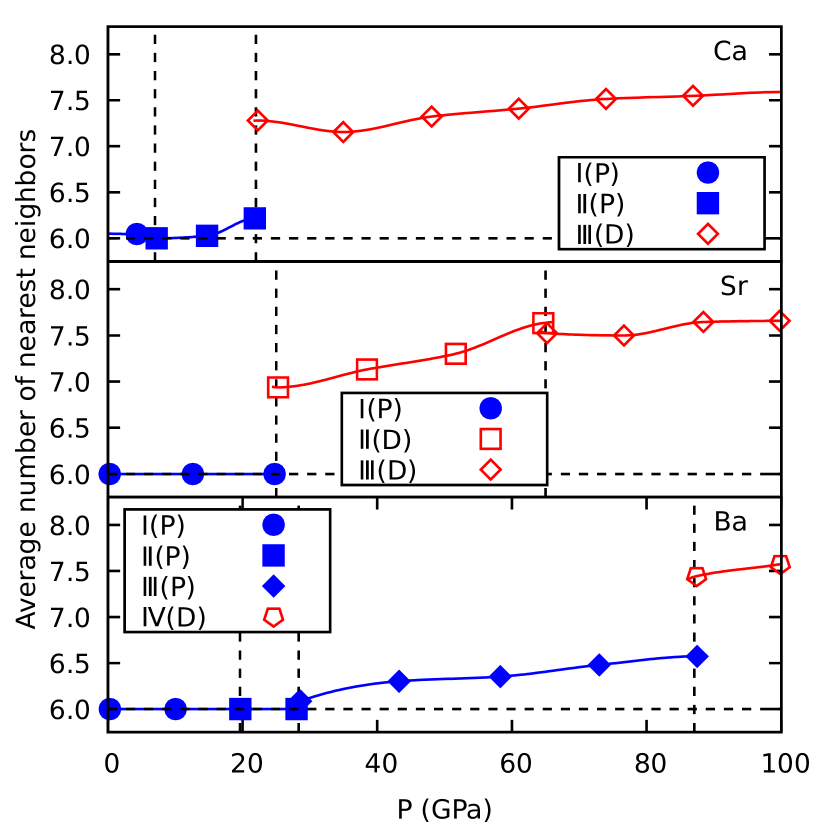
The lower specific volume of the distorted structures is achieved by a more efficient packing of the atoms with an increasing coordination number. To visualize this, in Fig. 6 we plot the average number of oxygens in bismuth environment as a function of pressure. Values close to six represent perovskite or perovskite-like structures. The higher the difference from this value, the higher the amount of distortion in the structure.
Clearly, all ABiO3 compounds undergo a discontinuous jump from perovskite-like structures to distorted ones at different critical pressures: CaBiO3 and SrBiO3 at 22-25 GPa; and BaBiO3 at 87 GPa (45 GPa if the clustered structure is neglected). Thus, the increase of coordination number is the general mechanism that stabilizes distorted structures at extremely high pressures in agreement with what we found for BaBiO3 in the previous paperSmolyanyuk et al. (2017).
The origin of this effect can be understood as follows: initially, pressure causes a compression of the Bi-O bonds. However, the compressibility of Bi-O bonds decreases with increasing pressure, until it reaches a critical value, where it becomes energetically more favorable to introduce new chemical bonds and rearrange bond distances than to continue to compress bonds.
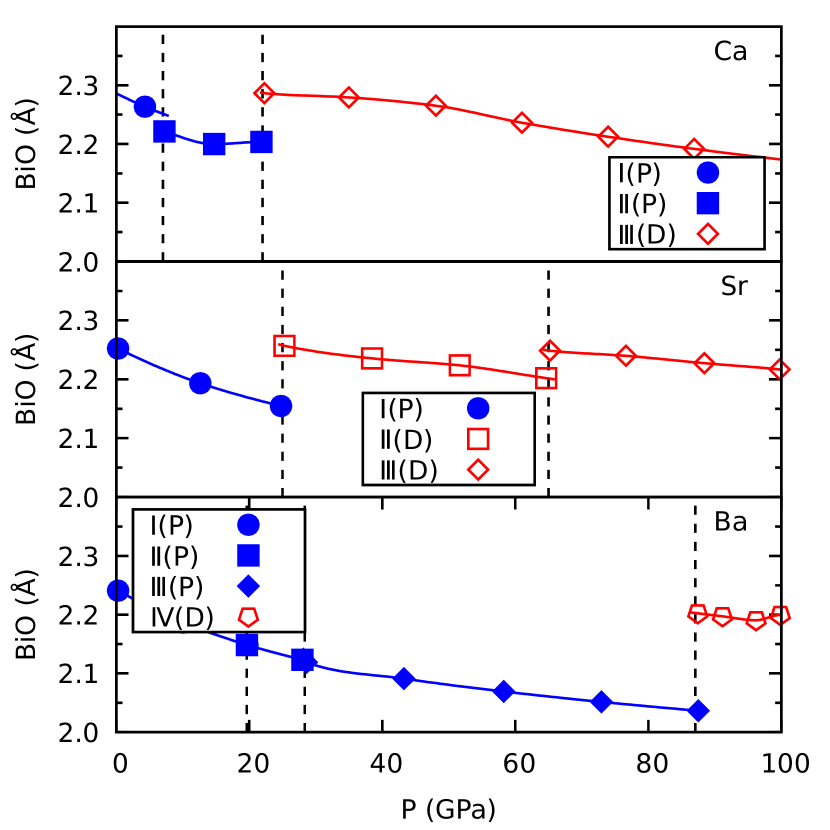
This can be easily seen from Figure 7, showing the pressure-dependence of the average Bi-O length; for all ABiO3 compounds there is a clear jump to larger Bi-O length at the pressures corresponding to the transition from perovskite-like to distorted structure. The increase in coordination number, and the tendency to form disordered structures, is also favored by the intrinsic tendency of bismuth to charge disproportionation, which leads to forming two (or even more) types of bonds with different lengths. The tendency to charge disproportionation increases with increasing pressure, as shown by the Bader charge analysis in Fig. 5, and hence the arrangement in high-symmetry structures becomes progressively less favorable.
Indeed, forming distorted structures, which have a very low symmetry, is an efficient way to increase the number of bonds in a very closely-packed structure. Let us consider first the Bi-O octahedral environment: the Bi-O coordination geometry is restricted by the chemical composition and crystallographic restriction theorem, which forbids Bi-O to form a regular polyhedron with coordination number larger than six. For example, the 7-coordinated pentagonal dipyramid has a 5-fold rotational symmetry and the 8-coordinated square antiprism has an 8-fold symmetry, which are both forbidden due to the crystal periodicity. Cubic coordination is not allowed by chemical composition as it requires a composition with the same number of Bi and O. As result, when the coordination number increases due to the formation of new bonds under increasing pressure, pronounced distortions of the local environment occur, that lead to highly-distorted structures at high pressure.
The perovskite-to-distorted transition pressure increases with increasing cation radius (see Fig. 1). This effect, sometimes referred to as chemical pressure, is based on the idea that replacing a cation with a larger one, keeping the volume fixed, increases the effective pressure on the BiO3 sublattice. This effect is easily illustrated by a simple numerical experiment, based on the ideal cubic perovskite structure.
Fig. 8 shows the equation of state (EOS) for ABiO3 compounds in cubic structure. The influence of chemical pressure may be estimated calculating the pressures, corresponding to the intersection of a line with the EOS curve for a given compound. For example, according to Fig. 1, the PD transition pressure for CaBiO3 is at around 22 GPa. We can use this value and the EOS for our cubic model to estimate the PD transition pressures in SrBiO3 and BaBiO3. First, we find the volume, which corresponds to 22 GPa on the EOS for cubic CaBiO3 (). If we assume that the main driving force of the PD transition is the unit cell volume, we can estimate the PD transition pressure for SrBiO3 and BaBiO3 from the intersection of the line with the relative EOS curves. The two values are shown dashed lines on the Fig. 8. Our crude estimate gives 26 GPa for SrBiO3 and 34 GPa for BaBiO3; the agreement with the transition pressure is remarkable for SrBiO3 (25 GPa), but apparently quite bad for BaBiO3 (87 GPa). However, we recall that in BaBiO3 a clustered phase, in which only half of the Bi atoms are arranged in a regular octahedral environment, is predicted to occur in-between the perovskite and the distorted structure, shifting the transition to fully distorted structures to 87 GPa. If one disregards the clustered phase, the transition from perovskite to distorted structure occurs at around 45 GPa, which is in fair agreement to the 34 GPa value, predicted from the ideal cubic model.
IV Conclusions
In conclusion, in this work we studied the pressure-behaviour of three rare-earth bismutathes ABiO3 (=Ba, Sr, Ca), using ab-initio crystal structure prediction and hybrid functional calculations. Similarly to what previously observed in BaBiO3, we find that charge disproportionation is robust and not suppressed by pressure in all ABiO3 compounds, which also all remain insulators up to 100 GPa. The charge disproportionation between Bi3+ and Bi5+, estimated by Bader charge analysis, is much higher than what predicted by usual methods based on the DOS, starting from around 0.5 at ambient pressure and going up to 0.7 for the highly distorted high-pressure structures.
Indeed, the tendency to charge disproportionation becomes stronger with increasing pressure and has a big influence on the crystal structure; in fact, all compounds undergo a transition from perovskite structure to a highly distorted structure (PD transition); in BaBiO3, this happens through a transition to an intermediate clustered phase, whose presence shifts the PD transition to higher pressures, with respect to the value estimated on the basis of chemical pressure.
The formation of distorted structures is explained by a steric effect, combined with the mixed-valence behavior of bismuth; distorted structures have a higher density (more efficient packing) than any variant of the perovskite structure, and this permits to reduce the contribution to the enthalpy which is dominant at high pressures. In the distorted structures, a more efficient packing is achieved by allowing the coordination number to increase beyond the value for the characteristic of the perovskite structure; this tendency, combined with that to charge disproportionation, means that it is not possible to form any symmetric structure under this circumstances.
V Computational Details
To construct the high-pressure phase diagram, candidate structures with 10, 20 and 40 atoms per unit cell at 0 GPa, 50 GPa and 100 GPa were generated using the USPEX code for evolutionary crystal structure prediction. Oganov and Glass (2006); Lyakhov et al. (2013); Oganov et al. (2011). For each group of structures, generated by a separate USPEX run, we chose 5 lowest in enthalpy to perform a final accurate structure relaxation. The structure relaxations were performed allowing atoms relaxations and change of the cell shape, but the volume was fixed. Each structure was than relaxed on a grid of at least 9 volumes, chosen between the average volumes corresponding to 0 and 100 GPa. The pressures of the relaxed structures were estimated from the stress tensor. The resulting pressure vs volume relation were then interpolated analytically; from the interpolation curves, we obtained the transition pressures used to derive the final phase diagram shown in Fig. 1.
We used density functional theory (DFT) in the generalized gradient approximation (GGA) with Perdew-Burke-Ernzerhof functionalPerdew et al. (1996, 1997) to calculate the total energies and perform structural optimization, as implemented in the VASP package Kresse and Hafner (1993, 1994); Kresse and Furthmüller (1996a, b) using projector augmented wave method (PAW) pseudopotentials Kresse and Joubert (1999); Blöchl (1994). The hybrid HSE functional (Heyd-Scuseria-Ernzerhof) was used only to compute electronic spectra, in particular for the DOS calculations (Fig. 3) and for calculation of band gaps (Fig. 4)clu . The energy cutoff value was set to 500 eV and -centered Monkhorst-Pack grid Monkhorst and Pack (1976); Pack and Monkhorst (1977) with the reciprocal-space resolution 0.04 was used for the GGA for structural relaxation and 0.01 for total energy calculation. For calculations where HSE functional was used the reciprocal-space resolution was 0.04 .
The neighbors analysis was performed with the help of the Chemenvche module from the PymatgenOng et al. (2013); pym package. Chemenv provides routines to obtain the best fit of the coordination environment polyhedron for a specific atom and this information was used to estimate the number of oxygen neighbors for each bismuth atom in Fig. 6.
Acknowledgements.
We acknowledge funding from the Austrian Science Fund FWF through SFB ViCoM, Project F41-P15 and computational resources from the VSC3 of the Vienna University of Technology and from the HPC TU Graz.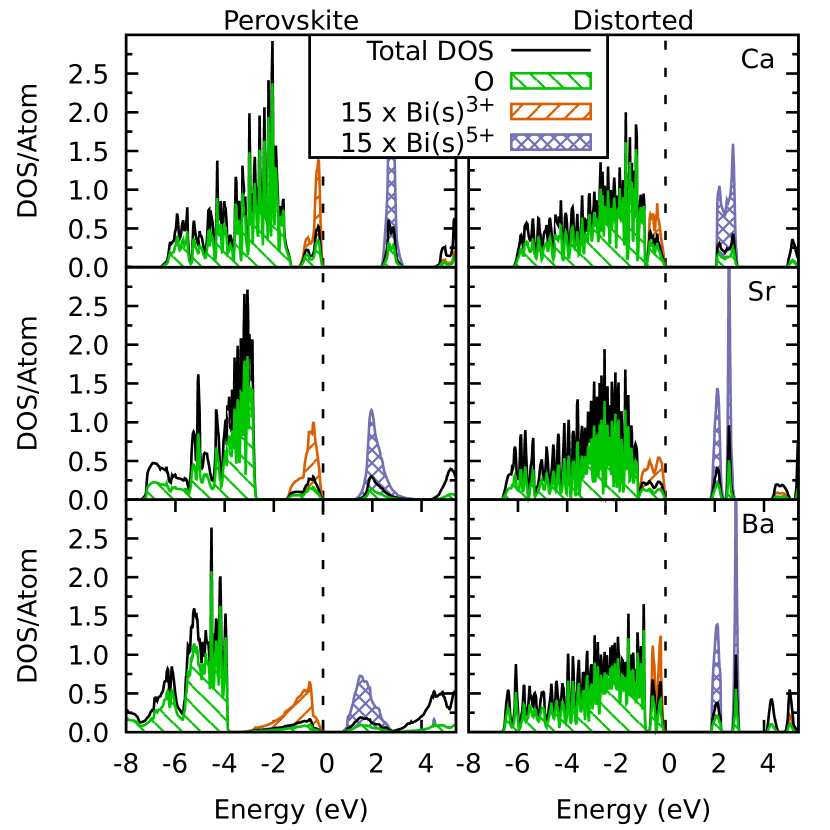
References
- Chang et al. (2012) J. Chang, E. Blackburn, A. T. Holmes, N. B. Christensen, J. Larsen, J. Mesot, R. Liang, D. A. Bonn, W. N. Hardy, A. Watenphul, M. v. Zimmermann, E. M. Forgan, and S. M. Hayden, Nature Physics 8, 871 EP (2012).
- Kusmartseva et al. (2009) A. F. Kusmartseva, B. Sipos, H. Berger, L. Forró, and E. Tutiš, Phys. Rev. Lett. 103, 236401 (2009).
- Snow et al. (2003) C. S. Snow, J. F. Karpus, S. L. Cooper, T. E. Kidd, and T.-C. Chiang, Physical Review Letters 91 (2003).
- Castro Neto (2001) A. H. Castro Neto, Phys. Rev. Lett. 86, 4382 (2001).
- Cava et al. (1988) R. J. Cava, B. Batlogg, J. J. Krajewski, R. Farrow, L. W. Rupp, A. E. White, K. Short, W. F. Peck, and T. Kometani, Nature 332, 814 (1988).
- Uchida et al. (1987) S. Uchida, K. Kitazawa, and S. Tanaka, Phase Transitions 8, 95 (1987).
- Kazakov et al. (1997) S. M. Kazakov, C. Chaillout, P. Bordet, J. J. Capponi, M. Nunez-Regueiro, A. Rysak, J. L. Tholence, P. G. Radaelli, S. N. Putilin, and E. V. Antipov, Nature 390, 148 (1997).
- Khasanova et al. (2001) N. Khasanova, K. Yoshida, A. Yamamoto, and S. Tajima, Physica C: Superconductivity 356, 12 (2001).
- Foyevtsova et al. (2015) K. Foyevtsova, A. Khazraie, I. Elfimov, and G. A. Sawatzky, “Hybridization effects and bond disproportionation in the bismuth perovskites,” (2015).
- Khazraie et al. (2018) A. Khazraie, K. Foyevtsova, I. Elfimov, and G. A. Sawatzky, Phys. Rev. B 97, 075103 (2018).
- Franchini et al. (2009) C. Franchini, G. Kresse, and R. Podloucky, Phys. Rev. Lett. 102, 256402 (2009).
- Smolyanyuk et al. (2017) A. Smolyanyuk, L. Boeri, and C. Franchini, Phys. Rev. B 96, 035103 (2017).
- Martoňák et al. (2017) R. Martoňák, D. Ceresoli, T. Kagayama, Y. Matsuda, Y. Yamada, and E. Tosatti, Phys. Rev. Materials 1, 023601 (2017).
- Oganov and Glass (2006) A. R. Oganov and C. W. Glass, The Journal of Chemical Physics 124, 244704 (2006), 10.1063/1.2210932.
- (15) USPEX is based on evolutionary algorithm approach and its main idea is to form a population of crystal structures which are evolved under various evolutionary operators imitating biological ideas of mutation, reproduction, recombination and selection which minimize the fitness function represented by an enthalpy of the system, calculated using ab-intio methods. This allows USPEX to predict crystal structure of a given composition and at a given pressure without any prior knowledge.
- Heyd et al. (2003) J. Heyd, G. E. Scuseria, and M. Ernzerhof, The Journal of Chemical Physics 118, 8207 (2003).
- Korotin et al. (2012) D. Korotin, V. Kukolev, A. V. Kozhevnikov, D. Novoselov, and V. I. Anisimov, Journal of Physics: Condensed Matter 24, 415603 (2012).
- Yin et al. (2013) Z. P. Yin, A. Kutepov, and G. Kotliar, Phys. Rev. X 3, 021011 (2013).
- Franchini et al. (2010) C. Franchini, A. Sanna, M. Marsman, and G. Kresse, Phys. Rev. B 81, 085213 (2010).
- Howard and Stokes (2005) C. J. Howard and H. T. Stokes, Acta Crystallographica Section A 61, 93 (2005).
- Balachandran and Rondinelli (2013) P. V. Balachandran and J. M. Rondinelli, Phys. Rev. B 88 (2013).
- He and Franchini (2014) J. He and C. Franchini, Phys. Rev. B 89, 045104 (2014).
- He et al. (2017) J. He, C. Franchini, and J. M. Rondinelli, Chemistry of Materials 29, 2445 (2017).
- Serrate et al. (2007) D. Serrate, J. M. D. Teresa, and M. R. Ibarra, Journal of Physics: Condensed Matter 19, 023201 (2007).
- Cox and Sleight (1976) D. Cox and A. Sleight, Solid State Communications 19, 969 (1976).
- Vasala and Karppinen (2015) S. Vasala and M. Karppinen, Progress in Solid State Chemistry 43, 1 (2015).
- Glazer (1975) A. M. Glazer, Acta Crystallographica Section A 31, 756 (1975).
- (28) It worth to note that such drastic distortions may be indicator of some critical phenomena that happens at high pressure for ABiO3 compounds, like transition to amorphous-like state or chemical decomposition, that cannot be explained by ab-initio methods used in our work. Although we report different distorted structures for different ABiO3 compounds, this does not necessarily imply that they are different in experiment: it might be that due to the too small size of the unit cell, we reproduce different parts of some more complex and bigger distorted structural motif.
- (29) Personal communication with Minu Kim.
- Sleight et al. (1975) A. Sleight, J. Gillson, and P. Bierstedt, Solid State Communications 17, 27 (1975).
- Kunc et al. (1991) K. Kunc, R. Zeyher, A. Liechtenstein, M. Methfessel, and O. Andersen, Solid State Communications 80, 325 (1991).
- (32) HSE on top of PBE structure describes clustered BaBiO3 as a semimetal. However, if a proper geometry optimization on HSE level is performed, the structure is insulator. Due to computational cost and consistency reason we have not performed this optimization for the whole pressure range, but only checked the behaviour at a specific pressure.
- He et al. (2012) J. He, M.-X. Chen, X.-Q. Chen, and C. Franchini, Phys. Rev. B 85, 195135 (2012).
- Bader (1994) R. Bader, Atoms in Molecules: A Quantum Theory, International Ser. of Monogr. on Chem (Clarendon Press, 1994).
- (35) Code for Bader Charge Analysis are available on the website: http://theory.cm.utexas.edu/henkelman/code/bader/.
- Tang et al. (2009) W. Tang, E. Sanville, and G. Henkelman, Journal of Physics: Condensed Matter 21, 084204 (2009).
- (37) In Bader analysis atomic charges are separated by “zero-flux” surfaces: these are surfaces where there is no flux in the gradient vector field of charge density.
- Lyakhov et al. (2013) A. O. Lyakhov, A. R. Oganov, H. T. Stokes, and Q. Zhu, Computer Physics Communications 184, 1172 (2013).
- Oganov et al. (2011) A. R. Oganov, A. O. Lyakhov, and M. Valle, Accounts of Chemical Research 44, 227 (2011).
- Perdew et al. (1996) J. P. Perdew, K. Burke, and M. Ernzerhof, Phys. Rev. Lett. 77, 3865 (1996).
- Perdew et al. (1997) J. P. Perdew, K. Burke, and M. Ernzerhof, Phys. Rev. Lett. 78, 1396 (1997).
- Kresse and Hafner (1993) G. Kresse and J. Hafner, Phys. Rev. B 47, 558 (1993).
- Kresse and Hafner (1994) G. Kresse and J. Hafner, Phys. Rev. B 49, 14251 (1994).
- Kresse and Furthmüller (1996a) G. Kresse and J. Furthmüller, Computational Materials Science 6, 15 (1996a).
- Kresse and Furthmüller (1996b) G. Kresse and J. Furthmüller, Phys. Rev. B 54, 11169 (1996b).
- Kresse and Joubert (1999) G. Kresse and D. Joubert, Phys. Rev. B 59, 1758 (1999).
- Blöchl (1994) P. E. Blöchl, Phys. Rev. B 50, 17953 (1994).
- Monkhorst and Pack (1976) H. J. Monkhorst and J. D. Pack, Phys. Rev. B 13, 5188 (1976).
- Pack and Monkhorst (1977) J. D. Pack and H. J. Monkhorst, Phys. Rev. B 16, 1748 (1977).
- (50) chemenv is a module inside pymatgen package and is developed by David Waroquiers and Geoffroy Hautier. Website: http://pymatgen.org/.
- Ong et al. (2013) S. P. Ong, W. D. Richards, A. Jain, G. Hautier, M. Kocher, S. Cholia, D. Gunter, V. L. Chevrier, K. A. Persson, and G. Ceder, Computational Materials Science 68, 314 (2013).
- (52) Pymatgen is a Python programming language library for materials analysis that has capabilities of generation of phase diagrams, Pourbaix diagrams, diffusion analysis, reactions, electronic structure analysis etc. Also it provides tools to construct, manipulate and analyze structures. One of them is Chemenv module that is developed for chemical environment analysis.