The James Webb Space Telescope North Ecliptic
Pole Time-Domain Field – I:
Field Selection of a JWST Community
Field for Time-Domain Studies
Abstract
We describe the selection of the James Webb Space Telescope (JWST) North Ecliptic Pole (NEP) Time-Domain Field (TDF), a 14′ diameter field located within JWST’s northern Continuous Viewing Zone (CVZ) and centered at (RA, Dec)J2000 = (17:22:47.896, +65:49:21.54). We demonstrate that this is the only region in the sky where JWST can observe a clean (i.e., free of bright foreground stars and with low Galactic foreground extinction) extragalactic deep survey field of this size at arbitrary cadence or at arbitrary orientation, and without a penalty in terms of a raised Zodiacal background. This will crucially enable a wide range of new and exciting time-domain science, including high redshift transient searches and monitoring (e.g., SNe), variability studies from Active Galactic Nuclei (AGN) to brown dwarf atmospheres, as well as proper motions of possibly extreme scattered Kuiper Belt and Inner Oort Cloud Objects, and of nearby Galactic brown dwarfs, low-mass stars, and ultracool white dwarfs. A JWST/NIRCam+NIRISS GTO program will provide an initial 0.8–5.0µm spectrophotometric characterization to 28.80.3 mag of four orthogonal “spokes” within this field. The multi-wavelength (radio through X-ray) context of the field is in hand (ground-based near-UV–visible–near-IR), in progress (VLA 3 GHz, VLBA 5 GHz, HST UV–visible, Chandra X-ray, IRAM 30m 1.3 and 2 mm), or scheduled (JCMT 850µm). We welcome and encourage ground- and space-based follow-up of the initial GTO observations and ancillary data, to realize its potential as an ideal JWST time-domain community field.
Publications of the Astronomical Society of the Pacific — draft version March 16, 2024
1 Introduction
In an age when surveys with the Panoramic Survey Telescope and Rapid Response System (Pan-STARRS; Kaiser et al., 2002), Large Synoptic Survey Telescope (LSST; Tyson, 2002), Euclid (Laureijs et al., 2010), and Wide Field Infrared Survey Telescope (WFIRST; Gehrels et al., 2015) are or will soon allow time domain studies of relatively faint objects within our Solar System, Galactic neighorhood and beyond, as well as at cosmological distances and associated large look-back times, one may ask to what extent the James Webb Space Telescope (JWST; Gardner et al., 2006; Kalirai, 2018) can serve as a time-domain survey facility. Whereas LSST’s limit for variability studies over a large portion of the sky in the near-UV–near-IR reaches to 24 mag (10 ) per 215 s visit on time-scales of 15 min–1 hour (Tyson, 2002; Ivezić, 2014; LSST Science Collaboration et al., 2017), JWST / NIRCam (e.g., Horner & Rieke, 2004; Greene et al., 2012) could potentially reach 26.8–28.3 mag (10 ) per epoch in the near–mid-IR on similar time-scales in a suitably dark survey field111As reported by the JWST ETC (Pontoppidan et al., 2016) v1.2 available at https://jwst.etc.stsci.edu/.. This would enable a wide range of new and exciting time-domain science in an unexplored magnitude regime, including high redshift transient searches and monitoring (e.g., Type Ia SNe to 5 and Core Collapse SNe to 1.5 (Graur et al., 2014; Rodney et al., 2014, 2015b; Strolger et al., 2015; Mesinger et al., 2006) and Pair Instability SNe in the Epoch of Reionization (Pan, Kasen, & Loeb, 2012; Gal-Yam, 2012; Nicholl et al., 2013; Whalen et al., 2013, 2014); variability studies from (weak) Active Galactic Nuclei (AGN; e.g., MacLeod et al., 2011) to brown dwarf atmospheres (Artigau et al., 2009; Buenzli et al., 2014; Radigan et al., 2014; Rajan et al., 2015); as well as perhaps proper motions of extreme scattered Kuiper Belt, inner Oort Cloud Objects and comets on their way in toward the inner Solar System, and of nearby Galactic brown dwarfs and low-mass stars (Ryan et al., 2011; Ryan & Reid, 2016), and ultracool white dwarfs (Harris et al., 2006; Catalán et al., 2013).
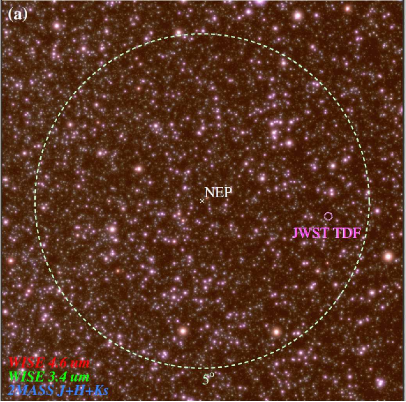
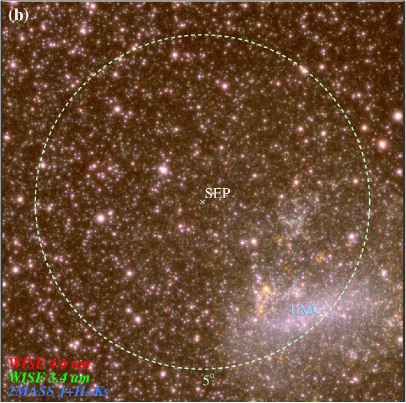
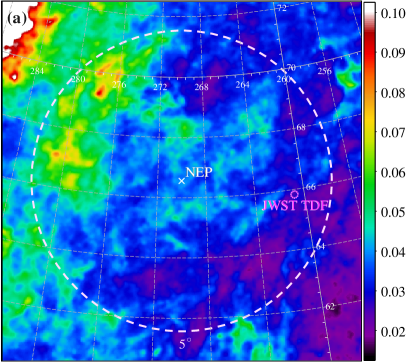
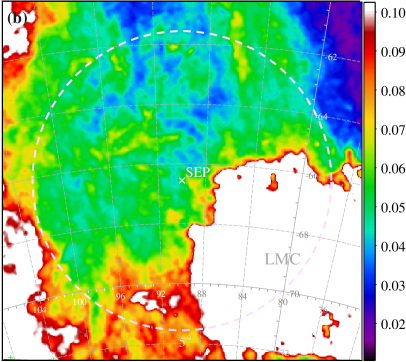
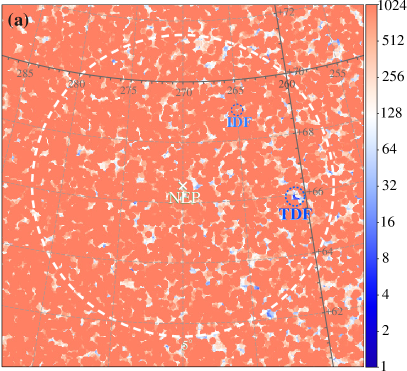
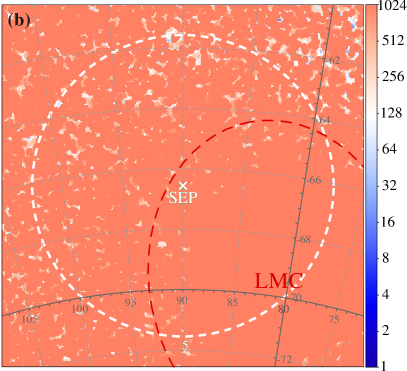
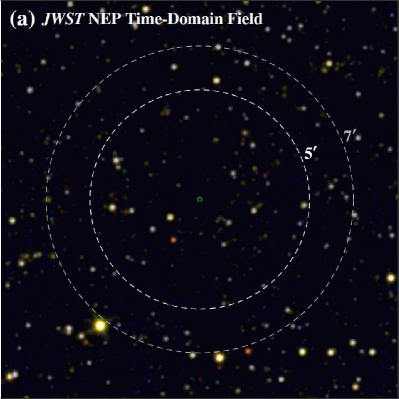
Shortly after insertion of the JWST in an Earth-Sun L2 halo orbit in 2021, it will start its program of Early Release Science (ERS) observations, Guaranteed Time Observations (GTO) by the instrument teams and Interdisciplinary Scientists (IDS), and General Observer (GO) observations. For most locations on the sky, Sun avoidance, power generation, and shielding requirements of the cryogenic telescope combine to restrict object visibility to two time intervals per year (with a duration that depends on ecliptic latitude), except within 5∘ of the Ecliptic Poles, where JWST will have two continuous viewing zones (CVZs) in which targets are observable year-round. Of these two small regions in the sky, the North Ecliptic Pole (NEP) CVZ constitutes relatively more empty sky; the Large Magellanic Cloud (LMC) and (associated) large-scale Galactic structures occupy much of the area within the southern CVZ, as can be seen by comparing the near-IR color composites of Fig. 1a,b and the maps of Galactic foreground reddening of Fig. 2a,b.
The orientation of JWST’s instrument apertures on the sky will be dictated by the date of observation, with limited schedulability of off-nominal angles (PA15∘) due to sunshield and solar panel constraints. This is in stark contrast to observations with the Hubble Space Telescope (HST), where observers can find viable solutions for a very wide range of instrument aperture orientations. In particular, it has become common practice to revisit targets with HST rotated over 180∘ to secure observations with large areas of overlap between a primary and a coordinated parallel instrument at the two orientations (e.g., CANDELS; Grogin et al., 2011; Koekemoer et al., 2011).
Moreover, off-nominal orientations with JWST will also carry a penalty of an increased Zodiacal background, which is up to 1.2–1.4 mag brighter in the ecliptic plane at 1.25–4.9 µm than at the ecliptic poles (Kelsall et al., 1998) — and hence results in a penalty of reduced sensitivity per unit observing time. Here also, the JWST CVZs are the exception, where any desired orientation can be scheduled at some time during the year, and the Zodiacal background is always at a minimum. Residual variation in the background signal in the CVZs is mostly due to orientation-dependent straylight from the Milky Way, since its combined starlight can reflect off the rear surface of JWST’s sunshield and enter the science instrument apertures along unintended paths (Lightsey et al., 2014; Lightsey, 2016). In general, the level of straylight may reach up to 40% of the Zodiacal background.
Given that JWST’s CVZs are located at intermediate Galactic latitudes ( 30∘), a field that would be optimal for a deep extragalactic time-domain survey with JWST would also be suitable for deep Galactic time-domain science, sampling stellar and sub-stellar populations in the nearby thin and thick disk, and stars in the more distant halo of our Galaxy. Very faint brown dwarfs and late-type low-mass stars will be detectable with JWST/NIRCam through
both their near-infrared colors and proper motions, where the exquisite resolution of JWST ensures robust star–galaxy separation.
Little is known of objects in the very outer realms of our Solar System at very high ecliptic latitudes near 90∘, should they exist. The deepest and widest high ecliptic latitude survey of trans-Neptunian objects to date (701 deg2 to 22.4–24.8 mag; Petit et al., 2017) indicates that 90∘ objects exist but are rare. Their size distribution may be flatter, but their albedo higher and color bluer, than that typical of objects in the dynamically cold population near the ecliptic plane (e.g., Schwamb et al., 2010; Shankman et al., 2016; Petit et al., 2017, and references therein). The Oort Cloud (Oort, 1950) is assumed to form a roughly spherical distribution of objects that orbit the Sun at distances beyond 2000 AU out to at least 50,000 AU. These left-overs from the birth of our Solar System and objects captured from other star systems during close passages over the past 4.6 Gyr, if perturbed and on an inward trajectory, may be detectable with JWST at 27 29 mag via their expected large parallaxes. A large, relatively reflective object like (90377) Sedna ( = 88.1 AU, 1000 km, 0.32, 21 mag, and 2.1 mag; Trujillo et al. 2005) has 21.7 mag and would be directly detectable to a distance of 500 AU for a limiting magnitude of 29. Assuming a darker, KBO-like albedo of 0.04 (e.g., Luu & Jewitt, 1998), a comet nucleus as small as 10 km in diameter on its way in from the Oort Cloud would be detectable to a distance of 28–29 AU, comparable with the distance to Neptune. Outer Solar System objects within JWST’s CVZs would display an annual parallax, describing a circle with a radius ∘, with their distance from the Sun in AU, and move 148 ′′/hour due to their parallax (their apparent motion as a result of their orbital velocity is more than two orders of magnitude smaller). This and the low zodiacal foreground near the ecliptic poles would make the CVZs ideally suited to search for such objects, allowing detections of 10 km comets at the distance of Neptune even within a single 1–2 hr visit.
In this first paper on the JWST North Ecliptic Pole (NEP) Time-Domain Field (TDF), we describe the selection of this new, very best target field for a deep extragalactic time-domain survey with JWST. For the reasons stated, we restrict our analysis to JWST’s CVZs, where such a survey could include the time domain from time scales of 10 min to 10–14 years, the anticipated maximum lifetime of JWST (e.g., Windhorst et al., 2018, and references therein). We further discuss considerations for a practical implementation and development of this field as both a JWST GTO program and as a GO community field. And we briefly list specific considerations for the ancillary ground- and space-based observations across the electromagnetic spectrum that have been secured or awarded to date, and that will each be described in detail in future papers.
2 Selection of the best field for a deep extragalactic JWST survey
2.1 Bright object concerns
The large 6.5 m aperture of JWST and the large twin 2222 fields of view of NIRCam, coupled with persistence in its sensitive near- and mid-IR detectors, pose significant constraints on the presence and brightness of stars and other objects that can be tolerated within the footprint of a deep JWST survey. The persistence acts as localized reductions in sensitivity and increases in image noise, and forms a record of observations that may have occured hours earlier (and hence is a source of sample contamination). For JWST/NIRCam detector read-out patterns SHALLOW4, MEDIUM8, and DEEP8, appropriate for medium-deep and deep extragalactic surveys, unrecoverable saturation (i.e., when full-well charge capacity is reached already before or during the first group of reads in an integration) in a F200W observation of a flat-spectrum point source can set in for sources as faint as 18.45, 19.25, and 19.80 mag, respectively222As reported by the JWST ETC (Pontoppidan et al., 2016) v1.2 available at https://jwst.etc.stsci.edu/ .. At mild saturation, the effects of persistence in subsequent exposures are expected to be fully modelable and correctable (Leisenring et al., 2016). This will no longer be the case for objects with 15.5 mag, which are bright enough to deeply saturate the NIRCam detectors. The ideal field for a deep JWST survey must, therefore, be devoid of any bright ( 15.5 mag) stars that would cause such deep saturation.
2.2 Survey Field Size and Coordinated Parallels
If we aim to employ HST’s highly efficient survey strategy of revisiting a pair of primary and coordinated parallel observations with the respective instrument footprints swapped by rotating the observatory over 180∘ — possible without penalty (or at all) for JWST only within its two CVZs —, then we also need to take into account the projected distances between these instruments within JWST’s focal plane333See JWST Field of View, JWST User Documentation [updated 2018 July 1], STScI (Baltimore, MD); https://jwst-docs.stsci.edu/display/JTI/JWST+Field+of+View .. For NIRCam observations with parallel NIRISS observations, the corner-to-corner angular span of these cameras as projected on the sky and, hence, the absolute minimum diameter of a clean survey field, is 102. Similarly, for NIRSpec or MIRI observations with NIRCam parallels it would be 116 or 114, respectively.
During experimentation with an areal survey layout that combined primary NIRCam imaging with parallel NIRISS wide-field slitless spectroscopy, we found that large dithers would be needed to span the gap between NIRCam modules A and B, and/or to advance the survey pointing by the width or height of a NIRISS footprint on the sky. This is discussed in more detail in § 4. A practical survey field size would therefore need to be significantly larger than 102. A field with a diameter of 14′ would accommodate the imaging instruments (NIRCam, NIRISS, and MIRI) in JWST’s focal plane, or NIRCam in combination with NIRSpec, at any orientation, and allow contiguous survey coverage with sufficient freedom for various dithering strategies. Our aim is therefore to find regions of at least this size within the JWST CVZs that are devoid of near-IR-bright sources.
2.3 Moving Viewport Analysis of WISE 3.4+4.6µm Sources
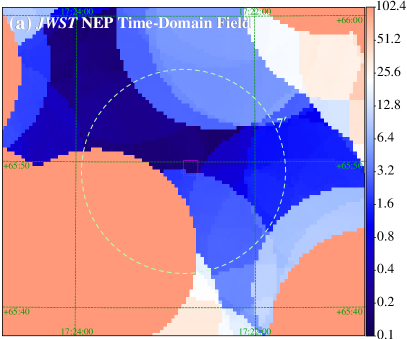
We started with an exploratory analysis of just JWST’s northern CVZ, by shifting a 10′10′ viewport in steps of 1′ in RA and Dec through a 5.5∘ radius portion of the WISE Source Catalog444Retrieved from the NASA/IPAC Infrared Science Archive (IRSA; http://irsa.ipac.caltech.edu/) using a custom C-shell script, qwisesc, to request WISE and 2MASS JHKs photometry in 1∘1∘ portions of the WISE allsky_4band_p3as_psd catalog for a series of (RA, Dec) that, together, fully cover 12∘12∘ areas around both NEP and SEP, generously encompassing the JWST CVZs. After retrieval, individual catalogs were concatenated and sorted, retaining the unique sources. (Wright et al., 2010; Mainzer et al., 2011) that was centered on the NEP. We analyzed the histogram of averaged 3.4 and 4.6 µm source magnitudes to select regions with the lowest densities of bright sources. In particular, we assigned an exponentially scaled penalty to each source within the 10′10′ viewport, ranging from 10-7 for sources in the 1 mag wide histogram bin centered at = 22 mag to 1010 for those in the bin at = 4.0 mag (i.e., penalties increase by a factor 10 for each magnitude increase in brightness), and then summed the penalties over that viewport. Very few 10′10′ regions near the NEP at a Galactic latitude of 30∘ are devoid of stars brighter than = 16 mag. While there are candidate regions with 3 or fewer 16 mag stars, only one cluster of regions stood out in that shifts of or 2′ are nearly as good as the very best one. That most promising target region was centered on (RA, Dec)J2000 = (17:22:43, +65:49:36), and is indicated with small magenta circles to the right of and below center in Figs. 1a and 2a. The former shows that this most promising region appears indeed in a particularly dark spot in the sky. The latter, a map of Galactic reddening, shows that this lack of bright sources is not due to higher Galactic foreground extinction: the extinction here averages only 0.087 mag or 0.015 mag (E(BV) 0.028 mag), where we adopt the Schlafly & Finkbeiner (2011) recalibration of the Schlegel et al. (1998) extinction map.
We then refined our moving viewport analysis, originally performed within SuperMongo555https://www.astro.princeton.edu/~rhl/sm/, by re-implementing it within a Fortran77 program that allowed both square and round viewports of arbitrary size, and allowed us to step through a larger area on the sky, centered on either the NEP or the SEP, with arbitrary step size. This program also assigned source penalties to individual sources directly, rather than to the sources cumulated in 1 mag wide histogram bins. We adopted a new normalization, such that a source with a mean (3.4+4.6µm) WISE source magnitude of 12.48 (; corresponding to = 15.5 mag, given the offset of 3.02 mag between the two systems at 4 µm666See the Explanatory Supplement to the WISE All-Sky Data Release Products (R. Cutri et al.; http://wise2.ipac.caltech.edu/docs/release/allsky/expsup/sec4_4h.html#conv2ab, as updated August 7, 2017).) results in a source penalty of exactly 1. Hence, the source penalties cumulated within a given viewport notionally add up to the equivalent number of deeply saturating ( = 15.5 mag) sources within that viewport. Last, the new code was generalized to allow different weighting of 3.4 and 4.6 µm source magnitudes (3.4µm only, (3.4+4.6)/2 4 µm, (23.4+4.6)/3, or 4.6µm only).
The results for round viewports with a diameter of 14′ (our desired JWST survey field size; see § 2.2) stepped through the 12∘12∘ area centered on the NEP in 20′′ steps is rendered in Fig. 3a and, scaled identically, for the SEP in Fig. 3b. As in our preliminary analysis, we find very few 14′ diameter regions that are devoid of sources brighter than = 15.5 mag. Nonetheless, within JWST’s northern CVZ, a few small regions and clusters of such regions appear as dark blue shades in Fig. 3a, the very best cluster of which is still centered on (RA, Dec)J2000 = (17:22:43, +65:49:36). We did not identify any similarly clean regions within the southern CVZ.
While JWST’s southern CVZ will offer great opportunities for time-domain science in the LMC, we will discard it from further consideration for the purpose of any deep extragalactic field to survey the distant universe.
2.4 Point Sources versus Extended Sources
Point sources at a given magnitude will have a larger impact on detector persistence than more extended sources (galaxies). For sources of the same magnitude, the brightest pixels in the latter will be several magnitudes fainter than in stellar images. We therefore verified in a 2MASS (Skrutskie et al., 2006) JHKs composite image with an angular resolution of 2′′ (FWHM) that most of the 4 µm-bright WISE sources (nominal FWHM 61–64) within the best cluster of clean 14′ diameter regions are indeed Galactic stars, and proved that the best region selected is indeed devoid of bright red stars.
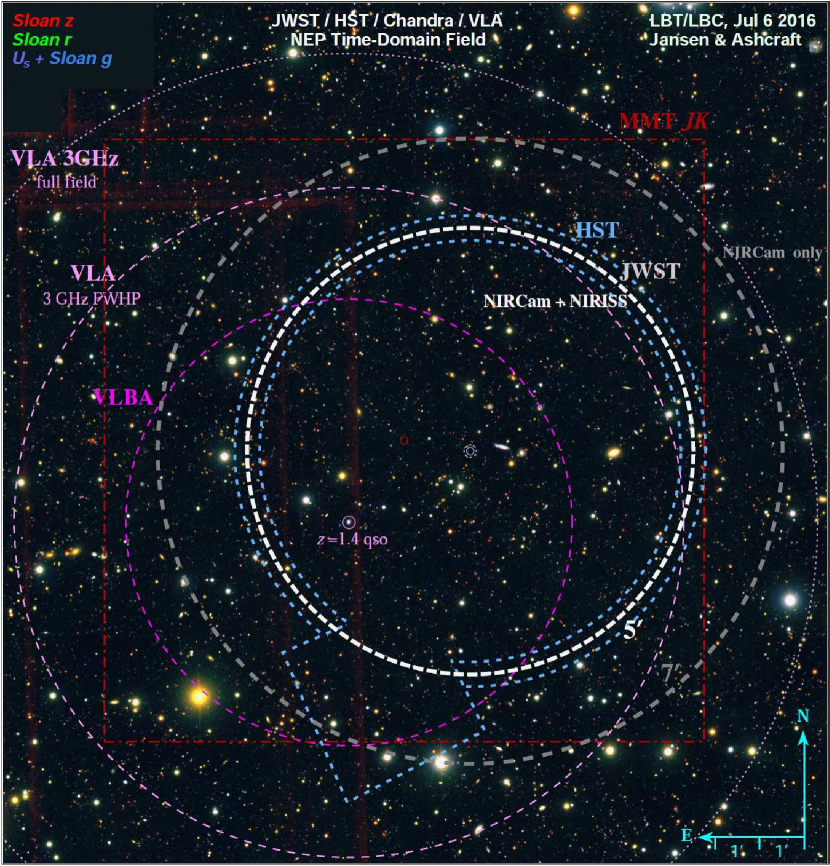
Moreover, in order to verify the suitability of this field to significantly fainter limits, in July 2016 we secured deep Ugrz observations with the Large Binocular Cameras (LBCs) on the 28.4 m Large Binocular Telescope (LBT) atop Mt.Graham, Arizona (Jansen et al., 2017b, 2019a [in prep.]). Fig. 4 shows a color composite of a portion of the full LBT/LBC images that covers the JWST NEP TDF and its immediate surroundings. The individual Ugrz mosaics for that color composite were produced following Ashcraft et al. (2018).
The faintest sources discernable with white to orange hues have 26.0–26.5 mag. The effective resolution in this color composite is 095 (FWHM). There are no bright stars within the field that NIRCam would cover in an implementation of JWST observations similar to those outlined in § 4 (indicated by a gray dashed circle with a radius of 7′), and there is no hint of Galactic cirrus, nor of filaments or patches of dust. In fact, the image shows a wide variety and large number of faint background galaxies, including some groups and distant clusters of galaxies (orange hues), along with a smattering of faint stars, as one would expect for a field at intermediate Galactic latitude ( +33.6∘). For a detailed description of these LBT/LBC data, we refer the reader to Jansen et al. 2019a (in prep.).
3 Discussion
3.1 The best continuously accessible survey field for JWST
The very best field selected from our analysis of 4 µm source penalties in the JWST’s northern CVZ has central coordinates of (RA, Dec)J2000 = (17:22:43.12, +65:49:36.0). Fig. 5a shows a more detailed map of these source penalties weighted by the inverse of the Galactic foreground reddening E(BV) (i.e., weighted towards the regions of lowest extinction). There are adjacent good fields 1–2′ toward the north, east, and northwest, as well as a cluster of fields 8′ to the northeast, that are almost as good as this very best field in terms of both source penalty and Galactic foreground extinction. That makes this field ideal for not just a 14′ diameter JWST time-domain survey, but also for future extensions to a deep or medium-deep extragalactic survey that covers a wider area.
It may be of interest to compare 4 µm backgrounds and source penalties within the NEP TDF with those in established deep fields like the CANDELS (Grogin et al., 2011; Koekemoer et al., 2011) GOODS-N (including the HDF-N), GOODS-S (including the HUDF), and COSMOS fields. While not continuously accessible to JWST, the best possible backgrounds at 4.4 µm in the middle of their visibility windows are 0.20, 0.19, and 0.23 MJy/sr, respectively, as compared to 0.23 MJy/sr for the NEP TDF 2. Backgrounds corresponding to dates of observation that allow a 180∘ flip in orientation are higher (0.27, 0.31, and 0.53 MJy/sr), while there is no restriction on date of observation for the JWST NEP TDF, where backgrounds are typically 0.24 MJy/sr and never higher than 0.26 MJy/sr. Source penalty values are very similar to or even slightly lower in the GOODS-S/HUDF area than in the JWST NEP TDF, with a similarly large choice in placement of the field center. In fact, JWST could center a deep 14′ diameter survey that would be devoid of 4 µm-bright point sources almost anywhere within the deep portion of the fiducial CANDELS GOODS-S footprint as well as within a portion of the WFC3/ERS field (Windhorst et al., 2011). The CANDELS GOODS-N footprint contains one and is significantly encroached by four relatively bright sources, leaving only a highly constrained area free of such sources that is ideal for a deep 14′ diameter JWST survey. In that very best area, source penalty values are 2 higher than in the JWST NEP TDF.
A time-domain field must be accessible 365 days per year, however, which implies a location within a CVZ. In the following section we will discuss considerations that might favor particular center coordinates that are offset with respect to the best field center for JWST.
3.2 Other considerations
3.2.1 VLA Radio Interferometric Observations
Deep Karl G. Jansky Very Large Array (VLA) radio observations can be obtained most efficiently if a suitable, unresolved phase calibration source is located exactly in the center of the synthesized beam. The best 14′ diameter field for JWST includes a 16.9 mag (SDSS; York et al., 2000) flat-spectrum quasar at = 1.4429 (Hewett & Wild, 2010) with a NVSS (Condon et al., 1998) flux density of 239.47.2 mJy at 1.4 GHz, and (VCS5; Kovalev et al., 2007) VLBA flux densities of 230 mJy at 2.3 GHz and 140 mJy at 8.6 GHz, respectively. In the VCS5 catalog, this quasar is classified as a suitable phase calibrator that remains unresolved777See, e.g., https://gemini.gsfc.nasa.gov/results/vcs/vcs5/vcs5_cat.html . at VLBA resolution, and has coordinates (RA, Dec)J2000 = (17:23:14.1381, +65:47:46.178), i.e., 27 to the southeast of the very best field center for JWST. VLA 3 GHz ( = 10 cm; PI: R. Windhorst) and VLBA 5 GHz (6 cm; PI: W. Brisken) observations to sensitivities, centered on these coordinates, started in November 2017 and are ongoing. Fig. 4 indicates the location of the phase calibrator, and shows the footprints of these radio observations as pink dotted and dashed, and magenta dashed circles, respectively.
The ability to study variable AGN and cataclysmic events in both radio and near- to mid-infrared at similar resolutions, in order to trace the co-evolution of supermassive blackholes and their host-spheroids over cosmic time, was deemed sufficiently compelling to consider a move of the JWST field. The field cannot be moved over all the way to be centered on the = 1.4429 quasar, however, since that would cause a bright red star capable of saturating the NIRCam detectors to enter the field of view, resulting in unacceptable persistence. The IDS JWST GTO observations of R. Windhorst as specified and implemented in APT888See JWST Astronomer’s Proposal Tool, APT, JWST User Documentation, 2018, STScI (Baltimore, MD); https://jwst-docs.stsci.edu/display/JPP/JWST+Astronomers+Proposal+Tool%2C+APT. APT is available from http://apt.stsci.edu/. versions prior to 25.2.1 (2017 July 6) were therefore moved to a compromise field center of (RA, Dec)J2000 = (17:23:02.55, +65:49:36.0), such that the JWST/NIRCam+NIRISS survey footprint would fall entirely within the VLA 3 GHz half-power beam width, and most of the NIRISS survey footprint would be encompassed by the VLBA 5 GHz half-power beam width. It is at this compromise position that ancillary ground-based near-infrared imaging in J and K were secured in 2017 with MMT/MMIRS (PI: C. Willmer) as indicated by the dark red dot-dashed square in Fig. 4. Future papers will describe and analyse these and other ancillary data (mentioned below) in detail.
3.2.2 Hubble Space Telescope observations
UV–visible imaging with HST of the central 5′ radius portion of the JWST NEP TDF, plus an extension toward the south-southeast to 7′, using WFC3/UVIS (F275W) and ACS/WFC (F435W and F606W) was approved for Cycle 25 (GO-15278; PI: R. Jansen). Simultaneous HST guide star availability for a pattern with 8 effective field centers and 9 distinct orientations, each highly constrained to be able to make use of HST’s scarce near-CVZ opportunities for this field (see Jansen et al., 2018a) proved a problem at the VLA+JWST compromise field center. By shifting the field center 90′′ west (i.e., back in the direction toward the objectively selected best field center) and 14′′ south, a viable solution was found, however, for (RA, Dec)J2000 = (17:22:47.896, +65:47:21.54), as indicated in Fig. 4 by a small pale blue circle. This field center was subsequently adopted (small dashed white circle) for the IDS JWST GTO observations of R. Windhorst (indicated by the white and grey dashed circles with radii of 5′ and 7′, respectively) and H. Hammel as implemented in APT version 25.4.2, and made public by the JWST Project on Feb. 6, 2018, making it the de facto coordinates of the JWST NEP TDF. Since the VLA still has significant sensitivity beyond its half-power beam width, all of the JWST/NIRCam observations in the NEP TDF will still have coverage at 3 GHz.
3.2.3 Other proposed, approved, and scheduled observations
These de facto coordinates of the JWST NEP TDF were also adopted for proposed JWST ERS observations in this field (MIRI+NIRCam imaging: H. Messias et al.; NIRISS wide-field slitless spectroscopy: S. Malhotra et al.), as well as for Chandra/ACIS I X-ray imaging in progress (Cycle 19 program 19900666; PI: W. Maksym) and approved (time-domain monitoring Cycle 20+21 program 20900658; PI: W. Maksym), for IRAM 30m/NIKA2 mm-wave observations in progress (PI: S. Cohen), for approved and proposed JCMT/SCUBA2 (PI: I. Smail, M. Im), LOFAR (PI: P. Best), and 4.2 m WHT/WEAVE (PI: K. Duncan) observations, for MMT/Binospec multi-object spectroscopy and MMT/MMIRS Y (some H) near-IR imaging in hand (PI: C. Willmer), and proposed Spitzer/IRAC (PI: M. Ashby) imaging, and SMA (PI: G. Fazio) sub-mm interferometry. The field and its wider surroundings have also been targeted with Subaru/HSC in five filters (g,i,z, NB816, NB921) as part of the Hawaii EROsita Ecliptic-pole Survey (HEROES; PI: G. Hasinger), and with the J-PAS (Benítez et al., 2014) PathFinder for spectrophotometric narrow-band imaging (PI: S. Bonoli and R. Dupke). Ground-based time-domain ugriz observations with HiPERCAM on the 10 m GTC (PI: V. Dhillon) are also proposed.
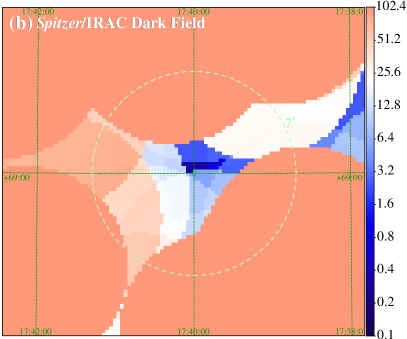
3.3 A critical comparison of the JWST NEP TDF and the Spitzer / IRAC Dark Field
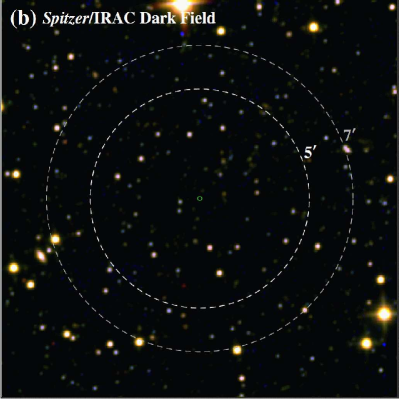
Every two to three weeks throughout its mission, Spitzer/ IRAC (Fazio et al., 2004) observations were made of a field near the NEP and centered at (RA, Dec)J2000 = (17:40:00, +69:00:00), the IRAC Dark Field (IDF), for the purpose of dark and bias calibration of its detectors. This field is also located well within the northern JWST CVZ, and its original selection also aimed to target an empty patch of sky, avoiding bright stars and extended galaxies. Over time, this has resulted in the deepest extant near-IR extragalactic survey field, with a 15 year baseline for time-domain studies in its shortest wavelength bandpasses. The field was also augmented with deep observations at other wavelengths from X-ray through far-infrared (Krick et al., 2009). The clean portion of the 20′ diameter IDF to the depths reached by JWST/NIRCam is much smaller, however, and of the order of no more than 7′, as can be seen in Fig. 6b.
Indeed, Fig. 3a shows that on scales of 14′, the IDF does not stand out as an optimal field for JWST. Fig. 5b emphasizes that, while (weighted) source penalties in 14′ diameter circular viewports are only slightly higher in the IDF than in the very best area selected for the JWST Time-Domain Field, the latter field can accommodate a deep JWST survey over a much wider area. Figs. 6a and 6b compare the TDF and IDF in a near-infrared color composite that directly shows the low densities of bright sources within and encroachment of bright sources around the perifery of the IDF, while the TDF has ample room to expand to the north, northeast, and west. For reference, the brightest star encroaching the IDF toward the north has = 7.69 mag, whereas the brightest star near the TDF toward the southeast has = 10.73 mag. Also when comparing the mean (median) 2 µm brightness of 2MASS-detected stars within the cleanest central areas ( 7′) of the IDF and TDF, we find that the TDF fares slightly better: = 16.17 (16.65) for the IDF versus 16.65 (16.92) mag for the TDF. The negative impact due to persistence effects on deep JWST surveys is therefore expected to be slightly reduced in the TDF compared to the IDF.
While well matched to the field of view of the Spitzer/IRAC detectors, the clean portion of the IDF is too small for our intended deep JWST imaging and slitless spectroscopic observations, which require a clean area of at least 14′ diameter.
3.4 The Promise of Parallel Observations
Parallel science observations with JWST were originally neither planned, nor permitted. In support of efficient on-orbit instrument calibration after launch, “parallel instrument calibrations” were, however, to be implemented (e.g., Gardner et al., 2006). In 2015, the JWST Project and STScI decided that parallel science observations ought to be implemented as well, in order to maximize the scientific return of JWST. This is especially important in view of the finite lifetime of JWST —as set by its finite supply of fuel for station keeping and momentum control— of 5 (required), 10 (expected), or at most 14 (goal) years, which is much shorter than that of HST (28 years and counting).
During most of its operational lifetime, the depth and areal efficiency of HST grism spectroscopic surveys has added valuable low-resolution spectra to many of the deepest HST imaging surveys, which was essential to measure the redshifts and characterize the properties of faint objects. Prime examples of such HST grism surveys are the Grism ACS Project for Extragalactic Science (GRAPES; e.g., Pirzkal et al., 2004; Pasquali et al., 2006), the ACS Probing Evolution and Reionization Spectroscopically (PEARS; e.g., Pirzkal et al., 2013; Straughn et al., 2008, 2009), the WFC3 grism survey (3DHST; e.g., Momcheva et al., 2016), the WFC3 Infrared Spectroscopic Parallel survey (WISP; e.g., Atek et al., 2010), the Grism Lens-Amplified Survey from Space (GLASS; e.g., Treu et al., 2015; Schmidt et al., 2014), and the Faint Infrared Grism Survey (FIGS; e.g., Pirzkal et al., 2017; Larson et al., 2018). We note that of these only WISP was an HST parallel survey. The others targeted areas with pre-existing deep imaging, and obtained grism spectroscopy with the primary instrument, while adding imaging parallels. Due to HST’s extraordinary longevity, grism spectroscopy and direct imaging surveys could be completed in a largely separate manner. For JWST, with its much shorter expected life-time, direct imaging and slitless grism spectra (NIRISS; especially for blind emission-line searches) or multi-object slit-spectra (NIRSpec; targeted spectroscopy to the faintest limits) must be done concurrently to the largest extent possible. Just like for HST, we expect that JWST NIRISS grism and NIRSpec multi-object spectroscopy will constitute an essential complement to NIRCam imaging observations to even fainter limits ( 27 mag). Since we anticipate that GO proposers will revisit the JWST NEP Time-Domain Field many times, the coordinates of even very faint objects will generally be known in time to allow targeted spectroscopy and imaging in parallel.
3.5 Estimated Source Counts and Number of Variable Objects in the JWST NEP Time-Domain Field
Deep HST observations can inform our expectations for the near-IR source counts within the JWST NEP TDF. To 29 mag, the HUDF 1.6 µm (H; as most representative of JWST) counts show 3.5105 objects per 0.5 mag interval per square degree (Fig. 12 of Windhorst et al. 2011). The 1.6 µm-counts over the 20 29 mag range show a sub-converging slope of 0.213 mag dex-1 (see also Driver et al., 2016). Therefore, the total integrated galaxy counts to 29 mag are expected to reach 1.79106 objects per deg2. The number of Galactic stars at the NEP to the same flux limits is only (0.4–0.9)104 per deg2 (Ryan et al., 2011; Ryan & Reid, 2016), which is still a 5–10 larger density of stars than seen in the HST surveys summarized by Windhorst et al. (2011) at high Galactic latitude.
Similarly, given typical faint radio source counts (Condon et al., 2012; Vernstrom et al., 2014; Windhorst et al., 1985, 1993; Hopkins et al., 2000), we expect that a VLA survey that reaches a depth of 5 (5) at 3 GHz would detect a total of 2.2104 sources per square degree. This calculation assumes that the normalized differential source count slope continues to be as steep as 1.7 at levels (Condon et al., 2012), and a spectral index between 3 and 1.4 GHz for these sources of about 0.4, following the trends seen at somewhat brighter levels between 1.4, 5.0, and 8.4 GHz (Windhorst et al., 1993). The models of Hopkins et al. (2000) indicate that somewhat more than half of the radio sources seen at levels will turn out to be starburst galaxies or vigorously star forming regions within galaxies, while the remainder are caused by weak AGN. The latter would appear as unresolved radio sources. The exact ratio of starbursts and AGN will of course await VLBA observations at levels and the HST + JWST images and grism spectra.
Both VLA 3 GHz and Chandra X-ray coverage will be available for the JWST NEP TDF, as well as significant partial coverage with JWST/NIRISS grism and HST UV–Visible imaging observations. If we consider the 153.9 arcmin2 and 71.8 arcmin2 areas of the full 14′ diameter JWST NEP TDF and of the footprint that will be sampled in our initial JWST NIRCam GTO observations (§ 4), then we estimate a total number of faint galaxies (stars) detected to 29 mag of 7.65104 (170–385) and 3.57104 (80–180), respectively. In the same JWST NEP TDF areas, we expect to detect a total of 940 and 440 faint 3 GHz radio sources to 5 , almost half of which will be weak radio-selected AGN.
In an optical search for weak AGN, Sarajedini et al. (2011) and Cohen et al. (2006) monitored faint galaxies at 0.5–4 with HST WFPC2 or ACS/WFC at visible (restframe UV) wavelengths on timescales of weeks to months (i.e., about a week to a month in the restframe at the median redshift of 2 of the sample). These studies find that on such timescales typically 1% of the faint optically selected galaxies at a given redshift shows significant evidence for variability in their cores (45 out of 4644 galaxies in the HUDF), about half of which are associated with either faint X-ray sources or mid-IR power-law emission (Sarajedini et al., 2011). That paper reports, moreover, that a quarter of X-ray selected AGN are optical variables, and that this percentage increases with decreasing hardness ratio of the X-ray emission. At radio wavelengths, Ofek & Frail (2011) found in a NVSS–FIRST comparison that 0.1% of the unconfused FIRST sources in a mJy sample were variable. (Oort & Windhorst, 1985) studied variability in a deeper sample of sub-mJy radio sources by comparing deep Westerbork and VLA maps of the same region in the Lynx 2 field on time-scales of a month to a year. They found that 2% of the sub-mJy sources showed variability on both timescales.
Conservatively, within the full JWST NEP TDF and within the GTO-sampled portion thereof, we therefore estimate 730 and 340 galaxies detected to 29 mag at rest-frame optical wavelengths to vary in repeat observations with JWST/NIRCam on time-scales of weeks to years. We expect at least 0.5% of the field galaxies in the same areas to be detected at levels with the VLA, and confirmed with VLBA observations to be AGN (i.e., 380 and 175 in total). Starburst dominated radio sources should be easily recognized from the 8-band JWST photometry and grism spectra, and are expected to appear resolved in the VLBA observations, at least partially resolved in the shorter-wavelength near-IR JWST filters, and mostly non-varying at radio and rest-frame visible–near-IR wavelengths, although a subset of dust-obscured ULIRGs may be found to vary at mid–far-IR wavelengths on time-scales of months to years due to their extremely high SN rates (Yan et al., 2018).
Since any variable emission from weak AGN comes from different regions around the accretion disk at radio, near–mid-IR, optical, and X-ray wavelengths, the exact fraction of variable objects at each of these wavelengths depends on the relative depth and time-sampling of each of these data sets and on the physical timescales involved in each of these wavelength regimes. With a sufficient number of epochs and sufficient depth from radio to X-rays, we hope that the JWST NEP TDF will provide the database to begin to address these questions, including how large a fraction of weak AGN (variable or not) are seen in common between the radio, near–mid-IR, optical, and X-ray studies.
4 Possible Implementations
Inspired by the very successful combination of HST direct imaging and grism spectroscopy, and in the spirit of the 3DHST, GRAPES, PEARS, FIGS, GLASS, and WISP HST grism surveys, we aim to find a JWST survey strategy that allows securing both primary NIRCam imaging and parallel NIRISS grism observations in the JWST NEP TDF as part of a single observing program, while maximizing both the overall survey area and the area of overlap between imaging and grism spectra. We consider two possible implementations —for the purpose of multi-wavelength 0.8–5.0 µm object characterization with or without a time-domain component—, with an eventual goal of contiguous coverage of an area of 153.9 arcmin2, the area of a circular field with a diameter of 14′.
4.1 A ‘Unit Visit’ of NIRCam and NIRISS Observations
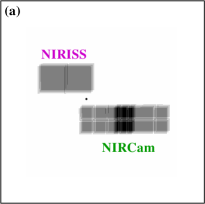
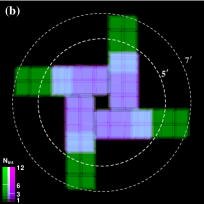
After some experimentation with notional layouts and with supported observation descriptions in APT, one natural pattern for a unit visit999With unit visit we mean a sequence of pointings and dithers executed within a single JWST visit for a specified set of optical elements. emerged: it results in two, offset, contiguous areas covered by NIRCam and NIRISS in parallel, and maximizes the potential overlap of the footprints of the two instruments. That pattern, shown in Fig. 7a, consists of a 2-point mosaic with a pointing offset approximately equal to the width of a NIRISS detector projected onto the sky, and is specified in APT as a 21 (columns rows) mosaic with an overlap of 57% of the two NIRCam footprints (i.e., both modules combined). In combination with a standard 3-point INTRAMODULE NIRCam dither at each mosaic pointing, this unit pattern will fill both the large intra-module gap and the small gaps between the four individual detectors in the SW channels of each NIRCam module. By specifying an offset of (1900, 1050), the unit pattern becomes rotationally symmetric around the desired nominal field center (indicated by the black dot in Fig. 7a), with maximal overlap between the NIRISS and NIRCam coverages after rotation over 180∘.
| Instrument | Depth | Area | Depth | Area | |
|---|---|---|---|---|---|
| [] | [arcmin2] | [] | [arcmin2] | ||
| NIRCam | 1a | 2.240 | 0 | 18.335 | |
| 2 | 3.951 | 1 | 16.095 | ||
| 3b | 8.524 | 2c | 12.145 | ||
| 4 | 0.926 | 3 | 3.621 | ||
| 5 | 1.416 | 4 | 2.695 | ||
| 6 | 1.279 | 5 | 1.279 | ||
| NIRISS | 1a | 1.666 | 0 | 11.580 | |
| 2 | 1.572 | 1 | 9.914 | ||
| 3b | 8.212 | 2c | 8.342 | ||
| 4 | 0.130 | 3 | 0.130 |
Notes: (a) at single-exposure depth, some unrecoverable image defects will persist, and the PSF will be poorly sampled; (b) nominal, 3-dither depth is reached; (c) nominal depth is reached or exceeded.
This unit pattern also results in an area of overlap between the coverage of NIRCam Modules A and B (3.6 arcmin2), with an effective exposure time up to twice the nominal one (see Table. 1 and the dark shaded region in Fig. 7a). This overlap allows photometric and astrometric cross-calibration between the two modules, verification of systematics near the detection limit in areas with nominal depth, as well as time-domain sampling on time-scales of 0.4–1.0 hr (assuming a medium-deep NIRCam imaging survey to 29 mag in 8 filters with coordinated parallel NIRISS grism observations, and all the operational constraints imposed by the observatory). An additional benefit as originally envisioned was that this pattern would provide repeat sampling on time-scales of several hours for the area of overlap between the two NIRCam modules. This required cycling through each of the filters at a given pointing before executing the offset in the mosaic. Overriding concerns for the longevity of the (large) NIRCam filter wheels, however, disallow such cycling and force all pointing offsets in a visit to be executed before moving to the next filter.
4.2 An IDS GTO Program to Start Object Characterization and Time-Domain Monitoring of the JWST NEP TDF
Building on this unit visit pattern, program GTO-1176 (PI: R. Windhorst) will map an area of 71.8 arcmin2 in the JWST NEP TDF in 8 filters that span the 0.8–5.0 µm wavelength range of NIRCam. The nominal 3-dither depth of 29 mag (5 ) is met or exceeded for a total area of 49.3 arcmin2. The GTO coverage, shown in Fig. 7b, consists of four distinct “spokes”, each oriented 90∘ apart, and is charged 47 hrs (411.7 hrs) of calendar time. Since the JWST CVZs are the only place in the sky where JWST can revisit a target with an aperture orientation rotated over 180∘ with respect to a prior visit — without a significant penalty in the form of an increased Zodiacal foreground brightness —, this is the only place in the sky where coordinated parallel observations with a second instrument (e.g., NIRISS, MIRI) can be made to almost fully overlap such prior NIRCam observations, and vice versa. For the Windhorst IDS GTO program, the combination of 1.8–2.2 µm NIRISS wide-field slitless spectroscopy and NIRCam imaging for the purpose of source characterization was deemed particularly powerful. The areas where NIRISS and NIRCam coverage overlap appear in light blue to purplish hues within the white dashed inner circle of radius 5′ in Fig. 7b. The direct images bracketing the dispersed NIRISS grism exposures reach to 29 mag as well, and allow time-domain monitoring of an area of 45.0 arcmin2 (of which 33.6 arcmin2 at nominal depth or better) on time-scales of 180 days when compared to the corresponding NIRCam 2.0 µm images.
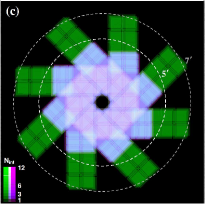
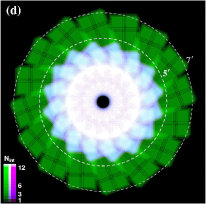
GO extensions of the GTO pattern with an additional four spokes with the pattern rotated over 45∘, as shown in Fig. 7c, would cover 114.4 arcmin2, while a further eight spokes at orientations of PA = 22.5∘ (Fig. 7d) would approach our 153.9 arcmin2 goal. Such extensions with similar pairs of spokes will not only increase the total areal coverage, but also the area sampled at multiple epochs with increasingly dense time-domain sampling. Furthermore, assuming NIRISS is used in parallel to NIRCam for grism spectroscopy also in such GO programs, the number of distinct orientations aids in disentangling spectra contaminated by signal from neighboring objects within the field of view (e.g., Ryan et al., 2018).
Once source characterization is available, the same unit visit pattern can be used for efficient time-domain monitoring (to the same flux limits) of sources that either move or vary in brightness. For monitoring, one would need only one SW (e.g., F200W) and one LW (e.g., F356W) NIRCam filter, observed simultaneously, and direct imaging (e.g., F200W) with NIRISS in parallel.
4.3 Efficient Areal Mapping for Object Characterization
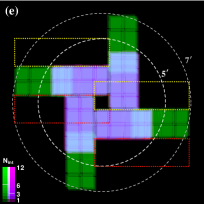
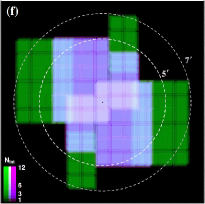
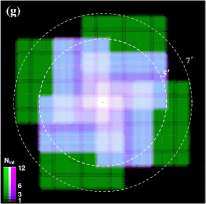
When object characterization and time-domain monitoring are considered as two entirely separate goals, an alternative, more efficient design using the same unit visit pattern is possible for object characterization. It can cover 150–155 arcmin2 in the JWST NEP TDF in 8 NIRCam filters to the same depth of 29 mag, with the same parallel NIRISS 1.8–2.2 µm grism spectroscopy and F200W direct imaging. This design is illustrated in Fig. 7e–g. Whereas the survey strategy of § 4.2 (Fig. 7b–d) rotates the pattern to leverage the year-round accessibility of the field for time-domain science, it leaves a hole in the coverage at the nominal field center. An approach using offsets with respect to the spokes of GTO-1176, and more constrained scheduling —either within a few days from the GTO visits, or a full year later— could cover a contiguous area that is nearly equivalent to the 153.9 arcmin2 of a circular area with a diameter of 14′, while leaving no such hole. In fact, the central 0.5, 4.2, and 26.3 arcmin2 would be sampled at 4, 3, and 2 times the nominal depth, respectively. The coverage shown in Fig. 7g would require (APT25.4.4) under 93 hrs of calendar time in addition to the GTO observations (as compared to an additional 141 hrs for the coverage of Fig. 7d).
While the main aim of this design is to secure source characterization in the NEP TDF early-on in the JWST mission, even here there are significant areas of overlap between the offset spokes that would provide time-domain sampling on time-scales of 3 days and of multiples of 90 days (up to 1 yr).
5 Summary
We described the selection of a new extragalactic survey field optimized for time-domain science with JWST. It is located within JWST’s northern continuous viewing zone and is centered at (RA, Dec)J2000 = (17:22:47.896, +65:49:21.54). This JWST North Ecliptic Pole (NEP) Time-Domain Field (TDF) is the only 14′ diameter area where JWST can observe a clean extragalactic survey field at any time of the year and at arbitrary orientation, while leveraging JWST’s capability to perform parallel science observations. The NEP TDF will be targeted by JWST GTO program 1176, has a rich and growing complement of multi-wavelength ancillary ground- and space-based observations, and has an unmatched potential as a JWST time-domain community field. We estimated the number of sources expected to be detectable to 29 mag with JWST in the near-IR and to flux levels in deep VLA 3–5 GHz radio observations, as well as the subsets thereof expected to show significant variability. Last, we presented an efficient unit visit, comprising primary NIRCam imaging and parallel NIRISS slitless grism spectroscopy, with which observing programs can be designed for wide-area source characterization and time-domain monitoring. We encourage JWST GO proposers to adopt this efficient mode of observations for future JWST cycles, and hope that the NEP TDF will become one of JWST’s community fields.
This research has made use of NASA’s Astrophysics Data System (ADS) bibliographic services (Kurtz et al., 2000).
References
- Artigau et al. (2009) Artigau, É., Bouchard, S., Doyon, R., & Lafrenière, D. 2009, ApJ 701, 1534
- Ashcraft et al. (2018) Ashcraft, T.A., Windhorst, R.A., Jansen, R.A., et al. 2018, PASP 130, 064102
- Atek et al. (2010) Atek, H., Malkan, M., McCarthy, P., et al. 2010, ApJ 723, 104
- Benítez et al. (2014) Benítez, N., Dupke, R., Moles, R., et al. 2014, J-PAS: The Javalambre - Physics of the Accelerated Universe Astrophysical Survey “Red Book”, arXiv:1403.5237
- Bertin & Arnouts (1996) Bertin, E., & Arnouts, S. 1996, A&AS 117, 393
- Buenzli et al. (2014) Buenzli, E., Apai, D., Radigan, J. et al. 2014, ApJ 782, 77
- Catalán et al. (2013) Catalán, S., Napiwotzki, R., Hodgkin, S., et al. 2013, ASP Conf. Ser. 469, 235
- Cohen et al. (2006) Cohen, S.H., Ryan, R.E., Jr., Straughn, A.N., et al. 2006, ApJ 639, 731
- Condon et al. (2012) Condon, J.J., Cotton, W.D., Fomalont, E.B., et al. 2012, ApJ 758, 23
- Condon et al. (1998) Condon, J.J., Cotton, W.D., Greisen, E.W., et al. 1998, AJ 115, 1693
- Driver et al. (2016) Driver, S.P., Andrews, S.K., Davies, L.J., et al. 2016, ApJ 827, 108
- Fazio et al. (2004) Fazio, G.G., Hora, J.L., Allen, L.E., et al. 2004, ApJS 154, 10
- Gal-Yam (2012) Gal-Yam, A. 2012, Science 337, 927
- Gardner et al. (2006) Gardner, J.P., Mather, J.C., Clampin, M., et al. 2006, Space Science Reviews 123, 485
- Gehrels et al. (2015) Gehrels, N., Spergel, D., and the WFIRST SDT and Project 2015, J.Ph.Conf.Ser. 610, 012007
- Graur et al. (2014) Graur, O., Rodney, S.A., Maoz, D., et al. 2014, ApJ 783, 28
- Greene et al. (2012) Greene, T., Beichman, C., Gully-Santiago, M., et al. 2010, Proc. SPIE 7731, 0C
- Grogin et al. (2011) Grogin, N.A., Kocevski, D.D., Faber, S.M., et al. 2011, ApJS 197, 35
- Harris et al. (2006) Harris, H.C., Munn, J.A., Kilic, M. et al. 2006, AJ 131, 571
- Hewett & Wild (2010) Hewett, P.C., & Wild, V. 2010, MNRAS 405, 2302
- Hopkins et al. (2000) Hopkins, A., Windhorst, R.A., Cram, L., & Ekers, R. 2000, ExA 10, 419
- Horner & Rieke (2004) Horner, S., Rieke, M., and the NIRCam Team 2004, Proc. SPIE 5487, 628
- Ivezić (2014) Ivezić, Ž. 2014, AAS 223, 31703
- Jacob et al. (2009) Jacob, J.C., Katz, D.S., Berriman, G.B., et al. 2009, IJCSE, Vol.4 (No.2), 1
- Jansen et al. (2017a) Jansen, R.A., Windhorst, R., Alpaslan, M., et al. 2017a, AAS 229, 438.04
- Jansen et al. (2017b) Jansen, R.A., and the Webb Medium Deep Fields IDS GTO Team, the NEPTDS-VLA/VLBA Team, and the NEPTDS-Chandra Team 2017b, AAS 230, 216.02
- Jansen et al. (2018a) Jansen, R.A., Windhorst, R.A., Grogin, N.A., et al. 2018a, AAS 231, 354.14
- Jarrett et al. (2013) Jarrett, T.H., Masci, F., Tsai, C.W., et al. 2013, AJ 145, 6
- Joye & Mandel (2003) Joye, W.A., & Mandel, E. 2003, in: ‘Astronomical Data Analysis Software and Systems XII’, eds. H.E. Payne, R.I. Jedrezejewski, & R.N. Hook, ASP Conf. Ser. 295, 489
- Kaiser et al. (2002) Kaiser, N., Aussel, H., Burke, B.E., et al. 2002, Proc. SPIE 4836, 154
- Kalirai (2018) Kalirai, J.S. 2018, Contemp. Phys., 59, 251
- Kelsall et al. (1998) Kelsall, T., Weiland, J.L., Franz, B.A., et al. 1998, ApJ 508, 44
- Koekemoer et al. (2011) Koekemoer, A.M., Faber, S.M., Ferguson, H.C., et al. 2011, ApJS 197, 36
- Kovalev et al. (2007) Kovalev, Y.Y., Petrov, L., Fomalont, E.B., & Gordon, D. 2007, AJ 133, 1236
- Krick et al. (2009) Krick, J.E., Surace, J.A., Thompson, D., et al. 2009, ApJS 185, 85
- Kurtz et al. (2000) Kurtz, M.J., Eichhorn, G., Accomazzi, A., Grant, C.S., & Murray, S.S. 2000, A&AS 143, 41
- Laity et al. (2005) Laity, A.C., Anagnostou, N., Berriman, B., et al. 2005, in: ‘Astronomical Data Analysis Software and Systems XIV’, eds. P. Shopbell, M. Britton, & R. Ebert, ASP Conf. Ser. 347, 34
- Lang (2014) Lang, D. 2014, AJ 147, 108
- Larson et al. (2018) Larson, R.L., Finkelstein, S.L., Pirzkal, N., et al. 2018, ApJ 858, 94
- Laureijs et al. (2010) Laureijs, R.J., Duvet, L., Escudero Sanz, I., et al. 2010, Proc. SPIE 7731, 1H
- Leisenring et al. (2016) Leisenring, J.M., Rieke, M., Misselt, K., & Robberto, M. 2016, Proc. SPIE 9915, 2N
- Lightsey et al. (2014) Lightsey, P.A., Wei, Z., Skelton, D.L., et al. 2014, Proc. SPIE 9143, 3P
- Lightsey (2016) Lightsey, P.A. 2016, Proc. SPIE 9904, 0A
- LSST Science Collaboration et al. (2017) LSST Science Collaboration, Marshall, P., Anguita, T., et al. 2017, arXiv:1708.04058
- Luu & Jewitt (1998) Luu, J.X., & Jewitt, D. 1998, ApJ 502, L91
- MacLeod et al. (2011) MacLeod, C.L., Brooks, K., Ivezić, Ž., et al. 2011, ApJ 728, 26
- Mainzer et al. (2011) Mainzer, A., Bauer, J., Grav, T., et al. 2011, ApJ 731, 53
- Mesinger et al. (2006) Mesinger, A., Johnson, B.D., & Haiman, Z. 2006, ApJ 637, 80
- Momcheva et al. (2016) Momcheva, I.G., Brammer, G.B., van Dokkum, P.G., et al. 2016, ApJS 225, 27
- Nicholl et al. (2013) Nicholl, M., Smartt, S.J., Jerkstrand, A., et al. 2013, Nature 502, 346
- Ofek & Frail (2011) Ofek, E.O., & Frail, D.A. 2011, ApJ 737, 45
- Oort (1950) Oort, J.H. 1950, BAN 11, 91
- Oort & Windhorst (1985) Oort, M.J.A., & Windhorst, R.A. 1985, A&A 145, 405
- Pan, Kasen, & Loeb (2012) Pan, T., Kasen, D., & Loeb, A., 2012, MNRAS 422, 2701
- Pasquali et al. (2006) Pasquali, A., Ferreras, I., Panagia, N., et al. 2006, ApJ 636, 115
- Petit et al. (2017) Petit, J.-M., Kavelaars, J.J., Gladman, B.J., et al. 2017, AJ, 153, 236
- Pirzkal et al. (2004) Pirzkal, N., Xu, C., Malhotra, S., et al. 2004, ApJS 154, 501
- Pirzkal et al. (2013) Pirzkal, N., Rothberg, B., Ly, C., et al. 2013, ApJ 772, 48
- Pirzkal et al. (2017) Pirzkal, N., Malhotra, S., Ryan, R.E., et al. 2017, ApJ 846, 84
- Pontoppidan et al. (2016) Pontoppidan, K.M., Pickering, T.M., Laidler, V.G., et al. 2016, Proc. SPIE 9910, 16
- Radigan et al. (2014) Radigan, J., Lafrenière, D., Jayawardhana, R., & Artigau, É. 2014, ApJ 793, 75
- Rajan et al. (2015) Rajan, A., Patience, J., Wilson, P.A., et al. 2015, MNRAS 448, 3375
- Rieke et al. (2005) Rieke, M.J., Kelly, D.M., & Horner, S.D. 2005, Proc. SPIE 590401
- Rodney et al. (2014) Rodney, S.A., Riess, A.G., Strolger, L-G., et al. 2014, AJ 148, 13
- Rodney et al. (2015b) Rodney, S.A., Riess, A.G., Scolnic, D.M., et al. 2015b, AJ 150, 156
- Ryan et al. (2011) Ryan, R.E., Jr., Thorman, P.A., Yan, H., et al. 2011, ApJ 739, 83
- Ryan & Reid (2016) Ryan, R.E., Jr., & Reid, I.N. 2016, AJ 151, 92
- Ryan et al. (2018) Ryan, R.E., Jr., Casertano, S., & Pirzkal, N. 2018, PASP 130, 034501
- Sarajedini et al. (2011) Sarajedini, V.L., Koo, D.C., Klesman, A.J., et al. 2011, ApJ 731, 97
- Schlafly & Finkbeiner (2011) Schlafly, E.F., & Finkbeiner, D.P. 2011, ApJ 737, 103
- Schlegel et al. (1998) Schlegel, D., Finkbeiner, D., & Davis, M. 1998, ApJ 500, 525
- Schmidt et al. (2014) Schmidt, K.B., Treu, T., Brammer, G.B., et al. 2014, ApJ 782, L36
- Schwamb et al. (2010) Schwamb, M.E., Brown, M.E., Rabinowitz, D.L., & Ragozzine, D. 2010, ApJ, 720, 1691
- Shankman et al. (2016) Shankman, C., Kavelaars, J.J., Gladman, B.J., et al. 2016, AJ, 151, 31
- Skrutskie et al. (2006) Skrutskie, M.F., Cutri, R.M., Stiening, R., et al. 2006, AJ 131, 1163
- Straughn et al. (2008) Straughn, A.N., Meurer, G.R., Pirzkal, N., et al. 2008, AJ 135, 1624
- Straughn et al. (2009) Straughn, A.N., Pirzkal, N., Meurer, G.R., et al. 2009, AJ 138, 1022
- Strolger et al. (2015) Strolger, L.-G., Dahlen, T., Rodney, S.A., et al. 2015, ApJ 813, 93
- Tody (1986) Tody, D. 1986, Proc. SPIE 627, 733
- Tody (1993) Tody, D. 1993, in “Astronomical Data Analysis Software and Systems II”, eds. R.J. Hanisch, R.J.V. Brissenden, & J. Barnes, ASP Conf. Ser. 52, 173
- Treu et al. (2015) Treu, T., Schmidt, K.B., Brammer, G.B., et al. 2015, ApJ 812, 114
- Trujillo et al. (2005) Trujillo, C.A., Brown, M.E., Rabinowitz, D.L., & Geballe, T.R. 2005, ApJ 627, 1057
- Tyson (2002) Tyson, J.A. 2002, Proc. SPIE 4836, 10
- Vernstrom et al. (2014) Vernstrom, T., Scott, D., Wall, J.V., et al. 2014, MNRAS 440, 2791
- Werner et al. (2004) Werner, M.W., Roellig, T.L., Low, F.J., et al. 2004, ApJS 154, 1
- Whalen et al. (2013) Whalen, D.J., Even, W., Lovekin, C.C., et al. 2013, ApJ 768, 195
- Whalen et al. (2014) Whalen, D.J., Smidt, J., Heger, A., et al. 2014, ApJ 797, 9
- Windhorst et al. (1985) Windhorst, R.A., Miley, G.K., Owen, F.N., Kron, R.G., & Koo, D.C. 1985, ApJ 289, 494
- Windhorst et al. (1993) Windhorst, R.A., Fomalont, E.B., Partridge, R.B., & Lowenthal, J.D. 1993, ApJ 405, 498
- Windhorst et al. (2011) Windhorst, R.A., Cohen, S.H., Hathi, N.P., et al. 2011, ApJS 193, 27
- Windhorst et al. (2018) Windhorst, R.A., Timmes, F.X., Wyithe, J.S.B., et al. 2018, ApJS 234, 41
- Wright et al. (2010) Wright, E.L., Eisenhardt, P.R.M., Mainzer, A.K., et al. 2010, AJ 140, 1868
- Yan et al. (2018) Yan, H., Ma, Z., Beacom, J.F., & Runge, J. 2018, ApJ (in press; arXiv:1808.01780)
- York et al. (2000) York, D.G., Adelman, J., Anderson, J.E. Jr., et al. 2000, AJ 120, 1579